potential of above- and below-ground ... - epub bayreuth · potential of above- and below-ground...
TRANSCRIPT

Potential of above- and below-groundcoarse woody debris as a carbon sink in
managed and unmanaged forests
Dissertation zur Erlangung des akademischen Grades eines
Doktors der Naturwissenschaften- Dr. rer. nat. -
− vorgelegt der
Fakultät für Biologie / Chemie / Geowissenschaftender Universität Bayreuth
von Inken KrügerGeboren am 25.07.1986 in Göttingen
Bayreuth, April 2013

Die vorliegende Arbeit wurde von Oktober 2009 bis April 2013 unter Leitung von PD Dr. Werner
Borken am Lehrstuhl für Bodenökologie der Universität Bayreuth angefertigt. Die Untersuchungen
waren teil des LWF Projekts KLIP 23 und wurden vom Bayerischen Staatsministerium für
Ernährung, Landwirtschaft und Forsten finanziert.
Vollständiger Abdruck der von der Fakultät für Biologie, Chemie und Geowissenschaften der
Universtät Bayreuth genehmigten Dissertation zur Erlangung des akademischen Grades eines
Doktors der Naturwissenschaften (Dr. rer. nat.).
Dissertation eingereicht am: 08.04.2013
Zulassung durch die Prüfungskommission: 17.04.2013
Wissenschaftliches Kolloquium: 17.07.2013
Amtierender Dekan: Prof. Dr. Beate Lohnert
Prüfungsausschuss:
PD Dr. Werner Borken (Erstgutachter)
PD Dr. Gregor Aas (Zweitgutachter)
Prof. Dr. Christiane Werner Pinto (Vorsitz)
Prof. Dr. Bernd Huwe
Prof. Dr. Gerhard Gebauer

All that is gold does not glitter, Not all those who wander are lost; The old that is strong does not wither, Deep roots are not reached by the frost.
JRR Tolkien

ContentsAcknowledgments.................................................................................................................................IGlossary..............................................................................................................................................IIISummary.............................................................................................................................................IVZusammenfassung.............................................................................................................................VII
Chapter 1Introduction..........................................................................................................................................2
Motivation........................................................................................................................................2Forests as carbon stocks...................................................................................................................2Land use change and forest management.........................................................................................2Coarse woody debris as a carbon stock...........................................................................................3Forests as nitrogen stocks................................................................................................................6
Objectives.............................................................................................................................................7Material and Methods...........................................................................................................................8
Study sites........................................................................................................................................8Grübel..........................................................................................................................................8Ludwigshain................................................................................................................................9Rohrberg......................................................................................................................................9Waldstein...................................................................................................................................10
General concept and field sampling...............................................................................................10Above-ground coarse woody debris inventory..........................................................................10Below-ground coarse woody debris inventory..........................................................................12Soil sampling.............................................................................................................................12
Sample preparation and analysis....................................................................................................13Decay of woody debris under laboratory conditions.................................................................13Density fractionation.................................................................................................................13Radiocarbon analysis.................................................................................................................14Modelling of soil organic carbon turnover in the forest floor and the mineral soil..................14
Synthesis and discussion of results.....................................................................................................15Properties of above-ground coarse woody debris..........................................................................15Properties of below-ground coarse woody debris..........................................................................17Above-ground coarse woody debris decay....................................................................................17Below-ground coarse woody debris decay.....................................................................................20Coarse woody debris carbon stocks...............................................................................................20Influence of coarse woody debris on soil organic carbon stocks ..................................................21Total carbon stocks........................................................................................................................22Coarse woody debris nitrogen stocks.............................................................................................23Influence of coarse woody debris on soil nitrogen stocks.............................................................24Soil organic carbon turnover in the forest floor.............................................................................25Soil organic carbon turnover in the mineral soil............................................................................26
Conclusions........................................................................................................................................28Record of contributions to this thesis.................................................................................................30References..........................................................................................................................................31
Chapter 2Age determination of coarse woody debris with radiocarbon analysis and dendrochronological cross-dating.........................................................................................................................................43Abstract...............................................................................................................................................43
Introduction........................................................................................................................................44Material and methods.........................................................................................................................45
Study sites......................................................................................................................................45Sampling procedures .....................................................................................................................45Radiocarbon dating........................................................................................................................46Dendrochronological cross-dating.................................................................................................47Data analysis .................................................................................................................................48
Results................................................................................................................................................48Properties of cellulose and radiocarbon dating..............................................................................48Dendrochronological cross-dating.................................................................................................49Comparison of radiocarbon and dendrochronological dating........................................................50
Discussion..........................................................................................................................................53Properties of cellulose and constraints of radiocarbon analysis.....................................................53Constraints of dendrochronological cross-dating..........................................................................54Comparison of analysis methods and coarse woody debris carbon density...................................55
Conclusions........................................................................................................................................56Acknowledgments..............................................................................................................................56References .........................................................................................................................................57
Chapter 3Effects of tree species and decay class on DOC and CO2 production of woody debris.....................62Abstract...............................................................................................................................................62Introduction........................................................................................................................................63Materials and methods........................................................................................................................65
Study sites and sample preparation................................................................................................65Incubation and analysis..................................................................................................................67Statistical analysis..........................................................................................................................68
Results................................................................................................................................................68Tree species and decay class effects on CO2 production................................................................68Tree species and decay class effects on DOC production..............................................................68Qualitative DOC parameters..........................................................................................................72Effects of glucose addition on DOC and CO2 production.............................................................73
Discussion...........................................................................................................................................75Tree species effects on total carbon loss, CO2 and DOC production.............................................75Decay class effects on DOC and CO2 production..........................................................................76Qualitative DOC parameters..........................................................................................................77Effects of glucose on DOC and CO2 production............................................................................78
Conclusions........................................................................................................................................78Acknowledgments..............................................................................................................................79References..........................................................................................................................................80
Chapter 4Carbon stocks and turnover of coarse woody debris and soil in three managed and unmanaged temperate forests.................................................................................................................................86Abstract...............................................................................................................................................86Introduction........................................................................................................................................87Material and methods.........................................................................................................................88
Study sites and general concept.....................................................................................................88Above-ground coarse woody debris inventory..............................................................................89Accumulation and disappearance time of coarse woody debris....................................................90Soil sampling.................................................................................................................................91

Density fractionation......................................................................................................................91Chemical analysis..........................................................................................................................91Calculation of turnover time..........................................................................................................92Statistical analysis..........................................................................................................................92
Results................................................................................................................................................93Carbon stocks of above-ground coarse woody debris....................................................................93Carbon stocks of forest floor and mineral soil...............................................................................97Turnover times of carbon in the forest floor .................................................................................98Turnover times of carbon in the mineral soil...............................................................................103
Discussion.........................................................................................................................................108Stocks and turnover of coarse woody debris...............................................................................108Carbon stocks of the forest floor and mineral soil.......................................................................109Radiocarbon signatures and carbon turnover in the forest floor..................................................110Radiocarbon signatures and carbon turnover in the mineral soil.................................................111
Acknowledgments.............................................................................................................................111References.........................................................................................................................................113Supplemental Information................................................................................................................120
Radiocarbon signature of coarse woody debris...........................................................................120Radiocarbon signature and turnover of carbon in the Oi horizon................................................122Radiocarbon signature, inputs and stocks of fine woody debris..................................................122Turnover of carbon in the Oe horizon (Grübel and Rohrberg) and the mixed Oe/Oa horizon (Ludwigshain)..............................................................................................................................123Turnover of carbon in the Oa horizon (Grübel and Rohrberg)....................................................124Turnover of carbon in the mineral soil.........................................................................................124References....................................................................................................................................125
Declaration/Erklärung ......................................................................................................................126

AcknowledgmentsA lot of people were involved in the completion of this thesis and I'd like to express my thanks to all
of them. Some people deserve special mention:
•Werner Borken, my advisor, for offering me this thesis as well as many opportunities,
informative discussions, suggestions and criticism.
•Christoph Schulz, who despite the distance, was always there to offer encouragement
and help when needed.
•Egbert Matzner for offering me a place to work and for managing the Department of
Soil Ecology.
•Helga Hertel-Kolb for the enormous help with sample preparation and CO2
measurements as well as her invaluable aid with (sometimes spontanous) field work.
•Uwe Hell for the immense support in the field and for always providing creative
solution when technical problems arose.
•Jan Muhr for organizing my stays in Jena and for many fruitful discussions.
•Xiaomei Xu and everyone else at the UC Irvine for measuring the radiocarbon
samples and for answering many questions in person and in emails.
•Heike Machts and Axel Steinhof for introducing me to the technique of cellulose
extraction and the enjoyable time in Jena.
•Claudia Hartl-Meier and Andreas Rothe for helpful advice on dendrochronological
cross-dating and for the pleasant stay in Freising.
•Steve Wunderlich for taking the time to introduce me to the graphitisation line and
for answering many questions.
•Petra Eckert for helping with the preparation of radiocarbon samples and
miscellaneous other measurements.
•Inge Vogler for taking all administrative work off my shoulders and for knowing the
answer to any organisational question.
•All members of the Department of Soil Ecology for scientific and non-scientific
discussions, encouragements, support and the pleasant working atmosphere.
•Alfred Schubert for providing material and advice for the soil inventorying.
•All menbers of the ZAN for conducting many of my measurements and for letting me
use their laboratory equipment when needed.
I

•Gerhard Küfner and Gerhard Müller for the technical help and their understanding for
my huge sample storage needs.
•Barbara Breunig, Caroline Stöhr and Felix Klein for their help with field work.
•R. Hayden, R. Süß and V. Zankl, the forest rangers, for letting me work in their
forests and for providing information whenever necessary.
•The conservation agencies of Lower Bavaria and Lower Franconia for granting me
permission to work in protected forests.
•My parents for collecting hard copies of JGR over many years and providing papers
on multiple occasions.
II

Glossarya.s.l. Above sea level, corresponds to German NN (über Normalnull)
AMS Accelerator mass spectrometry
C Carbon
C density Carbon content of coarse woody debris per volume unit
CWD Coarse woody debris, defined as all lying and standing woody debris with a
diameter > 7 cm at their widest point
DC Decay class
Disappearance time Time period between death and decay of tree or branch to fractions < 7 cm in
diameter
DOC Dissolved organic carbon
DOM Dissolved organic matter
EPS Expressed population signal
Fm Fraction modern
FWD Fine woody debris, defined as all woody debris with a diameter 0.2 <x< 7 cm
fPOM Free particulate organic matter (ρ < 1.6 g cm-3)
GC Gas-chromatography
Glk Gleichläufigkeit
HIX Humification index
IAEA International Atomic Energy Agency
MaOM Mineral associated organic matter (ρ > 2.0 g cm-3)
N Nitrogen
NPOC Non-purgable organic carbon
NSC Non-structural carbohydrates
oPOM Occluded particulate organic matter (1.6 < ρ < 2.0 g cm-3)
Rbar Mean inter series correlation
SOC Soil organic carbon
SOM Soil organic matter
SPT Sodium polytungstate
SUVA254 Specific UV-absorption at a wavelength of 254 nm
TT Turnover time
III

SummaryWith respect to climate warming, carbon (C) sequestration is of important public and political
interest. Forests represent important terrestrial C sinks. Their management can have direct and
indirect influence on forest characteristics, including to some extent C sequestration. One direct
effect of forest management is an increase in the stock of coarse woody debris (CWD). CWD
represents a short- to middle term C sink that is of particular importance in natural and old-growth
forests. Its impact on the soil organic carbon (SOC) stock is largely unknown.
To investigate the impact of management, a case study was conducted in three adjacent managed
and unmanaged forests with similar geological and micrometeorological conditions as well as
similar tree species composition. In each forest, the C pools of the forest floor, the mineral soil and
the CWD as well as their turnover times (TTs) or disappearance times (in case of CWD) were
investigated. The unmanaged forests were withdrawn from management 40-100 years ago. The
dominant tree species of temperate forests, European beech, Sessile oak and Norway spruce were
considered. The experimental set-up permits to estimate how the C pools of a forest evolve within
decades following its withdrawal from forest management.
In each forest, the above-ground CWD stocks were inventoried. The volume and the decay class of
each CWD piece was determined on an area of 1 ha. For each decay class, a representative number
of samples of logs was sampled to measure wood density and C concentration. In addition,
radiocarbon analysis and dendrochronological cross-dating were used to determine the time of tree
death for CWD logs. From these data, disappearance times were calculated for the three tree
species.
In the unmanaged forests, the C stocks in the CWD accumulated to 10 Mg ha-1 in the spruce forest
and to 24 – 30 Mg C ha-1 in the beech-oak forests. As such, the C stock in the CWD was 2 to 6
times greater in the unmanaged forests than in the managed forests where the C stocks in the CWD
were around 5 Mg C ha-1 at all study sites. Average disappearance times of 30 and 70 years were
calculated for beech and spruce CWD respectively. Oak CWD yielded a great variability of time
since tree death at similar C densities of individual CWD pieces. The calculation of a decay function
was thus not possible. However, the time since tree death of the dated oak CWD pieces indicated
that oak CWD has the potential to remain in forests for more than 70 years.
In addition to the field study, CWD samples of the three tree species and of three decay classes were
incubated in a laboratory experiment under controlled conditions for a period of 380 days. In regular
intervals, the CO2 production was measured and a leachate was produced to estimate the C fluxes
IV
from CWD in the gaseous and in the liquid phase.
The yearly C loss was specific to the tree species and decay class. Beech CWD had the greatest C
loss followed by oak and by spruce CWD. C loss generally increased with decay class for all tree
species. The CO2 release represented the most important pathway of C loss, however, dissolved
organic C (DOC) contributed between 1 and 25% of the total C loss. The DOC production was most
important for oak CWD and for heavily decayed wood of all tree species.
The C stock of below-ground CWD was estimated by uncovering stumps of known age. For each
tree species, five stumps were sampled in their entity for two or three different times of tree death.
Total mass and volume as well as C concentration of a representative number of sub-samples were
measured.
The great differences in volume, wood density and C concentration expressed the variability in the
properties of below-ground CWD. For this reason, a calculation of the below-ground CWD mass in
relation to the stump diameter was not possible. The number of stumps and snags was multiplied by
an average C mass per stump to calculate below-ground CWD stocks. As a result of regular thinning
and felling of trees and the resulting higher number of stumps, the below-ground CWD stocks in the
managed forests were greater than in the unmanaged forests. The C stocks in the below-ground
CWD ranged from 0.3 to 1.4 Mg C ha-1 in the managed and from 0.1 to 0.4 Mg C ha-1 in the
unmanaged forest in one of the beech-oak forest. This corresponded to 16 % of the total CWD C
stock in the managed forest and to 1 % of the total CWD C stock in the unmanaged forest.
Soil samples were taken at 30 points on a regular raster plot on an area of 2 ha. The forest floor
samples were separated by horizon in the field. The mineral soil was sampled up to a soil depth of
100 cm and separated by depth into 4 sub-samples. Of each sample, the organic C concentration was
measured. Density fractionation in three fractions (<1.6 g cm-3, 1.6-2.0 g cm-3, >2 g cm-3) was
carried out for one mixed sample of each soil depth. Radiocarbon signatures were measured of the
mixed samples as well as of each fraction.
The SOC stocks showed greater differences among the study sites than between the management
forms. The SOC stocks ranged between 4.3 and 15.9 Mg C ha-1 in the forest floor and between 50 –
260 Mg C ha-1 in the mineral soil down to a depth of 1 m. At all study sites, the radiocarbon
signatures of the Oe horizon indicated a shorter TT of SOC in the unmanaged than in the managed
forests. The difference is attributed to a change in the decomposing community induced by the
enhanced CWD stocks. Differences between managed and unmanaged forests in TT of SOC in the
Oa horizon and the bulk mineral soil were not consistent across all study sites. Either potential
management influences are overshadowed by other effects or the time since withdrawal from
V

management is not sufficient to result in significant changes. Of the density fractions, only the light
fraction <1.6 g cm-3 exhibited consistent differences across soil depths between management forms.
No consistent patterns were found for the denser fractions.
In dependence of tree species, CWD has the potential to substantially contribute to the C stocks of
forest ecosystems. A withdrawal from management results in a significant increase in the CWD
stocks within decades. However, SOC stocks did not increase as a result of enhanced CWD C
stocks. A potentially greater input of C from CWD to the forest floor was compensated by a shorter
TT of SOC in the Oe horizon. CWD and forest management had no effect on the SOC stocks or TT
of the mineral soil. Most C from CWD is probably lost to the atmosphere as CO2 before it reaches
the soil.
VI

ZusammenfassungIn Hinblick auf die Klimaerwärmung ist das Verständnis des globalen Kohlenstoffkreislaufes und
Kenntnis über die Möglichkeiten anthropogener Einflussnahmen unverzichtbar. Ein Bereich, in dem
der Mensch durch sein Handeln den Kohlenstoffkreislauf beeinflussen kann, ist die Waldwirtschaft.
Wälder stellen in terrestrischen Ökosystemen wichtige Kohlenstoffspeicher dar. Die
Bewirtschaftungsform hat direkten und indirekten Einfluss auf die Kohlenstoffvorräte. Eine direkte
Einflussgröße ist der Vorrat an Totholz, das im Wald verbleibt. Totholz stellt, vor allem in
Naturwäldern, einen wichtigen kurz- bis mittelfristigen Kohlenstoffspeicher dar. Des Weiteren
besitzt Totholz das Potential auch andere Kohlenstoffpools, vor allem den Boden, zu beeinflussen.
Zur Untersuchung des Einflusses der Bewirtschaftung wurde eine Fallstudie mit drei
unbewirtschafteten und benachbarten bewirtschafteten Wäldern mit jeweils ähnlichen
Standorteigenschaften wie Ausgangsgestein, mikrometeorologischen Eigenschaften, Neigung und
Baumartenzusammensetzung durchgeführt. In jedem Wald wurden Kohlenstoffvorräte und
--umsatzzeiten erfasst. Besonderer Fokus wurde dabei auf die Kohlenstoffvorräte im Totholz gelegt.
Die unbewirtschafteten Wälder werden seit 40-100 Jahren nicht mehr bewirtschaftet. Mit Buche,
Eiche und Fichte sind die dominierenden Baumarten der feucht-gemäßigten Zone berücksichtigt.
Das Versuchskonzept ermöglicht eine Abschätzung, wie sich die Kohlenstoffvorräte innerhalb von
einigen Jahrzehnten in einem nicht mehr bewirtschafteten Wald entwickeln im Vergleich zu
bewirtschafteten Wäldern.
In jedem der Wälder wurden auf Flächen von rund 1 ha die oberirdischen Totholzvorräte in einer
Gesamtinventur erhoben. Volumen und Zersetzungsgrad jedes Totholzstückes wurden erfasst. Für
Totholzstämme von fünf definierten Zersetzungsgraden wurde aus einer repräsentativen
Stichprobenmenge Holzdichte und Kohlenstoffgehalt bestimmt. Außerdem wurden
Radiokarbonanalysen und dendrochronologische Kreuzdatierungen durchgeführt um das
Absterbejahr von Totholzstämmen zu bestimmen. Aus diesen Daten wurden artspezifische
Abbaukurven für Totholz berechnet.
In den unbewirtschafteten Wäldern waren mit 10 Mg C ha-1 im Fichtenwald und 24 bzw. 30 Mg C
ha-1 im Buchen-Eichenwald die Kohlenstoffvorräte im oberirdischen Totholz zwei- bis sechsmal
größer als in den bewirtschafteten Wäldern, in denen die Kohlenstoffvorräte im oberirdischen
Totholz rund 5 Mg C ha-1 betrugen. Die Verbleibzeiten von oberirdischem Totholz waren
artabhängig. Buchentotholz hatte mit rund 30 Jahren eine kürzere Verbleibzeit als Fichtentotholz
mit rund 70 Jahren. Für Eichentotholz unterschieden sich die erwarteten Verbleibzeiten einzelner
VII

Totholzstücke so stark, dass die Berechnung einer allgemeinen Abbaufunktion nicht möglich war.
Jedoch deuteten die datierten Eichentotholzstämme daraufhin, dass Eichentotholz das Potential
aufweist, genauso lange oder länger in Wäldern zu verbleiben wie Fichtentotholz.
Zusätzlich zu den Feldaufnahmen wurde im Labor der Abbau von oberirdischen Totholz unter
kontrollierten Bedingungen untersucht. Totholzstücke der drei Baumarten in drei verschiedenen
Zersetzungsgraden wurden über eine Zeitspanne von 380 Tagen bei 15°C inkubiert. In regelmäßigen
Abständen wurde die CO2 Produktion gemessen und ein Holzextrakt gewonnen, um die Flüsse aus
Totholz in der Gas- und Flüssigphase zu ermitteln.
Der jährliche Kohlenstoffverlust aus Totholz war art- und zersetzungsgradabhängig. Der größte
Kohlenstoffverlust wurde für Buchentotholz gefolgt von Eichen- und Fichtentotholz festgestellt.
Der jährliche Kohlenstoffverlust aus Totholz nahm mit dem Zersetzungsgrad zu. Die
Mineralisierung zu CO2 stellte den Hauptanteil des Kohlenstoffverlusts dar, jedoch machte
Auswaschung als gelöster Kohlenstoff bis zu 25% des Kohlenstoffverlusts aus. Die höchste
Produktion an gelöstem Kohlenstoff hatte Eichentotholz sowie stark zersetztes Totholz aller
Baumarten.
Der Kohlenstoffvorrat im unterirdische Totholz wurde durch Ausgraben von Wurzelstöcken
bekanntem Todesjahres ermittelt. Pro Baumart und Todesjahr wurden im bewirtschafteten Wald fünf
Wurzelstöcke beprobt. Die Wurzelstöcke wurden vollständig entnommen und das Totholzvolumen
im Labor durch Wasserverdrängung ermittelt. Eine repräsentative Probenanzahl wurde auf ihren
Kohlenstoffgehalt untersucht.
Unterirdisches Totholz zeigt eine große Variabilität im Abbau, die durch Unterschiede in
Totholzvolumen, -dichten und Kohlenstoffgehalten der Wurzelstöcke von Bäumen des selben
Todesjahres gekennzeichnet war. Aus diesem Grund war eine sichere Berechnung der unterirdischen
Totholzmasse aus dem Stumpfdurchmesser von Totholz des selben Todesjahres nicht möglich.
Vielmehr erwies es sich als sinnvoll, die unterirdischen Totholzvorräte durch Multiplikation der
Anzahl an Totholzstücken, die dem stehendem Totholz und den Stümpfen zugeordnet wurden, mit
der durchschnittlichen Kohlenstoffmasse pro Stumpf zu berechnen. Aufgrund der regelmäßigen
Durchforstung und der daraus resultierenden größeren Anzahl an Stümpfen, war der Vorrat an
unterirdischem Totholz in den bewirtschafteten Waldern höher als in den unbewirtschafteten. Der
Kohlenstoffvorrat betrug im unterirdischen Totholz 0.3 – 1.4 Mg C ha-1 im bewirtschafteten Wald
und 0.1 – 0.4 Mg C ha-1 im unbewirtschafteten Wald. Dies entsprach im bewirtschafteten Wald rund
16% und im unbewirtschafteten Wald 1% des Gesamttotholzkohlenstoffvorrats.
Bodenproben wurden auf jeder Fläche an 30 Punkten auf einem regelmäßigen Raster mit einer
VIII

Fläche von 2 ha genommen. Die Humusauflage wurde nach Horizonten getrennt beprobt. Der
Mineralboden wurde bis in eine Tiefe von 100 cm beprobt und in 4 Tiefenstufen getrennt. Von jeder
der Proben wurde der Kohlenstoffgehalt bestimmt. Des Weiteren wurde für jeden Wald und jede
Tiefenstufe eine Mischprobe zur Dichtefraktionierung in drei Fraktionen (<1.6 g cm-3, 1.6-2.0 g cm-
3, >2 g cm-3) angefertigt. Radiokarbonsignaturen der Mischprobe sowie jeder Fraktion wurden
gemessen.
Im Boden wiesen die Kohlenstoffvorräte größere Unterschiede zwischen den Versuchsflächen auf
als zwischen den Bewirtschaftungsformen. Die Kohlenstoffvorräte betrugen zwischen 4.3 – 15.9
Mg C ha-1 in der Humusauflage und zwischen 48.1 – 261.4 Mg C ha-1 im Mineralboden bis in 1 m
Tiefe. Radiokarbonanalysen der Humusauflage zeigten für den Of Horizont an allen
Versuchsstandorten eine kürzere Umsatzzeit in den unbewirtschafteten als in den bewirtschafteten
Wäldern. Dies wird durch eine Stimulation des Streuabbaus durch die erhöhten oberirdischen
Totholzvorräte erklärt. Im Oh-Horizont und im Mineralboden sind die Unterschiede zwischen den
Wäldern jedoch nicht konsistent. Es wurde angenommen, dass andere Faktoren einen Totholzeffekt
überschatten bzw. die Umsatzzeiten im Vergleich zur Zeitspanne seit Änderung der
Bewirtschaftungsform zu lang sind, um sich nach Jahrzehnten signifikant auf die Umsatzzeit im Oh
Horizont und Mineralboden auszuwirken. Von den Dichtefraktionen waren nur die Unterschiede
zwischen Bewirtschaftungsformen in der leichten Fraktion <1.6 g cm³ für jeden Versuchsstandort
über alle Tiefenstufen konsistent.
Totholz hat das Potential substantiell zur Kohlenstoffspeicherung im Wald beizutragen, wobei die
Eignung Baumarten abhängig ist. Durch eine Beendigung der Bewirtschaftung können die
Totholzvorräte innerhalb von Jahrzehnten signifikant gesteigert werden. Jedoch hat Totholz keinen
Einfluss auf die Kohlenstoffvorräte im Boden. Ein eventuell bestehender größerer Input von
Kohlenstoff in die Humusauflage wird durch eine kürzere Umsatzzeit im Of-Horizont ausgeglichen.
Im Mineralboden sind keine konsistenten Unterschiede zwischen den Bewirtschaftungsformen in
Kohlenstoffvorräten und Umsatzzeiten feststellbar.
IX

Chapter 1
On this thesis
1

Introduction
Motivation
With regard to climate warming, carbon (C) sequestration is of particular political and public
interest. Forests store 50 % of the terrestrial C stocks (Jandl et al. 2007) and are thought to have the
potential to increase their C stock through anthropogenic impact. Management can influence
different site characteristics, including soil properties. One substantial result of management
represents the accumulation of coarse woody debris (CWD) (Christensen et al. 2009). While CWD
constitutes an important short to middle term C sink in forest ecosystems (Laiho & Precott 2004),
its influence on other C pools in forest ecosystems including the forest floor and the mineral soil are
subject of speculations (Harden et al. 2000, Manies et al. 2005). Likewise, management impact on
the soil organic carbon (SOC) stocks isn't clear (Nave et al. 2010). The aim of this study was to
investigate the impact of a withdrawal from management on the SOC stocks of forests within
decades. Special focus was given to CWD.
Forests as carbon stocks
Forests represent an important C sink and contribute approximately 90% of the terrestrial above-
ground and 40% of the terrestrial below-ground C storage (Waring & Schlesinger 1985). Globally,
two thirds of the C in forest ecosystems is stored in soils (Dixon et al. 1994) as soils contain more
than twice the amount of C in vegetation or in the atmosphere (Batjes 1996, Schlesinger & Andrews
2000). More than 50% of the SOC stocks in mineral soils is stored within deep mineral horizons
below 10 cm depth (Jobbágy & Jackson 2000). Changes in the SOC content of deep soil horizons
thus greatly influence the global C budget.
C gradually accumulates in soil, forest floor, as well as biomass and by consequence C stocks reach
their maximum values in old-growth stands (Böttcher & Springob 2001, Cerli et al. 2006).
Strategies to enhance C sequestration in forest ecosystems, most importantly in the soil, might be
important to counteract changes in the atmospheric CO2 concentration (Lal, 2005). Land use, land
use change and forestry can sequester C from the atmosphere. (Vankooten et al. 2004). Forestry is
estimated to have the potential to enhance the C sequestration capacity of forest ecosystems to
correspond to 11-15% of the actual fossil fuel emission at the global level and to 5-11% in Europe
(Brown & Sathaye 1996, Cannell 2003).
Land use change and forest management
Land use and land use change, including conversion from forest to crop- or grassland or vice-versa
2

(Poeplau et al. 2011), have major impacts on the C budget of an ecosystem (Guo & Gifford 2002,
Houghton 2003). Protection of formerly managed forests represents a smaller change than
afforestation or deforestation. A meta-analysis indicates that few management practices are clearly
positive or negative in regards to C sequestration (Jandl et al. 2007). Management effects are divers
and include tree species selection as well as different chemical and physical treatments of the forest
sites. Chemical treatments comprise nitrogen (N) fertilization and liming. Physical treatments of the
forest soil include clearing operations like prescribed burning, soil tillage or ploughing (Raulund-
Rasmussen et al. 2006). Management practices vary in their rotation length, the handling of logging
residues and the amount of timber removed. The removal of timber represents a substantial loss of
nutrient and C from the forest ecosystem (Ballard 2000). Post-harvest, depletion of C from the
ecosystem is assumed to occur as respired CO2. In addition a smaller flux exists as dissolved organic
carbon (DOC) (Kalbitz & Kaiser 2008).
Forest management has greater effects on the forest floor than on the mineral soil (DeGryze et al.
2004). A depletion of forest floor C following management procedures is noticeable (Aussenac
1987) unless thinning residues are left on the site (Hendrickson et al. 1989, Mattson & Swank
1989). Chronosequence studies conducted in New England showed that the forest floor lost over
50% of its mass in the 15 years following clear cutting with a gradual recovery over the next 50
years (Covington et al. 1981). More recent cut stands had lower forest floor mass than older stands
(Federer et al. 1984).
Relatively little data is available on the effects of management on mineral soil (Jandl et al. 2007,
Luyssaert et al. 2010). It results in a mixing of forest floor C with stable mineral soil C and leads to
an increase in SOC in the mineral soil. On the other hand, mechanical site preparation can cause
problems as the soil structure is degraded (Ballard 2000).
A meta analysis yielded that the forest floor was significantly smaller in harvested sites, but that
harvesting had no effects on shallow or deep soil (Nave et al. 2010). Thinning influences the C
stock of the forest floor and the mineral soil oppositely and results in no effect on total SOC
(Skovsgaard et al. 2006). Overall, the effects on the SOC stocks are small and mostly depend on the
residue management (Johnson & Curtis 2001). There is no evidence that thinning and harvest
operations have a long term effect on SOC (Johnson & Curtis 2001, Misson & Tang 2005, Vesala
2005, Jandl et al. 2007), as most effects on the soil seem short-lived.
Coarse woody debris as a carbon stock
CWD is defined as dead woody material with a minimal diameter between 2 and 20 cm (Topp et al.
3

2006, Ellis et al. 2008). CWD can occur as above-ground and below-ground CWD. Above-ground
CWD is further differentiated into lying CWD (logs and branches), standing CWD (snags) and
stumps. In some cases, only lying logs in contact with the soil are considered as CWD (Ligot et al.
2012). In this study, CWD is defined as lying and standing woody debris with a diameter of at least
7 cm at the widest point. In Germany, wood with a diameter above 7 cm is commonly defined as
merchantable (Kramer 1988).
CWD can result from natural mortality and disturbances like fire or storms. In managed forests large
amounts of CWD are created during thinning procedures. With stocks of up to 550 m³, unmanaged
forests generally have higher CWD stocks than managed forest where stocks of 10 m³ are common
(Christensen et al. 2005). CWD stocks start to accumulate at yearly rates of 0.1 – 19 m³ ha-1 a-1 when
a forest is taken out of management (Vandekerkhove et al. 2009).
Forest management greatly affects the amount, size and quality of CWD that remain in forest
ecosystems. Historically few woody debris were left in managed forests and CWD was considered a
trait unique to old-growth forests (Harmon 2009). CWD management has gained importance since
the 1990s (Harmon 2001) as the ecological functions of CWD were recognized and its economic
value was identified (Heilmann-Clausen & Christensen 2004). Today, CWD is considered a key
indicator of the sustainability of forest management (Ligot et al. 2012). The ecological functions
include its role as a habitat for insects and fungi and its part in the nutrient cycle of forest
ecosystems (Harmon et al. 1986). Furthermore CWD can enhance soil stability, increase natural
regeneration and improve the quality of aquatic ecosystems (Ligot et al. 2012). Last but not least, it
represent a short to middle term C sink (Laiho & Prescott 2004).
During its decay CWD undergoes a transformation that results in highly divers physical, chemical
and biological characteristics. Theses changes are mostly caused by biological decomposition.
While many insects take part in the decomposition of CWD, the decomposition of CWD is mostly
attributed to basidomycetes (Käärik 1974, Swift 1977, Harmon 2001). Basidiomycetes are
commonly separated into white rot and brown rot fungi (Schmidt 2006). Abiotic decay processes
like photo-degradation play minor roles in decomposition of CWD.
CWD decay is a relatively slow process, that takes decades to several centuries (Rock et al. 2008).
Mean decomposition rates decrease with altitude (Kueppers et al. 2004) and increase from boreal to
temperate to tropical forest ecosystems (Harmon et al. 2001). Decomposition rates are controlled by
site conditions most importantly temperature and moisture (Herrmann & Bauhus 2012) as well as
wood characteristics including wood lignin, dry matter content or wood pH (Fréschet et al. 2012).
Further effects of CWD size and exposition to the soil on decomposition rates have been described
4

though published results are contradictory (Harmon 2009).
Fig. 1.1: Pathways of C loss from CWD
CWD decay can be separated in three main factors: mineralization, leaching, as well as biological
and chemical fragmentation (Fig. 1.1). Mineralization is the main pathway of CWD decay and is
assumed to account for 76% of the total C loss from CWD in the tropics over the whole
decomposition period (Chambers et al. 2001). With CO2:DOC ratio of 12:1, leaching of C as DOC
is the second important pathway of C loss (Mattson et al. 1987). Fragmentation has hardly ever been
quantified, but Lambert et al. (1980) calculated that 63% of the biomass loss from boles is due to
fragmentation. While mineralized C is lost to the atmosphere, leaching and fragmentation represent
potential C inputs to the forest floor and the mineral soil ( Spears & Lajtha 2005, Crow et al. 2007).
Further C pathways include C loss to the atmosphere as methane (Mukhin & Voronin, 2008) or as a
variety of carbohydrates during forest fires (Hyde et al. 2011). Fungi can transfer C to the soil
through mycellium (Boddy & Watkinson 2005) and animals contribute to nutrient loss in heavily
decayed wood (Swift 1977). These pathways have not been quantified and are of minor importance
for the C budget of CWD.
CWD has the capacity to modify a range of soil characteristics including the heterogeneity of
organic compounds (Strukelj et al. 2012), the pH value (Klinka et al. 1995) and the microbial
community of the soil (Rajala et al. 2012). An elevated CWD stock can increase the size of the
fungal community in the soil and result in a shift in the fungal:bacterial ratio, which may result in a
better utilization of organic compounds that a bacterially dominated microbial community is less
5

able to degrade (Brant et al. 2006). Effects of CWD have been measured after only two years in
degraded eucalpyt woodlands indicating that they originate from indirect structural effects rather
than direct inputs through leachates (Goldin & Hutchinson, 2013). An increase of SOC stocks
underneath CWD has never been reported, nonetheless CWD is incorporated in many soil and forest
models as a C input pool (Parton et al. 1988, Cramer et al. 2001, Tuomi et al. 2011).
Forests as nitrogen stocks
N is a mineral nutrient required for tree growth. In soils, 90 % of N occurs in solid, organic forms
(Stevenson 1982). Global amounts of soil N in the upper 100 cm are estimated at 133-140 Pg
(Batjes 2005). N stocks are between 6 and 10 Mg ha-1 in temperate forests (Gerstberger et al. 2004).
Most terrestrial ecosystems used to be N limited (Date 1973). The increased N deposition in the past
decades due to human activities like industrial combustion processes and fertilizer application
(Vitousek et al. 1997, Gruber and Galloway 2008) resulted in a N saturation in temperate forest
ecosystems (Aber 1992). On the other hand, anthropogenic influence through forest management
has little or no effect on N stocks of the soil (Johnson and Curtis 2001).
Studies on the N cycle of forest ecosystems give contradictory on the importance of CWD. While
CWD has been reported as an important regulator of N availability in forest ecosystems (Hafner &
Groffmann 2005), other studies suggest that CWD does not make a significant contribution to the N
cycle (Laiho & Precott 1999). N concentration of above-ground CWD is low (<0.2 %) in its initial
state (Holub et al. 2001), but increases during its decay through microbial fixation of atmospheric
N2 (Larsen & Neal 1978, Jurgensen et al. 1990, Jurgensen et al. 1992, Brunner & Kimmens 2003).
Heavily decayed CWD might serve as a N source, with N release from stumps occurring at slower
rates than N release from logs or branches (Palvianien et al. 2010).
6
ObjectivesThe study was conducted with the aim of investigating the role of CWD as a C sink and its
influence on the SOC stock. To this end, managed forests were compared with unmanaged forests
with an elevated CWD stock. Site characteristics between managed and unmanaged forests are
assumed to be similar. All differences were attributed to management in general and especially
CWD. The specific objectives of this thesis were:
1) To test the suitability of two different methods for determination of time of tree death. Time of
tree death is an essential parameter to calculate disappearance times of CWD and to evaluate the
potential of tree species as middle-term C stocks.
Chapter 2
2) to quantify the C loss from CWD as CO2 and as DOC under laboratory conditions for samples of
different tree species and decay classes.
Chapter 3
3) to quantify the C stocks in above-ground CWD, forest floor and mineral soil in managed and
unmanaged forests and to calculate the influence of enhanced CWD stocks on the SOC turnover in
the forest floor and the mineral soil.
Chapter 4
7

Material and Methods
Study sites
The thesis compromises field studies and one laboratory study. Samples used in the laboratory study
originate from the study sites the field work was conducted on and thus relate to the same forest
systems. At each study site, an unmanaged and an adjacent managed forest were investigated.
The unmanaged forests are protected by law from management procedures with the goal of
economical gain. No regular management procedures were conducted for several decades. However,
exceptional procedures were carried out in order to influence the natural succession towards a
favoured direction. Motivations include the prevention of large scale bark beetle infestation or the
removal of beech trees to reduce their dominance in comparison to oak. The unmanaged forests are
shaped by previous human cultivation and management, which are visible in current species
distribution and age structure of the unmanaged forests. For this reason, the unmanaged forests are
not considered old growth or natural forest ecosystems.
The managed forests are high forests. They undergo procedures such as thinning and selective
felling that are commonly applied in Bavarian state forests at regular intervals.
In contrast to a comparison of managed forests with natural or old growth forest systems, this set-up
gives insights on how forests that were previously managed can evolve within time periods of
decades, if a management change occurs.
Grübel
Grübel (49°07' N 013°07' E) is a Norway spruce (Picea abies (L.) H. Karst.) forest situated at 1250
m a.s.l. in the Bavarian forest. The unmanaged forest has an area of 56.3 ha and was declared at
natural reserve in 1978. The soil type is Podzol. Soil moisture greatly varies across the study area:
parts of the study area are considered poorly drained. The forest floor is highly variable and can
reach a depth of over 1 m in the poorly drained parts of the study area. Mean annual temperatures
are 3-4°C and mean precipitations are 1500 mm a-1. The forest reserve is situated on the south slope
of the Kleiner Arber massif. Due to the microclimatically advantaged morphology, the spruce-
dominated highland forest starts at 1150 m a.s.l., which is about 100 m higher than in less
favourable parts of the Bavarian forests. While the samples were taken in an area with sheer spruce
forests, single trees of mountain ash, sycamore maple, fir and beech are scattered over the reserve.
The forest is even aged with a mean tree age estimated at 260 years. Due to the infestation with bark
beetles, single trees were removed in the past years. Generally the bark was removed and the wood
8

left as logs in the forests. However, in 2010, a dozen dominant trees were felled and the timber
extracted from the forest. The investigated managed forest is situated in close proximity to the forest
reserve in northern direction. Species distribution and stand age are similar to the unmanaged forest.
Information of stand history is scarce, but it is assumed that no thinning procedures were conducted
in the past 20 years.
Ludwigshain
Ludwigshain (49°55' N 011°48' E) is a beech-oak forest situated at an altitude of 460 m a.s.l. in the
Hienheimer Forst near Kelheim. Mean annual temperature is 7-8°C and mean precipitations are
950-1100 mm a-1. Geologically it is situated on the Swabian Jura. The soil is calcareous Luvisol.
Ludwigshain is a nature reserve with an area of 2.4 ha. It is most famous for its ancient oaks, that
were used in the construction of several famous German buildings, including the Cologne Cathedral
and the fortress of Ingolstadt. It was first declared a nature park by kKing Ludwig III of Bavaria in
1913 after a hunting-visit in 1906. Ever since, no thinning procedures were conducted, though the
removal of oak timber of trees that had succumbed to natural mortality has been allowed until the
mid-1960s. The area was proclaimed a natural reserve in 1939. While the forest was first protected
for its imposable oak trees, their number is slowly declining as old trees die and few oak seedlings
germinate. As part of natural succession, beeches rejuvenate successfully and gradually transform
the forest in a beech forest. Currently the tree species distribution is 30% Sessile oak (Quercus
petraea (Mattuschka) Liebl.) and 70% European beech (Fagus sylvatica L.). The mean tree age is
370 years. The oldest oak trees are up to 470 years old.
The managed forest has a higher amount of Sessile oak (70%) than European beech (30%). The
mean tree age is 125 years. As far as historical records reach back, the area has been used for timber
production. The last thinning procedure was conducted in the year 2002, when about 340 m³ wood
ha-1 were removed.
Rohrberg
Rohrberg (49°54' N 009°26' E) is an oak-beech forest situated 540 m a.s.l. in the Hochspessart. The
soil is Cambisol on Sandstone. Mean annual temperature is 7-8°C and precipitations are 650-750
mm a-1. Rohrberg is a nature reserve with an area of 9.9 ha. It is Bavaria's oldest nature reserve and
has been protected since 1928. With a mean stand age of 550 years and single oak trees that are up
to 840 years old, it is the oldest forest stand of Bavaria. It used to be a typical sparse oak forest, that
evolved until 1803 due to management aiming to create favourable conditions for hunting. Glands
were used as browsing for game animals. However, due to the natural dominance of beech under the
9

site conditions, the abundance of beech is gradually increasing at the cost of oak trees. For this
reason, a number of dominant beech trees were removed in accordance with the natural
conservation authority in 2002. Currently, European beech makes up 30% and Sessile oak 70% of
the biomass in the unmanaged forest. The managed forest is separated in two parts, one with a 100
years old beech forest and the other an 65 years old oak forest. The last thinning procedure took
place in the year 2007 when 106 m³ wood ha-1 were cut.
Waldstein
Waldstein (50°08' N 011°52' E) is a Norway spruce forest situated at 770 m a.s.l. in the Lehstenbach
catchment in the Fichtelgebirge. Mean annual temperature is 5.3°C and the mean precipitations are
around 1160 mm a-1 (Gerstberger et al. 2004). The Lehstenbach catchment is dominated by Norway
spruce. The soil is classified as a Haplic Podzol with a sandy to loamy texture.
No complete C inventory was conducted at Waldstein. Solely below-ground spruce CWD was
investigated. This decision was taken as an investigation of the below-ground CWD stocks at
Grübel was restricted by morphological constraints of the study site and fragmentary forest records.
General concept and field sampling
The inventory of the C stocks in managed and unmanaged forests include a complete inventory of
the C stocks in the forest floor, the mineral soil and the above-ground CWD stocks. Below-ground
CWD was sampled in the Ludwigshain (beech and oak) and Waldstein (spruce) only. Sampling of
below-ground CWD represents a huge invasion and was thus only possible in managed forests. The
suitability of the study sites is further restricted by incomplete knowledge on time since thinning
procedures.
Living timber biomass was not inventoried in detail. Forest records and measurements of diameter
at breast height were used to estimate above-ground timber biomass in trees. Below-ground biomass
was estimated through root:shoot ratios given in Offenthaler & Hochbichler (2006).
Above-ground coarse woody debris inventory
The assessment of above-ground CWD included the quantification of the above-ground CWD
stocks, the identification of CWD quality (e.g. C density) and the determination of time of tree
death. These parameters were used to calculate the CWD C stocks, the disappearance time of CWD,
the C loss from CWD, the CWD production and the CWD accumulation (Fig. 1.2).
10

Fig. 1.2: Measured and calculated CWD parameters.
The inventory of above-ground CWD was conducted in each forest within an area of 0.5 – 1.2 ha.
Lying logs and branches, standing snags as well as stumps with a diameter >7 cm were inventoried
as CWD. Lying CWD was defined as all CWD with no fix connection to the soil, that was situated
at an angle of less than 45° relative to the soil. Standing CWD was defined as CWD fixed to the soil
and/or situated at an angle of more than 45° relative to the soil. Standing CWD had a height of more
than 1 m. All CWD that was connected to the soil with roots and had a height of less than 1 m was
defined as stumps. Usually stumps resulted from tree cutting.
Each piece of CWD was measured, characteristics like wood colour, penetrability with a knife,
shape and insect infestation diagnosed and a decay class from 1 to 5 (Table 1.1) attributed in their
accordance with a method adapted from Goodburn & Lorimer (1998).
Table 1.1: Decay class (DC) characteristics of coarse woody debris (CWD).
Decay class Characteristics
1 Recently dead, bark intact, small twigs and leaves, no visible signs of decomposition
2 Bark mostly remaining, no leafs, wood not penetrable by a knife
3 Bark mostly missing, wood partly penetrable with knife, visible discolouration
4 No bark, wood completely penetrable with knife, deformation and discolouration
5 Wood soft, breakable with fingers, advanced humification
CWD volumes were calculated from multiple measurements of length and diameter using volume
formulas under the assumption that CWD pieces were regular cones or cylinders (Bebber & Thomas
2003). It was assumed that over- and underestimations of individual pieces levelled errors out over
the total stock.
11

To investigate CWD quality (wood density, water content as well as C and N concentrations), 722
CWD samples were taken by drilling holes of known volume and collecting all shavings. Sub-
samples of 200 samples were ground with a ball mill for further analysis. For conversion of CWD
volumes to C stocks, C densities were calculated from wood density and C concentration for each
tree species and decay class. This was a necessary step as usage of values for fresh wood for
conversion of CWD volumes to C stock leads to an overestimation of the C stocks (Weggler et al.
2012).
To determine the time of tree death of CWD that decayed under field conditions, the two methods
radiocarbon analysis (see below) and dendrochronological cross-dating were compared. Both
methods rely on the presence of the uttermost tree ring and thus restricted the method to CWD with
an utter tissue layers that had not yet degraded.
Decay of CWD can be expressed in different sizes including decomposition rate constants (Rock et
al. 2008), half-times (Olajuyigbe et al. 2011) and residence times (Holeksa et al. 2007). In this study,
disappearance times were calculated. It considered the C density at different times since tree death.
The disappearance time is reached when volume loss and fragmentation reduced the former CWD
to pieces with diameters of less than 7 cm.
CWD C loss was calculated from CWD C stocks and the disappearance times with tree species
specific linear function. Decadal CWD production was derived from time of tree death of current
CWD stocks. Volume loss is assumed to play an inferior role in early stages of decay (Harmon et al.
1986). The combination of CWD production and CWD loss gave the CWD accumulation.
Below-ground coarse woody debris inventory
Five stumps, from two (oak and spruce) or three (beech) thinning procedures of known time of tree
death, were completely excavated by hand. All roots with a diameter > 7 cm were recovered. The
total volume of the samples was determined by water dispersion.
Soil sampling
30 regularly distributed plots on a representative area of 2 ha were measured for the soil sampling.
The number was judged sufficient to represent the inhomogeneity of forest soils. The forest floor
was separated in the Oi, Oe and, if existent, Oa horizon in the field. Fine woody debris (FWD),
defined as woody pieces with a diameter between 0.2 - 7.0 cm and roots were separated in the
laboratory and their mass and C concentration were determined separately.
The upper 10 cm of the mineral soil were sampled with a core cutter. Further soil samples up to 100
cm depth were taken with a percussion drill and separated by the depth intervals 10-20 cm, 20-50
12

cm and 50-100 cm under consideration of compression. The soil was separated by depth rather than
horizons to facilitate statistical comparison of the study sites. Sampling by percussion drill can
result to an uncertainty in the density determination of the bulk soil as well as an underestimation of
the rock content. SOC stock estimates in this study should thus be considered upper limits of the
potential SOC stock in the forests.
Twelve additional soil samples of the upper 10 cm of the mineral soil per tree species and study site
were taken directly underneath heavily decayed CWD of beech and oak at Rohrberg and
Ludwigshain. The CWD piece and, if present, organic material, were removed from the plot before
sampling.
Sample preparation and analysis
Decay of woody debris under laboratory conditions
Twelve woody debris samples of decay class 1, decay class 3 and decay class 5 of the tree species
beech, oak and spruce (108 samples total) were incubated on filtration units in glass jars at 15°C in
a dark climate chamber for 380 days. In weekly intervals, the increase in CO2 in the glass jars within
a time period of 24 hours was measured by gas-chromatography to calculate respiration rates.
Further leached C was measured in a constant quantity of artificial rain. This set-up enabled us to
quantify the C loss as CO2 and DOC in dependence of tree species and decay class.
Density fractionation
Changes in SOC are often hard to detect in bulk soil due to its high spatial variability (Schöning et
al. 2006, Homann et al. 2008, Schrumpf et al. 2008). For this reason, a division in less
heterogeneous chemical and physical fractions with different stability and turnover times (TTs) is
useful to detect changes (Trumbore 2000, Kögel-Knabner et al. 2008). Commonly applied
procedures include the separation of soil in dependence of its density in three fractions that are
named free particulate organic matter (fPOM, δ<1.6 g cm-3), occluded particulate organic matter
(oPOM, 1.6<δ<2.0 g cm-3) and mineral associated organic matter (MaOM, δ>2.0 g cm-3). In this
study, sodium-polytungstate (SPT) solution was used to separate the soil in its fractions.
The meaning of the fractions and the implications for processes occurring under natural conditions
is controversially discussed. Generally, it is agreed upon that SOC in the lighter fractions originates
from litter input and constitutes fragmented plant debris whereas the heavier fractions are higher in
compounds derived from microorganisms (Wagai et al. 2008). The fractions respond to changes at
varying rates with a faster reaction in the light fractions than in the heavy fractions (Hedde et al.
13

2008, Don et al. 2009). As density fractionation is a time intensive costly procedure, it was only
done for one mixed sample per study site and soil depth.
Radiocarbon analysis
The application of radiocarbon analysis in environmental studies is often based on the so-called
„bomb“ 14C or modern 14C. Due to above-ground thermonuclear weapon testing, the amount of 14C
in the atmosphere significantly increased during the 1950s. By 1963, the amount of 14C in the
atmosphere had almost doubled (Lassey et al. 1987). Since the limited Test Ban Treaty went into
effect in October 1963, the 14C in the atmosphere is continually diluted due to the burning of 14C free
fossil fuels and the mixing of atmospheric 14C with terrestrial and marine C pools (Levin & Kromer
2004). This results in yearly differences of atmospheric 14C that are above the sensitivity of
radiocarbon measurements. Plants take up atmospheric C and bind it. The atmospheric 14C signal is
thus propagated first to the living biomass and than to litter pools and to the soil. This enables the
study of the flow of C through the different pools on a decadal time-scale (Goh 1991).
In this study, radiocarbon analysis were incorporated in different ways. The time of tree death of
CWD logs were studied by radiocarbon analysis of the uttermost tree ring. Further, the different
radiocarbon signatures of CWD in comparison to leaf litter was used to model the influence of
CWD on the forest floor. Finally, TTs of the SOC were calculated.
Modelling of soil organic carbon turnover in the forest floor and the mineral soil
TT of SOC pools can be calculated from radiocarbon signatures using different modelling
approaches in dependence of the input pools, and whether a system is at steady state. All modelling
approaches used in this study are based on Gaudinski et al. (2000). For the forest floor, non-steady
state models are assumed. In addition to the radiocarbon signatures, the SOC stocks and their build
up are considered for calculation of TTs. It is assumed that all input to the O i horizon originates
from fresh leaf litter. For the Oe horizon different scenarios were calculated with and without
consideration of input from the Oi horizon, the FWD and the CWD. For the Oa horizon, input from
the Oe horizon as well as from roots are considered. TTs of SOC in the bulk mineral soil and the
density fractions were calculated with a steady state model.
14

Synthesis and discussion of results
Properties of above-ground coarse woody debris
The investigation of differences in C stocks in the managed and unmanaged forests gave special
focus to CWD. CWD properties changed during its decay. Wood density decreased and C and N
concentration as well as in in situ water content increasedin above-ground CWD of the three species
European beech, Sessile oak and Norway spruce (Fig. 1.3). All characteristics were marked with
high variations between samples of the same decay class as well as between samples from the same
log highlighting the natural variance in decay of CWD.
Fig. 1.3: Wood density (a), C concentration (b), N concentration (c) and gravimetric water
content (d) at decay classes 1-5 for the tree species European beech, Sessile oak and Norway
spruce. Error bars give standard errors.
Wood density of CWD of decay class 1 significantly differs between spruce (0.38 g cm -3) and beech
as well as oak (0.51 g cm-3). It is lower than wood density of undecomposed wood (spruce: 0.43 g
15

cm-3, beech: 0.72 g cm-3, oak: 0.65 g cm-3) (Trepkau 2003). Wood density exhibits a great variation
depending on environmental and climatic variables, the cambial age and radial position of the wood
and the tree height and location relative to the crown (Lei et al. 1996, Gartner et al. 2001, Swenson
& Enquist 2007). The high variation in wood density of decayed wood could thus partially stem
from initial differences in wood density. As a result of fragmentation by wood-dwelling insects and
of consumption by wood decomposers (Harmon et al. 1986), wood density of heavily decayed wood
decreased to values of 0.1 g cm-3 (Fig. 1.3a). Decrease in wood density is the most important
property for estimation of C stocks in CWD (Weggeler et al. 2012).
The increase in C concentration from 48.6 to 51.7 from decay class 1 to 5 (Fig. 1.3b) corresponds to
published results (Holub et al. 2001) and can be attributed to a change in the chemical composition
of wood following microbial decay. Some wood decomposing organisms, including brown rot
fungi, transform the constituents of wood lignin, cellulose and hemicellulose at different paces
(Song et al. 2012). White rot fungi simultaneously decompose lignin and cellulose (Leonowicz et al.
1999). Beech CWD is mostly decomposed by white rot fungi (Schmidt 2006), resulting in only
slight alteration of the cellulose:lignin ratio in CWD and consequently no significant change in C
concentration at decay class 1 to 4. Oak and spruce CWD on the other hand is mainly decomposed
by brown rot fungi (Schmidt 2006). Brown rot fungi do not have the capacity to decompose lignin,
but metabolize cellulose (Schmidt 2006). By consequence the amount of lignin in comparison to
cellulose increases in CWD. Pure lignin has a C concentration between 63 and 72 %, while
cellulose and hemicellulose have C concentrations around 42 % (Crawford 1981).
N concentration of CWD remained at a low and constant level for decay class 1 to 3 (or 4 in case of
spruce) (Fig. 1.3c). The relative increase in N concentration at decay class 4 and 5 was more
distinctive for spruce CWD than it was for beech and oak CWD. This pattern corresponds to
published results on CWD of other tree species (Krankina et al. 1999, Fukasawa et al. 2009). An
increase in N concentration can result from a relative accumulation of N in consequence of density
loss or by an uptake of N by wood decaying organisms from the soil (Hafner & Groffman 2005) or
N2 fixation from the atmosphere (Cowling & Merill 1966). In case of spruce CWD, the increase in
N concentration cannot be explained by a relative accumulation of N in CWD due to density loss
alone and must thus result from an N uptake or fixation by wood decaying fungi. Depending on its
stage of decay, CWD can serve as both a sink and a source of N in aquatic systems (Creed et al.
2004). A similar behaviour is assumed in terrestrial ecosystems (Palviainen et al. 2010).
CWD possesses a great water holding capacity that resulted in in situ water contents of up to 15
times its dry mass (Fig. 1.3d). The in situ water content increased with decay class showing that
16

especially heavily decayed served as a water stock. Moisture content affects the decay of CWD
(Herrmann & Bauhus 2012) and might explain potential differences in C loss from CWD between
early and advanced decay classes. The water holding capacity of CWD can also be of importance to
SOC turnover in the top soil especially during drought periods, when CWD can slow evaporation of
soil moisture (Stevens 1997).
Properties of below-ground coarse woody debris
Significant (p < 0.001) differences in mean below-ground CWD density were found between beech
(0.26 g cm-3), spruce (0.41 g cm-3) and oak (0.64 g cm-3). Below-ground CWD had a lower wood
density for beech, a higher wood density for spruce and a similar wood density for oak than above-
ground CWD.
With average C concentrations of 42.9 (spruce) to 46.3 (beech) and 46.9 % (oak), average C
concentrations of below-ground CWD were lower than of above-ground CWD of the same tree
species. N concentration of below-ground CWD was lower than N concentration of above-ground
CWD for oak (0.23 %), but higher for beech (0.48 %) and for spruce (0.87 %). No agreement of N
concentration with time since tree death was found. These findings do not correspond to results
from Olajuyigbe et al. (2001) who described an increase in N concentration with increasing density
loss and time since tree death.
Above-ground coarse woody debris decay
Knowledge on decay is essential to estimate the potential of CWD as a middle-term C stock in
forest ecosystems and to assess the potential contribution of C originating from CWD to the soil. To
study CWD decay two different approaches were used in this study: a field study and a laboratory
incubation experiment.
Due to the short duration of this study in comparison to the decay of CWD, a chronosequence
approach was implemented to study CWD decay in the field. Chronosequence approaches require
knowledge of the time since tree death of CWD (Harmon et al. 1986). As forestry record did not
provide sufficient information on the time of tree death of individual trees, other methods for age
determination were used: dendrochronological cross-dating and radiocarbon analysis of the
outermost tree ring. Both methods require the presence and the ability to identify the outermost tree
ring and thus restricted decay studies to CWD with an at least partially intact outermost tree ring.
The laboratory experiment enabled the observation of decay under controlled conditions and the
measurement of C loss through different pathways namely as leached DOC and as mineralized CO2.
However, the sample had no soil contact in the implemented design and by consequence any
17

interaction with the soil including mycellium growth or N transfer was prevented. Microbial decay
is considered the main driver of C loss from CWD (Swift 1973), but other factors also contribute
including insect infestation (Swift 1977) and photo-degradation (Pandey 2005). In the experiment,
wood disks were cut to create samples of equal size in order to get several replications of similar
quality. New surfaces were created and samples significantly reduced in size in comparison to the
original CWD logs. Further samples were dried, re-wet and inoculated prior to the experiment.
Temperature and moisture regimes in the experiment did not represent field conditions and effects
resulting from the sample treatment could not be distinguished from natural decomposition
processes.
Fig. 1.4: Extrapolation of C loss over a ten years period in the incubation experiment and
under field conditions for samples of beech (B), oak (O) and spruce (S) of decay class 1, 3
and 5.
Results of the field and the laboratory study differed in total annual C loss as well as effects of tree
species and decay class. Calculated annual C loss (1.5 – 11 % of initial C) was in average two times
higher under laboratory conditions than under field conditions (Fig. 1.4). This was partially
attributed to a temperature effect as the samples were incubated at 15°C while yearly averages in the
field range between 3 and 8°C. Q10 values for CWD of 2.7 - 3.4 (Yatskov et al. 2003) would explain
the difference. Under laboratory conditions, C loss through leaching contributed between 1 and 25%
of the total C loss. Contributions were highest for oak CWD and for decay class 5 of all tree species.
18

The experimental set-up might have enhanced C loss through leaching due to the increased
surface:volume ratio resulting from the smaller sample size in comparison to logs. Nonetheless,
mineralization to CO2 was the main pathway of C loss.
CWD decay was tree species dependant. The order of tree species differed in the field and in the
laboratory. Under field conditions the order beech > spruce > oak corresponded to other
observations in temperate forests (Rock et al. 2009). Beech CWD samples remained in the forest for
no longer than 30 years. Samples of spruce and oak CWD had disappearance times of over 70 years.
The high C density of oak CWD indicated the potential of oak CWD to remain in forests longer
than spruce CWD. The mean annual temperature of the studied spruce forest is 4 K colder than
mean annual temperatures of the beech-oak forests. The long disappearance time is thus partially
due to climate effects rather than intrinsic CWD characteristics.
In the laboratory, C loss decreased in the order beech > oak > spruce. Sample preparation might
have favoured the decomposition of oak CWD more than of spruce CWD, as the distinct chemical
composition of oak with a high content of extractable substances (Bianco & Savolainen 1994)
results in a higher potential C loss through leaching from CWD.
Exponential functions are common to describe the decay of CWD (Harmon et al. 1986), indicating a
decrease in C loss relative to the initial amount of C. However, depending on the tree species,
sigmoid or linear functions are more suitable to describe CWD decay (Fréschet et al. 2011). Under
field conditions, there was a statistically significant linear correlation between time since tree death
and C density for beech and spruce CWD, but not for oak CWD. A linear decay function indicates
that absolute C loss remains constant at all decay classes. Under laboratory conditions, C loss
increased with decay classes with significant differences in annual C loss between heavily decayed
CWD and less decayed wood. As heavily decayed wood was not considered under field conditions,
neither was the potential increase in C loss.
Under laboratory conditions, all samples for each decay class originated from the same wood disk of
the same tree. Despite the relatively uniform material, standard deviation of samples of the same
kind were around 30% of the measured average C loss. Under field conditions, standard deviations
of several orders of magnitude are common (Kuehne et al. 2008), rending the finding of statistically
significant differences between decay classes more unlikely. The lack of correlation between time
since tree death and C density for oak CWD was caused by the natural variability of oak CWD. Oak
has a stong differentiation in heart- and sapwood that results in CWD size effects on decay (Harmon
2009). Heartwood of oak contains high concentrations of fungi-toxic extractables (Hillis 1987,
Puech et al. 1999), that inhibit colonization by wood decaying fungi. Further, natural variability is
19

increased by differences in decay between snags and logs (Harmon 2009) and by old oak trees that
partially die and decay while new tissue is still being formed (Ranius et al. 2009).
Below-ground coarse woody debris decay
Below-ground CWD exhibited a great variability in C mass per stump (beech: 1 – 8 kg C, oak: 1 –
20 kg C, spruce: 2 – 36 kg C). There was no agreement between above-ground stump diameter and
below-ground C mass. No correlation between time since tree death and below-ground C mass was
found (data not shown).
Variations in below-ground C mass was highest for below-ground oak CWD. Below-ground CWD
of about 80 % of oak trees cut 14 years prior to sampling, was considerably reduced in mass and
volume, while below-ground CWD of the remaining stumps were in a state similar to fresh CWD
notable by a high wood density and presence of fine roots. The resistance to decay in the years
following tree cutting was attributed to the high content of tanning agents in the CWD that became
visible during sampling through discolouration of metal objects. This points to a long lag-period of
several years followed by a rapid decay of below-ground oak CWD. Lag-periods result from the
time needed for wood-decaying fungi to colonize the CWD (Harmon et al. 2000) and have been
described for above-ground CWD decay of various tree species (Grier 1978, Yatskov et al. 2003,
Olajuyigbe et al. 2012). Decay of below-ground CWD of coniferous tree species and birch on the
other hand occurs without a lag-period (Melin et al. 2009, Fréschet et al. 2011). The data were not
sufficient to calculate statistically significant decay functions for any tree species.
Coarse woody debris carbon stocks
Differences in above-ground CWD stocks between management types as well as tree species were
relevant. In the unmanaged forests, C stocks of CWD were between 11 and 30 Mg C ha -1. In the
managed forests, there were around 5 Mg C ha-1 of CWD. The CWD C stocks have accumulated in
the unmanaged forests since they were withdrawn from management between 40 and 100 years ago.
CWD production is still anthropologically influenced as exceptional management practices were
conducted in the past years with preservation motives. In all forests, removal of wood resulting from
natural mortality was allowed until the mid-1960s. CWD stocks in all unmanaged forests have the
potential to further increase and are not yet at steady state.
CWD accumulation is known to be a highly variable process that is tree species specific
(Vandekerkhove et al. 2009). The reconstruction of past CWD accumulation was restricted by the
number of CWD samples whose time of tree death was determined. A reconstruction by decades
was considered a good compromise between the needs of the study and the vulnerability to errors.
20

Over the last decades, CWD accumulated at yearly rates of 0.2 to 1.2 Mg C ha-1 a-1 (Fig. 1.5). In the
unmanaged forests, accumulation rates were greater than in the managed forests. The increase in
CWD stocks in the managed forests was attributed to management practices that leave crowns in the
forests for ecological reasons.
Fig. 1.5: Estimated build up of the CWD stocks and cumulative C loss from CWD since
1950 at Grübel (a), Ludwigshain (b) and Rohrberg (c).
At Ludwigshain, C stocks in the below-ground CWD ranged between 0.3 and 1.4 Mg C ha-1. This
corresponded to about 16 % in the managed and to less than 1 % in the unmanaged forest of the
total C stock of CWD. In accordance with the amount of standing CWD and stumps, the C stocks in
the managed forest were estimated 2.3 times higher at Rohrberg and 1.8 times higher at Grübel than
in the unmanaged forests. With a contribution of at least 10 % to the total CWD stocks in the
unmanaged and over 50 % in the managed forest, below-ground CWD was of more importance in
the spruce forest at Grübel than in the beech-oak forests. This corresponds to literature values that
estimate that up to 85 % of the total CWD stocks in managed Sitka spruce forests are below-ground
(Olajuyigbe et al. 2011).
Influence of coarse woody debris on soil organic carbon stocks
Influence of elevated CWD stocks on the SOC stocks was tested by comparing the SOC stocks and
TTs in the managed and unmanaged forests and by measuring the SOC stocks directly underneath
heavily decomposed CWD. CWD can contribute to the SOC stock of the soil through fragmentation
(Crow et al. 2007) and through leaching of C as DOC (Spears et al. 2003). Fragmentation of above-
ground CWD contributes to the SOC stock of the Oe horizon first. Fragmentation of below-ground
CWD has the potential to increase the SOC stock, especially in the fPOM fraction, at all soil depths.
Leaching of C as DOC is likely to contribute to the SOC stock in the whole mineral soil including
the MaOM fraction.
21

The SOC stocks in the forest floor and the mineral soil did not differ between managed and
unmanaged forests. SOC stocks of the forest floor ranged between 4 and 15 Mg C ha -1. FWD
represents an additional C stock of 0.3 – 1.1 Mg C ha-1. The C stocks of the CWD were about six
times higher than the SOC stocks in the forest floor in the unmanaged beech-oak forests and about
half of the SOC stock in the forest floor in the unmanaged spruce forest.
With a sample size of 30 replicates, SOC stocks of the Oe horizon have to differ by 30 % between
managed and unmanaged forests to be statistically significant. A model calculation yielded, that an
input of 5 % of the total C loss from CWD would be sufficient to cause such an increase at equal TT
of the SOC in the Oe horizon. As no significant differences in SOC stocks of the Oe horizon were
measured, the contribution to the Oe horizon from CWD is either smaller than 5 % or other factors
level out the additional input (see below).
The SOC stocks in the mineral soil up to 1 m soil depth (50 and 260 Mg C ha -1) corresponded to the
range found in the Bavarian soil inventory for similar site conditions (Wiesmeier et al. 2012). C
concentrations and bulk density of soil samples taken directly underneath heavily decayed CWD of
beech and oak at Ludwigshain and Rohrberg did not differ from soil samples taken as part of the
SOC stocks inventory. This indicated that CWD does not influence the SOC stocks in the mineral
soil, even on a punctual level. This result corresponds to findings by Kahl et al. (2013) who
measured no increase in the SOC stock beneath beech logs despite an increased DOC flux.
Total carbon stocks
Total C stocks of the above- and below-ground timber biomass, CWD, forest floor including FWD
and mineral soil up to 1 m soil depth amounted to 240 to 410 Mg C ha -1 (Fig. 1.6). C stocks in the
unmanaged forests were higher in Grübel and Rohrberg, but lower in Ludwigshain. The differences
between management types are not substantial. C stocks of CWD contributed 3, 12 and 8 % in the
unmanaged forests Grübel, Ludwigshain and Rohrberg respectively. In the unmanaged forests, the
contribution of CWD to the total C stocks was between 2 and 3 %. The values in the managed
forests were lower than the average contribution of CWD to the C stocks of European forests of
about 5 % (Goodale et al. 2002). The total C pool of European forests including living timber
biomass, CWD, forest floor and SOC, is reported at 22.4 Pg C with 1.0 Pg stored in CWD (Goodale
et al. 2002).
22

Fig. 1.6: C stocks in living timber biomass, CWD, forest floor including FWD and the
mineral soil up to 1 m soil depth in the managed (M) and unmanaged (UM) forests Grübel,
Ludwigshain and Rohrberg.
Coarse woody debris nitrogen stocks
N stocks of above-ground CWD were substantially smaller in the spruce forests than in the beech-
oak forests. At Grübel, N stocks of above-ground CWD are around 10 kg N ha -1 in both the
managed and unmanaged forests. In the managed forest at Grübel, the CWD is more heavily
decayed With around 90 and 115 kg N ha-1 in the unmanaged Rohrberg and Ludwigshain
respectively, N stocks in above-ground CWD were about five times higher in the unmanaged beech-
oak forests than in the managed beech-oak forests (20 kg N ha-1). In the unmanaged beech-oak
forest, N stocks were in the same order of magnitude than described for temperate beech forests
(Müller-Using & Bartsch 2007).
N stocks of below-ground CWD were below 10 kg in the managed and unmanaged forests in
Rohrberg and Ludwigshain. At Grübel, N stocks of below-ground CWD were estimated around 35
kg N ha-1 in the unmanaged forest and around 65 kg N ha-1 in the managed forest. At Grübel, N
stocks in below-ground CWD were thus greater than in above-ground CWD. So far, no studies on N
23

stocks of below-ground CWD have been published.
Average C:N ratios of above-ground CWD were between 250 and 300 in the beech-oak forests and
between 500 and 1000 in the spruce forests. Below-ground CWD has substantially lower C:N ratios
of 100 (European beech), 200 (Sessile oak) and 60 (Norway spruce). The observation that C:N
ratios of below-ground CWD are lower than of above-ground CWD corresponds to published
studies (Olajuyigbe et al. 2011). A possible explanation for the lower C:N ratio of below-ground in
comparison to above-ground CWD is the higher soil contact that might result in a greater fungal
translocation of N (Palviainen et al. 2011). C:N ratio is one of the variables that controls N release
during litter decomposition (Parton et al. 2007). Below-ground CWD thus has a greater potential as
a N source than above-ground CWD.
Influence of coarse woody debris on soil nitrogen stocks
Fig. 1.7: N stocks in CWD, forest floor including FWD and the mineral soil up to 1 m soil
depth in the managed (M) and unmanaged (UM) forests Grübel, Ludwigshain and Rohrberg.
N stocks in the forest floor were between 0.1 and 0.7 Mg N ha-1 (Fig. 1.7). Values were lower than
described for the forest floor of Bavarian forests between 0.8 and 2.9 Mg N ha-1 (Gerstenberger et al.
2004). Differences between study sites were more important than between management types. In the
24

Oi and Oe horizon at Rohrberg and Ludwigshain, N concentration significantly differed between
managed and unmanaged forests in 2009. However, the trend could not be confirmed in samples
taken in 2011. Differences in N concentration were greater between sampling years than between
management types.
N stocks of the forest floor were of similar range than the N stocks of the above-ground CWD in the
unmanaged forest at Ludwigshain, four times greater in the unmanaged forest at Rohrberg and
seventy times greater in the unmanaged forest at Grübel. The wide range demonstrates the differing
role of above-ground CWD in the N cycle of forest ecosystems. The low N stocks in Grübel
corresponded to results published on North American coniferous forests, where a contribution of 3
% or less of the N pool of the soil has been attributed to above-ground woody debris (Fahey et al.
1983, Busse 1994, Laiho & Prescott 1999).
N stock in the mineral soil ranged from 3.5 and 8.6 Mg N ha-1. Differences in N stocks in managed
and unmanaged forests showed no distinct patterns, nor did N concentrations or N stocks in soil
samples directly underneath CWD differ from soil sampled as part of the inventory. An influence of
CWD on the N stocks of forest systems had been suggested (Hafner & Groffman 2005), but this
result could not be confirmed in this study.
Soil organic carbon turnover in the forest floor
Fig. 1.8: Radiocarbon signatures of the forest floor and the bulk soil organic matter in the
managed and unmanaged forests at Grübel (a), Ludwigshain (b) and Rohrberg (c).
Radiocarbon signatures of SOC in the forest floor and bulk soil samples showed no consistent
25
differences across all study sites between managed and unmanaged forests except in the Oe horizon
(Fig. 1.8). The differences might be explained by differences in the radiocarbon signatures of the
input pools or differences in TTs of SOC in the Oe horizon. To test the likeliness of the possibilities,
a non-steady state model with three input pools (leaf litter, FWD and CWD) was implemented for
the Oe horizon. CWD contains a relatively high amount of pre-bomb C and thus possesses a lower
radiocarbon signature than leaf litter and FWD. By consequence, an elevated input of C from CWD
would result in a lower radiocarbon signature in the Oe horizon at the same TT of SOC.
Most model calculations of the Oe do not consider input from FWD and CWD (e.g. Gaudinski et al.
2000, Schulze et al. 2009), though variability in radiocarbon signatures of the forest floor have been
attributed to the presence of CWD (Trumbore & Harden 1997). In this study, the applied model was
restricted by a lack of information on the proportion of total C loss that enter the Oe horizon from
each input pools. The classic modelling approach without consideration of C input from FWD and
CWD to the Oe horizon gave TTs of SOC in the Oe horizon between 5 and 19 years. At all study
sites, TTs of the SOC in the Oe horizon were shorter in the unmanaged forests than in the managed
forests. Scenarios with different proportions of total C loss from CWD and FWD that enter the O e
horizon resulted in TTs of SOC in the Oe horizon differing by up to 5 years. Model runs with more
than one data point would enable to help clarify which model scenario is most accurate. No scenario
gave equal or longer TTs of SOC in the Oe horizon in unmanaged and/than in managed forests.
While the calculation could not quantify the amount of C originating from CWD in the Oe horizon,
they permitted to show that the CWD stocks and their C loss are not sufficient to cause the
difference in radiocarbon signatures through C input alone. It is speculated that a change in the
decomposing community could stimulate decomposition of leaf litter and result in shorter TT of
SOC in the Oe horizon. CWD has the capacity to influence the microbial community of the soil
(Rajala et al. 2012), to affect soil yeast abundance and community composition (Yurkov et al. 2012)
and to increase the size of the fungal community in the soil and cause a shift in the fungal:bacterial
ratio (Brant et al. 2006).
The increase in TT of SOC in the unmanaged forests was only visible in the Oe horizon. There was
no significant management effect on the TT of SOC in the Oa horizon. As the build up of CWD is a
gradual process and the release of C from CWD equally slow, it is possible that the time since
management change has not been sufficient to affect the Oa horizon.
Soil organic carbon turnover in the mineral soil
The TT of SOC in the mineral bulk soil increased with soil depth. The upper 10 cm have TT of SOC
26

of 130-470 years. This time period is longer than the time since management change and the period
since an elevated CWD stock has accumulated in the unmanaged forests. The differences in the TT
of SOC in the bulk soil cannot be attributed to a management effects. Differences in radiocarbon
signatures between the forests were probably existent before the management change. The same was
true for the fPOM fraction at Grübel as well as the oPOM and MaOM fractions at all study sites.
Fig. 1.9: Differences between managed and unmanaged forests in radiocarbon signatures and
SOC stocks of the fPOM fraction in Grübel (a), Ludwigshain (b) and Rohrberg (c).
At Rohrberg and Ludwigshain, the TTs of SOC of the fPOM horizon were generally less than 250
years. Management could thus affect this soil fraction. There were consistent patterns in differences
between managed and unmanaged forests across all soil depths at each forest. At Rohrberg, the
radiocarbon signatures of the fPOM fraction were higher in the unmanaged than in the managed
forest. At Ludwigshain however, the radiocarbon signatures of the fPOM fraction were lower in the
unmanaged than in the managed forest (Fig. 1.9). The differences in SOC stocks between managed
and unmanaged forests in the fPOM fraction also showed consistent patterns across all soil depths.
However, their direction differed between the two study sites. An explanation might be less input of
litter in the unmanaged than in the managed forest at Rohrberg and a shorter TT of SOC in the
fPOM fraction in the unmanaged than in the managed forest at Ludwigshain. Which factors cause
the specific changes could not be evaluated with this study. As the soil type differs between the two
study sites, an opposing effects of enhanced above-ground and reduced below-ground CWD stocks
cannot be excluded. A potential explanation for the lower SOC input to the fPOM fraction in the
unmanaged forest at Rohrberg is a lower SOC stock of below-ground CWD than in the managed
forest. At Ludwigshain, the shorter TT of SOC might be explained by differences in the
decomposing community (see above).
27

ConclusionsThis thesis aimed at comparing the C sequestration potential of managed and unmanaged forests as
influenced by CWD stocks. The study specifically considered Bavarian site conditions. CWD decay
is greatly influenced by biotic and biotic factors that differ between geographical regions of the
world. So far, relatively few studies on CWD have been conducted in temperate forests.
Differences in above-ground CWD properties and disappearance times indicate the differing
potential of European beech, Sessile oak and Norway spruce as lasting CWD pools. Linear models
were used to describe C loss from CWD, despite differences in C loss between decay classes.
Natural variation in CWD properties is important and an easy model sufficient to model C loss from
CWD on a stand level. Beech CWD has a shorter disappearance time than oak and spruce CWD and
by consequence is not as suitable as a lasting CWD stock as the other tree species. CO2
mineralization is the main pathway of C loss, showing that the most C is lost to the atmosphere
before it can contribute to other C pools of the forest ecosystem. However, leaching as DOC can
make up to one forth of the C loss from CWD. A significant C input to the soil is thus possible. As
the amount of C lost from oak CWD through leaching is highest of the investigated tree species, oak
CWD could potentially contribute most to the SOC stocks of the soil.
Below-ground CWD exhibits a greater variability in properties than above-ground CWD.
Calculation of functions to describe decay was not possible. Properties and potential as lasting C
stocks differ between tree species with spruce offering the greatest potential C masses per stump.
Above-ground CWD accumulates, when a forest is withdrawn from management and represents an
important C stock in unmanaged forest ecosystems. Above-ground CWD stocks of 10 to 30 t C ha-1
have accumulated within decades. The CWD stocks continue to increase, showing the potential for
an even higher C sequestration potential. In the managed forests, above-ground CWD stocks
increased in the past decades, however the accumulation occurred at a slower rate than in the
unmanaged forest.
Below-ground CWD represents an additional C stock that is greater in the managed than in the
unmanaged forests. Spruce forests have the potential to store more C in below-ground CWD than
beech or oak forests. Despite the higher below-ground CWD stocks in the managed forests, the total
CWD stocks are more important in the unmanaged forests.
Contributions of above-ground CWD to the N stocks of the forests are substantial in the beech-oak
forests, but not in the spruce forest. Below-ground CWD stocks are greater than above-ground
CWD stocks in the spruce forest, but slight in comparison to the N stock of the forest floor and the
28

mineral soil.
It was assumed, that an elevated CWD stock in the unmanaged forests would increase the SOC
stocks in the forest floor and the mineral soil. However, this was not confirmed in this study.
Management has no influence on the SOC stocks in the forest floor and the mineral soil. Despite
notable C loss as DOC, C from CWD is mostly lost to the atmosphere as CO2, before it can
contribute to other C pools. There were no differences in N stocks of the forest floor and the mineral
soil between managed and unmanaged forests.
Consistent differences in TT of SOC exist between managed and unmanaged forests in the Oe
horizon. The enhanced CWD stocks in the unmanaged forests result in shorter TTs of SOC in the Oe
horizon possibly due to a change in the decomposing community that stimulates leaf litter decay.
Differences in radiocarbon signatures in the mineral soil are not consistent between studied forests
and cannot be attributed to management. This demonstrates that management impact on the SOC
stocks and TT of the mineral soil is small or non-existent. Time periods of decades are not sufficient
to result in relevant changes in SOC turnover in mineral soils. Whether longer time periods would
result in significant changes remains open. However, results suggest that an increase in SOC stocks
in unmanaged forests is not expected.
CWD is an important consistuent of forest biodiversity and seems to influence the decomposing
community of the soil. In regards to conservation efforts, creation of unmanaged forest and efforts
to augment CWD stocks in managed forests are thus of great importance. The potential of CWD to
increase SOC stocks of the soil is slight. Managed forests are thus just as suitable as C sinks as
unmanaged forests.
29

Record of contributions to this thesisChapter 1 and the summary of this thesis were written by me. This dissertation includes three
publications that have been submitted to international peer-reviewed journals. The contributions of
me and all co-authors are listed below.
Chapter 2 Age determination of coarse woody debris with radiocarbon analysis and
dendrochronological cross-dating
Krüger I: 70 % (concepts, field and laboratory work, interpretation, manuscript
preparation)
Muhr J, 10 % (discussions, contributions to manuscript preparation)
Hartl-Meier C: 5 % (laboratory work and discussions)
Schulz C: 5 % (contributions to manuscript preparation)
Borken W: 10 % (concept, discussion, contribution to manuscript preparation)
Chapter 3 Effects of tree species and decay class on DOC and CO2 production of woody debris
Krüger I: 70 % (concepts, laboratory work, interpretation, discussion and presentation
of results, manuscript preparation)
Borken W: 30 % (concepts, discussion, contribution to manuscript preparation)
Chapter 4 Carbon stocks and turnover of coarse woody debris and soil in three managed and
unmanaged forests
Krüger I: 65 % (field and laboratory work, model calculation, interpretation,
discussion and presentation of results, manuscript preparation)
Schulz C: 10 % (concepts, discussion, contribution to manuscript preparation)
Borken W: 25 % (concepts, discussion, contribution to manuscript preparation)
30

ReferencesAber, J. D. (1992). Nitrogen cycling and nitrogen saturation in temperate forest ecosystems. Trends
in ecology & evolution, 7(7), 220–4.
Aussenac, C. (1987). Effects of thinning on the eco-physiology of forest stands. Zeitschrift fuer
Forstwesen. Journal Forestier Suisse,138(8), 685-700.
Ballard, T. M. (2000). Impacts of forest management on northern forest soils. Forest Ecology and
Management, 133(1-2), 37–42.
Batjes, N. (1996). Total carbon and nitrogen in the soils of the world. European Journal of Soil
Science, 47, 151-163.
Bebber, D. P., Thomas, S. C. (2003). Prism sweeps for coarse woody debris. Canadian Journal of
Forest Research, 33(9), 1737–1743.
Bianco, M. Savolainen, H. (1994). Woodworkers’ exposure to tannins. Journal of Applied
Toxicology, 14(4), 293–295.
Boddy, L., Watkinson, S. C. (1995). Wood decomposition, higher fungi, and their role in nutrient
redistribution. Canadian Journal of Botany, 73(S1), 1377–1383.
Böttcher, J., Springob, G. (2001). A carbon balance model for organic layers of acid forest soils.
Journal of Plant Nutrition and Soil Science, 164(4, 4), 399–405.
Brant, J. B., Sulzman, E. W., Myrold, D. D. (2006). Microbial community utilization of added
carbon substrates in response to long-term carbon input manipulation. Soil Biology and
Biochemistry, 38(8), 2219–2232.
Brown, S., Sathaye, J. (1996). Mitigation of carbon emissions to the atmosphere by forest
management. Commonwealth Forestry Review, 75(1), 80-91, 109, 111-112.
Brunner, A., Kimmins, J. P. (2003). Nitrogen fixation in coarse woody debris of Thuja plicata and
Tsuga heterophylla forests on northern Vancouver Island. Canadian Journal of Forest
Research, 33(9), 1670–1682.
Busse, M. D. (1994). Downed Bole-Wood Decomposition in Lodgepole Pine Forests of Central
Oregon. Soil Science Society of America Journal, 58(1), 221–227.
Cannell, M. (2003). Carbon sequestration and biomass energy offset: theoretical, potential and
achievable capacities globally, in Europe and the UK. Biomass and Bioenergy, 24(2), 97-116.
31
Cerli, C., Celi, L., Johansson, M. (2006). Soil organic matter changes in a spruce chronosequence
on Swedish former agricultural soil: I. carbon and lignin dynamics. Soil Science, 171(11), 837-
849.
Chambers, J. Q., Schimel, J. P., Nobre, A. D. (2001). Respiration from coarse wood litter in central
Amazon forests. Biogeochemistry, 52(2), 115–131.
Christensen, M., Hahn, K., Mountford, E. P., Ódor, P., Standovár, T., Rozenbergar, D., Diaci, J.,
Wijdeven, S., Meyer, P., Winter, S., Vrska, T. (2005). Dead wood in European beech (Fagus
sylvatica) forest reserves. Forest Ecology and Management, 210(1-3), 267–282.
Covington, W. (1981). Changes in forest floor organic matter and nutrient content following clear
cutting in northern hardwoods. Ecology, 62(1), 41-48.
Cowling, E. B., Merrill, W. (1966). Nitrogen in wood and its role in wood deterioration. Canadian
Journal of Botany, 44(11), 1539–1554.
Cramer, W., Bondeau, A., Woodward, F. I., Prentice, I. C., Betts, R. A., Brovkin, V., Cox, P. M.,
Fisher, V., Foley, J. A., Friend, A. D., Kucharik, C., Lomas, M. R., Ramankutty, N., Sitch, S.,
Smith, B., White, A., Young-Molling, C. (2001). Global response of terrestrial ecosystem
structure and function to CO2 and climate change: results from six dynamic global vegetation
models. Global Change Biology, 7(4), 357–373.
Crawford, R. L. (1981). Lignin biodegradation and transformation Wiley. New York, 154.
Creed, I., Morrison, D., Nicholas, N. (2004). Is coarse woody debris a net sink or source of nitrogen
in the red spruce Fraser fir forest of the southern Appalachians, USA? Canadian Journal of
Forest Research, 34(3), 716–727.
Crow, S. E., Swanston, C. W., Lajtha, K., Brooks, J. R., Keirstead, H. (2007). Density fractionation
of forest soils: methodological questions and interpretation of incubation results and turnover
time in an ecosystem context. Biogeochemistry, 85(1), 69–90.
Date, R. A. (1973). Nitrogen, a major limitation in the productivity of natural communities, crops
and pastures in the Pacific area. Soil Biology Biochemistry, 5(5), 5-18.
DeGryze, S., Six, J., Paustian, K., Morris, S. J., Paul, E. A., Merckx, R. (2004). Soil organic carbon
pool changes following land-use conversions. Global Change Biology, 10(7), 1120–1132.
Dixon, R., Brown, S. , Houghton, R. A., Soloman, A. M., Trexler, M. C., Wisniewski, J.(1994).
Carbon pools and flux of global forest ecosystems. Science, 263(5144), 185-190.
32

Don, A., Scholten, T., Schulze, E.-D. (2009). Conversion of cropland into grassland: Implications
for soil organic-carbon stocks in two soils with different texture. Journal of Plant Nutrition
and Soil Science, 172(1), 53–62.
Ellis, L. M., Molles, M. C., Crawford, C. S. (1999). Influence of Experimental Flooding on Litter
Dynamics in a Rio Grande Riparian Forest, New Mexico. Restoration Ecology, 7(2), 193–204.
Fahey, T.J., 1983. Nutrient dynamics of aboveground detritus in lodgepole pine (Pinus contorta ssp.
latifolia) ecosystems, southeastern Wyoming. Ecological Monographs, 53(1), p.51-72.
Federer, C. (1984). Organic matter and nitrogen content of the forest floor in even-aged northern
hardwoods. Canadian Journal of Forest Research, 14(6), 763-767.
Fréschet, G. T., Weedon, J. T., Aerts, R., Van Hal, J. R., Cornelissen, J. H. C. (2011). Interspecific
differences in wood decay rates: insights from a new short-term method to study long-term
wood decomposition. Journal of Ecology, 100(1), 161-170.
Fukasawa, Y., Osono, T., Takeda, H. (2009). Dynamics of physicochemical properties and
occurrence of fungal fruit bodies during decomposition of coarse woody debris of Fagus
crenata. Journal of Forest Research, 14(1), 20-29.
Gartner, B. L., North, E. M., Johnson, G. R., Singleton, R. (2002). Effects of live crown on vertical
patterns of wood density and growth in Douglas-fir. Canadian Journal of Forest Research,
32(3), 439-447.
Gaudinski, J. B., Trumbore, S. E., Davidson, E. A., Zheng, S. (2000). Soil carbon cycling in a
temperate forest: radiocarbon-based estimates of residence times, sequestration rates and
partitioning of fluxes. Biogeochemistry, 51(1), 33–69.
Gerstberger, P., Foken, T., Kalbitz, K. (2004). The Lehstenbach and Steinkreuz catchments in NE
Bavaria, Germany.
Goh, K. M. (1991). Bomb carbon. Carbon Isotope Techniques, 1, 147.
Goodale, C. L., Apps, M. J., Birdsey, R. A., Field, C. B., Heath, L. S., Houghton, R. A., Jenkins, J.
C., et al. (2002). Forest carbon sinks in the northern hemisphere. Ecological Applications,
12(3), 891–899.
Goodburn, J. M., Lorimer, C. G. (1998). Cavity trees and coarse woody debris in old-growth and
managed northern hardwood forests in Wisconsin and Michigan. Canadian Journal of Forest
Research, 28(3), 427-438.
33

Goldin, S. R., & Hutchinson, M. F. (2013). Coarse woody debris modifies surface soils of degraded
temperate eucalypt woodlands. Plant and Soil.
Grier, C. C. (1978). A Tsuga heterophylla-Picea sitchensis ecosystem of coastal Oregon:
decomposition and nutrient balances of fallen logs. Canadian Journal of Forest Research, 8(2),
198-206.
Gruber, N., Galloway, J. N. (2008). An Earth-system perspective of the global nitrogen cycle.
Nature, 451(7176), 293-296.
Guo, L., Gifford, R. (2002). Soil carbon stocks and land use change: a meta analysis. Global change
biology, 8(4), 345-360.
Hafner, S. D., Groffman, P. M. (2005). Soil nitrogen cycling under litter and coarse woody debris in
a mixed forest in New York State. Soil Biology and Biochemistry, 37(11), 2159–2162.
Harden, J. W., Trumbore, S. E., Stocks, B. J., Hirsch, A., Gower, S. T., O’Neill, K. P., Kasischke, E.
S. (2000). The role of fire in the boreal carbon budget. Global Change Biology, 6(S1), 174–
184.
Harmon, M., & Franklin, J. (1986). Ecology of coarse woody debris in temperate ecosystems.
Advances in ecological research (15)
Harmon, M. E., Krankina, O. N., Sexton, J. (2000). Decomposition vectors: a new approach to
estimating woody detritus decomposition dynamics. Canadian Journal of Forest Research,
30(1), 76-84.
Harmon M.E. (2001). Carbon Sequestration in Forests: Addressing the Scale Question. Journal of
Forestry, 99(4), 24–29.
Harmon, M. (2009). Woody Detritus its Contribution to Carbon Dynamics of Old-Growth Forests:
the Temporal Context. Old-Growth Forests.
Hedde, M., Aubert, M., Decaëns, T., Bureau, F. (2008). Dynamics of soil carbon in a beechwood
chronosequence forest. Forest Ecology and Management, 255(1), 193–202.
Heilmann-Clausen, J., Christensen, M. (2004). Does size matter? Forest Ecology and Management,
201(1), 105–117.
Hendrickson, O. Q., Chatarpaul L., Burgess D. (1989). Nutrient cycling following whole-tree and
conventional harvest in northern mixed forest. Canadian Journal of Forest Research, 19(6),
34

725-735.
Herrmann, S., Bauhus, J. (2012). Effects of moisture, temperature and decomposition stage on
respirational carbon loss from coarse woody debris (CWD) of important European tree species.
Scandinavian Journal of Forest Research, 1–12.
Hillis, W. E. (1987). Heartwood and tree exudates. Springer Series in Wood Science.
Holeksa, J., Saniga, M., Szwagrzyk, J., Dziedzic, T., Ferenc, S., Wodka, M. (2007). Altitudinal
variability of stand structure and regeneration in the subalpine spruce forests of the Pol’ana
biosphere reserve, Central Slovakia. European Journal of Forest Research, 126(2), 303–313.
Holub, S. M., Spears, J. D. H., Lajtha, K. (2001). A reanalysis of nutrient dynamics in coniferous
coarse woody debris. Canadian Journal of Forest Research, 31(11), 1894–1902.
Homann, P. S., Bormann, B. T., Boyle, J. R., Darbyshire, R. L., Bigley, R. (2008). Soil C and N
minimum detectable changes and treatment differences in a multi-treatment forest experiment.
Forest Ecology and Management, 255(5–6), 1724–1734.
Houghton, R. (2003). Why are estimates of the terrestrial carbon balance so different? Global
change biology, 9(4), 500–509.
Hyde, J. C., Smith, A. M., Ottmar, R. D., Alvarado, E. C., Morgan, P. (2011). The combustion of
sound and rotten coarse woody debris: a review. International Journal of Wildland Fire, 20,
163-174.
Jandl, R., Lindner, M., Vesterdal, L., Bauwens, B., Baritz, R., Hagedorn, F., Johnson, D. W.,
Minkkinen, K., Byrne, K. (2007). How strongly can forest management influence soil carbon
sequestration? Geoderma, 137(3-4), 253–268.
Jobbágy, E. G., Jackson, R. B. (2000). The vertical distribution of soil organic carbon and its
relation to climate and vegetation. Ecological applications, 10(2), 423–436.
Johnson, D. W., Curtis, P. S. (2001). Effects of forest management on soil C and N storage: meta
analysis. Forest Ecology and Management, 140(2–3), 227–238.
Jurgensen, M. F., Tonn, J. R., Graham, R. T., Harvey, A. E., Geier-Hayes, K. (1990). Nirtrogen
fixation in forest soils of the Inland Northwest. In Proceedings–Management and Productivity
of Western Montane Forest Soils, 10-12.
Jurgensen, M. F., Graham, R. T., Larsen, M. J., Harvey, A. E. (1992). Clear-cutting, woody residue
35

removal, and nonsymbiotic nitrogen fixation in forest soils of the Inland Pacific Northwest.
Canadian Journal of Forest Research, 22(8), 1172-1178.
Kahl, T., Mund, M., Bauhus, J. and Schulze, E.D. (2012): Dissolved organic carbon from European
beech coarse woody debris - patterns of input to and retention by surface soil. Ecoscience,
19(4), 1-10.
Kalbitz, K., Kaiser, K. (2008). Contribution of dissolved organic matter to carbon storage in forest
mineral soils. Journal of Plant Nutrition and Soil Science, 171(1), 52-60
Klinka, K., Lavkulich, L., Wang, Q., Feller, M. (1995). Influence of decaying wood on chemical
properties of forest floors and surface mineral soils: a pilot study. Annales des Sciences
Forestières, 52(6), 523–533.
Kramer, H. (1988). Waldwachstumslehre. Waldwachstumslehre. Hamburg [u.a.]: Parey.
Krankina, O., Harmon, M., Griazkin, A. (1999). Nutrient stores and dynamics of woody detritus in a
boreal forest: modeling potential implications at the stand level. Canadian Journal of Forest
Research, 29(1), 20-32.
Kuehne, C., Donath, C., Müller-Using, S. I., Bartsch, N. (2008). Nutrient fluxes via leaching from
coarse woody debris in a Fagus sylvatica forest in the Solling Mountains, Germany. Canadian
Journal of Forest Research, 38(9), 2405–2413.
Kueppers, L. M., Southon, J., Baer, P., Harte, J. (2004). Dead wood biomass and turnover time,
measured by radiocarbon, along a subalpine elevation gradient. Oecologia, 141(4), 641–651.
Käärik, A. (1974). Decomposition of wood. Academic Press London, UK.
Kögel-Knabner, I., Guggenberger, G., Kleber, M., Kandeler, E., Kalbitz, K., Scheu, S., Eusterhues,
K., Leinweber, P. (2008). Organo-mineral associations in temperate soils: Integrating biology,
mineralogy, and organic matter chemistry. Journal of Plant Nutrition and Soil Science, 171(1),
61–82.
Laiho, R., Prescott, C. E. (1999). The contribution of coarse woody debris to carbon, nitrogen, and
phosphorus cycles in three Rocky Mountain coniferous forests. Canadian Journal of Forest
Research, 29(10), 1592–1603.
Laiho, R., Prescott, C. E. (2004). Decay and nutrient dynamics of coarse woody debris in northern
coniferous forests: a synthesis. Canadian Journal of Forest Research, 34(4), 763–777.
36
Lal, R. (2005). Forest soils and carbon sequestration. Forest Ecology and Management, 220(1-3),
242-258.
Lambert, R. L., Lang, G. E., Reiners, W. A. (1980). Loss of Mass and Chemical Change in Decaying
Boles of a Subalpine Balsam Fir Forest. Ecology, 61(6), 1460.
Larson, R. I., Neal Jr, J. L. (1978). Selective colonization of the rhizosphere of wheat by nitrogen-
fixing bacteria. Ecological Bulletins, 26, 331-342.
Lassey, K. R., Manning, M. R., Bernard John, O. B. (1987). An Assessment of the Inventory of
Carbon-14 in the Oceans: An Overview. Institute of Nuclear Sciences.
Lei, H., Milota, M., Gartner, B. (1996). Between-and within-tree variation in the anatomy and
specific gravity of wood in Oregon white oak (Quercus garryana Dougl.). IAWA Journal, 17(4),
445-461.
Leonowicz, A., Matuszewska, A., Luterek, J., Ziegenhagen, D., Wojtaś-Wasilewska, M., Cho, N. S.,
Hofrichter, M., Rogalski, J. (1999) Biodegradation of lignin by white rot fungi. Fungal
genetics and biology, 27(2-3), 175–85.
Levin, I., Kromer, B. (2004). The tropospheric 14CO2 level in mid-latitudes of the Northern
Hemisphere (1959–2003). Radiocarbon, 46(3), 1.
Ligot, G., Lejeune, P., Rondeux, J., Hébert, J. (2012). Assessing and Harmonizing Lying Deadwood
Volume with Regional Forest Inventory Data in Wallonia (Southern Region of Belgium). Open
Forest Science, 5, 15-22.
Luyssaert, S., Ciais, P., Piao, S. L., Schulze, E.-D., Jung, M., Zaehle, S., Schelhaas, M. J.,
Schelhaas, M. J., Reichstein, M., Churkina, G., Papale, D., Abril, G., Beer, C., Grace, J.,
Loustau, D., Matteucci, G., Magnani, F., Nabuurs, G. J., Verbeeck, H., Sulkava, M., Van Der
Werf, G. R., Janssens, I. A. (2010). The European carbon balance. Part 3: forests. Global
Change Biology, 16(5), 1429–1450.
Manies, K. L., Harden, J. W., Bond-Lamberty, B. P., O’Neill, K. P. (2005). Woody debris along an
upland chronosequence in boreal Manitoba and its impact on long-term carbon storage.
Canadian Journal of Forest Research, 35(2), 472–482.
Mattson, K. M., Swank, W. T., Waide, J. B. (1987). Decomposition of woody debris in a
regenerating, clear-cut forest in the Southern Appalachians. Canadian Journal of Forest
Research, 17(7), 712–721.
37

Mattson, K., Swank, W. (1989). Soil and detrital carbon dynamics following forest cutting in the
southern Appalachians. Biology and fertility of soils, 7(3), 247-253.
Melin, Y., Petersson, H., Nordfjell, T. (2009). Decomposition of stump and root systems of Norway
spruce in Sweden–A modelling approach. Forest ecology and management, 257(5), 1445–
1451.
Misson, L., Tang, J. (2005). Influences of recovery from clear-cut, climate variability, and thinning
on the carbon balance of a young ponderosa pine plantation. Agricultural and Forest
Meterorology, 130(3-4), 207-222.
Mukhin, V. A., Voronin, P. Y. (2008). A new source of methane in boreal forests. Applied
Biochemistry and Microbiology, 44(3), 297-299.
Müller-Using, S., & Bartsch, N. (2007). Totholz im Elementhaushalt eines Buchenbestandes.
Forstarchiv, 78, 12-23.
Nave, L. E., Vance, E. D., Swanston, C. W., Curtis, P. S. (2010). Harvest impacts on soil carbon
storage in temperate forests. Forest Ecology and Management, 259(5), 857–866.
Offenthaler, I., Hochbichler, E., 2006. Estimation of root biomass of Austrian forest tree species.
Austrian Journal of Forest Science 123(1/2), 65-86.
Olajuyigbe, S. O., Tobin, B., Gardiner, P., Nieuwenhuis, M. (2011). Stocks and decay dynamics of
above- and belowground coarse woody debris in managed Sitka spruce forests in Ireland.
Forest Ecology and Management, 262(6), 1109–1118.
Olajuyigbe, S., Tobin, B., Nieuwenhuis, M. (2012). Temperature and moisture effects on respiration
rate of decomposing logs in a Sitka spruce plantation in Ireland. Forestry, 85(4), 485-496.
Palviainen, M., Finér, L., Laiho, R., Shorohova, E., Kapitsa, E., Vanha-Majamaa, I. (2010). Carbon
and nitrogen release from decomposing Scots pine, Norway spruce and silver birch stumps.
Forest Ecology and Management, 259(3), 390–398.
Pandey, K. K. (2005). Study of the effect of photo-irradiation on the surface chemistry of wood.
Polymer Degradation and Stability, 90(1), 9–20.
Parton, W., Stewart, J., Cole, C. (1988). Dynamics of C, N, P and S in grassland soils: a model.
Biogeochemistry, 5(1), 109–131.
Poeplau, C., Don, A., Vesterdal, L., Leifeld, J., Van Wesemael, B., Schumacher, J., Gensior, A.
38

(2011). Temporal dynamics of soil organic carbon after land-use change in the temperate zone
– carbon response functions as a model approach. Global Change Biology, 17(7), 2415–2427.
Puech, J.-L., Feuillat, F., Mosedale, J. R. (1999). The Tannins of Oak Heartwood: Structure,
Properties, and Their Influence on Wine Flavor. American Journal of Enology and Viticulture,
50(4), 469–478.
Rajala, T., Peltoniemi, M., Pennanen, T., Mäkipää, R. (2012). Fungal community dynamics in
relation to substrate quality of decaying Norway spruce (Picea abies [L.] Karst.) logs in boreal
forests. FEMS Microbiology Ecology, 81(2), 494–505.
Ranius, T., Niklasson, M., Berg, N. (2009). Development of tree hollows in pedunculate oak
(Quercus robur). Forest Ecology and Management, 257(1), 303–310.
Rock, J., Badeck, F.-W., Harmon, M. E. (2008). Estimating decomposition rate constants for
European tree species from literature sources. European Journal of Forest Research, 127(4),
301–313.
Raulund-Rasmussen, K., De Jong, J., Humphrey, J.W., Smith M., Ravn, H.P., Katzensteiner, K.,
Klimo, E., Szukics, U., Delaney, C., Hansen, K., Stupak, I., Ring, E., Gundersen, P., Loustau,
D. (2006). 5 The impacts of forest management on the carbon cycle. Papers on impacts of
forest management on environmental services.
Schlesinger, W., Andrews, J. (2000). Soil respiration and the global carbon cycle. Biogeochemistry,
48(1977), 7-20.
Schmidt, O. (2006). Wood and Tree Fungi: Biology, Damage, Protection, and Use, Springer.
Schrumpf, M., Schumacher, J., Schöning, I., Schulze, E.-D. (2008). Monitoring Carbon Stock
Changes in European Soils: Process Understanding and Sampling Strategies. In A. J. Dolman,
R. Valentini, & A. Freibauer (Eds.), (Vol. 203, pp. 153–189). Springer New York.
Schulze, K., Borken, W., Muhr, J., Matzner, E. (2009). Stock, turnover time and accumulation of
organic matter in bulk and density fractions of a Podzol soil. European Journal of Soil Science,
60(4), 567–577.
Schöning, I., Totsche, K. U., Kögel-Knabner, I. (2006). Small scale spatial variability of organic
carbon stocks in litter and solum of a forested Luvisol. Geoderma, 136(3–4), 631–642.
Skovsgaard, J., Stupak, I., Vesterdal, L. (2006). Distribution of biomass and carbon in even-aged
stands of Norway spruce (Picea abies (L.) Karst.): A case study on spacing and thinning effects
39

in northern Denmark. Scandinavian journal of Forest Research, 21(6), 470-488.
Song, Z., Vail, A., Sadowsky, M. J., Schilling, J. S. (2012). Competition between two wood-
degrading fungi with distinct influences on residues. FEMS Microbiology Ecology, 79(1), 109–
117.
Spears, J. D. H., Holub, S., Harmon, M., Lajtha, K. (2003). The influence of decomposing logs on
soil biology and nutrient cycling in an old-growth mixed coniferous forest in Oregon, USA.
Canadian Journal of Forest Research, 33(11), 2193–2201.
Spears, J., Lajtha, K. (2005). The imprint of coarse woody debris on soil chemistry in the western
Oregon Cascades. Biogeochemistry, 71(2), 163–175.
Stevens, V. (1997). The ecological role of coarse woody debris: an overview of the ecological
importance of CWD in BC forests. Director, 30(30).
Stevenson, F. J. (1982). Nitrogen in agricultural soils. American Society of Agronomy.
Strukelj, M., Brais, S., Quideau, S. A., Oh, S.-W. (2012). Chemical transformations of deadwood
and foliar litter of mixed boreal species during decomposition. Canadian Journal of Forest
Research, 42(4), 772–788.
Swenson, N. G., Enquist, B. J. (2007). Ecological and evolutionary determinants of a key plant
functional trait: wood density and its community-wide variation across latitude and elevation.
American journal of botany, 94(3), 451–459.
Swift, M. J. (1973). The estimation of mycelial biomass by determination of the hexosamine content
of wood tissue decayed by fungi. Soil Biology and Biochemistry, 5(3), 321–332.
Swift, M. J. (1977). The ecology of wood decomposition. Science progress, 64(254), 175–199.
Topp, W., Kappes, H., Kulfan, J., Zach, P. (2006). Distribution pattern of woodlice (Isopoda) and
millipedes (Diplopoda) in four primeval forests of the Western Carpathians (Central Slovakia).
Soil Biology and Biochemistry, 38(1), 43–50.
Trepkau, B. (2003). DIN 68364 – Kennwerte von Holzarten – Rohdichte, Elastizitätsmodul und
Festigkeiten. Beuth Verlag GmbH, Berlin, 8 S.
Trumbore, S. (2000). Age of soil organic matter and soil respiration: radiocarbon constraints on
belowground dynamics. Ecological Applications, 10(2), 399–411.
Trumbore, S. E., Harden, J. W. (1997). Accumulation and turnover of carbon in organic and mineral
40

soils of the BOREAS northern study area. Journal of Geophysical Research, 102, 28817–
28830.
Tuomi, M., Laiho, R., Repo, A., Liski, J. (2011). Wood decomposition model for boreal forests.
Ecological Modelling, 222(3), 709–718.
Vandekerkhove, K., De Keersmaeker, L., Menke, N., Meyer, P., Verschelde, P. (2009). When nature
takes over from man: Dead wood accumulation in previously managed oak and beech
woodlands in North-western and Central Europe. Forest Ecology and Management, 258(4),
425–435.
Vankooten, G., Eagle, A., Manley, J., Smolak, T. (2004). How costly are carbon offsets? A meta-
analysis of carbon forest sinks. Environmental Science Policy, 7(4), 239-251
Vesala, T. (2005). Effect of thinning on surface fluxes in a boreal forest. Global Biogeochemical
Cycles, 19(2), 1-12.
Vitousek, P. M., Aber, J. D., Howarth, R. W., Likens, G. E., Matson, P. A., Schindler, D. W., et al.
(1997). Human alteration of the global nitrogen cycle: sources and consequences. Ecological
applications, 7(3), 737-750.
Wagai, R., Mayer, L. M., Kitayama, K., Knicker, H. (2008). Climate and parent material controls on
organic matter storage in surface soils: A three-pool, density-separation approach. Geoderma,
147(1–2), 23–33.
Waring, R., Schlesinger, W. (1985). Forest ecosystems. Concepts and management.
Weggler, K., Dobbertin, M., Jüngling, E., Kaufmann, E., & Thürig, E. (2012). Dead wood volume
to dead wood carbon: the issue of conversion factors. European Journal of Forest Research,
131(5), 1423–1438.
Wiesmeier, M., Spörlein, P., Geuß, U., Hangen, E., Haug, S., Reischl, A., Schilling, B., von Lützow,
Margit, Kögel-Knabner, I. (2012). Soil organic carbon stocks in southeast Germany (Bavaria)
as affected by land use, soil type and sampling depth. Global Change Biology, 18(7), 2233–
2245.
Yatskov, M., Harmon, M. E., Krankina, O. N. (2003). A chronosequence of wood decomposition in
the boreal forests of Russia. Canadian Journal of Forest Research, 33(7), 1211–1226.
Yurkov, A., Wehde, T., Kahl, T., Begerow, D. (2012). Aboveground Deadwood Deposition Supports
Development of Soil Yeasts. Diversity, 4(4), 453–474.
41

Chapter 2
Age determination of coarse woody debris with
radiocarbon analysis and dendrochronological cross-dating.
42

Age determination of coarse woody debris with radiocarbon analysis and dendrochronological cross-datingInken Krüger1), Jan Muhr2), Claudia Hartl-Meier3), Christoph Schulz4) and Werner Borken1)
1) Department of Soil Ecology, Bayreuth Center of Ecological and Environmental Research,
University of Bayreuth, Dr.-Hans-Frisch-Str. 1-3, D-95448 Bayreuth, Germany
2) Department of Biogeochemical Processes, Max Plank Institute for Biogeochemistry, Hans-
Knoell-Str. 10, D-07745 Jena, Germany
3) Faculty of Forestry, University of Applied Sciences Weihenstephan-Triesdorf, Hans-Carl-
von-Carlowitz-Platz 3, D-85354 Freising, Germany
4) Bavarian State Institute of Forestry, Hans-Carl-von-Carlowitz-Platz 1, D-85354 Freising,
Germany
Submitted to European Journal of Forest Research
Abstract
To study the decay of coarse woody debris (CWD) in forest ecosystems, it is necessary to determine
the time elapsed since tree death, which is difficult at advanced decay stages. Here, we compare two
methods for age determination of CWD logs, dendrochronological cross-dating and radiocarbon
analysis of the outermost tree ring. The methods were compared using samples from logs of
European beech, Norway spruce and Sessile oak decomposing in situ at three different forest sites.
For dendrochronological cross-dating, we prepared wood discs with diameters of 10-80 cm. For
radiocarbon analysis, cellulose was isolated from shavings of the outermost tree rings. There was an
overall good agreement between time of death determined by the two methods with median
difference of one year. We found no increase in uncertainty with carbon density, despite an increased
nitrogen concentration in the extracted cellulose resulting from incomplete separation of chitin and
other organic nitrogen compounds. A correlation between time since tree death and carbon density
of wood was found for beech and spruce, but, due to the high natural variability, not for oak.
Disappearance times, defined as the period until a piece of woody debris has been reduced to a size
when it is no longer considered as CWD, of 30 years (beech) and 90 years (spruce) were estimated.
The uncertainty of disappearance times results mainly from huge natural variability in carbon
density of CWD rather than uncertainty in the age determination. The results suggest that both
methods are suitable for age determination of CWD.
Keywords: Radiocarbon, Coarse woody debris, CWD, dendrochronological cross-dating, cellulose
43

extraction, time of tree death
IntroductionCoarse woody debris (CWD) has several ecological functions (Harmon et al. 1986) as habitat for
insects, fungi and mosses, and through its role in the nutrient and carbon (C) cycle of forest
ecosystems. The decay rate of CWD is highly variable in dependence of exposure, tree species and
environmental factors (Harmon et al. 1986). Residence times of few decades to centuries are
common in temperate forests (Rock et al. 2008). As long-term experiments on CWD decay are rare
(Stone et al. 1998), chronosequence approaches are often used to estimate residence times
(Kueppers et al. 2004). One prerequisite for the estimation of decay is the age of CWD (i.e. the time
elapsed since death of the tree or branch) (Harmon et al. 1986). In case the tree death is linked to
distinct events like fire, storm or harvesting, historical records might be used to determine the time
of tree death, but usually more sophisticated methods are needed. Dendrochronological cross-dating
is commonly used for the determination of time of tree death of CWD (Daniels et al. 1997,
Lombardi et al. 2008, Castagneri et al. 2010). We know of only one study by Kueppers et al. (2004)
that used radiocarbon analysis.
The bomb-radiocarbon approach makes use of the annual change of the atmospheric radiocarbon
signature triggered by nuclear weapon testing in the 1950s and 60s and subsequent dilution or
uptake processes. Because of photosynthetic CO2 fixation the radiocarbon signatures of tree rings
correlate with the respective atmospheric radiocarbon signatures (Worbes & Junk 1989). As the
annual rate of change of the atmospheric radiocarbon signature has been bigger than the current
measurement precision for the last decades, we can clearly distinguish the radiocarbon signature of
two subsequent years. Radiocarbon analysis requires only a small quantity of wood from the
outermost tree ring.
Dendrochronological cross-dating exploits the similarity in weather-dependent patterns of tree ring
width sequences or other growth ring characteristics in trees of the same species and from the same
climatic region (Schweingruber 1988). It has proved to be a reliable age determination technique.
This method can be difficult or even impossible at advanced decay stages, as decaying CWD loses
its stability and density and the formation of holes is notable (Harmon et al. 1986), making the
correct identification of the outermost tree ring difficult (Schweingruber 2007, Campbell & Laroque
2006). The combination of dendrochronology and radiocarbon analysis has been used to estimate
annual changes in the radiocarbon signature of CO2 in the atmosphere before the 1950s (Leavitt &
Bannister 2009).
44

In this study we compared radiocarbon analysis with dendrochronological cross-dating of wood
discs of European beech, Sessile oak and Norway spruce from three different study sites. We tested
the suitability of both methods and investigated how tree ages relate to C density of CWD
calculated from C concentration and wood density. Disappearance times of CWD, defined as the
period until a piece of woody debris has been reduced by density loss and fractionation to a diameter
of less than 7 cm when it is no longer considered as CWD, were calculated for each of the tree
species.
Material and methods
Study sites
Samples were collected at three unmanaged forests in Bavaria, Germany: Grübel (49°07’ N 013°07’
E), Ludwigshain (49°55’ 011°48’ E) and Rohrberg (49°54’ N 009°26’ E). Grübel is a Norway spruce
(Picea abies L.) forest reserve situated in the Bavarian Forest at an altitude of 1250 m a.s.l.. Mean
annual air temperature is 3-4°C and mean annual precipitation is 1500 mm. The formerly managed
forest has been protected since 1978 and the CWD stock amounted to 12 t C ha-1 in 2010 (Krüger et
al. in prep). Ludwigshain is a beech-oak (Fagus sylvatica L., Quercus petraea (Matt.) Liebl.) forest
that has been unmanaged since 1913 and is well known for ancient oaks of 450 years. Mean annual
temperature is 7-8°C and precipitation accumulates to 650-750 mm a-1. Total above-ground CWD
stocks are 30 t C ha-1 in 2010 (Krüger et al. in prep). Rohrberg is a beech-oak forest that has been
unmanaged since 1928. The oaks are up to 600 year old. Mean annual air temperature ranges from
7-8°C and precipitation from 950-1100 mm a-1. The CWD stock was 24 t C ha-1 in 2010 (Krüger et
al. in prep).
Sampling procedures
A total of 56 CWD logs of at least 20 cm in diameter were selected for analysis. For determining
CWD characteristics (wood density, C concentration), up to 10 wood samples per log were taken
with a power drill with a diameter of 2 cm. All wood shavings were collected and subsequently
dried at 60°C until constant mass. Wood density was calculated from dry mass and the volume of
the drill hole. Sub-samples were ground with a ball mill for C and N analysis (Elementar Vario EL,
Hanau, Germany).
For radiocarbon analysis, we took samples of the outermost tree ring with a utility knife. The blade
was exchanged between two samplings to avoid cross-contamination. The samples were ground
before the cellulose extraction. One tree segment of each log was taken with a motor saw for
45

dendrochronological cross-dating.
Radiocarbon dating
Cellulose is commonly isolated from wood for isotope analysis (Gaudinski et al. 2005). While non-
structural wood compounds might cross tree ring boundaries, cellulose is synthesized with C fixed
in the year of ring formation (Mazany et al. 1980). Lignification of wood tissue occurs after
cellulose formation (Fritts 1976). We thus assume that contamination with lignin-containing
compounds has no or little impact on radiocarbon signatures. For cellulose extraction, we used a
method adapted from the Jayme-Wise protocol (Green 1963). Hereafter, 40-50 mg of wood was
processed for extraction of α-cellulose. The milled samples were processed in cuvettes with glass
fiber filters. Extractable wood substances were extracted with a 1:1 toluene-ethanol mixture in a
soxhlet extractor. Subsequently, the remaining samples were treated with a CH3COOH-NaClO2
mixture and subsequently 5% NaOH solution at 80°C. Between extraction steps, the samples were
rinsed with a 15% NaCl solution. These extraction steps were repeated at least three times and until
the remaining sample had a white colour. The samples were then rinsed with 1% HCl and
subsequently with distilled water for a period of at least 12h. The cellulose was freeze-dried until
mass constancy. To assess the quality of cellulose, total C and N was measured with a with a CN
analyser (Elementar Vario EL, Hanau, Germany) by the Central Analytics of the Bayreuth Center of
Environmental and Ecological Research (BayCEER). Further, δ13C of the cellulose was measured
with a MAT 252 IRMS at the stable isotope lab of the Max Planck Institute for Biogeochemsitry in
Jena. Industrial cellulose (Sigma chemicals, St Louis, USA), chitin and chitinose (Acros organics,
New Jersey, USA) as well as Heidelberger Nullholz and the wood standards C-4 and C-5 from the
International Atomic Energy Agency (IAEA) (Rozanski et al. 1992) were used as standards for
radiocarbon analysis. The yield of cellulose is calculated from the difference of the original sample
weight and the weight of the extracted cellulose.
Radiocarbon signatures of cellulose were measured by accelerator mass spectrometry (AMS).
Subsamples of 0.7 - 1.1 mg C were combusted in sealed quartz tubes with CuO as oxidizer and
silver wire for 2 hours at 900°C. The resulting CO2 was cryogenically purified from water and non-
condensable compounds and converted to graphite targets using the modified sealed tube zinc
reduction method described by Xu et al. (2007). Radiocarbon data are expressed as Δ14C, which is
the per mil deviation from the 14C/12C ratio of oxalic acid standard in 1950. The sample 14C/12C ratio
has been corrected to a δ13C value of -25‰ to account for any mass dependent fractionation effects
(Stuiver & Polach 1977). Δ14C signatures were dated to calendar years using the CALIBomb
46

Radiocarbon calibration online tool (Reimer et al. 2004). For post-bomb radiocarbon signatures,
two calendar years are possible. The younger age was attributed to the time of tree death. The
cellulose extraction and sample combustion were processed at the laboratory of 14C analyses at the
Max Planck Institute for Biogeochemistry in Jena. Graphite targets were prepared at the Department
of Soil Ecology at the University of Bayreuth. The AMS measurements were performed by the
Keck-CCAMS facility of the University of California, Irvine with a precision of 2-5‰.
Dendrochronological cross-dating
All wood segments were dried prior to further preparation. Heavily decomposed wood was
immersed in paraffin at 60°C to prevent rupture and breaking (Hall 1939). Less decomposed wood
was polished with sandpaper with granulation of 100 grit. Wet chalk was used to increase the
visibility of tree ring boundaries (Schweingruber, 1983). Ring widths were measured to the nearest
0.01 mm using a measuring device (LINTAB 6; Rinntech, Heidelberg, Germany) with a stereo
microscope (MZ 6; Leica, Wetzlar; Germany) and the TSAP-Win software package (Rinn 2003).
Tree ring widths were measured along two radii following the longest and shortest radius.
Site chronologies were compiled from 6-12 wood disks of living trees for each tree species and
study site, in order to build up reference chronologies for the CWD. The quality of the site
chronologies were tested with the dplR package for R (Bunn 2008) using series inter-correlation
(Rbar), Expressed Population Signal (EPS) and Gleichläufigkeit (Glk).
Tree ring sequences were measured along at least two radii at postions with a surely identified
outermost tree ring and the smallest amount of major constraints including softness of wood or
holes. All measurements were conducted at the Faculty of Forestry, University of Applied Science
Weihenstephan-Triesdorf.
The dating of tree death was obtained through visual cross-dating of CWD samples with the
corresponding site chronology with the software Corina 1.1 β (The Cornell Tree Ring Analysis
System). Additionally, the software was used to calculate correlation analyses based on student’s t-
test (t values), series inter-correlation (Rbar) as well as Gleichläufigkeit (Glk) to cross-date the tree
ring sequence with the site chronologies. All results that gave an end of the sequence set after 2009
were excluded. Based on what is known about the decay rate of the observed tree species (Rock et
al. 2008) as well as site history we also excluded all results that gave end dates before 1935. If
uncertainties on the correct date remained, the tree ring sequences were visually compared with
other sequences of CWD of the same tree species and the same study site. Precision of the method
depends on the number of overlapping years and by consequence the length of the individual tree
47

ring sequences.
Data analysis
The C density of CWD is calculated from the density and the C concentration of CWD. Decay of
CWD is described through disappearance time defined as the time period from tree death to
reduction in size to the point where the piece is no longer considered as CWD (less than 7 cm at the
largest diameter). Differences between tree species were tested with a Student’s t-test with a
confidence interval of p<0.05. If not otherwise specified, calculations were performed with R 2.9.2
(R Development Core Team 2009).
Results
Properties of cellulose and radiocarbon dating
Fig. 2.1: Properties of extracted cellulose: Yields of cellulose extraction in % per tree species
(a) and carbon and nitrogen concentration of extracted cellulose in % (b).
We found cellulose yields, defined as mass-% of the original sample after extraction, of 17 – 38 %
for the different wood standards with a good reproducibility (data not shown). Pure industrial
cellulose had a recovery rate of 81.2 ± 0.3 % (SD, n=4). For the CWD samples, cellulose yields
ranged between 6 and 39 % (Fig 2.1a). We found significant differences between tree species
(p<0.001), but no correlations with C density of CWD.
Mean C concentration (± SD) in the extracted cellulose was lower in oak (39.5 ± 3.9 %) than in
beech (42.1 ± 0.7 %) and spruce (42.2 ± 0.6 %). In 6 out of 56 samples, the C concentration was
48

below 40 %. 13 samples contained measurable N concentrations (>0.05 %) whereas the N
concentration of the remaining samples was below the detection limit (Fig 2.1b). Mean δ13C of
cellulose was -23.2 ‰ ± 1.3 ‰ without significant differences between the three tree species. Δ14C
signatures of the outermost tree rings ranged between -34 and 660 ‰. Five samples were dated to
the time period before the bomb-peak. 51 samples could be attributed to calendar years between
1959 and 2006.
Dendrochronological cross-dating
The length of the site chronologies was between 94 and 244 years. The Rbar values range between
0.45 and 0.65 and EPS between 0.82 and 0.93, therefore the reference chronologies provide good
data quality (Table 2.1). With respect to wood characteristics and tree age, between 43 and 286 rings
were measured per CWD segment. Fig. 2.2 shows samples of the wood anatomy at different stages
of decay and the tree species specific changes in CWD. Beech CWD becomes soft and tree rings
gradually less visible. Oak CWD is marked by the formation of holes and spruce CWD by cracks
along tree ring boundaries.
Fig. 2.2: Samples of coarse woody debris of Sessile oak (a), European beech (b) and Norway
spruce (c) at different stages of decay.
Based on dendrochronological cross-dating, the investigated trees had died between 1942 and 2006.
49

The distribution differed between the tree species: for beech the oldest CWD originated from 1981,
while four samples of oak and one sample of spruce were dated to the period prior to the bomb peak
in the 1950s.
Comparison of radiocarbon and dendrochronological dating
We found a good correlation between year of death as determined by radiocarbon dating vs.
dendrochronological cross-dating (R²=0.96) (Fig. 2.3). The average difference between radiocarbon
and dendrochronological dating were 2.05 years with a median value of one year. Radiocarbon
dating revealed a younger time of death in 13 cases and an older death year in 17 cases. No
differences between radiocarbon analysis and dendrochronological cross-dating were found for tree
species, study sites or C density of CWD.
Fig. 2.3: Time of tree death as determined by dendrochronological cross-dating
(dendrochronological time) and radiocarbon analysis of the uttermost year ring (radiocarbon
time) for the tree species European beech, Sessile oak and Norway spruce. Full bullets
designate enhanced nitrogen concentration in the cellulose.
50

Table 2.1: Characteristics of site chronologies.
Study site Tree species Period Number oftrees
rbar EPS Glk[%]
Grübel Norway spruce 1759-2010 6 0.50 0.82 52
Ludwigshain European beech 1916-2009 12 0.51 0.91 63
Ludwigshain Sessile oak 1907-2009 8 0.65 0.93 64
Rohrberg European beech 1938-2009 7 0.45 0.84 68
Rohrberg Sessile oak 1848-2009 10 0.46 0.93 64
Table 2.2: Correlation between time of tree death and C density for the tree species European beech, Sessile oak and Norway spruce.
Tree species Method adjusted R² p n disappearance time[a]
European beech average y=-15916.0+8.0x 0.61 <0.001 22 33
dendrochronoly y=-15760.0+8.0x 0.62 <0.001 22 33
radiocarbon y=-15976.0+8.1x 0.60 <0.001 22 32
Sessile oak average y=-2294.4+1.2x 0.08 0.16 16 169
dendrochronoly y=-2279.5+1.2x 0.07 0.16 16 171
radiocarbon y=-2074.1+1.1x 0.05 0.19 16 182
Norway spruce average y=-5104.7+2.7x 0.57 <0.001 16 92
dendrochronoly y=-4853.6+2.5x 0.55 <0.001 16 95
radiocarbon y=-5194.5+2.7x 0.59 <0.001 16 90

CWD density varied between 80 and 630 kg m-3 for beech, 140 and 480 kg m-3 for oak and 60 and
510 kg m-3 for spruce. C concentration ranged between 46 and 56 % for all species, resulting in C
densities of CWD of 29 to 307 kg C m-3. Positive correlations between average time of tree death
and C density were found for beech and spruce, but not for oak (Fig. 2.4). Differences in decay
functions between dendrochronological data and radiocarbon data were slight (Table 2.2).
Disappearance times are estimated at 30 years for beech and about 90 years for spruce.
Fig. 2.4: Relation between time since tree death and C density of coarse woody debris for the
tree species European beech (a), Sessile oak (b) and Norway spruce (c).
52

Discussion
Properties of cellulose and constraints of radiocarbon analysis
The observed cellulose yields for CWD samples between 6 and 39 % were considerably lower than
the values reported for fresh wood samples of up to 68 % (Gaudinski et al. 2005). These differences
can be explained only partly by incomplete extraction due to the method, as we measured a recovery
rate of about 80% for the extraction of pure cellulose. Decay of wood usually results in the
preferential loss of cellulose and thus a relative increase of lignin, resins and waxes (Preston et al.
2006), which could explain the low cellulose yields in the CWD samples. The lowest yield was
found for oak CWD, likely for two reasons: (1) Live oak wood is known to have a smaller initial
cellulose concentration (ca. 40%) than beech (43%) and spruce (49%) (Thygesen et al. 2005,
Pettersen 1984, Kollmann & Fengel 1965, Fengel & Wegener 1984); (2) Decomposition of oak
wood is dominated by brown-rot fungi, which preferentially decompose cellulose while leaving
lignin mostly intact, whereas beech and spruce wood are known to be decomposed by white-rot
fungi, which decompose cellulose and lignin at a nearly equal rate (Leonowicz et al. 1999).
With an average of 41 %, the C concentration of the extracted cellulose is lower than the 44 % C of
pure cellulose polymer. Other methods of cellulose extraction do not have this problem, reporting C
concentration in the extracted cellulose closer to the expected values (Brendel et al. 1999). The
lower C concentrations in our measurements are most likely to be explained by a dilution effect:
Weighing of the glass fibre filters that we used, before and after the extraction procedure, indicate a
weight loss of the filters. As the filters are C-free, the addition of filter material to the samples
would result in a decrease of the C concentration without affecting any of the isotopic
measurements. The measured weight losses were big enough to explain the observed differences in
C concentration. We found no correlation between 13C signatures and C concentration , affirming
that isotope measurements were not affected by a presumed contamination of the samples.
We speculate that chitin produced by fungi during the decay of CWD could explain the increased N
concentrations found in some of the samples. The treatment of chitin revealed that chitin is not at all
removed by the procedure we used (data not shown). The presence of chitin in wood samples is a
problem for age determination by radiocarbon analysis of CWD samples as chitin has a different
radiocarbon signature than cellulose of in the outermost tree ring. Undecayed wood contains only
small amounts of chitin (Jones & Worrall 1995). Because of increasing colonization by fungi both
the chitin and N concentration of CWD increases with decay (Holub et al. 2001). The increased
amount of chitin or other organic N compounds might make the extraction of cellulose less effective
53
in heavily decayed CWD samples. The C:N ratio of 210 to 80 found in the cellulose would be
explained by a dilution of cellulose with about 3 to 8 % chitin. An increase in N concentration
during cellulose extraction is commonly observed in most extraction methods (Gaudinski et al.
2005). As no N containing chemicals were utilized during sample preparation the N must originate
from the CWD sample.
The within tree ring difference of δ13C of cellulose is typically 1 – 2 ‰ (Leavitt & Long 1984).
Measured differences between samples are thus within natural variations of tree rings. CWD is less
depleted in δ13C than cellulose extracted from undecayed wood (Leavitt & Danzer 1993). With
increasing decomposition the δ13C concentration of organic material increases due to microbial
fractionation (Preston et al. 2009). Schleser et al. (1999) found a depletion of δ13C of cellulose for
thermally decayed wood corroborating the change of δ13C signatures of CWD due to decay.
The five CWD samples with negative Δ14C signatures, that correspond to calendar years before
1955, belong to the tree species spruce and oak. The CWD logs must have resided in the forests for
at least 65 years, which is common for CWD of spruce and oak (Holeska et al. 2006, Harmon et al.
1986).
Constraints of dendrochronological cross-dating
Dendrochronological studies of CWD are more challenging than studies of living trees. The changes
due to the decay of CWD affect the completeness of the outermost tree ring, the choice of radii
position and the visibility of the tree rings. With advancing decay, density and stability of CWD
decreases (Harmon et al. 1986). This affects the correct identification of tree ring boundaries
resulting in missing tree rings or incorrect tree ring widths.
By extracting wood segments like disks instead of increment cores, the difficulties resulting from
decay were remediated to some extent. As a disadvantage, segments are larger and more difficult to
handle than core samples, but allow choosing the best suited radii after examination of the entire
section. Nonetheless, the significance of the correlation analysis was affected by decay. Calculated
algorithms are on the lower scale of what is commonly considered statistically significant for some
of the CWD measurements.
We found the effects of decay on wood anatomy to be species-dependent. Samples of beech often
showed symptoms of white-rot decay that disintegrates wood structure and reduces it to its
components cellulose, hemicelluloses and lignin (Schweingruber 2008). Discoloration of wood,
often the first visible effect of decay, does not affect the identification of tree rings. At later stages of
decay, however, tree ring boundaries become difficult to see or even invisible. This process usually
54

occurs from the outside to the inside, in consequence reducing the length of the usable sequence. In
spruce CWD, the formation of cracks along tree ring boundaries was often noted and restricted the
positioning of the recorded radii. Decay of oak CWD leads to the formation of holes, but it does not
affect the visibility of tree ring boundaries until advanced stages of decay.
While sequences are statistically compared with standardized methods, dendrochronological cross-
dating necessitates the restriction to a certain time interval. While such restrictions are based on
scientific observations and reliable accounts, they remain to some extent subjective and might differ
between users.
Comparison of analysis methods and coarse woody debris carbon density
We found a good correlation between radiocarbon analysis and dendrochronological cross-dating
that was not affected by the state of decay, the tree species and the study sites. This indicates that
despite constraints, both methods are equally reliable techniques to estimate the year of tree death.
Radiocarbon analysis can be the favourable method for standing CWD that cannot be sampled by
motor saw and for CWD were the outermost tree ring is only intact on a small area or decay occurs
from the inner to the outer wood. Dendrochronological cross-dating is more suitable for CWD that
is expected to have slow decay rates, as found in CWD of decay resistant tree species or at
unfavourable study sites.
Besides practicability, the decision to apply a method is based on factors like time and cost. Both
methods are time intensive and require special equipment. Their efficiency partially depends on the
number of samples, age as well as their diversity regarding geographical origin and tree species.
Each region and tree species requires an individual site or reference chronology that needs to be
compiled from trees of known age. The compilation of a site chronology requires a need to record a
certain number of tree ring width sequences in addition to the CWD samples. This is more
worthwhile the more samples need to be dated. If a reference chronology is existent,
dendrochronological cross-dating represents a cheaper way to date a large number of samples than
radiocarbon analysis.
Age determination of tree rings by radiocarbon analysis is barely dependent on the geographical
region and the tree species. In mixed forests with many tree species, classification of heavily
decayed CWD logs to tree species is problematic if wood characteristics are similar. In such cases,
radiocarbon analysis is an alternative method of age determination. Further radiocarbon analysis can
be more time efficient if the number of CWD samples is small.
55

A correlation between time since tree death and C density of CWD was found for European beech
and Norway spruce. For Sessile oak no correlation was found. Decay rates can greatly vary
depending on the decomposition conditions and the contact of CWD to soil fungi (Holeska et al.
2008). Further, large branches or even parts of the stem of oak trees can die and decay while other
parts of the trees are still alive for many decades, resulting in a non-uniform year of death for
different parts of these trees (Ranius et al. 2009). In such a tree, some parts would already decay and
loose C, while new tree rings could still be formed in others. For this reason, decay rate of CWD
may vary within a tree. Despite differences of up to 5 years between radiocarbon analysis and
dendrochronological cross-dating, both methods yield similar decay functions and disappearance
times for beech and spruce. Overall, the variations in CWD characteristics cause a greater
uncertainty for the calculation of decay rates than the both studied methods of age determination.
ConclusionsOur results show that radiocarbon analysis and dendrochronological cross-dating revealed similar
year of tree death and are in most cases suitable for age determination of CWD. Both methods are
constrained by CWD decay, though we found these not to affect the quality of the dating procedure.
Radiocarbon analyses are less destructive and only require small samples. On the other hand, CWD
can only be radiocarbon dated for the time period since the 1950s and the method is thus not
suitable for old CWD of species with long turnover times. Calculation of disappearance times was
possible for Norway spruce and European beech, but not for Sessile oak.
AcknowledgmentsThis work was founded by the Bavarian Ministry for Nutrition, Agriculture and Forestry. We want to
thank the forest rangers of Grübel, Ludwigshain and Rohrberg for providing wood disk for the
standard chronologies and for enabling us to sample CWD in the unmanaged forests. Further, we
want to express our gratitude to Helga Hertel-Kolb, Felix Klein and Caroline Stöhr for help in the
field. We are indebted to Heike Machts and Axel Steinhof for assistance with cellulose extraction.
56

References Brendel O., Iannetta P. P. M., Stewart D. (2000) A rapid and simple method to isolate pure al-
pha-cellulose. Phytochemical Analysis 11(1), 7–10.
Bunn A. G. (2008) A dendrochronology program library in R (dplR). Dendrochronologia 26(2),
115–124.
Campbell L. J., Laroque C. P. (2007) Decay progression and classification in two old-growth forests
in Atlantic Canada. Forest Ecology and Management 238(1-3), 293–301.
Castagneri D., Garbarino M., Berretti R., Motta R. (2010) Site and stand effects on coarse woody
debris in montane mixed forests of Eastern Italian Alps. Forest Ecolology and Management
260(9), 1592-1598.
Daniels L. D., Dobry J., Klinka K., Feller M. (2011) Determining year of death of logs and snags of
Thuja plicata in southwestern coastal British Columbia. Canadian Journal of Forest Research
27(7), 1132-1141.
Fengel D., Wegner G. (1983) Wood: Chemistry, Ultrastructure, Reactions. Walter de Gruyter: Ber-
lin, New York.
Fritts H. (1976) Tree rings and climate. London, New York, San Francisco.: Academic Press.
Gaudinski J. B., Trumbore S. E., Davidson E. A., Zheng S. (2000) Soil carbon cycling in a temper-
ate forest: radiocarbon-based estimates of residence times, sequestration rates and partitioning
of fluxes. Biogeochemistry 51(1), 33–69.
Green J. W. (1963) Methods of Carbohydrate Chemistry, III, R.L. Whistler (Ed.), Academic Press,
NewYork, NY, 9-21.
Hall J. E. (1939) A method for obtaining a plane surface on charcoal. Tree-Ring Bulletin 5, 31.
Harmon M. E., Franklin J. F., Swanson F. J., Sollins P., Gregory S. V., Lattin J. D., Anderson N. H.,
Cline S. P., Aumen N. G., Sedell J. R., Lienkaemper G. W., Cromack K. J. R., Cummins K. W.
(1986) Ecology of coarse woody debris in temperate ecosystems. Advances in ecological re-
search 15, 133–302.
Holeksa J., Zielonka T., Żywiec M. (2008) Modeling the decay of coarse woody debris in a sub-
alpine Norway spruce forest of the West Carpathians, Poland. Canadian Journal of Forest
Research 38(3), 415–428.
57

Holub S. M., Spears J. D. H., Lajtha K. (2001) A reanalysis of nutrient dynamics in coniferous
coarse woody debris. Canadian Journal of Forest Research 31(11), 1894–1902.
Jones H. L., Worrall J. J. (1995) Fungal biomass in decayed wood. Mycologia 87(4), 459-466.
Kleman-Leyer K., Agosin E., Conner A. H., Kirk T. K. (1992) Changes in Molecular Size Distribu-
tion of Cellulose during Attack by White Rot and Brown Rot Fungi. Applied Environmental
Microbiology 58(4), 1266–1270.
Kollmann F., Fengel D. (1965) Änderung der chemischen Zusammensetzung von Holz durch ther-
mische Behandlung. Holz Roh- Werkstoff 23, 461-468.
Krüger I., Schulz C., Borken W. (in prep) Carbon stocks and turnover of coarse woody debris and
soil in three managed and unmanaged temperate forests.
Kueppers L. M., Southon J., Baer P., Harte J. (2004) Dead wood biomass and turnover time, meas-
ured by radiocarbon, along a subalpine elevation gradient. Oecologia 141(4), 641–651.
Leavitt S. W., Bannister B. (2009) Dendrochronology and radiocarbon dating. The laboratory of
tree-ring research connection. Radiocarbon 51(1), 373–384.
Leavitt S. W., Danzer S. R. (1993) Method for batch processing small wood samples to holocellu-
lose for stable-carbon isotope analysis. Analytical Chemistry 65(1), 87–89.
Leavitt S. W., Long A. (1984) Sampling strategy for stable carbon isotope analysis of tree rings in
pine. Nature 311(5982), 145–147.
Leonowicz A., Matuszewska A., Luterek J., Ziegenhagen D., Wojtaś-Wasilewska M., Cho N. S.,
Hofrichter M., Rogalski J. (1999) Biodegradation of lignin by white rot fungi. Fungal
Genetetics and Biology 27(2-3), 175–85.
Lombardi F., Cherubini P., Lasserre B., Tognetti R., Marchetti M. (2008) Tree rings used to assess
time since death of deadwood of different decay classes in beech and silver fir forests in the
central Apennines (Molise, Italy). Canadian Journal of Forest Research 38(4), 821-833..
Mazany T., Lerman J. C., Long A. (1980) Carbon-13 in tree-ring cellulose as an indicator of past cli-
mates. Nature 287(5781), 432–435.
Pettersen R. C. (1984) The chemical composition of wood, In:Rowell, Roger M., ed. The chemistry
of solid wood. Advances in chemistry series 207(2). Washington, DC: American Chemical So-
ciety, 57-126.
58

Preston C., Trofymow J., Flanagan L. (2006) Decomposition, δ13C, and the “lignin paradox.” Ca-
nadian Journal of Soil Science 86(Special Issue), 235–245.
Preston C. M., Nault J. R., Trofymow J. A. (2009) Chemical Changes During 6 Years of Decompos-
ition of 11 Litters in Some Canadian Forest Sites. Part 2. 13C Abundance, Solid-State 13C
NMR Spectroscopy and the Meaning of “Lignin.”. Ecosystems 12(7), 1078–1102.
R Development Core Team (2009) R: A Language and Environment for Statistical Computing. Vi-
enna, Austria: R Foundation for Statistical Computing.
Ranius T., Niklasson M., Berg N. (2009) Development of tree hollows in pedunculate oak (Quercus
robur). Forest Ecology and Management 257(1), 303–310.
Reimer P. J., Brown T. A., Reimer R. W. (2004) Discussion: reporting and calibration of post-bomb
14C data. Radiocarbon 46(3), 1299-1304.
Rinn, F. (2003) TSAP-Win User Reference Manual. Rinntech, Heidelberg.
Rock J., Badeck F. W., Harmon M. E. (2008) Estimating decomposition rate constants for European
tree species from literature sources. European Journal of Forest Research 127(4), 301–313.
Rozanski K., Stichler W., Gonfcantini R., Scott E. M., Beukens R. P., Kromer B., Plicht J. V. D.
(1992) The IAEA 14C Intercomparison Exercise 1990. Radiocarbon 34(3), 506-519.
Schleser G. H., Frielingsdorf J., Blair A. (1999) Carbon isotope behaviour in wood and cellulose
during artificial aging. Chemical Geology 158(1-2), 121–130.
Schweingruber F. H. (1983) Der Jahrring: Standort, Methodik, Zeit und Klima in der
Dendrochronologie. Paul Haupt, Bern, Stuttgart, Wien.
Schweingruber F. H. (1988) Tree rings-basics and applications of dendrochronology. D. Reidel
Publishing Company.
Schweingruber F. H. (2007) Wood Structure and Environment. Berlin, Heidelberg, Springer.
Stone J. N., MacKinnon A., Parminter J. V., Lertzman K. P. (1998) Coarse woody debris decompos-
ition documented over 65 years on southern Vancouver Island. Canadian Journal of Forest
Research 28(5), 788–793.
Stuiver M., Polach H. A. (1977) Discussion: reporting of C-14 data. Radiocarbon 19(3), 355-363.
Thygesen A., Oddershede J., Lilholt H., Thomsen A. B., Ståhl K. (2005) On the determination of
crystallinity and cellulose content in plant fibres. Cellulose 12(6), 563–576.
59

Worbes M., Junk W. J. (1989) Dating Tropical Trees by Means of ^14C From Bomb Tests. Ecology
70(2), 503.
Xu X., Trumbore S. E., Zheng S., Southon J. R., McDuffee K. E., Luttgen M., Liu J. C. (2007)
Modifying a sealed tube zinc reduction method for preparation of AMS graphite targets: Redu-
cing background and attaining high precision. Nuclear Instruments and Methods in Physics
Research Section B: Beam Interactions with Materials and Atoms 259(1), 320–329.
60

Chapter 3
Effects of tree species and decay class on
DOC and CO2 production of woody debris.
61

Effects of tree species and decay class on DOC and CO2
production of woody debrisInken Krüger1), Werner Borken1)
1) Department of Soil Ecology, Bayreuth Center of Ecology and Environmental Research,
University of Bayreuth, Dr.-Hans-Frisch-Str. 1-3, D-95448 Bayreuth, Germany
Submitted to Journal of Plant Nutrition and Soil Science
AbstractWoody debris is an important component in the carbon (C) cycle of forest ecosystems, but the
release of dissolved organic carbon (DOC) and CO2 as influenced by tree species and decay class is
widely unknown. A laboratory experiment with woody debris of European beech, Sessile oak,
Norway spruce in three decay stages (fresh (DC-1), penetrable with a knife (DC-3), breakable with
fingers (DC-5)) was carried out over a period of 380 days. Quantity and quality of DOC in leachates
as well as CO2 production were measured in regular intervals. To test the influence of an easily
available C source on DOC and CO2 production, additional woody debris samples were treated with
a 600 mM glucose solution. The pH, humification index and specific ultra-violet absorption of
leachates were measured to describe DOC.
Woody debris lost between 1 and 15% of its initial C within 380 days. DOC contributed 3-54% to
the total C loss. Total C loss increased in the order spruce<oak<beech. At early decay stages, DOC
contributed most to C loss of oak. At DC-5, DOC contribution from beech and oak are of similar
range. DOC and CO2 production generally increased with decay class. The pH values of leachates
ranged between 4.18 and 5.61 and were lowest for oak and for samples at DC-5 of all tree species.
Humification indices and specific UV absorption of leachates increased with decay class. The
addition of glucose did not influence the quantity and quality of leached DOC or CO2 production.
Our results suggest that CO2 production is the main path of woody debris decay, but DOC leaching
is relevant as input to the soil especially at later decay stages of oak and beech.
Keywords: woody debris, tree species, CO2 production, DOC, glucose, wood decay, humification
index
62

IntroductionCoarse woody debris can account for up to 23% of carbon (C) in above ground litter (Prescott &
Laiho 2002). It thus plays an important role in the C cycle of forest ecosystems, though the fate of C
in the course of woody debris decay and its influence on the C pool of the soil are subject to
speculations (Trumbore & Harden 1997, Strukelj et al. 2012). The decay of woody debris takes
place through biological and chemical fragmentation, mineralization and leaching. Fragmentation
and leaching represent C fluxes to the soil (Harmon et al. 1986). Basidiomycetes, commonly
separated in white rot fungi and brown rot fungi, are strongly involved in the decay of woody debris
and respire much of the C pool (Käärik 1974, Swift 1977). Chambers et al. (2001) estimate that
respiration accounts for 76% of the total C loss from woody debris in the tropics over the whole
decomposition period. Leaching of DOC is another important path in the decay of woody debris
(Harmon et al. 1986). Decomposition products (Spears et al. 2003) or exudates from wood
decomposing fungi (Fransson et al. 2004) induce changes in the characteristics of the mineral soil
(Klinka et al. 1995). Several studies have been effectuated to measure respiration rates from woody
debris (e.g., Chen et al. 2000, Chambers et al. 2001, Herrmann & Bauhus 2008) or DOC loss from
woody debris (e.g., Spears et al. 2003, Hafner et al. 2005, Kuehne et al. 2008). We know of only one
study that simultaneously measured both CO2 and DOC production (Mattson et al. 1987). They
found a CO2:DOC ratio of 12:1, but tree species had no effect on the ratio.
The decay rate of woody debris depends on abiotic factors, like temperature and wood moisture, and
biotic factors including wood characteristics (Harmon et al. 1986). Lignin content, N and P
concentration, C:N ratio, wood density, dry matter content, wood pH and concentration of wood
extractives are described as driving factors of wood decay (Weedon et al. 2009, Fréschet et al.
2012). These factors vary among common Central European tree species (Rock et al. 2008). DOC
from woody debris is made up of a mixture of different substances including soluble decomposition
products (e.g., Reid & Seifert 1982, Leisola et al. 1983, Song et al. 2012), wood extractives (e.g.
Hillis 1987, Scalbert et al. 1988, Scheffer 1966), dead microbial cells (Zsolnay 2003) and fungal
exudates (Fransson et al. 2004). The importance of DOC leaching is thought to increase with decay
class due to greater surface area of fragmented woody debris (Harmon et al. 1986). The amount of
water soluble compounds per mass unit wood of ground woody debris, however, decreases
(Wilhelm 1976, Yano et al. 2005) or remains constant (Rajala et al. 2012) with increasing decay
class.
As analyses for specific substances in DOM are sophisticated, different proxies have been proposed
63

as explaining parameters for decay stages and their implications for environmental processes. The
pH values of water extracts were found to predict leaf litter decomposability in a subarctic flora
(Cornelissen et al. 2006) and to correlate with decomposition rates of woody debris of different tree
species (Fréschet et al. 2012). The pH values of mineral soil underneath logs were reduced (Klinka
et al. 1995, Krzyszowska-Waitkus 2006). Further proxy parameters are the humificiation indices
(HIX) and the specific ultraviolet absorbance (SUVA) that are correlated with the complexity and
the aromaticity of the DOC solution (Weishaar et al. 2003). DOC with high HIX and SUVA values
seems to contribute more to C accumulation in the mineral soil than DOC with low values (Don &
Kalbitz, 2005).
Non-structural carbohydrates (NSC) are common constituents of heart- and sapwood and represent
easily available C sources for microorganisms. The concentration of NSC can be relatively high in
fresh woody debris, but as in plant litter its concentration decreases rapidly by microbial
consumption (Berg, 2000). With rising decay of hemicelluloses and celluloses, other easily available
C sources arise in woody debris mainly through the activity of exoenzymes. To our knowledge, the
influence of additional C sources on the decay of woody debris at different decay stages has not
been studied yet. External C sources could be of relevance for the decay of woody debris because
throughfall represents a considerable input of easily available C under natural decay conditions in
forest ecosystems (van Hees et al. 2005). The effects of glucose addition on the decay of synthetic or
isolated cellulose, lignin or lignocellulose were investigated in several studies using pure cultures of
fungi. The availability of glucose decreases the amount of leachates and influences the quality of
lignin decay products (Leisola et al. 1984). Glucose can stimulate or repress the decomposition of
cellulose by white and brown rot fungi (Highley 1980, Highley 1987, Ritschkoff et al 1995). Under
laboratory conditions the glucose content of wood increases during enzymatic hydrolysis during the
initial decomposition step when up to 12% of the biomass is transformed to glucose (Giles et al.
2011). The presence of other decaying microorganisms might prevent the increase of soluble sugar
concentrations (Giles et al. 2012).
The goal of our study was to investigate the C loss of woody debris of common European tree
species at different decay stages through DOC and CO2 production at constant temperature under
laboratory conditions. The following hypotheses were tested: (1) DOC and CO2 production are
different for European beech, Sessile oak and Norway spruce (2) DOC and CO2 production increase
with increasing decay class, (3) humification and complexity of DOC increase while pH of
leachates decrease with increasing decay class. Further, we tested the addition of glucose on DOC
and CO2 production.
64

Materials and methods
Study sites and sample preparation
The woody debris samples used in the incubation experiment originate from the forest sites
Rohrberg (49°54’ N 009°26’ E) (European beech (Fagus sylvatica L.)), Ludwigshain (49°55’ N
011°48’ E) (Sessile oak (Quercus petraea (Matt.) Liebl.)) and Grübel (49°07’ N 013°07’ E) (Norway
spruce (Picea abies L.)). Mean annual precipitation ranges from 760–1200 mm a-1 and mean annual
temperature from 3-8°C.
Table 3.1: Decay class (DC) characteristics of coarse woody debris (CWD).
Decay class Characteristics
DC-1 Recently dead, bark intact, small twigs and leafs, no visible signs of decomposition
DC-2 Bark mostly remaining, no leafs, wood not penetrable by a knife
DC-3 Bark mostly missing, wood partly penetrable with knife, visible discoloration
DC-4 No bark, wood completely penetrable with knife, deformation and discoloration
DC-5 Wood soft, breakable with fingers, advanced humification
All woody debris samples were taken in 2010 and attributed to decay classes following the criteria
in Table 3.1. All samples of decay class 1 (DC-1) were sawn off in 2010 as part of thinning
procedures. Woody debris of decay class 3 (DC-3) and decay class 5 (DC-5) resulted from natural
mortality and decayed under field conditions until sampling. One wood slice per tree species and
decay class from logs were saw off or a sample collected in case of loose woody debris. Samples of
DC-1 and DC-3 were cut into cubes with 3 cm length and dry weight of 10-15 g. Cubes without
bark and constituting of heartwood only were chosen. Material of DC-5 was gently sieved and
pieces >2 mm were used for the incubation. Density of woody debris was determined from volume
measurements by water displacement (Table 3.2). Samples were wrapped in foil to prevent water
from soaking into the samples. C and N concentrations of ground subsamples from each sampled
tree were measured with a Vario Max CN element analyser (Elementar Analysensysteme GmbH,
Hanau, Germany) (Table 3.2). All woody debris samples were dried at 60°C for mass determination
and subsequently rewetted by immersion in deionised water for 24h. The wet samples were
preincubated on forest floor material of the same tree species at 30°C for 10 days to inoculate all
samples to wood decaying organisms.
65

Table 3.2: Initial sample characteristics.
Tree species Decay class Density
[g cm-3]
Gravimetric watercontent
[%]
C content
[%]
N content
[%]
Beech DC-1 0.67 50 48 0.19
DC-3 0.36 160 49 0.16
DC-5 0.22 640 50 0.58
Oak DC-1 0.65 40 48 0.14
DC-3 0.47 60 49 0.17
DC-5 0.08 370 49 0.73
Spruce DC-1 0.36 90 50 0.01
DC-3 0.37 80 50 0.01
DC-5 0.17 540 53 0.50

Incubation and analysis
Twelve samples per decay class and tree species were incubated on Whatman ® VACUFLO vacuum
filtration units in 1 l airtight glass jars at 15°C in a dark climate chamber for 380 days. Between
measurements, the jars were kept open and parafilm was used to protect the woody debris samples
from drying while enabling oxygen supply.
DOC was leached from woody debris every week by applying 25 ml of artificial rain with a pH of 6
and following composition: 1.0 μmol l-1 MnCl2, 9.0 μmol l-1 MgCl2, 1.5 μmol-1 K3PO4, 0. 2 μmol l-1
FeSO4, 1.0 μmol l-1 Al(NO3)3.H2O, 99.1 μmol l-1 CaS, 87.1 μmol l-1 NH4NO3, 20.0 μmol l-1 K2SO4,
18.0 μmol l-1 NaCl, 16.0 μmol l-1 Na2SO4. The solution was applied in two steps of 15 and 10 ml and
left to interact with woody debris for 5-10 min before being filtrated through a glass fiber prefilter
(Schleicher & Schuell GF92) and a 45 μm cellulose acetate membrane filter (Whatman OE67).
DOC samples were frozen at -18°C. A composite DOC sample of 4-16 weeks with increasing
periodic intervals as the experiment advanced was created for each woody debris sample. DOC was
measured as non-purgable organic C (NPOC) with a multi N/C 2100 analyzer (analytikjena) by the
Analytical Chemistry of the Bayreuth Center of Ecology and Environmental Research (BayCEER).
The pH values were measured with a WTW pH315i sensor. Emission of DOC samples between 254
and 500 nm were recorded on a SFM 25 spectrometer (BIO-TEK Instruments). The humification
index (HIX) was calculated according to Zsolnay et al. (1999) by dividing the lower quarter (300-
345 nm) by the upper quarter (435-480 nm). UV absorption was measured with a UV spectrometer
(UV-1800 SHIMADZU) at a concentration of 10 mg l-1. Specific ultraviolet absorbance (SUVA254)
was calculated by dividing the absorbance at 254 nm by the DOC concentration and multiplying it
by 100 (Weishaar et al. 2003). HIX and SUVA254 measured on the pooled samples of the first
measurement period (days 1-28) and the last measurement period (days 270-380).
Respiration rates were measured on a weekly basis, starting on the day after the DOC leaching.
They were calculated from the linear increase in CO2 in the glass jars from the difference of two
CO2 concentration measurements with a 24h time interval. CO2 concentration was measured as CH4
with a gaschromatograph (SRI 8610C) equipped with a flame ionization detector. Gas samples (30
μl) were taken from the headspace of the jars and then injected with a 50 μl syringe (Hamilton 1805
RN 50 μl BBL, needles: Hamilton ga2Gs/51mm). CO2 standards with the concentrations 380 ppm,
600 ppm, 1000 ppm, 3000 ppm and 10000 ppm were used for calibration. The mean precision of
CO2 measurement ranges from 4% (10000 ppm) to 8% (380 ppm).
After 8 weeks, half the samples (n= 6 per tree species and decay class) were treated with 2 ml of a
67

glucose solution per week with a concentration of 600 mg C l-1 directly before the 24h CO2
measurement interval. The glucose-C concentration corresponds approximately to the maximum
concentration of DOC in throughfall of Bavarian forests.
Statistical analysis
We analyzed the effects of tree species and decay class on cumulative DOC and CO2 production,
pH-value, HIX and SUVA254 using non-parametric linear regression analysis. Differences between
glucose and control were tested with Student’s t-test with a significance level of p<0.05. All
statistical analysis was done with R 2.9.2 (R Development Core Team 2009).
Results
Tree species and decay class effects on CO2 production
The mean cumulative CO2 production of all tree species and decay stages varied between 1 and 9%
of the initial C over 380 days (Table 3.3). In case of spruce, differences in CO2 production were
rather small (1-3%) among the decay stages. The linear regression showed differences between tree
species and decay class and combinations thereof (R² = 0.82, p<0.001) Differences between decay
classes are more important than between tree species (Table 3.4). For beech and spruce, CO2
production increased with decay class, while oak had a distinct pattern. In contrast to the other tree
species, DC-3 of oak produced less CO2 than DC-1.
Regardless of tree species, we measured relatively constant CO2 production rates for DC-5 over the
course of the incubation (Fig. 3.1). In contrast, CO2 production of DC-1 and DC-3 were generally
highest in the first weeks and decreased thereafter. In particular, DC-3 of Norway spruce exhibited a
strong dynamic: 50% of the CO2 production occurred in the first 100 days of the experiment and
remained then at a low and constant level.
Tree species and decay class effects on DOC production
Mean cumulative DOC production accumulated to 0.1 and 1.5% of the initial C (Table 3.3).
Differences in DOC production among the three decay stages were very small for spruce (0.36-0.61)
and greatest for beech (0.11-1.56). The effect of tree species and decay class on DOC production
were significant (R²=0.85, p<0.001). The order of cumulative DOC production depended on the
decay class (Table 3.3): DC-5 always had the highest DOC production rates and DC-1 had the
lowest production rates, except for oak. The differences for DC-3 among the tree species were
small.
68

Table 3.3: Results of regression analysis of tree species and decay class effects in comparison to oak at DC-1 for total C loss, cumulative DOC and CO2
production, mean humification index (HIX), mean specific ultra-violet absorption (SUVA254) and mean pH values.
Oak - DC-1 Beech Spruce DC-3 DC-5 Beech - DC-3 Spruce - DC-
3
Beech - DC-
5
Spruce -
DC-5
Total C-loss factor 3.16 (0.43) -1.50 (0.61) -0.87 (0.61) -1.34 (0.61) 7.32 (0.61) 2.68 (0.86) -5.36 (0.86) 4.48 (0.86) 1.21 (0.86)
t-value 7.38 -2.49 -1.43 -2.21 12.09 3.13 -6.26 5.24 1.42
p-value <0.001 0.01 0.16 0.03 <0.001 0.002 <0.001 <0.001 0.16
Cumulative
CO2 loss
factor 2.37 (0.40) -1.08 (0.56) -0.19 (0.56) -1.03 (0.56) 6.66 (0.56) 2.24 (0.79) -4.96 (0.79) 3.91 (0.79) 0.42 (0.79)
t-value 6.0 -1.9 -0.3 -1.8 11.9 2.8 -6.3 4.9 0.5
p-value <0.001 0.06 0.73 0.07 <0.001 0.006 <0.001 <0.001 0.59
Cumulative
DOC loss
factor 0.79 (0.06) -0.43 (0.08) -0.67 (0.08) -0.30 (0.08) 0.66 (0.08) 0.44 (0.11) -0.41 (0.11) 0.57 (0.11) 0.79 (0.11)
t-value 14.0 -5.3 -8.4 -3.8 8.2 3.9 -3.6 5.1 7.0
p-value <0.001 <0.001 <0.001 <0.001 <0.001 <0.001 <0.001 <0.001 <0.001
HIX factor 5.33 (0.30) -1.61 (0.42) -1.05 (0.42) 2.58 (0.42) 3.53 (0.42) -5.03 (0.59) -1.78 (0.59) -2.29 (0.59) 2.22 (0.59)
t-value 18.0 -3.8 -2.5 6.2 8.4 -8.5 -3.0 -3.9 3.8
p-value <0.001 <0.001 0.014 <0.001 <0.001 <0.001 0.003 <0.001 <0.001
SUVA254 factor 0.35 (0.01) -0.09 (0.02) -0.15 (0.02) -0.04 (0.02) -0.04 (0.02) -0.06 (0.02) 0.03 (0.02) 0.02 (0.02) 0.15 (0.02)
t-value 31.4 -5.4 -9.2 -2.3 -2.8 -2.6 1.2 0.7 6.5
p-value <0.001 <0.001 <0.001 0.02 0.006 0.01 0.24 0.47 <0.001
pH factor 4.54 (0.05) 0.82 (0.08) 1.36 (0.08) 0.03 (0.08) 0.05 (0.08) -0.66 (0.11) -0.96 (0.11) -0.37 (0.11) -1.26 (0.11)
t-value 83.8 10.8 17.7 0.4 0.7 -6.1 -8.8 -3.4 -11.7
p-value <0.001 <0.001 <0.001 0.68 0.50 <0.001 <0.001 <0.001 <0.001

Table 3.4: Mean (± standard deviation) of DOC concentration, C loss as DOC in % initial C, pH (geometrical mean), humification index (HIX) andspecific ultra-violet absorption (SUVA254) from CWD leachates and cumulative C loss as CO2 and DOC of three tree species and three decay stages.
Tree species Decay class DOC
[mg C l-1]
pH HIX SUVA
[l mg-1 m-1]
Cum. C as CO2
[%]
Cum. C as DOC
[%]
Beech DC-1 14.7 (4.4) 5.61 4.28 (1.70) 2.49 (1.59) 2.18 (0.20) 0.11 (0.02)
DC-3 23.2 (2.8) 5.44 4.58 (0.74) 2.34 (0.57) 5.05 (0.45) 0.38 (0.11)
DC-5 37.6 (5.4) 4.52 10.03 (2.01) 3.95 (0.25) 9.26 (0.78) 1.56 (0.31)
Oak DC-1 91.8 (18.5) 4.26 5.33 (2.86) 4.47 (0.65) 2.37 (0.44) 0.79 (0.21)
DC-3 49.5 (6.2) 4.39 7.91 (1.29) 3.85 (0.44) 1.33 (0.18) 0.48 (0.06)
DC-5 39.4 (9.9) 4.36 8.86 (1.58) 3.93 (0.47) 9.03 (0.49) 1.45 (0.33)
Spruce DC-1 22.8 (3.9) 5.27 3.72 (0.59) 3.28 (0.64) 1.29 (0.13) 0.36 (0.09)
DC-3 47.4 (5.9) 4.63 1.27 (0.65) 1.88 (0.91) 2.50 (0.19) 0.49 (0.20)
DC-5 19.2 (2.6) 4.18 5.47 (0.85) 3.23 (0.70) 3.00 (0.16) 0.61 (0.18)

Fig. 3.1: Weekly C loss as CO2 and as DOC for the samples (a) beech DC-1, (b) beech DC-3, (c)
beech DC-5, (d) oak DC-1, (e) oak DC-3, (f) oak DC-5, (g) spruce DC-1, (h) spruce DC-3, (i)
spruce DC-5
71

Mean DOC concentrations ranged between 14.7 and 91.8 mg l-1 (Table 3.3). The dynamics were
similar for all tree species of the same decay class: DOC concentrations of DC-1 and DC-3 peaked
between days 90 and 270 and decreased thereafter (Fig. 3.2). The DOC concentrations of DC-5
strongly decreased during the first 100-150 days whereas the changes were small in the remaining
time.
The relative contribution of DOC leaching to total C loss was tree species dependant and varied
between 3 and 54% in single samples. In average, it was most important for oak at DC-3 (27%) and
DC-1 (25%) and was least important for beech at DC-3 (5%) and DC-1 (7%) (Table 3.4). The ratio
of DOC to CO2 production fluctuated over the duration of incubation and revealed different patterns
among the decay stages. For DC-1 and DC-3, the relative importance of DOC production increased
during the first 200-300 days and decreased thereafter. The cumulative CO2 and DOC production
were not correlated for DC-1 and DC-3. In terms of DC-5, the relative C loss by DOC leaching
dropped in the beginning and leveled off in the remaining time. The correlation between C loss via
DOC leaching and CO2 production of DC-5 was positive and significant (adjusted R²=0.84,
p<0.001, y=0.25+0.13x).
Qualitative DOC parameters
Mean pH values of leachates ranged between 4.18 and 5.61, indicating mainly decreasing pH values
compared to the applied solution (pH 6.0) (Table 3.4). The decrease in pH was strongest for DC-5 of
all tree species (Fig. 3.2b). Increasing pH values >6.0 were only measured in single samples of
beech leachates of DC-1 and DC-3. The linear regression analysis revealed significant effects
(R²=0.88, p<0.001) of tree species and decay class on pH values (Table 3.3). Differences between
tree species and decay stages became greater during the incubation.
Average HIX and SUVA254 values were 5.71 and 3.27 l mg-1 m-1, respectively. We found significant
influences of decay stages and tree species (Table 3.3). Both HIX and SUVA254 values were
generally greatest at DC-5. Differences in HIX between days 1-28 and days 270-380 were greater
than differences in SUVA254 (data not shown).
Of the qualitative DOC parameters, cumulative CO2 production was better correlated with HIX
between days 270-380 than days 1-28 (Table 3.5). Weak correlations were found between CO2
production and SUVA254 as well as pH values. Cumulative DOC production was positively
correlated with pH values, HIX and SUVA (Table 3.5) in the initial (days 1-28) and final incubation
period (days 270-380). The best correlation between DOC production and parameters was found
with HIX between days 270-380.
72

Fig. 3.2: Dynamics of (a) DOC concentrations and (b) pH values of extracts of decay class 1 (DC-
1), decay class 3 (DC-3) and decay class 5 (DC-5) and three tree species over 380 days of
incubation.
Effects of glucose addition on DOC and CO2 production
The glucose added up to 56.4 mg C per woody debris unit which corresponded to 6% of the mean
cumulative CO2 or 28% of the mean cumulative DOC production during the 380 days of incubation.
Despite the additional C source, glucose had no effect on CO2 and DOC production of any tree
species and decay class. Further, glucose addition had no significant effect on pH-value, HIX and
SUVA254 of leachates.
73

Table 3.5: Correlation between cumulative CO2 and DOC production and mean humification index (HIX), specific ultra-violet absorption (SUVA254)
and pH value during the beginning (days 1-28) and the end of the incubation (days 270-380).
Days 1-28 Days 270-380
Adjusted R² p-value function Adjusted R² p-value function
CO2 : HIX 0.00 0.47 y=0.32+0.01x 0.36 <0.001 y=-0.10+0.18x
CO2 : SUVA254 0.04 <0.05 y=0.48-0.43x 0.01 0.17 y=0.63+1.17x
CO2 : ph 0.01 0.19 y=0.74-0.08x 0.05 <0.01 y=2.46-0.30x
DOC : HIX 0.28 <0.001 y=-0.02+0.02x 0.53 <0.001 y=-0.04+0.03x
DOC : SUVA254 0.17 <0.001 y=-0.03+0.33x 0.15 <0.001 y=-0.02+0.46x
DOC : pH 0.03 <0.05 y=0.31-0.05x 0.25 <0.001 y=0.52-0.08x
Discussion
Tree species effects on total carbon loss, CO2 and DOC production
We refer to total C loss as sum of cumulative CO2 and DOC production during incubation as
fragmentation was not relevant in our study. Given the dominance of CO2 over DOC production, the
linear regression analysis revealed similar results for cumulative CO2 production and total C loss.
Mean total C loss of 4.7% of the initial C within 380 days is higher than the mean annual C loss of
2.6% under field conditions calculated from radiocarbon dated woody debris logs of the same tree
species (unpublished data). The elevated C loss under laboratory conditions can be attributed to
different factors including temperature, moisture and sample size (Boddy, 1983). The incubation
temperature is 7-10 K higher than mean annual temperatures at the study sites. Boddy (1983) found
respiration rates from beech twigs to more than double between 5 and 15°C. For woody roots, Q 10
values of 4 for the interval 5-10°C and of 2.4 for the interval 10-15°C have been found (Chen et al.
2000). Assuming these Q10 values to be similar for our investigated samples, C loss would be in the
same order as in the field despite varying decomposition factors and woody debris composition.
On average, spruce had the smallest C loss while beech and oak had similar C losses, except for
DC-3 (see discussion below). In a review, decay rate constants under field conditions including all
decay stages were in the order beech>spruce>oak (Rock et al. 2008). The faster decay of oak in
comparison to spruce in our incubation experiment might be due to the experimental setup that
mixed inner and outer heartwood. While no differences in extractable contents for wood parts have
been described for spruce and beech, inner heartwood of oak has lower contents of extractable
substances than outer heartwood (Puech et al. 1999). Extractable substances contribute to the
microbial resistance of wood (Scheffer & Cowling, 1966). Under natural conditions, inner
heartwood of oak often decays before the complete tree death resulting in hollow snags (Ranius et
al. 2009). The consideration of inner heartwood in this study might have led to an overestimation of
decay rates of oak at DC-1 in comparison to natural decay processes. We expect this overestimation
to be minor at more severe decay stages, when the largest portions of extractable substances have
been leached from inner and outer heartwood.
In this study, DOC concentrations of 9 – 68 mg l-1 were lower compared to field measurements.
Under European beech logs, DOC concentrations ranged between 11 and 115 mg l-1 (Kahl 2008,
Kuehne 2008). In North American mixed broad-leaved stands, DOC concentrations varied between
76 and 180 mg l-1 (Mattson 1987, Hafner 2005) and in coniferous forests between 62 and 108 mg l -1
(Yavitt & Fahey 1985, Spears et al. 2003). Coniferous woody debris yields lower DOC
75

concentrations than deciduous wood other than beech than European beech. The same order was
found in our experiment as reported in literature. Different factors influence the release of DOC
from woody debris. Differences in DOC leaching among tree species may result from different
chemical and physical characteristics of woody debris as well as distinct fungal communities (Song
et al. 2011). DNA sequences indicate that a wide variety of different fungi contribute to decay at
different decay stages of woody debris (Rajala et al. 2012), reflecting the decline in resource quality.
Wood of broad-leaved trees is commonly decomposed by fungi that cause white rot while wood of
coniferous trees is mainly decomposed by brown rot fungi (Schmidt 2006). The great abundance of
white rot fungi in broad-leaved wood is speculated to be responsible for elevated DOC
concentration under broad-leaved logs as the decay products of lignin are water soluble (Kahl
2008). However, it does not explain the relatively low DOC concentrations under European beech
logs. Initial concentrations of extractive substances in wood might control DOC leaching in the
early phases of decay. The order of DOC concentration at DC-1 corresponded to the amount of
extractable substances in fresh wood: broad-leaved wood generally contains more extractives than
coniferous wood and European beech with fresh wood of oak containing up to 10% of extractable
substances like tannins whereas spruce has a content of only 2.1% and beech contains 2.0% of
extractable substances (Rowe 1979). We assume that the differences between tree species in DOC
production decline with decay class as a result of missing extractives in older woody debris. The
contribution of DOC to total C loss for oak and spruce was higher than in other studies, while the
values for beech were in the same range. Mattson et al. (1987) found a CO2:DOC ratio of 12:1 for
woody debris after 6 years of decomposition. Spears et al. (2003) calculated that 5% of woody
debris is released as DOC over the whole decomposition period leading to a CO2:DOC ratio of 19:1.
Due to the small sample size in comparison to logs, the surface:volume ratios in the incubation is
increased in comparison to field conditions. This also increased the working surface of water
leading to better leaching conditions (Harmon et al. 1986) and possibly an overestimation of the
CO2:DOC ratio of 6:1 in our study.
Decay class effects on DOC and CO2 production
DOC leaching was always highest for DC-5. For DC-1 and DC-3, no consistent pattern was found
for the three tree species. Our finding corresponds to the results of other studies. Kahl (2008) found
no influence of decay class and time since death on DOC production from beech logs under field
conditions. Kuehne et al. (2008) and Hafner et al. (2005) reported maximum DOC concentrations
for the most heavily decayed woody debris. On the other hand, Spears et al. (2003) reported high
76

variation for heavily decayed woody debris and lower DOC concentrations than for less decayed
woody debris. In our study, the dynamics of DC-1 and DC-3 were marked by an early peak in CO2
production and a later peak in DOC production. The delayed increase of DOC production during the
incubation can partially be explained by an increase in moisture content of the woody debris sample
(data not shown), that might have increased the diffusion for soluble products. An initial peak in
respiration is typically found in litter decomposition studies and is explained by rapid consumption
of easily available C sources during the initial phase of microbial decay (Berg, 2000). The sample
preparation included cutting, which represents a form of physical fractionation that made new
surfaces available for fungal colonization. On the other hand, fungal colonization of woody debris
was restricted during the course of incubation because the woody debris had no contact to soil. High
water contents could have limited the oxygen supply in the inner woody debris and thus the aerobic
respiration of fungi. As woody debris of DC-5 constitutes of strongly fragmented material, sample
preparation had likely minor influence on fungal colonization. The initial decrease of DOC
concentration of DC-5 might be explained by a depletion of soluble decay products accumulated in
the field prior to the incubation. The higher surface:volume ratio in the incubation might have
favored DOC leaching in comparison to field conditions. Yavitt and Fahey (1985) also found an
initial peak of DOC leaching from heavily decayed woody debris over the snow melt period. The
significant correlation between DOC and CO2 loss suggests that the extracted DOC mainly
originates from decomposition processes rather than extractives. Our findings correspond with those
of Klotzbücher et al. (2011) for leaf litter that a close correlation between DOC and CO2 production
only exists at later decay stages.
Qualitative DOC parameters
DOC characteristics gradually changed during the 380 days of incubation. The dynamics were most
notable in the pH value of the extracts, pointing to an increase of hydrolysable organic groups. The
influence of the decomposer community on the pH of woody debris was described with brown rot
lowering the pH of woody debris to average values of 3.7 and white rot yielding more variable
results (Koenigs, 1974). A negative correlation between woody debris pH and decay rates was
described by Fréschet et al. (2012). Of the spectroscopic characteristics, HIX revealed the best
correlation with C-loss. Lignin derived compounds have higher HIX values than other
decomposition products (Don & Kalbitz, 2005). Hence, at high HIX values lignin decomposition
controls DOC production during decomposition of leaf litter (Klotzbücher et al. 2011). The high
HIX values of DC-5 as well as the good correlation with C loss suggest that lignin decomposition is
77

the most important process at later decay stages. High HIX and SUVA254 indicate increasing stability
and perhaps increasing importance for C accumulation in the mineral soil (Don & Kalbitz, 2005). It
also suggests that DOC from heavily decayed oak and beech woody debris could contribute more to
C accumulation in soils than DOC of younger decay stages.
Effects of glucose on DOC and CO2 production
We found no effects of glucose on the DOC and CO2 production from CWD. To our knowledge, the
effect of additional light C sources decomposition of CWD has not been studied so far. Few studies
investigated the potential of C addition on the decay of isolated wood compounds by single fungal
species. These cannot represent the diversity of the fungal community in CWD or the interactions of
glucose with wood substrates in an arranged structure. Studies with soil showed that between 30 and
40% of glucose added to different substrate is immediately used for respiration and the remaining
part is used for biomass growth (van Hees et al., 2005). Leisola et al. (1984) suggest that glucose
inhibits the depolymerization of cellulose and result in a more effective usage of products of lignin
decomposition. The lack of significant differences in any investigated parameter between control
and treated samples indicates that glucose has no or only a slight effect on the decomposition of
CWD. Thus, throughfall that contains easily decomposable substrates from canopy leaching has
apparently no impact on decay of CWD.
ConclusionsOur study indicates that DOC and CO2 production vary among the three tree species and among
decay stages. Cumulative CO2 production and DOC leaching per mass unit are highest for heavily
decayed CWD. DOC concentrations in the leachates per volume of CWD, however, are often higher
for less decayed CWD. CO2 production is the most important pathway of C loss, but the production
of DOC significantly contributes to the decay of CWD. In the initial decay stages, extractives seem
to contribute to DOC production, while lignin derived compounds seem to be more important at
later decay stages. Up to 25% of the C from oak CWD is lost as DOC. This makes oak the tree
species with the largest potential to contribute to C input to the soil. Heavily decayed CWD
produces more stable DOC, which might contribute more to the C accumulation in the soil. Further
heavily decayed CWD also produces DOC with the lowest pH value, which might influence soil
acidity more than DOC from less decayed CWD. The lack of significant effects from glucose
addition suggests that easily available C input with throughfall does not affect CWD decay.
78

AcknowledgmentsThis work was supported by the Bavarian Ministry for Nutrition, Agriculture and Forestry. We are
grateful to H. Hertel-Kolb, A. Schott and P. Eckert as well as F. Klein, B. Breunig, C. Stöhr for help
with CO2 measurements and DOC leaching and to U. Hell for technical advice. The authors want to
thank the members of the Central Analytical Department of BayCEER for technical support. We
want to thank PD Dr. Robert Hable for statistical consulting.
79

ReferencesBerg, B. (2000) Litter decomposition and organic matter turnover in northern forest soils. Forest
Ecology and Management 133, 13–22.
Boddy, L. (1983) Carbon dioxide release from decomposing wood: Effect of water content and tem-
perature. Soil Biology and Biochemistry 15, 501–510.
Chambers, J.Q., Schimel, J.P., Nobre, A.D. (2001) Respiration from coarse wood litter in central
Amazon forests. Biogeochemistry 52, 115–131.
Chen, H., Harmon, M.E., Griffiths, R.P., Hicks, W. (2000) Effects of temperature and moisture on
carbon respired from decomposing woody roots. Forest Ecology and Management 138, 51–64.
Cornelissen, J.H.C., Quested, H.M., van Logtestijn, R.S.P., Pérez-Harguindeguy, N., Gwynn-Jones,
D., Díaz, S., Callaghan, T.V., Press, M.C., Aerts, R. (2006) Foliar pH as a new plant trait: can it
explain variation in foliar chemistry and carbon cycling processes among subarctic plant spe-
cies and types? Oecologia 147, 315–326.
Don, A., Kalbitz, K. (2005) Amounts and degradability of dissolved organic carbon from foliar litter
at different decomposition stages. Soil Biology and Biochemistry 37, 2171–2179.
Fransson, A.-M., Valeur, I., Wallander, H. (2004) The wood-decaying fungus Hygrophoropsis auran-
tiaca increases P availability in acid forest humus soil, while N addition hampers this effect.
Soil Biology and Biochemistry 36, 1699–1705.
Fréschet, G.T., Weedon, J.T., Aerts, R., van Hal, J.R., Cornelissen, J.H.C. (2012) Interspecific diffe-
rences in wood decay rates: insights from a new short-term method to study long-term wood
decomposition. Journal of Ecology 100, 161-170.
Giles, R.L., Galloway, E.R., Elliott, G.D., Parrow, M.W. (2011) Two-stage fungal biopulping for im-
proved enzymatic hydrolysis of wood. Bioresource Technology 102, 8011–8016.
Giles, R.L., Zackeru, J.C., Elliott, G.D., Parrow, M.W. (2012) Fungal growth necessary but not suf-
ficient for effective biopulping of wood for lignocellulosic ethanol applications. International
Biodeterioration & Biodegradation 67, 1–7.
Hafner, S.D., Groffman, P.M., Mitchell, M.J. (2005) Leaching of dissolved organic carbon, dissol-
ved organic nitrogen, and other solutes from coarse woody debris and litter in a mixed forest in
New York State. Biogeochemistry 74, 257–282.
80

Harmon, M.E., Franklin, J.F., Swanson, F.J., Sollins, P., Gregory, S.V., Lattin, J.D., Anderson, N.H.,
Cline, S.P., Aumen, N.G., Sedell, J.R., Lienkaemper, G.W., Cromack, K.J., Cummins, K.W.,
(1986) Ecology of coarse woody debris in temperate ecosystems. Advances in Ecological Rese-
arch 15, 133–302.
Herrmann, S., Bauhus, J., (2008) Comparison of methods to quantify respirational carbon loss of
coarse woody debris. Canadian Journal of Forest Research 38, 2738–2745.
Highley, T.L., (1980) Cellulose Degradation by Cellulose-Clearing and Non-Cellulose-Clearing
Brown-Rot Fungi. Applied and Environmental Microbiology 40, 1145–1147.
Highley, T.L., (1987) Effect of carbohydrate and nitrogen on hydrogen peroxide formation by wood
decay fungi in solid medium. FEMS Microbiology Letters 48, 373–377.
Hillis, W.E., (1987) Heartwood and tree exudates. Springer Series in Wood Science.
Käärik, A., (1974) Decomposition of wood, in: Biology of Plant Litter Decomposition (C.H. Dickin-
son, and G.J.F. Pugh, Eds.) pp. 129-174. Academic Press London, UK.
Kahl, T. (2008) Kohlenstofftransport aus dem Totholz in den Boden. Dissertation University of Frei-
burg.
Klinka, K., Lavkulich, L., Wang, Q., Feller, M. (1995) Influence of decaying wood on chemical pro-
perties of forest floors and surface mineral soils: a pilot study. Annales des Sciences Fores-
tières 52, 523–533.
Klotzbücher, T., Kaiser, K., Guggenberger, G., Gatzek, C., Kalbitz, K. (2011) A new conceptual mo-
del for the fate of lignin in decomposing plant litter. Ecology 92, 1052–1062.
Koenigs, J. (1974) Hydrogen Peroxide and Iron: A Proposed System for Decomposition of Wood by
Brown-rot Basidiomycetes. Wood and Fiber Science 6, 66–80.
Krzyszowska-Waitkus, A., Vance, G.F., Preston, C.M. (2006) Influence of coarse wood and fine lit-
ter on forest organic matter composition. Canadian Journal of Soil Science 86, 35–46.
Kuehne, C., Donath, C., Müller-Using, S.I., Bartsch, N. (2008) Nutrient fluxes via leaching from
coarse woody debris in a Fagus sylvatica forest in the Solling Mountains, Germany. Canadian
Journal of Forest Research 38, 2405–2413.
Leisola, M., Ulmer, D., Fiechter, A., (1983) Problem of oxygen transfer during degradation of lignin
by Phanerochaete chrysosporium. Applied Microbiology and Biotechnology 17, 113–116.
81

Leisola, M.S.A., Ulmer, D.C., Fiechter, A. (1984) Factors affecting lignin degradation in lignocellu-
lose by Phanerochaete chrysosporium. Archives of Microbiology 137, 171–175.
Mattson, K.M., Swank, W.T., Waide, J.B. (1987) Decomposition of woody debris in a regenerating,
clear-cut forest in the Southern Appalachians. Canadian Journal of Forest Research 17, 712–
721.
Prescott, C.E., Laiho, R. (2002) The nutritional significance of coarse woody debris in three Rocky
Mountain coniferous forests, In: Proceedings of the Symposium on Ecology and Management
of Dead Wood in Western Forests. USDA Forest Service Gen. Tech. Rep. PSW-GTR-181. pp.
381–392.
Puech, J.-L., Feuillat, F., Mosedale, J.R. (1999) The tannins of oak heartwood: structure, properties,
and their influence on wine flavor. American Journal of Enology and Viticulture 50, 469–478.
Ranius, T., Niklasson, M., Berg, N. (2009). Development of tree hollows in pedunculate oak (Quer-
cus robur). Forest Ecology and Management, 257(1), 303–310.
Rajala, T., Peltoniemi, M., Pennanen, T., Mäkipää, R. (2012) Fungal community dynamics in relati-
on to substrate quality of decaying Norway spruce (Picea abies [L.] Karst.) logs in boreal fo-
rests. FEMS Microbiology Ecology 81, 494–505.
R Development Core Team. R: A Language and Environment for Statistical Computing. Vienna,
Austria: R Foundation for Statistical Computing; 2009.
Reid, I.D., Seifert, K.A. (1982) Effect of an atmosphere of oxygen on growth, respiration, and lignin
degradation by white-rot fungi. Canadian Journal of Botany 60, 252–260.
Ritschkoff, A.-C., Rättö, M., Buchert, J., Viikari, L. (1995) Effect of carbon source on the producti-
on of oxalic acid and hydrogen peroxide by brown-rot fungus Poria placenta. Journal of Bio-
technology 40, 179–186.
Rock, J., Badeck, F.-W., Harmon, M.E. (2008) Estimating decomposition rate constants for Euro-
pean tree species from literature sources. European Journal of Forest Research 127, 301–313.
Rowe, J.W. (1979) Extractives in eastern hardwoods: a review. General Technical Report FPL 18.
Scalbert, A., Monties, B., Favre, J.-M. (1988) Polyphenols of Quercus robur: Adult tree and in vitro
grown calli and shoots. Phytochemistry 27, 3483–3488.
Scheffer, T.C. (1966) Natural resistance of wood to microbial deterioration. Annual Review of Phto-
82

pathology 4, 147–168.
Schmidt, O. (2006) Wood and Tree Fungi: Biology, Damage, Protection, and Use. Springer, pp 334.
Song, Z., Vail, A., Sadowsky, M.J., Schilling, J.S., (2012) Competition between two wood-degra-
ding fungi with distinct influences on residues. FEMS Microbiology Ecology 79, 109–117.
Spears, J.D.H., Holub, S., Harmon, M., Lajtha, K. (2003) The influence of decomposing logs on soil
biology and nutrient cycling in an old-growth mixed coniferous forest in Oregon, USA. Cana-
dian Journal of Forest Research 33, 2193–2201.
Strukelj, M., Brais, S., Quideau, S.A., Oh, S.-W. (2012) Chemical transformations of deadwood and
foliar litter of mixed boreal species during decomposition. Canadian Journal of Forest Rese-
arch 42, 772–788.
Swift, M.J. (1977) The ecology of wood decomposition. Science Progress 64, 175–199.
Trumbore, S.E., Harden, J.W. (1997) Accumulation and turnover of carbon in organic and mineral
soils of the BOREAS northern study area. Journal of Geophysical Research 102, 28817–
28830.
van Hees, P.A.W., Jones, D.L., Finlay, R., Godbold, D.L., Lundström, U.S. (2005) The carbon we do
not see—the impact of low molecular weight compounds on carbon dynamics and respiration
in forest soils: a review. Soil Biology and Biochemistry 37, 1–13.
Weishaar, J.L., Aiken, G.R., Bergamaschi, B.A., Fram, M.S., Fujii, R., Mopper, K. (2003) Evaluati-
on of Specific Ultraviolet Absorbance as an Indicator of the Chemical Composition and Reacti-
vity of Dissolved Organic Carbon. Environmental Science and Technology 37, 4702–4708.
Wilhelm, G.E. (1976) Über chemische Veränderungen von Buchen- und Fichtenrinde beim Abbau
durch Mikroorganismen. Holzforschung - International Journal of the Biology, Chemistry,
Physics and Technology of Wood 30, 202–212.
Yano, Y., Lajtha, K., Sollins, P., Caldwell, B.A. (2005) Chemistry and Dynamics of Dissolved Orga-
nic Matter in a Temperate Coniferous Forest on Andic Soils: Effects of Litter Quality. Ecosys-
tems 8, 286–300.
Yavitt, J.B., Fahey, T.J. (1985) Chemical composition of interstitial water in decaying lodgepole
pine bole wood. Canadian Journal of Forest Research 15, 1149–1153.
Zsolnay, Á. (2003) Dissolved organic matter: artefacts, definitions, and functions. Geoderma 113,
83

187–209.
Zsolnay, Á., Baigar, E., Jimenez, M., Steinweg, B., Saccomandi, F. (1999) Differentiating with fluo-
rescence spectroscopy the sources of dissolved organic matter in soils subjected to drying.
Chemosphere 38, 45–50.
84

Chapter 4
Carbon stocks and turnover of coarse woody debris and
soil in three managed and unmanaged temperate forests
85

Carbon stocks and turnover of coarse woody debris and soil in three managed and unmanaged temperate forests.Inken Krueger1), Christoph Schulz2), Werner Borken1)
1)Department of Soil Ecology, Bayreuth Center of Ecology and Environmental Research, University
of Bayreuth, Dr.-Hans-Frisch-Str. 1-3, D-95448 Bayreuth, Germany
2)Bavarian State Institute of Forestry, LWF, Hans-Carl-von-Carlowitz-Platz 1, D-85354 Freising,
Germany
Submitted to Global Change Biology
AbstractForest management may affect the carbon (C) stocks of coarse woody debris (CWD) and soil.
CWD represents a short to middle term C sink in forest ecosystems, but the formation of soil
organic carbon (SOC) from CWD is still subject to speculation. The effects of forest management
on C stocks of CWD and soils were investigated in a Norway spruce and two European beech -
Sessile oak forests located in different climatic and geological regions of Bavaria, Germany. In the
unmanaged parts of the forests, wood was not harvested and CWD accumulated for about 40 to 100
years. C stocks of CWD, the forest floor and the mineral soil were inventoried. Turnover times
(TTs) were calculated from radiocarbon signatures with a non-steady state model with three
different C input pools for the forest floor and with a steady state model for the mineral soil. Above-
ground CWD stocks amounted to 11 Mg C ha-1 in the unmanaged spruce forest and to 23-30 Mg C
ha-1 in the unmanaged beech-oak forests, whereas CWD stocks were 4.2-5.6 Mg C ha-1 in the
managed forests. The mean disappearance time of CWD from spruce and oak was longer (70 years)
than of beech (30 years). Elevated CWD input did not affect the C stock of the forest floor and the
mineral soil in the unmanaged forests, indicating that CWD has no or little potential for soil C
sequestration. Elevated CWD input was compensated by faster turnover of organic C in the Oe
horizon, indicating a stimulation of leaf litter decay. In the Oa horizon and the mineral soil, no
consistent patterns of radiocarbon signatures were found in all three investigated forests, suggesting
that ecosystem properties overshadow moderate forest management effects.
Keywords: soil organic carbon, turnover times, coarse woody debris, radiocarbon, forest floor
turnover
86

IntroductionThere is growing public and political interest in the carbon (C) sequestering potential of forest
ecosystems. Forests contain 50% of the organic C in the terrestrial biosphere (Jandl et al. 2007) and
therefore play an important role in the earth's climate. Management practices can impact the
sequestration of C in forests (Ballard 2000), including the sequestration of C in coarse woody debris
(CWD). In forests withdrawn from management, CWD stocks increase by <0.1 to 19 m³ ha-1 a-1
(Vandekerkhove et al. 2009). CWD input contributes 3-24% to total above-ground litter in old
growth forests (Laiho & Prescott 1999) and represents a short to middle term C stock in forest
ecosystems (Laiho & Prescott 2004, Boulanger & Sirois 2006, Hagemann et al. 2009, Bradford et
al. 2009). CWD of tree species differ in their decay (Rock et al. 2008) and thus in their potential as
lasting C stocks.
CWD is incorporated in many soil and forest models, but only in a highly generalized form (Cramer
et al. 2001, Parton et al. 1988, Tuomi et al. 2011). In soil models, C originating from CWD
potentially contributes up to 10-60% of deep soil organic C stocks (Harden et al. 2000, Manies et al.
2005). Residues of CWD decomposition have the potential to accumulate in the mineral soil as
lignin residues from woody debris can persist in the soil for decades to centuries (Arantes et al.
2012). However, an increase of C stocks in the soil due to CWD has not been reported so far.
The effects of forest management on soil C stock are hard to detect due to slow changes and high
spatial variability (Schöning et al. 2006, Schrumpf et al. 2008, Homann et al. 2008). Forest
management influences the C input to the soil, but it does not inevitably modify the stabilization of
soil organic matter (SOM) (Jandl et al. 2007). SOM of the mineral soil is heterogeneous and is often
divided into chemical or physical fractions with different stability and turnover times (TTs)
(Trumbore 2000, Kögel-Knabner et al. 2008). In common procedures, SOM is fractionated in free
particulate organic matter (fPOM), occluded particulate organic matter (oPOM) and mineral
associated organic matter (MaOM). The fPOM fraction consists of visible plant residues (Wagai et
al. 2008) from partly decomposed below-ground and above-ground litter. As an easily
decomposable fraction with fast TT, it is often used as an early indicator for disturbances. Input of
CWD as fragmented material would result in an increase of the fPOM fraction (Crow et al. 2007).
The oPOM fraction contains highly fragmented plant debris (Wagai et al. 2008) and it is assumed to
respond to disturbance within decades or centuries (Hedde et al. 2008, Don et al. 2009). The MaOM
fraction has a low amount of plant-derived compounds and a high proportion of compounds derived
from microbial cells (Wagai et al. 2008, Miltner et al. 2011). CWD has the potential to contribute to
87

all fractions through dissolved organic carbon (DOC) production. An increase in DOC underneath
CWD logs (Spears et al. 2003) has the potential to increase the soil organic carbon (SOC) stock as
DOC leached from CWD has the same stability as background organic matter from other sources
(Lajtha et al. 2005).
Only the fast turning C pools have the ability to sequester high amounts of C in a relatively short
time period, whereas the recalcitrant C pool accumulated over thousands of years and turns over
very slowly (Hahn 2004). Radiocarbon signatures have been used to calculate the TT of SOM or to
detect changes in the SOM pools (Gaudinski et al. 2000, Torn et al. 1997). It thus represents a
powerful tool to investigate the fate of C from CWD in the soil and to evaluate the impact of
management changes on TT of SOM.
This study was conducted to evaluate the influence of management practices on the C sequestering
potential of a forest in the time span of decades. The following aspects were investigated: (1) the C
stocks of CWD in managed and unmanaged forests, (2) the management effect on the C stocks in
the forest floor and the mineral soil and (3) the management effect on radiocarbon signature and the
TT of organic C in the forest floor and mineral soil. A new model approach was employed to assess
the TT of organic C in the forest floor with three different C input sources including fine woody
debris (FWD), CWD, and organic material from the Oi horizon.
Material and methods
Study sites and general concept
Managed and adjacent unmanaged forests were compared at three different study sites in Bavaria,
Germany: Ludwigshain, Rohrberg and Grübel. Each site represents a different geological region and
different micrometeorological conditions. Further, different tree species (European beech, Sessile
oak, Norway spruce) are dominant in each forest.
Grübel (49°07’ N 013°07’ E) is a 56.3 ha Norway spruce (Picea abies L.) forest reserve situated at
1250 m a.s.l. Mean average temperature is 3-4°C and mean annual precipitations are 1500 mm. The
soil is a Podzol on gneiss with a highly variable forest floor. The pH-value is 3.1 in the upper 10 cm
of the mineral soil and increases to 4.4 in 50-100 cm soil depth. The even aged forest is about 260
years old and has been protected since 1978. Above-ground timber biomass is about 450 m³ ha -1 in
the unmanaged forest and 500 m³ ha-1 in the managed forest. Information of stand history is scarce;
no thinning procedures took place in the past 20 years in the managed forest. In the unmanaged
forest, single trees were cut due to bark beetle infestation. In most cases, the bark of the trees was
removed and the logs were left in the forest.
88

Ludwigshain (49°55’ N 011°48’ E) consists of 2.4 ha unmanaged beech-oak forest situated at an
altitude of 460 m a.s.l. Mean average temperature is 7-8°C, mean annual precipitations are 650-750
mm. The soil is a calcaric Luvisol and developed on Franconian Jura. Soil pH increases from 3.6 in
the top 10 cm of the mineral soil to 6.8 in 50-100 cm soil depth. The forest has been protected since
1913, though high grade wood, especially oak, of trees that succumbed to natural mortality was
removed until the mid-1960s. The mean tree age is 370 years, with oak trees of up to 470 years. In
part of natural succession, dead oak trees were replaced by beech saplings, thereby increasing the
natural dominance of beech. Currently about 30% of the living trees in the unmanaged forest are
Sessile oaks (Quercus petraea (Mattuschka) Liebl.) and 70% are European beeches (Fagus
sylvatica L.). Above-ground timber biomass is estimated at 350 m³ ha-1. The managed forest is a
125-year-old forest stand with 30 % European beech and 70 % Sessile oak. Above-ground timber
biomass is 400 m³ ha-1. Historical sources indicate permanent usage of the site as forest since human
colonization. Reliable forestry records are available for the past 20 years. The last thinning
procedure was conducted 10 years prior to the study, when 337 m³ wood ha-1 were removed.
Rohrberg (49°54’ N 009°26’ E) is a 9.9 ha unmanaged beech-oak forest located in the Hochspessart
on Sandstone. The soil is a Cambisol with typical moder as dominant humus form. Soil pH values
increase from 3.0 in the top 10 cm of the mineral soil to 4.0 in 50-100 cm soil depth. Mean average
temperature is 7-8°C, mean annual precipitation is 950-1100 mm. The forest has been protected
since 1928. Mean stand age is 550 years with up 840-year-old oak trees. As beech is becoming more
dominant as part of natural succession, several dominant beech trees were cut in 2002 to maintain
oaks. All cut beeches remained in the forest. Currently, above-ground timber biomass is 300 m³ ha -1,
consisting of about 30% European beech and 70% Sessile oak. The site of the managed forest is
separated in two parts with a 100-year-old beech forest and a 65-year-old oak forest. Average tree
species distribution is 50 % European beech, 45 % Sessile oak and 5 % European larch (Larix
decidua Mill.). Above-ground timber biomass is estimated to be 350 m³ ha-1. The last thinning
procedure with harvest of 106 m³ ha-1 wood took place three years prior to the study.
Above-ground coarse woody debris inventory
Within an area of 1 ha, above-ground woody debris, including logs, branches, snags and stumps
with a diameter > 7 cm, was completely inventoried as CWD in 2010. Each piece of CWD was
measured and attributed to a decay class (Table 4.1) following Goodburn & Lorimer (1998). CWD
volumes were calculated from multiple measurements of length and diameters using volume
formulas under the assumption that CWD pieces are regular cones or cylinders (Bebber & Thomas
89

2003). It is assumed that over- and underestimation of individual pieces levels out over the total
stock.
Table 4.1: Decay class (DC) characteristics of coarse woody debris (CWD).
Decay class Characteristics
1 Recently dead, bark intact, small twigs and leaves, no visible signs of decomposition
2 Bark mostly remaining, no leafs, wood not penetrable by a knife
3 Bark mostly missing, wood partly penetrable with knife, visible discoloration
4 No bark, wood completely penetrable with knife, deformation and discoloration
5 Wood soft, breakable with fingers, advanced humification
To investigate wood density and C concentration, samples were taken by drilling holes of known
volume and by collecting all shavings. The shavings were dried at 60°C until mass constancy. Sub-
samples were ground with a ball mill for further analysis. For conversion of CWD volumes to C
stocks, site specific average wood densities and C concentrations were calculated for each tree
species and decay class. The amount of C in a volume of CWD in kg C m -3 (hereafter C density)
was used as a unit to compare the C loss from CWD. This unit considers changes in density and C
concentration of CWD, but not loss of the initial wood volume. For calculation of CWD production
and disappearance time, time of tree death was determined with radiocarbon analysis
dendrochronological cross-dating (Krüger et al., in prep.).
Accumulation and disappearance time of coarse woody debris
CWD accumulation is calculated from CWD production and CWD loss. The decadal CWD
production is estimated from time of tree death. In accordance to decay classes, the time of tree
death distribution is extrapolated for the whole CWD stock. CWD stocks (m3 ha-1) with time of tree
death of up to 20 years for beech and up to 40 years for oak and spruce were used for calculation of
the decadal CWD production. To reconstruct CWD C production from age class distribution we
assume that the initial C concentration and wood density correspond to undecomposed wood.
Volume loss is assumed to play an inferior role in early stages of decay (Harmon et al. 1986).
Disappearance times are defined as the time period between death and decay of a tree or branch to
fractions < 7 cm in diameter. Disappearance times are calculated from dated CWD logs and their C
density. Yearly C losses from current C stocks are calculated assuming linear functions derived from
the disappearance times.
90

Soil sampling
Within an area of 2 ha, 30 plots were measured at regular intervals in each of the three unmanaged
and managed forests. At each plot, the forest floor was sampled with a quadratic sampler of 20 cm
length. The forest floor was separated by horizon in Oi, Oe and Oa material. Fine woody debris
(FWD), with a diameter of 0.2 - 7 cm, was separately collected as an additional component of the
forest floor. The upper 0-10 cm of the mineral soil was sampled with a core cutter (10 cm height,
8.6 cm diameter). At the same plot, the soil was sampled up to 1 m depth with a percussion drill and
separated by the depth intervals 10-20 cm, 20-50 cm and 50-100 cm. The samples were dried at
60°C until mass constancy. Samples were sieved (<2 mm), visible roots and stones sorted out and
weighted. A sub-sample of the fine earth material was ground with a ball mill for C analysis. The
bulk density was determined from additional samples taken with a core cutter and by correcting the
samples taken by percussion drill for compression.
Density fractionation
For density fractionation, a pooled sample per soil depth and each managed and unmanaged forest
was mixed from 30 sub-samples of equal dry mass. A procedure adapted from John et al. (2005) and
Schulze et al. (2009) was used for density fractionation. Dry soil samples (<2 mm, 60°C) were
dispersed in sodium polytungsten (TC-Tungsten Compounds SPT-0) solution at densities of 1.6 g
cm-3 and 2.0 g cm-3. In the first fractionation step, 10 g of soil and 40 ml of SPT with a density of 1.6
g cm-3 were shaken for 60 min. The solution was centrifuged at 5085 g for 15 min (Varifuge® 3.2
RS Heraeus SEPATECH). The supernatant with particles was filtered through a 0.4 μm pre-washed
membrane filter (IsoporeTM membrane filter HTTP04700, Millipore). In the second fractionation
step, the pellet was treated with the same procedure with a 2.0 g cm -3 SPT solution. The supernatant
with particles constitutes the oPOM fraction and the pellet contains the MaOM fraction. All
fractions were washed with de-ionized water until the conductivity of the solution was <10 μS,
subsequently dried at 60°C and ground with an agate mortar. Calcareous samples were treated with
0.6 mol HCl for 48 hours to remove all inorganic C.
Chemical analysis
C analysis were conducted by the Chemical Analytics of the BayCEER or in the laboratory of the
Department of Soil Ecology at the University of Bayreuth with a CN analyser (Elementar Vario EL,
Hanau, Germany). Calcareous soil samples were decalcified by fumigation with concentrated HCl
prior to the C measurement. Soil pH was measured in a 0.01 CaCl2 solution (soil:solution ratio
1:2.5) with a WTW pH315i sensor.
91

Radiocarbon signatures of forest floor, bulk mineral soil and density fractions were measured by
accelerator mass spectrometry (AMS). Sub-samples of 0.8 mg C were combusted in sealed quartz
tubes with CuO as oxidizer and silver wire for 2 hours at 900°C. The resulting CO2 was
cryogenically purified from water and non condensable compounds and converted to graphite
targets using the modified sealed tube zinc reduction method described by Xu et al. (2007). The
preparation of the samples took place at the Department of Soil Ecology at the University of
Bayreuth. The radiocarbon signatures were measured by the Keck-CCAMS of the University of
California, Irvine using an AMS with a precision of 2-3‰. Radiocarbon data are expressed as Δ14C,
which is the per mil deviation from the 14C/12C ratio of oxalic acid standard in 1950. The sample
14C/12C ratio has been corrected to a δ13C value of -25‰ to account for any mass dependent
fractionation effects (Stuiver & Polach 1977).
Calculation of turnover time
The TT of C of each horizon or soil depth of the forest floor, mineral soil and density fraction was
calculated from its radiocarbon signature. We used non-steady state models for the forest floor and a
steady state model for the mineral soil. For the forest floor, input pools with different radiocarbon
signatures were considered. We assume that all input to the Oi horizon corresponds to fresh leaf
litter. The TT of C of the Oe horizon is estimated considering the input from the Oi horizon, FWD
and CWD. For the estimation of the TT of C in the Oa horizon, inputs from the Oe horizon and root
litter are considered. For the TT of C in the bulk samples of the mineral soil and the density
fractions, a steady state model was used following Gaudinski et al. (2000). The radiocarbon
signatures of the forest floor, FWD and the mineral soil were measured and the average radiocarbon
signature of CWD stocks were estimated based on stand age and production time of CWD. For
modern radiocarbon signatures, two TT are possible. The calculations are explained in detail in the
Supporting information (S1).
Statistical analysis
All statistical analyses were performed with R 2.9.2 (R Development Core Team 2009) and Open
Office Calc 3.4.0 with the implemented SCO Evolutionary Algorithm to solve non-linear equations.
Differences in C stocks between management forms were tested with a Student’s t-test with a
confidence interval of p<0.05. Two-way ANOVAs were conducted to test the differences between
study sites.
92

Results
Carbon stocks of above-ground coarse woody debris
CWD accumulated to 64 (Grübel), 165 (Ludwigshain) and 132 (Rohrberg) m³ ha-1 in the unmanaged
forests and to about 30 m³ ha-1 in the managed forest. This corresponded to CWD stocks of 11 to 30
Mg C ha-1 in the unmanaged forests and about 5 Mg C ha-1 in the managed forests (Table 4.2). CWD
stocks in the unmanaged forests were thus 2-6 times higher than in managed forests. Irrespective of
forest management and tree species, most C was generally stored as decay stage 2 and 3. Up to 10 %
of the soil surface was covered with CWD in the unmanaged forests, whereas less than 1 % of the
soil was covered by CWD in the managed forests.
The distribution of decay class (Table 4.2) was related to the pattern of age distribution in all forests
(Fig. 4.1). Assuming that age distribution of CWD stocks corresponded to CWD production, mean
annual CWD production ranged between 100 and 250 kg C ha-1 a-1 in the managed and between 230
and 1180 kg C ha-1 a-1 in the unmanaged forests on a decadal time scale (Table 4.3). The unmanged
forest at Grübel had a relatively small production rate similar to the managed forest at Ludwigshain
and Rohrberg. Ludwigshain and Rohrberg showed distinct tree species patterns (Fig. 4.1): at
Ludwigshain, CWD production of oak and beech was in a similar range over the last decades
whereas at Rohrberg CWD production of beech was more than five times higher than oak. Similar
patterns but lower production rates were found in the unmanaged forests.
We found significant differences in C density of CWD between tree species, decay classes and study
sites (p<0.001) (not shown). Despite the unequal distribution, CWD of beech or oak from Rohrberg
and Ludwigshain were pooled to achieve a better representation of the decay classes. The
correlation between C density of CWD and time since tree death was best represented by a linear
function for beech (adjusted R²=0.61, p<0.01, y=279.1-8.6x) and spruce (adjusted R²=0.57,
p<0.001, y=242.4-3.5x) (Fig. 4.2a, 4.2c) whereas no correlation was found for oak (Fig. 4.2b).
Disappearance times of 30 years for beech and 70 years for spruce were estimated. The times of tree
death of the dated oak CWD indicated that it can remain in forest for as long as spruce. For further
calculations, a disappearance time of 70 years was assumed for oak CWD. Mean annual C loss of
CWD, calculated from the disappearance time, ranged between 0.06 to 0.73 Mg C a-1 resulting in an
annual accumulation of 0.04 – 0.51 Mg C a-1 (Table 4.3).
93

Table 4.2: Carbon stocks in three unmanaged and managed forests in the above-ground coarse woody debris (CWD) separated in decay class (DC), the
forest floor including FWD and the mineral soil up to 1 m depth. Standard errors are given in parentheses.
Forest DC1 DC2 DC3 DC4
[Mg C ha-1]
DC5 Total CWD Forest floor Mineral
soil
Grübel managed 0.2 1.1 1.8 0.9 0.3 4.3 15.0 (1.2) 233 (16)
unmanaged 0.4 3.0 5.8 1.9 0.2 11.3 15.1 (1.5) 262 (21)
Ludwigshain managed 0.0 0.4 2.2 1.9 0.6 5.1 4.0 (0.9) 56 (5)
unmanaged 0.7 14.3 10.3 3.6 1.2 30.4 4.1 (0.7) 48 (3)
Rohrberg managed 0.0 2.6 1.8 0.9 0.3 5.6 8.0 (0.8) 115 (8)
unmanaged 3.4 5.1 11.1 3.2 0.4 23.2 8.0 (0.7) 112 (7)
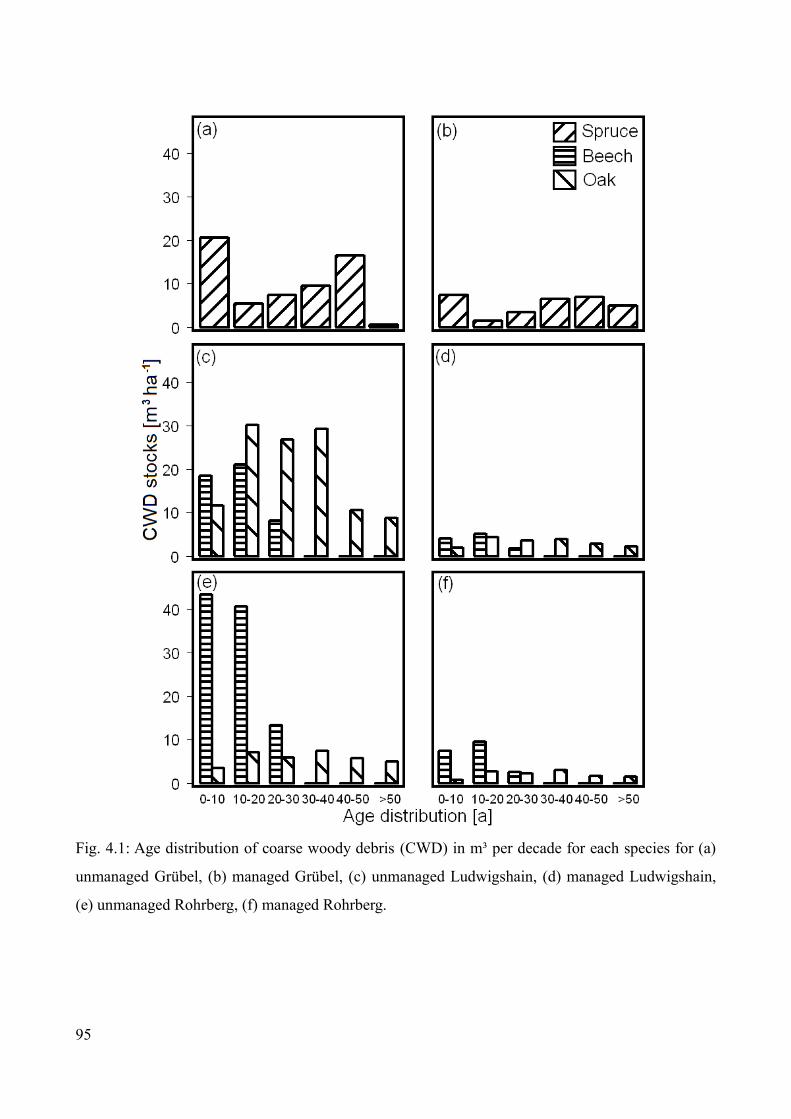
Fig. 4.1: Age distribution of coarse woody debris (CWD) in m³ per decade for each species for (a)
unmanaged Grübel, (b) managed Grübel, (c) unmanaged Ludwigshain, (d) managed Ludwigshain,
(e) unmanaged Rohrberg, (f) managed Rohrberg.
95

Fig. 4.2: Correlation between carbon density and time since tree death for lying logs with diameter
>20 cm for the tree species (a) European beech, (b) Sessile oak and (c) Norway spruce.
96

Table 4.3: Model results for coarse woody debris production, loss and accumulation.
Forest CWD
production
CWD loss
[kg C ha-1 a-1]
CWD
accumulation
Grübel managed 100 60 40
unmanaged 230 160 70
Ludwigshain managed 200 100 100
unmanaged 1080 570 510
Rohrberg managed 250 130 120
unmanaged 1180 730 450
Carbon stocks of forest floor and mineral soil
C stocks in the forest floor including FWD ranged from 4.0 to 15.1 Mg C ha -1 (Table 4.2). No
significant differences between managed and unmanaged forests were found for any site. C stocks in
the Oi horizon were slightly lower in the managed forest at Rohrberg and Ludwigshain and slightly
higher at Grübel (Fig. 4.3). C stocks in the FWD ranged between 0.3-1.1 Mg C ha-1 and were higher
in the managed than in the unmanaged forests (Fig. 4.3). The C stock of the forest floor were 6
times lower than the C stock of CWD in the unmanaged forest of Ludwigshain and Rohrberg, but of
similar range in the unmanaged forest of Grübel.
In the mineral soil, the SOC concentration decreased from 3.5-17.6% at 0-10 cm to 0.2-1.1% at 50-
100 cm soil depth. Differences in SOC concentration were greater among the study sites than
between the management forms (Table 4.4).
The SOC stocks up to 100 cm depth accumulated to 48-262 Mg C ha-1 (Table 4.2). No significant
differences between management forms were found. C Stocks were slightly lower in the unmanaged
forests at Ludwigshain and at Rohrberg than in the corresponding managed forests. At Grübel, SOC
stocks were slightly higher in the unmanaged than in the managed forest. C stocks in fine roots up to
1 m depth ranged from 3.4-13.4 Mg C ha-1 (data not shown).
The percentage of the total C stock in the fPOM decreased with soil depth from 20-70 % at 0-10 cm
soil depth to 10-30 at 50-100 cm soil depth. The percentage of the total C stock in the MaOM
increased from 5-40 % at 0-10 cm soil depth to 50-85 % at 50-100 cm soil depth (Fig.4.4). The
percentage of C in oPOM showed no consistent pattern. A two-way ANOVA revealed significant
97

influences of forest sites on the distribution (p<0.01), but no effects of management. C stocks in the
fPOM fractions were higher in the managed forests at Ludwigshain and Grübel and lower in the
managed forest at Rohrberg (Fig. 4.4).
Fig. 4.3: Carbon stocks in forest floor in Mg C ha-1 for (a) unmanaged Grübel, (b)
unmanaged Ludwigshain, (c) unmanaged Rohrberg, (d) managed Grübel, (e) managed
Ludwigshain, (f) managed Rohrberg.
Turnover times of carbon in the forest floor
Radiocarbon signatures indicated mainly modern C in the Oi (40 – 82 ‰), Oe (65 – 137 ‰) horizons
of all study sites and in the Oa (110 - 128 ‰) horizon at Rohrberg, but more pre-bomb C in the Oa
(82 - 97 ‰) horizon at Grübel (Table 4.5). FWD had a radiocarbon signature of 126 - 154 ‰
indicating an age of 16-20 years since photosynthetic fixation. In the Oe horizons, radiocarbon
signatures were consistently lower in the unmanaged than in the managed forests at all study sites.
The difference was most pronounced in the combined Oe/Oa horizons at Ludwigshain.The TT of C
in the Oe horizon was calculated assuming different scenarios of C input from the leaf litter in the Oi
horizon, CWD and FWD (see Supporting Information S1).
98

Table 4.4: Soil characteristics, standard errors are given in parentheses.
Grübel - unmanaged Grübel - managedBulk
density [g
cm-3]
Fine earth
[%]
pH SOC [%] N [%] Bulk
density [g
cm-3]
Fine earth
[%]
pH SOC [%] N [%]
Oi 50.1 (0.2) 1.56 (0.08) 50.2 (0.7) 1.73 (0.07)Oe 46.7 (0.5) 2.17 (0.06) 45.8 (0.9) 2.20 (0.07)Oa 41.9 (0.8) 2.25 (0.05) 39.4 (1.4) 2.14 (0.08)0-10
cm
0.7 78 3.15 17.6 (2.0) 0.97 (0.12) 0.7 71 3.15 14.8 (1.5) 0.79 (0.08)
10-20
cm
1.1 56 3.42 8.5 (1.2) 0.46 (0.07) 1.1 69 3.38 6.9 (0.7) 0.35 (0.04)
20-50
cm
1.6 42 4 3.1 (0.3) 0.13 (0.01) 1.6 50 3.99 2.2 (0.2) 0.10 (0.01)
>50
cm
1.8 48 4.4 1.1 (0.1) <0.05 1.8 47 4.42 0.8 (0.1) <0.05

Ludwigshain - unmanaged Ludwigshain - managed
Bulk density
[g cm-3]
Fine earth
[%]
pH SOC [%] N [%] Bulk density
[g cm-3]
Fine earth
[%]
pH SOC [%] N [%]
Oi 46.6 (0.3) 1.30 (0.03) 47.4 (0.2) 1.05 (0.02)Oe/Oa 33.9 (1.5) 1.50 (0.05) 38.5 (0.7) 1.59 (0.04)0-10 cm
1.0 64 3.59 3.8 (0.2) 0.20 (0.01) 1.0 81 3.72 3.5 (0.2) 0.18 (0.01)
10-20 cm
1.0 54 3.85 1.5 (0.1) 0.09 (0.00) 1.0 49 4.08 1.8 (0.2) 0.09 (0.01)
20-50 cm
1.2 36 4.25 0.7 (0.0) 0.06 (0.00) 1.2 39 6.28 0.7 (0.1) 0.06 (0.00)
>50 cm
1.7 22 6.75 0.3 (0.0) 0.04 (0.00) 1.7 38 6.88 0.3 (0.0) 0.04 (0.00)

Rohrberg - unmanaged Rohrberg - managed
Bulk
density [g
cm-3]
Fine earth
[%]
pH SOC [%] N [%] Bulk
density [g
cm-3]
Fine earth
[%]
pH SOC [%] N [%]
Oi 47.2 (0.2) 1.62 (0.04) 47.7 (0.2) 1.38 (0.05)Oe 43.2 (0.8) 1.99 (0.05) 42.5 (1.3) 1.80 (0.05)Oa 33.3 (1.6) 1.72 (0.08) 37.9 (1.5) 1.80´(0.07)0-10
cm
0.9 90 2.97 4.9 (0.3) 0.25 (0.01) 0.8 90 2.98 6.0 (0.5) 0.30 (0.03)
10-20
cm
1.0 84 3.3 3.3 (0.4) 0.16 (0.02) 1.0 77 3.29 2.8 (0.2) 0.13 (0.01)
20-50
cm
1.2 78 3.95 1.2 (0.1) 0.07 (0.01) 1.2 69 3.94 1.4 (0.1) 0.07 (0.00)
>50
cm
1.6 76 3.98 0.2 (0.0) <0.05 1.6 71 3.91 0.2 (0.0) <0.05

Fig. 4.4: Stocks of soil organic carbon in the three density fractions (fPOM, oPOM, MaOM) in four soil depths for three unmanaged and managed
forests. “Loss” indicates the amount of soil organic lost during density fractionation for (a) unmanaged Grübel, (b) unmanaged Ludwigshain, (c)
unmanaged Rohrberg, (d) managed Grübel, (e) managed Ludwigshain, (f) managed Rohrberg.

With fragmented leaf litter from the Oi horizon as single C input, TTs of C in the Oe horizon varied
between 5.1 and 18.6 years. However, TTs of C in the Oe horizons were always shorter in the
unmanaged forests than in the managed forests. The difference was smallest at Rohrberg (5.1 vs, 6.2
years) followed by Grübel (7.9 vs. 10.0 years) and Ludwigshain (5.1 vs. 18.6 years). The proportion
of input to the Oe horizon from the Oi horizon (hOi) ranged between 10 and 40 %.
The simulated increase of CWD input (up to 10 % of CWD loss) resulted in longer TT of C in the
Oe horizon irrespective of management and site (Fig. 4.5a-c). The sole exception was the managed
forest Rohrberg, where the TT of C in the Oe horizon decreased from 6.2 to 5.6 years at a CWD
input of 10 %. The increase of CWD input resulted in a bigger difference in TT of C in the O e
horizon in the unmanaged than in the managed forest (Fig. 4.5d-f). The increase was most important
in the unmanaged Ludwigshain, where the TT of C in the Oe horizon increased from 5.1 to 10 years
with an input of 10 % CWD (Fig. 4.5b). The uncertainty from the radiocarbon signature of CWD
was slight. When the proportion of CWD input was less than 5 %, a variation of the radiocarbon
signature of CWD resulted in a difference of TT of less than one year. An increased input of CWD
resulted in a lower proportion of input from the O i horizon (hOi). At equal HCWD values or TT, the hOi
values in the managed and unmanaged forests did not correspond. After consideration of FWD as
input to the Oe horizon, the calculated TTs of C in the Oe horizon increased by 1.5 – 3.7 years.
Under all scenarios and at all study sites, TTs of the Oe horizon were faster in the unmanaged forests
at the same CWD input than in managed forests. TTs of C In the Oa horizon ranged from 55-80
years. TTs of C in the Oa horizon in the unmanaged forests are faster at Grübel and slower at
Rohrberg than in the managed forests.
Turnover times of carbon in the mineral soil
The radiocarbon signature of SOC in bulk soil decreased consistently with soil depth in all forests
(Table 4.5). Accordingly, the TTs of SOC in bulk mineral soil range from 130-470 years in 0-10 cm
depth to 740-3900 years in 50-100 cm depth (Table 4.5). Differences among the study sites were
greater than between the management types. Similar to the bulk soil, radiocarbon signatures of
density fractions generally decreased with soil depth in the order fPOM>oPOM>MaOM. TTs in the
fPOM fraction were shorter (5-270 years) than in the oPOM (160-3600 years) and the MaOM
fractions (125-4200 years) and decreased with soil depth. One exception is the fPOM fraction at
Ludwigshain where radiocarbon signatures and TT remained almost constant with increasing depth
at both the managed and unmanaged forests.
103

Table 4.5: Radiocarbon signatures of bulk soil and density fractions of three unmanaged and managed forests Grübel, Ludwigshain and Rohrberg. The
turnover times expressed in years (given in parentheses) were calculated from radiocarbon signature with a steady state model.
Grübel - unmanaged Grübel - managed
Bulk FPOM OPOM
[Δ14C‰]
MAOM DOC Bulk FPOM OPOM
[Δ14C‰]
MAOM DOC
Oi 73 82
Oe 112 137
Oa 97 82
0-10 cm 11 (280) 13 (270) -85 (900) -152
(1450)
31 (200) -25 (470) 36(190) -77 (840) -110
(1100)
34 (200)
10-20 cm -113
(1120)
-61 (710) -134
(1300)
-198
(1830)
-12 (390) -124
(1210)
-32 (510) -109
(1090)
-177
(1660)
-27 (480)
20-50 cm -265
(2400)
-100
(1000)
-238
(2200)
-317
(2900)
-238
(2180)
-29 (495) -254
(2320)
-328
(2950)
>50 cm -440
(3900)
-368
(3300)
-401
(3600)
-479
(4200)
-432
(3850)
-302
(2720)
-362
(3240)
-458
(4070)

Ludwigshain - unmanaged Ludwigshain - managed
Bulk FPOM OPOM
[Δ14C‰]
MAOM DOC Bulk FPOM OPOM
[Δ14C‰]
MAOM DOC
Oi 41 46
Oe/Oa 65 134
0-10 cm 37 (190) 61
(5/130)
41
(1/165)
65
(6/130)
92
(10/90)
45
(2/170)
64
(5/130)
44
(2/170)
32 (200) 101
(11/80)
10-20 cm -2 (340) 38 (190) -60 (710) -46 (610) 38 (190) -5 (350) 16 (260) -26 (470) -48 (620) 63
(5/130)
20-50 cm -58 (690) 98
(11/80)
-59 (710) -115
(1150)
-82 (880) 27 (220) -46 (610) -135
(1300)
>50 cm -95 (980) 113 (170) -107
(1070)
-294
(2650)
-116
(1150)
84
(9/100)
-175
(1640)
-278
(2530)
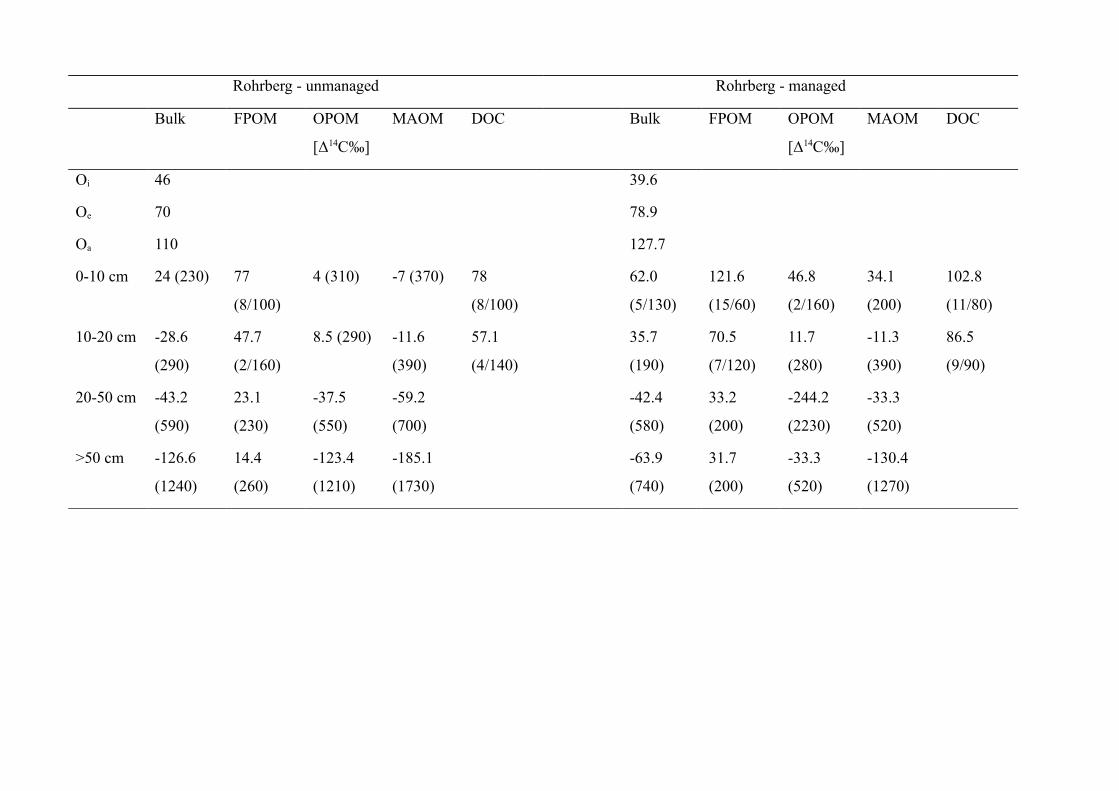
Rohrberg - unmanaged Rohrberg - managed
Bulk FPOM OPOM
[Δ14C‰]
MAOM DOC Bulk FPOM OPOM
[Δ14C‰]
MAOM DOC
Oi 46 39.6
Oe 70 78.9
Oa 110 127.7
0-10 cm 24 (230) 77
(8/100)
4 (310) -7 (370) 78
(8/100)
62.0
(5/130)
121.6
(15/60)
46.8
(2/160)
34.1
(200)
102.8
(11/80)
10-20 cm -28.6
(290)
47.7
(2/160)
8.5 (290) -11.6
(390)
57.1
(4/140)
35.7
(190)
70.5
(7/120)
11.7
(280)
-11.3
(390)
86.5
(9/90)
20-50 cm -43.2
(590)
23.1
(230)
-37.5
(550)
-59.2
(700)
-42.4
(580)
33.2
(200)
-244.2
(2230)
-33.3
(520)
>50 cm -126.6
(1240)
14.4
(260)
-123.4
(1210)
-185.1
(1730)
-63.9
(740)
31.7
(200)
-33.3
(520)
-130.4
(1270)

Fig. 4.5: Proportion of input to the Oe horizon from total C loss of the Oi horizon and from total coarse woody debris (CWD) loss in Grübel (a),
Ludwigshain (b) and Rohrberg (c) and turnover time (TT) of the Oe horizon for proportion of input of total CWD loss in Grübel (d), Ludwigshain (e)
and Rohrberg (f). The scenario with no consideration of fine woody debris (FWD) is shown in straight lines, the scenario with consideration of FWD is
shown in dashed lines. Black/grey lines give mean radiocarbon signature of CWD (mCWD), blue/green lines give the upper limit of radiocarbon signature
of CWD (mCWD+20 Δ14C ‰) and red/orange lines the lower limit of radiocarbon signature of CWD (mCWD-20 Δ14C ‰) in the unmanaged and managed
forests respectively.

In the fPOM and MaOM fractions of Grübel and Rohrberg, the radiocarbon signature were lower in
the unmanaged forest than in the managed forest, but exhibited an opposite pattern at Ludwigshain.
At all forest sites, radiocarbon signatures of the oPOM fraction were mostly lower in the
unmanaged than the managed forest. Differences between management types were greatest in the
fPOM fraction across all study sites and soil depths with a median difference of 20 ‰, whereas the
median difference in the oPOM and the MaOM fraction was 11 ‰.
Discussion
Stocks and turnover of coarse woody debris
CWD stocks of 132 and 165 m³ ha-1 in the unmanaged oak-beech forests at Rohrberg and
Ludwigshain are in the same range as reported for European beech (50-200 m³ ha-1) and oak (70-160
m³ ha-1) forest reserves (Christensen et al. 2005). In the unmanaged spruce forest, the CWD stock of
64 m³ corresponds to the CWD stocks (27-131 m³ ha-1) of subalpine spruce forests withdrawn from
management (Motta et al. 2010, Holeksa 2001). The calculated accumulation rate of CWD of 2.8 m3
ha-1 a-1 in the unmanaged beech-oak forests is at the lower end of the scale reported by
Vandekerkhove et al. (2009) of 0.1 – 19 m³ ha-1 a-1, but above the median value of 1.6 m3 ha-1 a-1. In
the spruce forest, the accumulation rate is smaller, possibly because of the younger age structure of
the forest in comparison to the older beech-oak forests. CWD stocks of 30 m³ ha-1 in all managed
forests are higher than those reported for managed forests (about 6 m³ ha-1) in Germany (Baritz et al.
2000) or for mixed forests (21.5 m³ ha-1) in Switzerland (Weggler et al. 2012). CWD stocks are
currently increasing in managed forests due to management measures in Bavaria (oral
communication), though the accumulation rate is still smaller than in the unmanaged forests.
Disappearance times of CWD in the order beech < spruce < oak correspond to values in other
forests of central Europe (Rock et al. 2008). The high variability in disappearance time can be
attributed to the variation in abiotic and biotic factors that affect CWD on a punctual scale. The
variability is greater when CWD is partially in contact with the soil due to different colonization by
wood decomposing fungi. Despite the variability, a correlation between time since tree death and C
density was found for beech and spruce CWD. The lack for CWD of oak can be attributed to a high
variability in its wood chemistry (Puech et al. 1999), partial dieback of stem and branches while
new tissue is being formed (Ranius et al. 2009). Further, decay of logs and snags are different,
highlighting that TT of logs depend on whether it originated from a fallen snag or living tree. The
old age of individual trees with high C densities suggests that oak CWD has the potential to remain
for many decades in forests. This makes oak a suitable tree species to increase CWD stocks in
108

forests. Despite lower production rates than beech, oak can contribute more to total CWD stocks in
unmanaged and managed forests. Despite lower C stocks, the high proportion of beech CWD (75
%) at Rohrberg resulted in higher C losses compared to Ludwigshain. At Grübel, CWD production
is smaller than in the other investigated forests, however, as spruce decays within a similar time than
oak, the forest has the potential to accumulate high amounts of C in its CWD stocks. Relatively low
temperatures likely slow down the decay of CWD at Grübel, suggesting that not only the quality of
spruce CWD impacts its disappearance time but also climatic conditions. Q10 values of 2.7-3.4 for
CWD decomposition (Yatskov et al. 2003) would result in disappearance times that are about 50 %
longer given the difference in annual mean temperatures of 4 K between Grübel and the beech-oak
forests.
Carbon stocks of the forest floor and mineral soil
C stocks of FWD in the forest floor are higher in the managed forests than in the unmanaged forests
at all study sites. The C stocks of FWD are in the same range or higher than mean FWD C stocks of
2.5 to 4.0 Mg ha-1 described in forests in the U.S (Woodall & Liknes 2008). In the managed forests,
the input and stock of FWD depends on the management procedures and the time period since the
last thinning (Vávřová et al. 2009). As thinning procedures are conducted in regular intervals, a
sinus function was found suitable to model the changes of FWD production.
Forest management did not affect the C stock of the O horizons. The lack of significant differences
between management forms indicates that CWD is either insignificant for the formation of organic
matter or management affects other factors (see below) which counterbalance the C input by CWD.
The lack of significant differences in the C stock of the Oi horizon underpins that mortality of single
trees and differences in tree age have minor influence on litter production of the study sites. The
unmanaged forests at Ludwigshain and Rohrberg have even slightly higher C stocks in the O i
horizon, suggesting similar litterfall in managed and unmanaged forests. Minor differences in the C
stocks of the Oe or Oa horizons between the management forms can be attributed to natural
variability of the forest floor or incomplete separation of genetic horizons. Our results demonstrate
that CWD has no or little potential to increase the C stock of the forest floor although the Oe
horizons contained considerable portions of FWD and CWD. The imprint of FWD and CWD is
further discernible through the radiocarbon signature and TT of the Oe horizons (see below).
The SOC stocks in the mineral soil of our study sites were in the range of similar forests surveyed in
the Bavarian Soil Inventory (Wiesmeier et al. 2012). At Grübel, parts of the site consist of poorly
drained soils resulting in very high C stocks of 250 Mg C ha-1.
109

Differences between study sites are greater than between management forms. This indicates that
management had none or minor importance in comparison to tree species and abiotic factors. Our
study supports findings by Kahl et al. (2013) that C stocks of the mineral soil are not influenced by
the presence of CWD.
Radiocarbon signatures and carbon turnover in the forest floor
Forest management has more effect on the forest floor than on the mineral soil (DeGryze et al.
2004). Differences in radiocarbon signatures between management forms were notable for the Oe
and Oa horizons. In the Oi horizons, differences in radiocarbon signatures are within measurement
uncertainty.
Many modeling approaches do not consider input to the Oe horizon other than Oi material (e.g.,
Gaudinski et al. 2000, Schulze et al. 2009) though low radiocarbon signatures of the Oe horizon
have been attributed to the presence of CWD (Trumbore & Harden 1996). We found that
consideration of CWD input can increase the calculated TT of the Oe horizon by up to 5 years.
Consideration of FWD input resulted in an increase of the calculated TT by up to 4 years. This
modeling approach displays large uncertainties in the calculated TTs at different C inputs of
different radiocarbon signature. A C loss from the CWD stock by fragmentation of up to 5 % was
assumed as respiration and DOC leaching make up a the C loss of up to 95 % (Chen et al. 2000,
Olajuyigbe et al. 2012). We found that even a CWD input to the Oe horizon of 10 % of the annual C
loss from CWD is not sufficient to explain the differences in radiocarbon signatures between the
managed and unmanaged forests. Hence, the lower radiocarbon signatures of the Oe horizons in the
unmanaged forests can be attributed to faster decay of leaf litter.
CWD has the capacity to modify a range of soil characteristics including the heterogeneity of
organic compounds (Strukelj et al. 2012), the pH value (Klinka et al. 1995) and the microbial
community of the soil (Rajala et al. 2012). A high abundances of CWD can increase the size of the
fungal community in the soil and result in a shift of the fungal:bacterial ratio (Brant et al. 2006).
This leads to a better utilization of phenol and oxalate in contrast to bacterially dominated
communities with low capacity to degrade such compounds (Brant et al. 2006). The promotion of
the fungal community by CWD input might result in faster TTs of the Oe horizon in the unmanaged
forests.
The influence of CWD on the radiocarbon signature and TT of the Oa horizon at Grübel and
Rohrberg seems to be of minor importance. It is likely that CWD almost completely decays in the
Oe horizon and thus contributes little to the buildup of the Oa horizon. TTs of 55-80 years in the Oa
110

horizon are relatively slow and correspond to about half or twice the period since forest protection
at Rohrberg and Grübel, respectively. The time since a relevant additional CWD stock has
accumulated might not have been sufficient to induce significant effects on the decomposition
processes in the Oa horizon.
Radiocarbon signatures and carbon turnover in the mineral soil
Positive radiocarbon signatures of the bulk soil were only found in 0-10 cm soil depth, pointing to
large inputs of modern C. In greater soil depths, negative radiocarbon signatures display the
dominance of pre-bomb C. The lowest radiocarbon signatures were found at Grübel, indicating
older C in the spruce forest than in the two beech-oak forests.
In the mineral soil, we estimated TT of bulk SOC of 130-3900 years. This corresponds to or is
slightly higher than previous studies that describe TT of SOC between 25 and 3570 years in
temperate forests (Perruchoud 1999, Hakkenberg 2009, Schulze et al. 2009). Given its distinct
climatic conditions conditions, Grübel has very long TT in the deep soil depths. The radiocarbon
signatures of the bulk soil up to 10-20 cm indicates significant inputs of modern C at Ludwigshain
and Rohrberg. In our study, inputs of modern C correspond to CWD inputs since management
change. This means that the method is suitable to identify differences due to human impact.
Differences between management forms were smaller than among the study sites, indicating that
site conditions and tree species have more influence on TTs than forest management. As the
differences remain constant with depth, other factors overshadow forest management effects or
management equally affects all soil depths through below-ground litter input.
The fPOM, oPOM and MaOM fractions represent C pools with different TT, degrees of degradation
and humification (Baisden et al. 2002, John et al. 2005). At Grübel, TT in all density fractions and
soil depths were at least 200 years. This makes management influences within decades improbable.
At Ludwigshain and Rohrberg, TT of the fPOM fraction is shorter than 250 years at all soil depth,
suggesting that elevated CWD input could potentially increase the TT at these study sites. While the
patterns are consistent across soil depths, they do not correspond on both study sites. They can thus
not be attributed to a management change. An elevated CWD input does thus not affect C stocks of
the soil within time periods of decades.
AcknowledgmentsWe would like to thank Bavarian Ministry for Nutrition, Agriculture and Forestry for the financial
support. We express our gratitude to the members of the Central Analytical Department of the
111

Bayreuth Centre of Ecology and Environmental Research (BayCEER) for chemical analysis, the
forest rangers responsible for the investigated forests for providing forest records and additional
information on the study sites and Alfred Schubert of the LWF in Freising for providing material
and advice on soil sampling. We are grateful to Egbert Matzner for helpful comments on the
manuscript. Thanks go to Helga Hertel-Kolb, Uwe Hell, Petra Eckert and Oliver Beyer for their help
in the field and with sample preparation.
112
References
Arantes, V., Jellison, J., Goodell, B. (2012) Peculiarities of brown-rot fungi and biochemical Fenton
reaction with regard to their potential as a model for bioprocessing biomass. Applied
Microbiology and Biotechnology, 94(2), 323–338.
Baisden, W. T., Amundson, R., Cook, A. C., & Brenner, D. L. (2002) Turnover and storage of C and
N in five density fractions from California annual grassland surface soils. Global Biogeochem-
ical Cycles, 16(4), 1-16.
Ballard, T. M. (2000) Impacts of forest management on northern forest soils. Forest Ecology and
Management, 133(1-2), 37–42.
Baritz, R., Strich, S. (2000) Forests and the national greenhouse gas inventory of Germany.
Agriculture, 4(4), 267–271.
Boone, R. D. (1994) Light-fraction soil organic matter: origin and contribution to net nitrogen
mineralization. Soil Biology and Biochemistry, 26(11), 1459–1468.
Boulanger, Y., Sirois, L. (2006) Postfire dynamics of black spruce coarse woody debris in northern
boreal forest of Quebec. Canadian Journal of Forest Research, 36(7), 1770–1780.
Bradford, J. B. J., Weishampel, P., Smith, M. L. (2009) Detrital carbon pools in temperate forests:
magnitude and potential for landscape-scale assessment. Canadian Journal of Forest
Research, 39(4), 802–813.
Brant, J. B., Sulzman, E. W., Myrold D. D. (2006) Microbial community utilization of added carbon
substrates in response to long-term carbon input manipulation. Soil Biology and Biochemistry,
38(8), 2219–2232.
Busse, M. D., (1994) Downed Bole-Wood Decomposition in Lodgepole Pine Forests of Central
Oregon. Soil Science Society of America Journal, 58(1), 221–227.
Böttcher, J., Springob, G., (2001) A carbon balance model for organic layers of acid forest soils, A
carbon balance model for organic layers of acid forest soils. Journal of Plant Nutrition and
Soil Science, Journal of Plant Nutrition and Soil Science, 164, 399–405.
Cain, W. F., Suess, H. E. (1976) Carbon 14 in tree rings. Journal of Geophysical Research, 81(21),
3688.
113

Christensen, M., Hahn K., Mountford, E. P. Ódor, P., Standovár, T., Rozenbergar, D., Diaci, J.,
Wijdeven, S., Meyer, P., Winter, S., Vrska, T. (2005) Dead wood in European beech (Fagus
sylvatica) forest reserves. Forest Ecology and Management, 210(1-3), 267–282.
Cramer, W., Bondeau A., Woodward, F. I., Prentice, I. C., Betts, R. A., Brovkin, V., Cox, P. M.,
Fisher, V., Foley, J. A., Friend, A. D., Kucharik, C., Lomas, M. R., Ramankutty, N., Sitch, S.,
Smith, B., White, A., Young-Molling, C. (2001) Global response of terrestrial ecosystem
structure and function to CO2 and climate change: results from six dynamic global vegetation
models. Global Change Biology, 7(4), 357–373.
Crow, S. E., Swanston, C. W., Lajtha, K., Brooks, J. R., & Keirstead, H.(2007) Density
fractionation of forest soils: methodological questions and interpretation of incubation results
and turnover time in an ecosystem context. Biogeochemistry, 85(1), 69–90.
DeGryze, S., Six, J., Paustian, K., Morris, S. J., Paul, E. A., & Merckx, R. (2004) Soil organic
carbon pool changes following land-use conversions. Global Change Biology, 10(7), 1120–
1132.
Dixon, R., Brown, S., Houghton, R. E. A., Solomon, A. M., Trexler, M. C., & Wisniewski, J.
(1994) Carbon pools and flux of global forest ecosystems. Science, 263(5144), 185.
Don, A., Scholten, T., Schulze, E. D. (2009) Conversion of cropland into grassland: Implications for
soil organic-carbon stocks in two soils with different texture. Journal of Plant Nutrition and
Soil Science, 172(1), 53–62.
Erdmann, M., Wilke, H. (1996) Quantitative und qualitative Totholzerfassung in
Buchenwirtschaftswäldern. Forstwissenschaftliches Centralblatt, 116(1-6), 16–28.
Fridman, J., Walheim, M. (2000) Amount, structure, and dynamics of dead wood on managed
forestland in Sweden. Forest Ecology and Management, 131(1-3), 23–36.
Gregorich, E. G., Kachanoski, R. G., Voroney, R. P. (1989) Carbon mineralization in soil size
fractions after various amounts of aggregate disruption. Journal of Soil Science, 40(3), 649–
659.
Gaudinski, J. B., Trumbore, S. E., Davidson, E. A., & Zheng, S. (2000) Soil carbon cycling in a
temperate forest: radiocarbon-based estimates of residence times, sequestration rates and
partitioning of fluxes. Biogeochemistry, 51(1), 33–69.
Goodburn J, Lorimer C (1998) Cavity trees and coarse woody debris in old-growth and managed
114

northern hardwood forests in Wisconsin and Michigan. Canadian Journal of Forest Research,
28(3), 427-438.
Hagemann, U., Moroni, M. T., Makeschin, F. (2009) Deadwood abundance in Labrador high-boreal
black spruce forests. Canadian Journal of Forest Research, 39(1), 131–142.
Hahn, V., Buchmann, N. (2004) A new model for soil organic carbon turnover using bomb carbon.
Global Biogeochemical Cycles, 18(1), GB1019.
Hakkenberg, R. (2009) Temperature sensitivity of the turnover times of soil organic matter in
forests. Ecological Applications, 18(1), 119-131.
Harden, J. W., Trumbore, S. E., Stocks, B. J., Hirsch, A., Gower, S. T., O'neill, K. P., & Kasischke,
E. S.(2000) The role of fire in the boreal carbon budget. Global Change Biology, 6(S1), 174–
184.
Hedde, M., Aubert, M., Decaëns, T., & Bureau, F. (2008) Dynamics of soil carbon in a beechwood
chronosequence forest. Forest Ecology and Management, 255(1), 193–202.
Holeksa, J. (2001) Coarse woody debris in a Carpathian subalpine spruce forest.
Forstwissenschaftliches Centralblatt, 120(1), 256–270.
Homann, P. S., Bormann, B. T., Boyle, J. R., Darbyshire, R. L., & Bigley, R (2008) Soil C and N
minimum detectable changes and treatment differences in a multi-treatment forest experiment.
Forest Ecology and Management, 255(5–6), 1724–1734.
Jandl, R., Lindner, M., Vesterdal, L., Bauwens, B., Baritz, R., Hagedorn, F., Johnson, D. W.,
Minkkinen, K., Byrne, K. A. (2007) How strongly can forest management influence soil carbon
sequestration? Geoderma, 137(3-4), 253–268.
John, B., Yamashita, T., Ludwig, B., & Flessa, H. (2005) Storage of organic carbon in aggregate and
density fractions of silty soils under different types of land use. Geoderma, 128(1–2), 63–79.
Johnson, D. W., Curtis, P. S. (2001) Effects of forest management on soil C and N storage: meta
analysis. Forest Ecology and Management, 140(2–3), 227–238.
Kahl T, Mund M, Bauhus J, et al. (2013): Dissolved organic carbon from European beech coarse
woody debris - patterns of input to and retention by surface soil. Ecoscience, 19(4), 1-10.
Klinka, K., Lavkulich, L. M., Wang, Q., & Feller, M. C. (1995) Influence of decaying wood on
chemical properties of forest floors and surface mineral soils: a pilot study. Annales des
115
Sciences Forestières, 52(6), 523–533.
Kögel-Knabner, I., Guggenberger, G., Kleber, M., Kandeler, E., Kalbitz, K., Scheu, S., Eusterhues,
K., Leinweber, P. (2008) Organo-mineral associations in temperate soils: Integrating biology,
mineralogy, and organic matter chemistry. Journal of Plant Nutrition and Soil Science, 171(1),
61–82.
Laiho, R., Prescott, C. E. (2004) Decay and nutrient dynamics of coarse woody debris in northern
coniferous forests: a synthesis. Canadian Journal of Forest Research, 34(4), 763–777.
Laiho, R, Prescott, C. E. (1999) The contribution of coarse woody debris to carbon, nitrogen, and
phosphorus cycles in three Rocky Mountain coniferous forests. Canadian Journal of Forest
Research, 29(10), 1592–1603.
Lajtha, K., Crow, S. E., Yano, Y., et al. (2005) Detrital Controls on Soil Solution N and Dissolved
Organic Matter in Soils: A Field Experiment. Biogeochemistry, 76(2), 261–281.
Lambert, R. L., Lang, G. E., Reiners, W. A. (1980) Loss of Mass and Chemical Change in Decaying
Boles of a Subalpine Balsam Fir Forest. Ecology, 61(6), 1460.
Levin, I., Kromer, B. (2004) The tropospheric 14CO2 level in mid-latitudes of the Northern
Hemisphere (1959–2003). Radiocarbon, 46(3), 1.
Manies, K. L., Harden, J. W., Bond-Lamberty, B. P., & O'Neill, K. P. (2005) Woody debris along an
upland chronosequence in boreal Manitoba and its impact on long-term carbon storage.
Canadian Journal of Forest Research, 35(2), 472–482.
Miltner, A., Bombach, P., Schmidt-Brücken, B., & Kästner, M. (2011). SOM genesis: microbial
biomass as a significant source. Biogeochemistry, 111(1-3), 1-15.
Motta, R., Berretti, R., Castagneri, D., Lingua, E., Nola, P., & Vacchiano, G. (2010) Stand and
coarse woody debris dynamics in subalpine Norway spruce forests withdrawn from regular
management. Annals of Forest Science, 67(8), 803–803.
Nave, L. E., Vance, E. D., Swanston, C. W., & Curtis, P. S. (2010) Harvest impacts on soil carbon
storage in temperate forests. Forest Ecology and Management, 259(5), 857–866.
Olajuyigbe, S., Tobin, B. & Nieuwenhuis, M. (2012) Temperature and moisture effects on
respiration rate of decomposing logs in a Sitka spruce plantation in Ireland. Forestry, 85(4),
485-496.
116

Parker, J. L., Fernandez, I. J., Rustad, L. E., & Norton, S. A. (2002) Soil organic matter fractions in
experimental forested watersheds. Water, air and soil pollution, 138(1-4),101–121.
Parton, W., Stewart, J., Cole, C. (1988) Dynamics of C, N, P and S in grassland soils: a model.
Biogeochemistry, 5(1), 109–131.
Perruchoud, D., (1999) 20th Century Carbon Budget of Forest Soils in the Alps. Ecosystems, 2(4),
320–337.
Rajala, T., Peltoniemi, M., Pennanen, T., & Mäkipää, R.(2012) Fungal community dynamics in
relation to substrate quality of decaying Norway spruce (Picea abies [L.] Karst.) logs in boreal
forests. FEMS Microbiology Ecology, 81(2), 494–505.
Ranius, T., Niklasson, M., Berg, N., (2009) Development of tree hollows in pedunculate oak
(Quercus robur). Forest Ecology and Management, 257(1), 303–310.
Rock, J., Badeck, F. W., Harmon, M. E., (2008) Estimating decomposition rate constants for
European tree species from literature sources. European Journal of Forest Research, 127(4),
301–313.
Schrumpf, M., Schumacher, J., Schöning, I., & Schulze, E. D. (2008) Monitoring Carbon Stock
Changes in European Soils: Process Understanding and Sampling Strategies. In A. J. Dolman,
R. Valentini, & A. Freibauer, eds. Springer New York, 153–189.
Schulze, K., Borken, W., Muhr, J., & Matzner, E.(2009) Stock, turnover time and accumulation of
organic matter in bulk and density fractions of a Podzol soil. European Journal of Soil Science,
60(4), 567–577.
Schöning, I., Totsche, K. U.,Kögel-Knabner, I. (2006) Small scale spatial variability of organic
carbon stocks in litter and solum of a forested Luvisol. Geoderma, 136(3–4), 631–642.
Sievänen, R., Lindner, M., Mäkelä, A., & Lasch, P. (2000) Volume growth and survival graphs: a
method for evaluating process-based forest growth models. Tree Physiology, 20(5-6), 357–365.
Spears, J. D., Holub, S. M., Harmon, M. E., & Lajtha, K.(2003) The influence of decomposing logs
on soil biology and nutrient cycling in an old-growth mixed coniferous forest in Oregon, USA.
Canadian Journal of Forest Research, 33(11), 2193–2201.
Spears, J. D. H., Lajtha, K. (2005) The imprint of coarse woody debris on soil chemistry in the
western Oregon Cascades. Biogeochemistry, 71(2),163–175.
117

Strukelj, M., Brais, S., Quideau, S. A., & Oh, S. W. (2012) Chemical transformations of deadwood
and foliar litter of mixed boreal species during decomposition. Canadian Journal of Forest
Research, 42(4), 772–788.
Stuiver, M., Polach, H. A., (1977) Discussion; reporting of C-14 data. Radiocarbon, 19(3), 355–
363.
Torn, M. S., Trumbore, S. E., Chadwick, O. A., Vitousek, P. M., & Hendricks, D. M. (1997)
Mineral control of soil organic carbon storage and turnover. Nature, 389(6647), 170–173.
Trumbore, S., (2000) Age of soil organic matter and soil respiration: radiocarbon constraints on
belowground C dynamics. Ecological Applications, 10(2), 399–411.
Trumbore, S., (2009) Radiocarbon and soil carbon dynamics. Annual Review of Earth and
Planetary Sciences, 37, 47–66.
Tuomi, M., Laiho, R., Repo, A., & Liski, J. (2011) Wood decomposition model for boreal forests.
Ecological Modelling, 222(3), 709–718.
Vandekerkhove, K., De Keersmaeker, L., Menke, N., Meyer, P., & Verschelde, P. (2009) When
nature takes over from man: Dead wood accumulation in previously managed oak and beech
woodlands in North-western and Central Europe. Forest Ecology and Management, 258(4),
425–435.
Vávřová, P., Penttilä, T., Laiho, R., (2009). Decomposition of Scots pine fine woody debris in boreal
conditions: Implications for estimating carbon pools and fluxes. Forest Ecology and
Management, 257(2), 401–412.
Wagai, R., Mayer, L. M., Kitayama, K., & Knicker, H. (2008) Climate and parent material controls
on organic matter storage in surface soils: A three-pool, density-separation approach.
Geoderma, 147(1–2), 23–33.
Wang, Y., Amundson, R., Trumbore, S. (1996) Radiocarbon Dating of Soil Organic Matter.
Quaternary Research, 45(3), 282–288.
Weggler, K., Dobbertin, M., Jüngling, E., Kaufmann, E., & Thürig, E. (2012) Dead wood volume to
dead wood carbon: the issue of conversion factors. European Journal of Forest Research,
131(5), 1423–1438.
Wiesmeier, M., Spörlein, P., Geuß, U., Hangen, E., Haug, S., Reischl, A., Schilling, B., von Lützow,
M. & Kögel Knabner, I. ‐ (2012) Soil organic carbon stocks in southeast Germany (Bavaria) as
118

affected by land use, soil type and sampling depth. Global Change Biology, 18(7), 2233–2245.
Woodall C, Liknes G (2008) Relationships between forest fine and coarse woody debris carbon
stocks across latitudinal gradients in the United States as an indicator of climate change effects.
Ecological Indicators, 8(5), 686-690.
Xu, X., Trumbore, S. E., Zheng, S., Southon, J. R., McDuffee, K. E., Luttgen, M., & Liu, J. C.
(2007) Modifying a sealed tube zinc reduction method for preparation of AMS graphite targets:
Reducing background and attaining high precision. Nuclear Instruments and Methods in
Physics Research Section B: Beam Interactions with Materials and Atoms, 259(1), 320–329.
Ågren, G. I., Hyvönen, R., Nilsson, T., (2007) Are Swedish forest soils sinks or sources for CO2—
model analyses based on forest inventory data. Biogeochemistry, 89(1), 139–149.
119

Supplemental InformationThis appendix describes the calculation of the turnover time (TT) of the organic horizons and the
mineral soil with non-steady state and steady state models. For all calculations, we used radiocarbon
data originating from dendrochronologically dated wood samples published by Stuiver et al. (1998)
and atmospheric radiocarbon data after 1959 published by Levin et al. (2008). The data cover the
time period between 1510 and 2009. For calculation of the radiocarbon signature of coarse woody
debris (CWD) that necessitate older radiocarbon data, the average radiocarbon signatures between
1510 and 1520 is used.
All radiocarbon signatures are expressed as Fraction modern (Fm) for calculation. Fm is calculated
from measured Δ14C ‰ with the following conversion:
Fm=1+Δ
14C ‰1000 (1)
where Δ14C ‰ is the ‰ from the 14C/12C ratio of oxalic standard in 1950. The samples were
corrected to a δ13C value of -25 ‰ to account for mass-dependent fractionation effects (Stuiver &
Polach, 1977).
Radiocarbon signature of coarse woody debris
The radiocarbon signature of each tree ring corresponds to the radiocarbon signature of the
atmosphere of the year it was formed (Cain & Suess 1976). Calculations of the radiocarbon
signature of CWD are based on the assumption that biomass growth is constant each year (Sievänen
et al. 2000). The radiocarbon signature of an individual piece of CWD (FmiCWD) of the year 2009
can be calculated by integrating the radiocarbon signature of the atmosphere Fmatm in each year t for
the interval between time of sapling and time of tree death under consideration of radioactive decay
in relation to 2009 divided by the duration of the interval calculated from the time of sapling (t sapling)
and time of tree death (tdeath) in years (a). For 14C, a half-time of 8267 years is assumed.
FmiCWD(2010)=
∑t sapling
t death
Fmatm( t)∗(1−2009−t
8267)
t death−t sapling (2)
To simplify the model, the CWD stocks are grouped by time of death per decades. Time of sapling
120
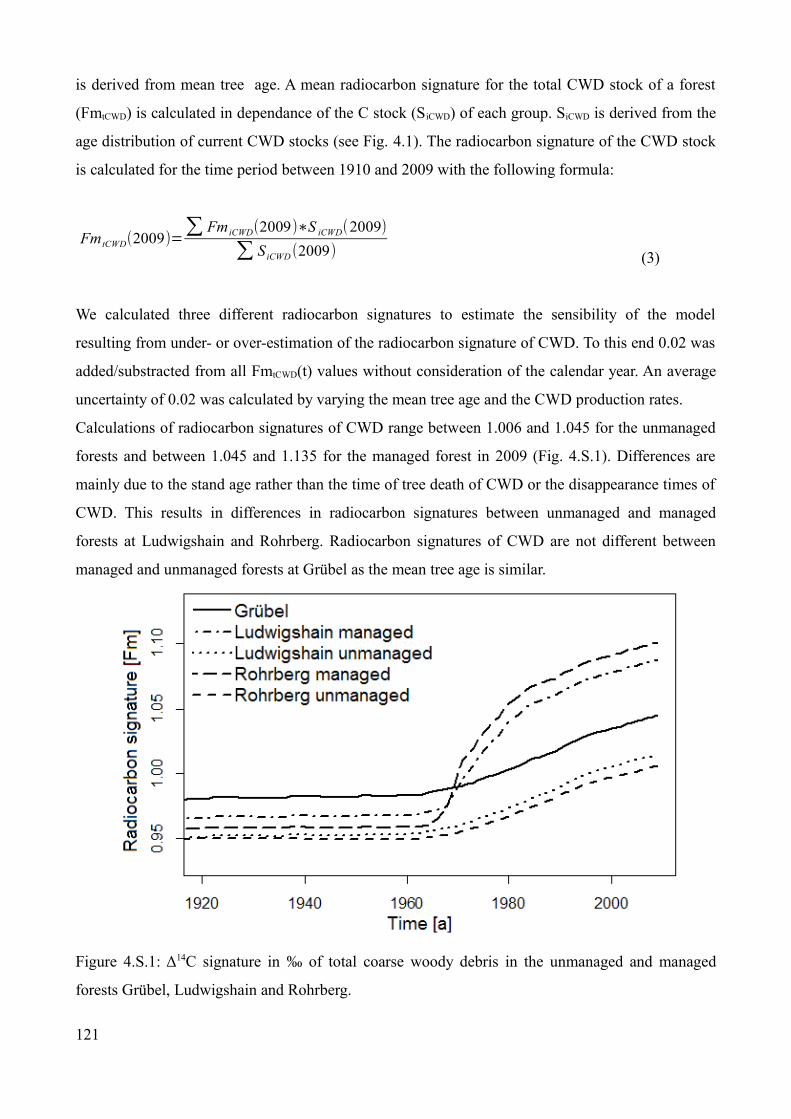
is derived from mean tree age. A mean radiocarbon signature for the total CWD stock of a forest
(FmtCWD) is calculated in dependance of the C stock (SiCWD) of each group. SiCWD is derived from the
age distribution of current CWD stocks (see Fig. 4.1). The radiocarbon signature of the CWD stock
is calculated for the time period between 1910 and 2009 with the following formula:
Fm tCWD(2009)=∑ Fm iCWD(2009)∗S iCWD(2009)
∑ S iCWD(2009) (3)
We calculated three different radiocarbon signatures to estimate the sensibility of the model
resulting from under- or over-estimation of the radiocarbon signature of CWD. To this end 0.02 was
added/substracted from all FmtCWD(t) values without consideration of the calendar year. An average
uncertainty of 0.02 was calculated by varying the mean tree age and the CWD production rates.
Calculations of radiocarbon signatures of CWD range between 1.006 and 1.045 for the unmanaged
forests and between 1.045 and 1.135 for the managed forest in 2009 (Fig. 4.S.1). Differences are
mainly due to the stand age rather than the time of tree death of CWD or the disappearance times of
CWD. This results in differences in radiocarbon signatures between unmanaged and managed
forests at Ludwigshain and Rohrberg. Radiocarbon signatures of CWD are not different between
managed and unmanaged forests at Grübel as the mean tree age is similar.
Figure 4.S.1: Δ14C signature in ‰ of total coarse woody debris in the unmanaged and managed
forests Grübel, Ludwigshain and Rohrberg.
121

Radiocarbon signature and turnover of carbon in the Oi horizon
As no data on past leaf litter input is available, we assume it to be produced at a constant rate and
have applied a steady state model to calculate the TT. Fresh leaf litter of beech and oak from the
year 2011 had a radiocarbon signature of 32.8 ± 9 ‰, which was close to the signature of the
atmosphere in the year 2010. Leaf litter input to the Oi horizon thus has a lag period (lp) of one year.
For Norway spruce a lag period (lp) of 6 years was assumed (Schulze et al. 2009). FmOi(t), the
modern fraction of the Oi horizon in the year t was calculated as follows:
FmOi ( t)=kOi∗Fmatm(t−lp)+(1−1
TT Oi
−1
8267)∗FmOi (t−1)
(4)
where TTOi is the turnover time of the Oi horizon, and Fmatm(t-lg) is the radiocarbon signature of
fresh leaf litter.
Radiocarbon signature, inputs and stocks of fine woody debris
A sinus function was used to model the regular increase and decrease in FWD input (IFWD) in a year t
resulting in an oscillating FWD input. For each managed forest, the year of the thinning procedure
was determined from forest records. The dimensionless variables x and y were used to fit the sinus
function in such way, that it had a maximum in the year of the last management procedure and that
intervals between maximums correspond to time periods that likely pass between years of higher
FWD input. The value z related to the FWD input measured for 2010 and represents the amplitude
of the sinus curve.
I FWD(t )=∣sin (tx+ y )∣∗z
(5)
The decay of FWD is assumed to have a faster decay rate than CWD. According to CWD, a linear C
loss of FWD is assumed. The radiocarbon signature of FWD for the year 2010 was measured of one
mixed sample per study site. Radiocarbon signatures for previous years are modeled by assuming a
TT and a lag period of 8 years. The C stock of FWD in a year t (SFWD(t)) can be calculated by
combining the input (IFWD(t)) to and the loss (LFWD(t)) from the C stock:
S FWD(t)=S FWD( t−1)+ I FWD( t)−LFWD( t) (6)
122

where the C loss from FWD is calculated as follows
LFWD(t)=S FWD(t )
8 . (7)
Turnover of carbon in the Oe horizon (Grübel and Rohrberg) and the mixed Oe/Oa horizon
(Ludwigshain)
Figure 4.S.2: Carbon input model for the organic layer.
For the Oe horizon, three different input pools are considered: material from the Oi horizon, fine
woody debris (FWD) and coarse woody debris (CWD) (Fig.4.S.2). The model calculates the C stock
of the Oe horizon in the year t (SOe(t)) and the radiocarbon signature of the Oe horizon (FmOe(t))
separately for the same TT (TTOe). For each input pool, L(t) is the total C loss and the value h is the
proportion of the total C loss that enters the Oe horizon.
S Oe( t)=hOi∗LOi (t)+hFWD∗LFWD(t )+hCWD∗LCWD( t)+S Oe( t−1)∗(1−1
TT Oe
)(8)
FmOe (t)=(hOi∗SOi(t )∗FmOi(t)+hFWD∗S FWD(t)∗FmFWD(t)+hCWD∗S CWD(t )∗
∗FmCWD(t )+S Oe(t−1)∗(1−1
TT Oe
∗1
8267))÷S Oe( t)
(9)
The value h is constant over time. For input from FWD, two different scenarios are calculated: (1)
no input from FWD (hFWD=0) and (2) the proportion of input from FWD is equal to the proportion
of input from the Oi horizon (hFWD=hOi). For CWD input, several scenarios with hCWD ranging from
0-10 % were calculated. Additionally, a data point where the proportion of C input from CWD and
C input from the Oi horizon are equal was calculated (hCWD=hOi).
123
Turnover of carbon in the Oa horizon (Grübel and Rohrberg)
The TT of the Oa horizon (TTOa) was calculated with a non-steady state model. Two input pools
were identified: material from the Oe horizon and root litter. The C stock of the Oa horizon (SOa(t))
and the radiocarbon signature of the Oa horizon (FmOa(t)) are calculated separately. The C stock in
the roots (Sr(t)) was measured as a fraction of the Oa horizon in 2009 (Rohrberg) or 2010 (Grübel),
but no radiocarbon signatures were measured. We assume that the radiocarbon signature of the roots
(Fmr) corresponds to the radiocarbon signature of the atmosphere (Fmatm). Two scenarios are
calculated: (1) no input from roots to the Oa horizon (hOa = 0) and (2) all C in roots goes into the Oa
horizon (hOa = 1). The proportion of the C stock of the Oe horizon (SOe) that flows into the Oa
horizon (hOe) is calculated following
S Oa(t )=hOe∗S Oe(t )+hr∗S r(t)+SOa (t−1)∗(1−1
TT Oa
)(10)
FmOa (t )=
hOe∗S Oe(t )∗FmOe(t )+hr∗S r(t )∗Fmr(t )+S Oa(t−1)∗(1−1
TT Oa
−1
8267)
SOa (t) (11)
Turnover of carbon in the mineral soil
A steady state model was used following Gaudinski et al. (2000) to calculate the radiocarbon
signature (Fmsoil) and the turnover time (TTSoil) for the bulk samples of the mineral soil and the
density fractions. The radiocarbon signature of the input corresponds to the radiocarbon signature of
the atmosphere (Fmatm). For modern radiocarbon signatures, two TT are possible.
Fmsoil (t)=k soil∗Fmatm( t)+(1−1
TT soil
−1
8267)∗Fmsoil( t−1)
(12)
124

References
Cain, W. F., & Suess, H. E. (1976). Carbon 14 in tree rings. Journal of Geophysical Research,
81(21), 3688.
Gaudinski, J. B., Trumbore, S. E., Davidson, E. A., & Zheng, S. (2000). Soil carbon cycling in a
temperate forest: radiocarbon-based estimates of residence times, sequestration rates and
partitioning of fluxes. Biogeochemistry, 51(1), 33–69.
Levin, I., Hammer, S., Kromer, B., & Meinhardt, F. (2008). Radiocarbon observations in
atmospheric CO2: determining fossil fuel CO2 over Europe using Jungfraujoch observations as
background. The Science of the total environment, 391(2-3), 211.
Schulze, K., Borken, W., Muhr, J., & Matzner, E. (2009). Stock, turnover time and accumulation of
organic matter in bulk and density fractions of a Podzol soil. European Journal of Soil Science,
60(4), 567–577.
Sievänen, R., Lindner, M., Mäkelä, A., & Lasch, P. (2000). Volume growth and survival graphs: a
method for evaluating process-based forest growth models. Tree Physiology, 20(5-6), 357–365.
Stuiver, M., & Polach, H. A. (1977). Reporting of C-14 data–discussion. Radiocarbon, 19(3), 355-
363.
Stuiver, M., Reimer, P. J., & Braziunas, T. F. (1998). High-precision radiocarbon age calibration for
terrestrial and marine samples. Radiocarbon, 40(3), 1127-1151.
125

Declaration/Erklärung
I hereby declare that this doctoral thesis is entirely my own work, and that I did not use any sources
or auxiliary means other than those referenced. Moreover, I declare that no parts of this thesis have
previously been submitted for the purpose of obtaining a doctoral degree at any other scientific
institution. I have not conclusively failed any doctoral examination procedure.
Hiermit erkläre ich, dass ich die vorliegende Arbeit selbständig verfasst und nur die angegebenen
Quellen und Hilfsmittel benutzt habe. Ich versichere, dass ich diese Arbeit an keiner anderen
wissenschaftlichen Einrichtung zum Zwecke einer Promotion eingereicht habe. Ich habe noch kein
Promotionsverfahren endgültig nicht bestanden.
Bayreuth, den 08.04.2013
Inken Krüger
126