potential of near-infrared spectroscopy for quality evaluation of...
TRANSCRIPT

Spectrochimica Acta Part A: Molecular and Biomolecular Spectroscopy 202 (2018) 182–186
Contents lists available at ScienceDirect
Spectrochimica Acta Part A: Molecular and BiomolecularSpectroscopy
j ourna l homepage: www.e lsev ie r .com/ locate /saa
Potential of near-infrared spectroscopy for quality evaluation ofcattle leather
Carlos Eduardo M. Braz a,b, Manuel Antonio C. Jacinto a, Edenir R. Pereira-Filho b,Gilberto B. Souza a, Ana Rita A. Nogueira a,⁎a Embrapa Pecuária Sudeste, São Carlos, SP 13560-970, Brazilb Group of Applied Instrumental Analysis (GAIA), Department of Chemistry, Federal University of São Carlos, São Carlos, SP 13565-905, Brazil
⁎ Corresponding author.E-mail address: [email protected] (A.R.A. Nog
https://doi.org/10.1016/j.saa.2018.05.0251386-1425/© 2018 Elsevier B.V. All rights reserved.
a b s t r a c t
a r t i c l e i n f oArticle history:Received 15 September 2017Received in revised form 9 April 2018Accepted 7 May 2018Available online 9 May 2018
Models using near-infrared spectroscopy (NIRS) were constructed based on physical-mechanical tests to deter-mine the quality of cattle leather. The following official parameters were used, considering the industry require-ments: tensile strength (TS), percentage elongation (%E), tear strength (TT), and double hole tear strength (DHS).Classification models were constructed with the use of k-nearest neighbor (kNN), soft independent modeling ofclass analogy (SIMCA), and partial least squares–discriminant analysis (PLS-DA). The evaluated figures of merit,accuracy, sensitivity, and specificity presented results between 85% and 93%, and the false alarm rates from 9% to14%. The model with lowest validation percentage (92%) was kNN, and the highest was PLS-DA (100%). For TS,lower values were obtained, from 52% for kNN and 74% for SIMCA. The other parameters %E, TT, and DHS pre-sented hit rates between 87 and 100%. The abilities of the models were similar, showing they can be used to pre-dict the quality of cattle leather.
© 2018 Elsevier B.V. All rights reserved.
Keywords:Classification modelsLeather qualityNIRSPhysical-mechanical parameters
1. Introduction
The chemical stabilization of animal skins for leather productiondates to ancient times, and was initially carried out with vegetable tan-nins. Nowadays, chromium is the most common curing agent, due tothe moderate tanning cost and good leather quality [1,2]. Leather isused in numerous applications, such as automotive upholstery, shoes,clothing, furniture and many other items [3].
The quality of the leather also depends on the way that the animalsare raised. Proper care is necessary during field breeding. The feeding ofthe animals should be adequate for maintenance of body reserves. Also,the animals are subject to parasites, burns and sharp objects. Duringslaughter, care is also necessary to avoid damaging the hide [4].
Several physical-mechanical parameters of traction and tearing aredefined in standard protocols to verify and guarantee the quality ofhides [5]. In Brazil, the test procedures are described by the BrazilianTechnical Standards Association (ABNT) [6–11]. These tests are labori-ous and use a considerable number of samples, which is a significantdisadvantage considering that finished leather is sold by area.
The use of infrared spectroscopy for leather analysis has previouslybeen reported by Canals et al. (2013). The authors determined the tan-ning degree in vegetal tanning process control in different conditions,such as combined tannins, hide substance and leather substance, by
ueira).
using NIRS and mid-FTIR spectroscopy. An appropriate model of partialleast squares (PLS) was calculated for each condition, with the predic-tion and quantification errors expressed as order of magnitude, whichis accepted by the tanning industry [12]. The authors also proposedthe use of NIRS to determine leather fat and the defatting process, mon-itored competitively with other proposed methods [13]. Infrared spec-troscopy has also been applied for analysis of tannin characterizationin historical leathers [14] and mapping of leather fiber panels [15]. Fin-ished tanned leather was evaluated by NIRS andmid-FTIR spectroscopyby applying PCA and canonical variate analysis. With the subsequentuse of the k-nearest neighbor (kNN) method, two classification modelsfor finishing treatment became available [16].
Classification models for quality control of cattle and sheep leathersby using laser-induced breakdown spectroscopy (LIBS) were recentlyproposed. The classification generates models able to predict results incomparison with the reference values for the physical-mechanical pa-rameters [17].
In this study, we investigated the suitability of using NIR spectros-copy and classification models to evaluate the quality of bovine leather.For this purpose, reference values were obtained through physical-me-chanical tests and models were built using three different chemometricclassification techniques: (i) kNN, Euclidean distance between samplesto classify closest neighbors; (ii) SIMCA (soft independent modeling ofclass analogy), PCA (principal component analysis) calculated for eachclass; and (iii) PLS-DA (partial least squares - discriminant analysis),which defines the dependent variables using PLS factors [18]. After

183C.E.M. Braz et al. / Spectrochimica Acta Part A: Molecular and Biomolecular Spectroscopy 202 (2018) 182–186
constructing the models, we applied them as classification tools forleather, to replace time-consuming physical-mechanical tests.
2. Experimental
2.1. Samples
The samples were obtained from animals at the experimental farmof Embrapa Pecuaria Sudeste, located in the state of São Paulo, Brazil.The slaughtered animals were 342–725 days old, had weight range of292–597 kg, and belonged to the following genetic groups: CANE (fa-ther Canchim and mother Nellore); CASN (father Canchim and mother½ Senepol + ½ Nellore); CATA (father Canchim and mother ½ Angus+ ½ Nellore); HNE (father Hereford and mother Nellore); HSN (fatherHereford and mother ½ Senepol + ½ Nellore); and HTA (father Here-ford andmother½Angus+½Nellore). In the subsequent experiments,we employed two sets of leather samples tanned with Cr: (a) 201 fin-ished leather samples, and (b) 113 semi-finished samples, for a totalof 314 samples.
2.2. Physical-mechanical Tests
The skinswere tannedwith chromium sulfate. After tanning, the fin-ished (post-tanning) and semi-finished sampleswere cutwith blades ina hydraulic press in the longitudinal (L) and transversal (T) directions,according to ABNT NBR ISO 2418:2015 [6]. All samples were then accli-mated for 48 h to laboratory conditions at 23±2 °C and relative humid-ity of 50 ± 5%, according to ABNT NBR 10455:2014 [7], before beingsubmitted to physical-mechanical tests. The thickness of the leatherspecimens was measured according to ABNT NBR ISO 2589:2014 [8].Four physical-mechanical parameters were measured by using a dyna-mometer (Maqtest, Franca, SP, Brazil): 1) determination of the tensilestrength (TS) (ABNT NBR ISO 3376:2014) [9]; 2) percentage of exten-sion or elongation (%E) (ABNT NBR ISO 3376:2014) [9]; 3) determina-tion of tear strength (tongue tear) (TT) (ABNT NBR ISO 3377-1:2014)[10]; and 4) double hole tear strength (DHS) (ABNT NBR ISO 3377-2:2014) [11]. All of these tests were performed in six repetitions (3 Land 3 T directions).
2.3. Near-infrared (NIR) Spectra Acquisition
For NIR spectra acquisition, a samplemeasuring 5.0 × 5.0 cmwas cutusing a hydraulic press with cutting knives (Metalurgica Açoreal, P-23,Campo Bom, RS, Brazil). All spectra were obtained with a NIRFlex N-550 spectrometer (BUCHI, Flawil, Switzerland). Samples were scannedin the region from 1000 to 2500 nm in reflectance mode in Petri dishesin the same conditions previously described (23± 2 °C, relative humid-ity 50 ± 5%). Each spectrum was obtained by averaging 32 scans with4 cm−1 resolution.
2.4. Data Analysis and Classification Models
The classification models combined the NIR spectrum of the ana-lyzed leather sample with the physical-mechanical test results. Dataanalysis was carried out with the Pirouette software v. 4.5 (InfometricsInc., Woodinville, WA, USA). The NIR spectra were submitted to the
Table 1Physical and mechanical values from the tests.
Tests and reference values(ABNT NBR 13525:2016) [21]
Range of result(average L and
Tensile tests Tensile strength (TS, N mm−2) 10.00–43.75Elongation (%E, %), ≥40% 46.41–116.92
Tear tests Tear strength (TT, N mm−1) 62.41–262.39Double hole tear strength Strength (DHS, N) ≥60 N 62.67–274.17
following transformation steps: first (1) normalized by signal norm,(2) first derivative calculation (window=5 points), and (3)mean cen-tering. Three classificationmodels (kNN, SIMCA, and PLS-DA)were usedto predict the leather quality. The total number of samples (314)was di-vided into two classes. Both classes were composed of 157 samples andwere organized according to the physical-mechanical tests values. Table1 shows the characteristics of each class. In the case of tensile strength(TS), for example, classes 1 and 2 present the following ranges: 10.00–24.08 and 24.13–43.75, respectively. Each class was further dividedinto calibration and validation datasets with 126 (80%) and 31 (20%)samples, respectively, according to ASTM 1655–05 [19].
3. Results and Discussion
3.1. Wavelength Selection
Raw NIR spectra are presented in Fig. 1a. Each spectrum is the aver-age of three spectra. Our first attempt was to build models using thewhole spectrum, but there was no improvement in figures of merit, sowe decided to perform wavelength selection. The region from 1000 to1400 nm (marked area in Fig. 1a) did not provide useful information,with regression vectors near zero, so it was excluded. The new spectraobtained were then submitted to data processing to correct baselineas well as to detect differences among spectra. The processed dataafter normalization, first derivative calculation, and mean-centeringare presented in Fig. 1b.
In Fig. 1a, the peaks between 1800 and 2000 nm are mainly relatedto the first overtone of O\\H stretching and O\\H combination bandsof water, respectively. Spectral regions between 1700 and 1800 nmand between 2100 and 2500 nm are related to the first overtone of C− H stretching and C − H + C − H and C − H + C– C combinationbands, respectively [18,20].
Fig. 2 shows the PLS-DA regression vectors for classes 1 (Fig. 2a) and2 (Fig. 2b) of tensile strength.With the regression vector, it is possible toobserve the most important wavelengths for each class characteriza-tion. In the PLS, regression vectors are calculated using both scorevalues, from X matrix and y vector. The wavelengths between 2200and 2400 are positively and negatively correlated to classes 1 and 2,respectively.
3.2. Classification Model Proposal
The samples were divided into two classes, as previously mentionedand specified in Table 1. These specifications were organized accordingto ABNT NBR 13525:2016 [21] and show the orientation values for ac-ceptance of leather quality according to physical-mechanical parame-ters. These values were used as orientation parameters to establish theclasses. Attempts were made to keep about 50% of the samples in eachclass. These categories were then used to calculate classificationmodelsusing the NIR spectra, in order to verify the predictive capacity of thespectra for sample classification.
To evaluate the performance of the models, we calculated four fig-ures of merit: accuracy, sensitivity, specificity and false alarm rate. Theaccuracy represents the percentage of correct predictions of themodel, while the sensitivity for class 1 is the ability of themodel to pre-dict class 2 samples correctly. In the case of specificity, the value
s obtainedT)
Range for class 1 (n = 157) Range for class 2 (n = 157)
10.00–24.08 24.13–43.7546.41–77.90 78.10–116.9262.41–108.19 108.20–262.3962.67–99.83 100.17–274.17

1000 1200 1400 1600 1800 2000 2200 2400
0.1
0.2
0.3
0.4
0.5
0.6
sbA
nm
(a)
1400 1600 1800 2000 2200 2400
-0.06
0.00
0.06
nm
(b)
Fig. 1.NIR spectra of leather samples (a) original spectra, and (b) after normalization, firstderivative calculation and mean centering. The shaded region was not considered toconstruct the models.
Fig. 2. Regression vectors for PLS-DA for classes 1 (a) and 2 (b) of tensile strength.
184 C.E.M. Braz et al. / Spectrochimica Acta Part A: Molecular and Biomolecular Spectroscopy 202 (2018) 182–186
computed is the number of correct predictions of the class divided bythe total number of samples from the same class. The false alarm rateis the number of incorrect predictions divided by the total number ofsamples for a specific class [17]. The ideal situation is to obtain accuracy,sensitivity and specificity values near 100% and false alarm rate near 0%.
The figures of merit calculated for the three classification models(kNN, SIMCA, and PLS-DA) are shown in Table 2, as well as mean, me-dian and relative standard deviation (RSD) for all models and both clas-ses, including calibration and validation datasets.
For the tensile strength (TS) test, the average accuracy was around66% for the three chemometric tests in both calibration and validationdatasets. As a consequence, we obtained relatively low sensitivity(52–81%), specificity (52–81%) and high false alarm rates, between 19and 48%, for the three classification models. The range for TS waslower than that of the other tests (Table 1), and the results showedhigh prediction error in the range 19.23–33.82 N mm−2, a region thatprecisely represents the boundary between the two classes. Further-more, the significant number of TS results in the extremes of the classesshould be noted. The addition of more samples is required to improvethe model's hit rate.
The other tests, percentage elongation (%E), tear strength (TT) anddouble hole tear strength (DHS) presented high hit rates, between 87and 100%.
For the %E test, the threemodels presented accuracy between 92 and100% and the highest false alarm ratewas 13% for SIMCA. Themaximumsensitivity and specificity (100%) were obtained from the PLS-DAmodel.
For the TT and DHS tests, we obtained percentages of accuracy be-tween 94 and 98% and between 96 and 98%, respectively. The most ro-bust model was PLS-DA, with sensitivity and specificity up to100%.
Neiva et al. (2016) [17] proposed the construction of classificationmodels to evaluate cattle and sheep leather quality using LIBS and phys-ical-mechanical tests (thickness, strength, tensile strength, elongation,tear strength and double hole tear strength) for the L and T directions.The authors obtained average accuracy of 80%. The average precisionobtained by the models constructed in the present study was 88%,slightly higher. It is important to consider that it was evaluated onlyfor cattle leather. Moreover, while LIBS is related to inorganic parame-ters, NIRS detects organic interactions.
In industry, the quality of leather is evaluated by sampling. Further-more, classificationmodels combining NIRS and chemometric tools willbe useful for practical applications, mainly for comparison against labo-ratory experiments, for the following reasons: (i) ability to provide ac-curate analyses with high analytical frequency; (ii) simpleinstrumentation; (iii) non-destructive and non-invasive nature of thetests; (iv) low cost of analysis; (v) little or no sample preparation and(vi) no sample consumption.
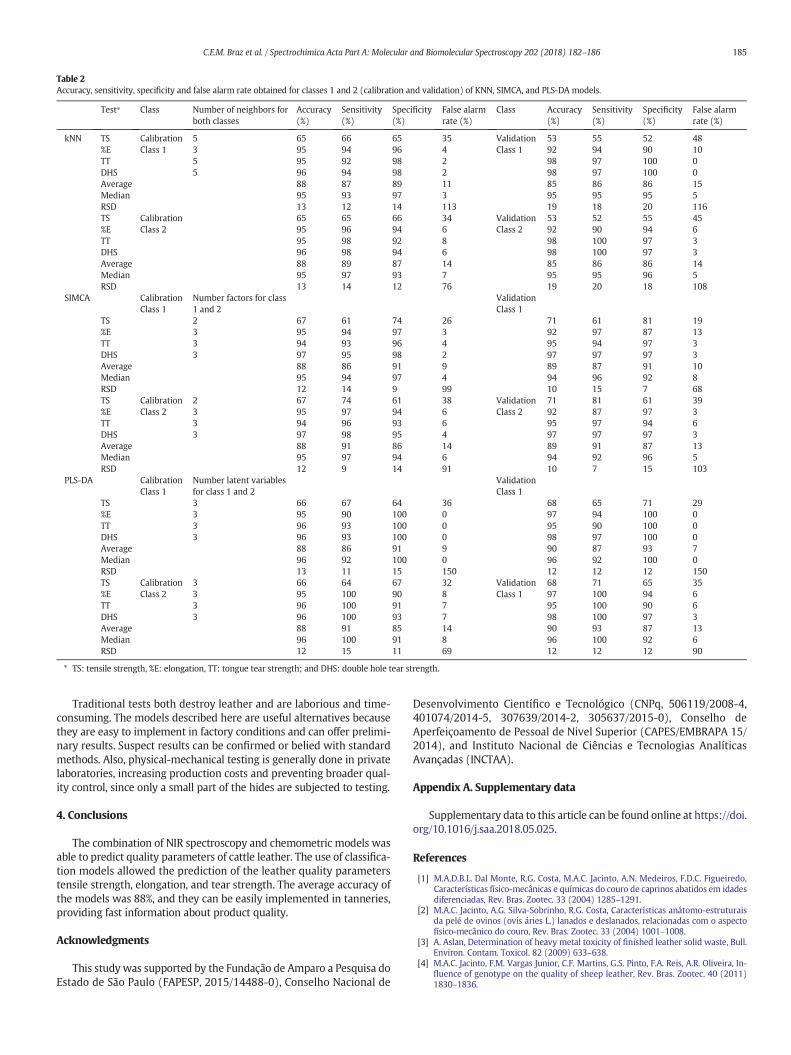
Table 2Accuracy, sensitivity, specificity and false alarm rate obtained for classes 1 and 2 (calibration and validation) of KNN, SIMCA, and PLS-DA models.
Test⁎ Class Number of neighbors forboth classes
Accuracy(%)
Sensitivity(%)
Specificity(%)
False alarmrate (%)
Class Accuracy(%)
Sensitivity(%)
Specificity(%)
False alarmrate (%)
kNN TS CalibrationClass 1
5 65 66 65 35 ValidationClass 1
53 55 52 48%E 3 95 94 96 4 92 94 90 10TT 5 95 92 98 2 98 97 100 0DHS 5 96 94 98 2 98 97 100 0Average 88 87 89 11 85 86 86 15Median 95 93 97 3 95 95 95 5RSD 13 12 14 113 19 18 20 116TS Calibration
Class 265 65 66 34 Validation
Class 253 52 55 45
%E 95 96 94 6 92 90 94 6TT 95 98 92 8 98 100 97 3DHS 96 98 94 6 98 100 97 3Average 88 89 87 14 85 86 86 14Median 95 97 93 7 95 95 96 5RSD 13 14 12 76 19 20 18 108
SIMCA CalibrationClass 1
Number factors for class1 and 2
ValidationClass 1
TS 2 67 61 74 26 71 61 81 19%E 3 95 94 97 3 92 97 87 13TT 3 94 93 96 4 95 94 97 3DHS 3 97 95 98 2 97 97 97 3Average 88 86 91 9 89 87 91 10Median 95 94 97 4 94 96 92 8RSD 12 14 9 99 10 15 7 68TS Calibration
Class 22 67 74 61 38 Validation
Class 271 81 61 39
%E 3 95 97 94 6 92 87 97 3TT 3 94 96 93 6 95 97 94 6DHS 3 97 98 95 4 97 97 97 3Average 88 91 86 14 89 91 87 13Median 95 97 94 6 94 92 96 5RSD 12 9 14 91 10 7 15 103
PLS-DA CalibrationClass 1
Number latent variablesfor class 1 and 2
ValidationClass 1
TS 3 66 67 64 36 68 65 71 29%E 3 95 90 100 0 97 94 100 0TT 3 96 93 100 0 95 90 100 0DHS 3 96 93 100 0 98 97 100 0Average 88 86 91 9 90 87 93 7Median 96 92 100 0 96 92 100 0RSD 13 11 15 150 12 12 12 150TS Calibration
Class 23 66 64 67 32 Validation
Class 168 71 65 35
%E 3 95 100 90 8 97 100 94 6TT 3 96 100 91 7 95 100 90 6DHS 3 96 100 93 7 98 100 97 3Average 88 91 85 14 90 93 87 13Median 96 100 91 8 96 100 92 6RSD 12 15 11 69 12 12 12 90
⁎ TS: tensile strength, %E: elongation, TT: tongue tear strength; and DHS: double hole tear strength.
185C.E.M. Braz et al. / Spectrochimica Acta Part A: Molecular and Biomolecular Spectroscopy 202 (2018) 182–186
Traditional tests both destroy leather and are laborious and time-consuming. The models described here are useful alternatives becausethey are easy to implement in factory conditions and can offer prelimi-nary results. Suspect results can be confirmed or belied with standardmethods. Also, physical-mechanical testing is generally done in privatelaboratories, increasing production costs and preventing broader qual-ity control, since only a small part of the hides are subjected to testing.
4. Conclusions
The combination of NIR spectroscopy and chemometric models wasable to predict quality parameters of cattle leather. The use of classifica-tion models allowed the prediction of the leather quality parameterstensile strength, elongation, and tear strength. The average accuracy ofthe models was 88%, and they can be easily implemented in tanneries,providing fast information about product quality.
Acknowledgments
This study was supported by the Fundação de Amparo a Pesquisa doEstado de São Paulo (FAPESP, 2015/14488-0), Conselho Nacional de
Desenvolvimento Científico e Tecnológico (CNPq, 506119/2008-4,401074/2014-5, 307639/2014-2, 305637/2015-0), Conselho deAperfeiçoamento de Pessoal de Nivel Superior (CAPES/EMBRAPA 15/2014), and Instituto Nacional de Ciências e Tecnologias AnalíticasAvançadas (INCTAA).
Appendix A. Supplementary data
Supplementary data to this article can be found online at https://doi.org/10.1016/j.saa.2018.05.025.
References
[1] M.A.D.B.L. Dal Monte, R.G. Costa, M.A.C. Jacinto, A.N. Medeiros, F.D.C. Figueiredo,Características físico-mecânicas e químicas do couro de caprinos abatidos em idadesdiferenciadas, Rev. Bras. Zootec. 33 (2004) 1285–1291.
[2] M.A.C. Jacinto, A.G. Silva-Sobrinho, R.G. Costa, Características anátomo-estruturaisda pelé de ovinos (ovis áries L.) lanados e deslanados, relacionadas com o aspectofísico-mecânico do couro, Rev. Bras. Zootec. 33 (2004) 1001–1008.
[3] A. Aslan, Determination of heavy metal toxicity of finished leather solid waste, Bull.Environ. Contam. Toxicol. 82 (2009) 633–638.
[4] M.A.C. Jacinto, F.M. Vargas Junior, C.F. Martins, G.S. Pinto, F.A. Reis, A.R. Oliveira, In-fluence of genotype on the quality of sheep leather, Rev. Bras. Zootec. 40 (2011)1830–1836.
186 C.E.M. Braz et al. / Spectrochimica Acta Part A: Molecular and Biomolecular Spectroscopy 202 (2018) 182–186
[5] International Organization for Standardization - ISO 2419, Leather-physical and Me-chanical Tests-sample Preparation and Conditioning, Geneva, 2006 3.
[6] Associação Brasileira de Normas Técnicas-ABNT NBR ISO 2418, Leather-chemical,Physical and Mechanical and Fastness Test-sampling Location, Rio de Janeiro,2015, 2015 7.
[7] Associação Brasileira de Normas Técnicas-ABNT NBR 10455, Climate of MaterialsUsed in Footwear and Related Articles Manufacture, Rio de Janeiro, 2014, 2014 2.
[8] Associação Brasileira de Normas Técnicas-ABNT NBR ISO 2589, Leather-physical andMechanical Tests - Determination of Thickness, Rio de Janeiro, 2014, 2014 2.
[9] Associação Brasileira de Normas Técnicas-ABNT NBR ISO 3376, Leather-physical andMechanical Tests - Determination of Tensile Strength and Percentage Extension, Riode Janeiro, 2014, 2014 5.
[10] Associação Brasileira de Normas Técnicas-ABNT NBR ISO 3377-1, Leather-physicaland Mechanical Tests - Determination of Tear Load, Part 1: Single Edge Tear, Riode Janeiro, 2014, 2014 4.
[11] Associação Brasileira de Normas Técnicas-ABNT NBR ISO 3377-2, Leather-physicaland Mechanical Tests - Determination of Tear Load Part 2: Tear Double-edged, Riode Janeiro, 2014, 2014 3.
[12] T. Canals, J.M. Morera, F. Combalia, E. Bartoli, Application of infrared spectroscopy(FTIR and NIR) in vegetable tanning process control, J. Soc. Leather Technol. Chem.97 (2013) 93–100.
[13] R. Cantero, T. Canals, H. Iturriaga, Near-infrared reflectance spectroscopy as a tool forthe control of sheep leather defatting, Talanta 71 (2007) 1690–1695.
[14] L. Falcão, M.E.M. Araújo, Tannins characterization in historic leathers by comple-mentary analytical techniques ATR-FTIR, UV-vis and chemical tests, J. Cult. Herit.14 (2013) 499–508.
[15] G. Tondi, T. Grünewald, A. Petutschnigg, T. Schnabel, ATR FTIR Mapping of LeatherFiber Panels, 81, 2015 1078–1080.
[16] R. Cantero, J.R. Riba, T. Canals, L.L. Izquierdo, H. Iturriaga, Characterization of leatherfinishing by IR spectroscopy and canonical variate analysis, J. Soc. Leather Technol.Chem. 93 (2009) 12–17.
[17] A.M. Neiva, M.A.C. Jacinto, M.M. Alencar, S.N. Esteves, E.R. Pereira-Filho, Propositionof classification models for the direct evaluation of the quality of cattle and sheepleathers using laser-induced breakdown spectroscopy (LIBS) analysis, RSC Adv. 6(2016) 104827–104838.
[18] M.M.C. Ferreira, Quimiometria: conceitos, métodos e aplicações, first ed. UNICAMP,Campinas, 2015.
[19] ASTM E1655-05, Standard Practices for Infrared Multivariate Quantitative Analysis,05, ASTM International, 2012 29.
[20] Z. Xiaobo, Z. Jiewen, M.J.W. Povey, M. Holmes, M. Hanpin, Variables selectionmethods in near-infrared spectroscopy, Anal. Chim. Acta 667 (2010) 14–32.
[21] Associação Brasileira De Normas Técnicas-ABNT NBR 13525, Physical and ChemicalTesting of Leather – Orientation Values for Acceptance of Leather, Rio de Janeiro,2014, 2016 10.