potential shellfish aquaculture in little bay, new hampshire revised january 18, 2012 chris nash and...
TRANSCRIPT

Potential Shellfish Aquaculture Potential Shellfish Aquaculture in Little Bay, New Hampshirein Little Bay, New Hampshire
REVISED January 18, 2012
Chris Nash and Carol ElliottNH Department of Environmental Services, Shellfish Program
[email protected] [email protected] (603)-559-1509 (603)-559-1508

Why Focus on Little Bay?Why Focus on Little Bay?
Great Bay Research Reserve BoundaryGreat Bay Research Reserve BoundaryEelgrass Cover in Great BayEelgrass Cover in Great BayShellfish Harvest ClosuresShellfish Harvest Closures

Great Bay National Estuarine Great Bay National Estuarine Research Reserve BoundaryResearch Reserve Boundary
Restrictions on Restrictions on commercial aquaculture commercial aquaculture in the “core area” (south in the “core area” (south of the red line).of the red line).


Shellfish Harvest Closures

Bathymetry Suitable for Bathymetry Suitable for Bottom Oyster CultureBottom Oyster Culture
Mean low water to -5m 779 acres*Constraints include:– Existing farms– Eelgrass– Harvest closures– Mooring fields– Oil Spill response buoys
*Mapped by R. Grizzle and K. Ward at the University of New Hampshire

Current Aquaculture SitesCurrent Aquaculture Sites
Five licensed farms (~17 acres)
One upweller site
100m F&G buffer 100m F&G buffer between sitesbetween sites
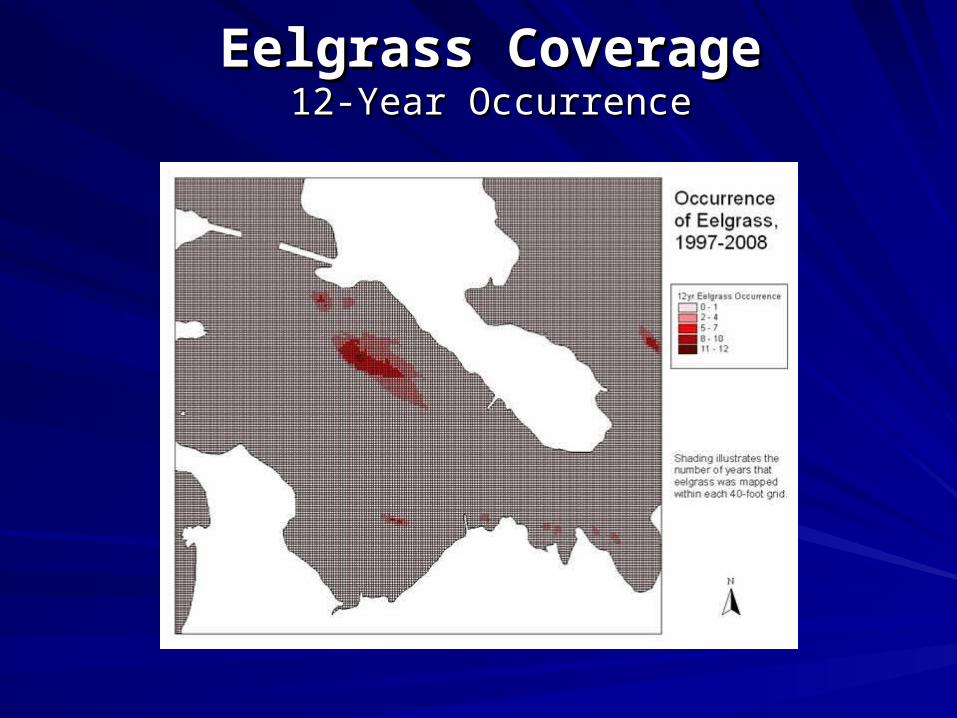
Eelgrass CoverageEelgrass Coverage12-Year Occurrence12-Year Occurrence

Eelgrass CoverageEelgrass Coverage12-Year Occurrence12-Year Occurrence

Shellfish Areas Shellfish Areas Closed For HarvestClosed For Harvest
Multiple public health risk factors– wastewater treatment wastewater treatment
facilitiesfacilities– marinas, mooring fieldsmarinas, mooring fields– other pollution sources other pollution sources

Flexibility With Closed AreasFlexibility With Closed Areas
General Sullivan Bridge General Sullivan Bridge closureclosure– temporary closure until temporary closure until
construction Is completeconstruction Is complete– ~ 35 acres~ 35 acres
Marina and mooring Marina and mooring field areasfield areas– reduced closure zonesreduced closure zones
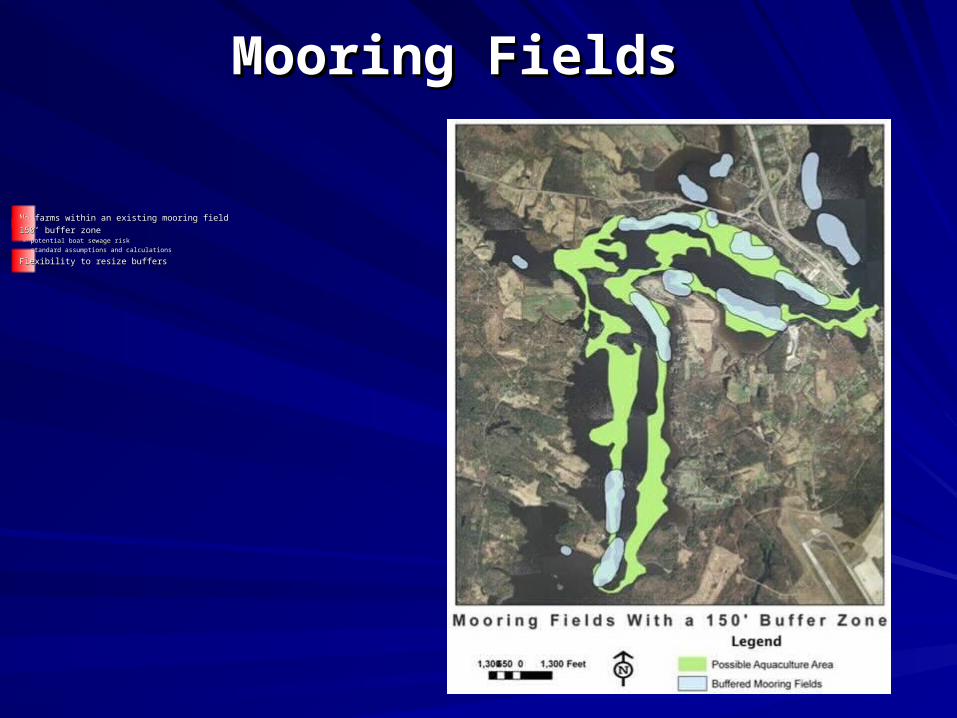
Mooring FieldsMooring Fields
No farms within an existing mooring fieldNo farms within an existing mooring field
150’ buffer zone150’ buffer zone– potential boat sewage riskpotential boat sewage risk– standard assumptions and calculationsstandard assumptions and calculations
Flexibility to resize buffersFlexibility to resize buffers

NHDES Spill Response BuoysNHDES Spill Response Buoys
50’ buffer zone to prevent 50’ buffer zone to prevent entanglementsentanglements

Revised Potential Aquaculture AreaRevised Potential Aquaculture Area
~389 acres eliminated~389 acres eliminated~ 17 acres in use~ 17 acres in use~ 396 acres available~ 396 acres availableMaximum aquaculture Maximum aquaculture area is ~413 acresarea is ~413 acres

How Many Aquaculture Sites FitHow Many Aquaculture Sites Fit Within This Area? Within This Area?
Hypothetical four-acre farm Hypothetical four-acre farm 50m buffer: 14.2 acres50m buffer: 14.2 acres36 (buffered) farms144 acres harvestable areaLikely an overestimate– depth, substrate, others
Assume unidentified constraints eliminate half of the 36 farms

How Many Oysters?How Many Oysters?One Age ClassOne Age Class
StageStageAssumedAssumed
MortalityMortalityOysters Per Oysters Per
AcreAcre
At Set OutAt Set Out ------ 750,000750,000
After First After First WinterWinter 60%60% 300,000300,000
Second YearSecond Year 30%30% 210,000210,000
Third YearThird Year 29%29% 149,100149,100
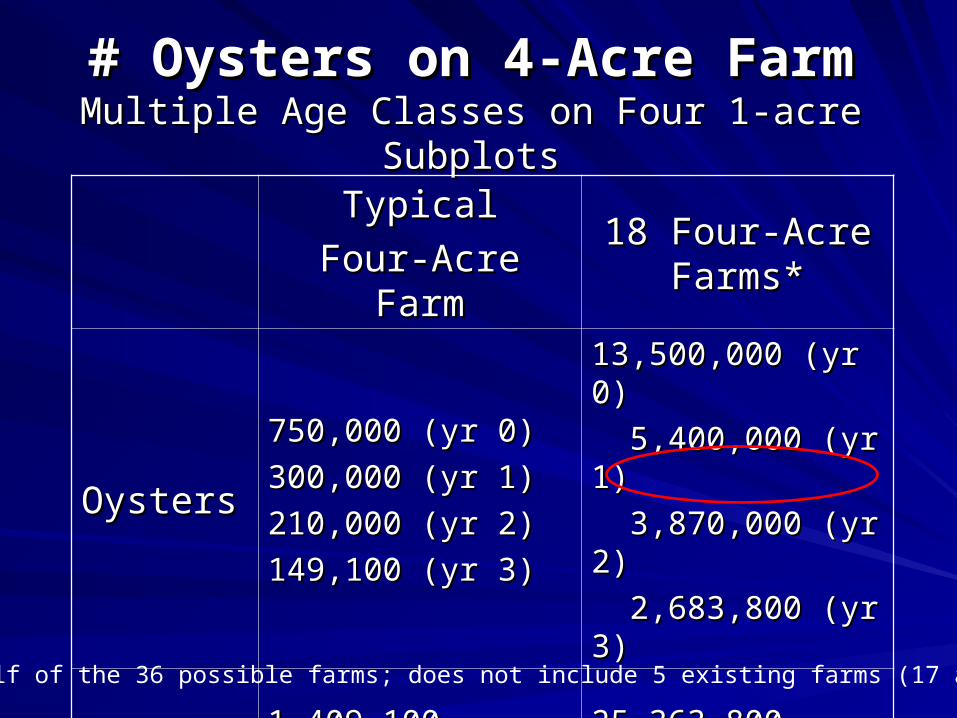
# Oysters on 4-Acre Farm# Oysters on 4-Acre FarmMultiple Age Classes on Four 1-acre SubplotsMultiple Age Classes on Four 1-acre Subplots
TypicalTypical
Four-Acre FarmFour-Acre Farm18 Four-Acre 18 Four-Acre
Farms*Farms*
OystersOysters
750,000 (yr 0)750,000 (yr 0)
300,000 (yr 1)300,000 (yr 1)
210,000 (yr 2)210,000 (yr 2)
149,100 (yr 3)149,100 (yr 3)
13,500,000 (yr 0)13,500,000 (yr 0)
5,400,000 (yr 1)5,400,000 (yr 1)
3,870,000 (yr 2)3,870,000 (yr 2)
2,683,800 (yr 3)2,683,800 (yr 3)
TotalTotal 1,409,100 oysters1,409,100 oysters 25,363,800 oysters25,363,800 oysters
* Half of the 36 possible farms; does not include 5 existing farms (17 acres)

Comparison to Comparison to Historical NumbersHistorical Numbers
1993: 24,000,000 harvestable-size oysters in Great Bay1993: 24,000,000 harvestable-size oysters in Great Bay
2008: 2,400,000 harvestable-size oysters in Great Bay 2008: 2,400,000 harvestable-size oysters in Great Bay
PREP Goal: 10,000,000 harvestable-size oysters PREP Goal: 10,000,000 harvestable-size oysters

Effects of Changing Farm SizeEffects of Changing Farm Size
Farm Farm Size Size
(acres)(acres)
FarmFarm
DimensionsDimensions50m Buffer 50m Buffer FootprintFootprint
Max. # Max. # Possible Possible
FarmsFarms
44 450’ x 390’450’ x 390’ 14 acres14 acres 3636
33 400’ x 330’400’ x 330’ 11 acres11 acres 6262
22 350’ x 250’350’ x 250’ 9 acres9 acres 8383

How Many Aquaculture Sites FitHow Many Aquaculture Sites Fit Within This Area? Within This Area?
Hypothetical Hypothetical three-acrethree-acre farm farm 50m buffer: 11 acres50m buffer: 11 acres62 (buffered) farms186 acres harvestable areaLikely an overestimate– depth, substrate, others
Assume unidentified constraints eliminate half of the 62 farms
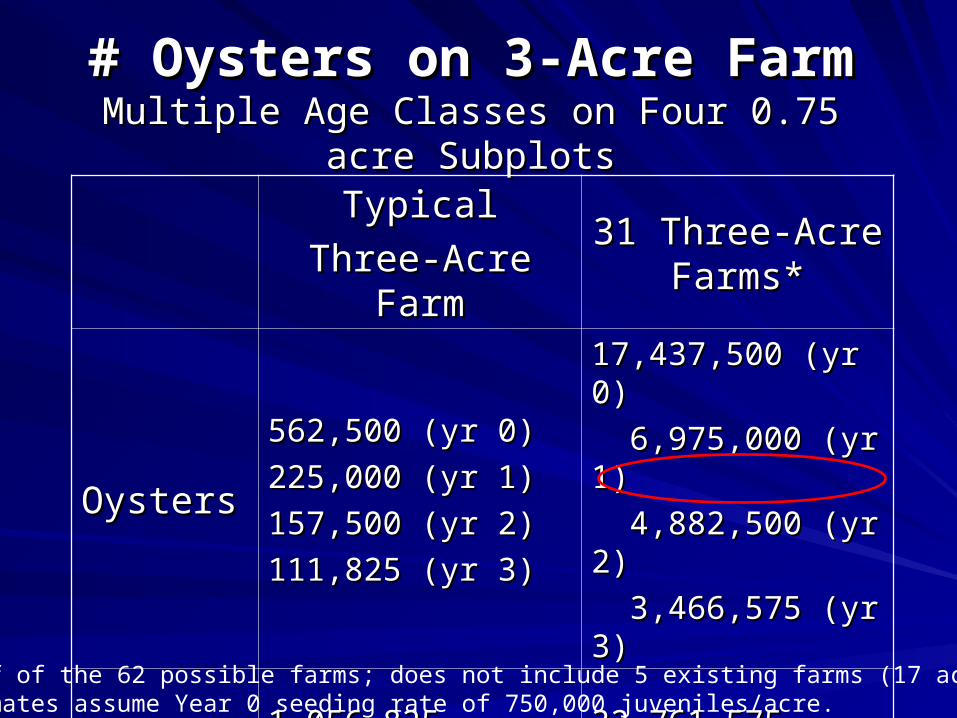
# Oysters on 3-Acre Farm# Oysters on 3-Acre FarmMultiple Age Classes on Four 0.75 acre SubplotsMultiple Age Classes on Four 0.75 acre Subplots
TypicalTypical
Three-Acre FarmThree-Acre Farm31 Three-Acre 31 Three-Acre
Farms*Farms*
OystersOysters
562,500 (yr 0)562,500 (yr 0)
225,000 (yr 1)225,000 (yr 1)
157,500 (yr 2)157,500 (yr 2)
111,825 (yr 3)111,825 (yr 3)
17,437,500 (yr 0)17,437,500 (yr 0)
6,975,000 (yr 1)6,975,000 (yr 1)
4,882,500 (yr 2)4,882,500 (yr 2)
3,466,575 (yr 3)3,466,575 (yr 3)
TotalTotal 1,056,825 oysters1,056,825 oysters 32,761,575 oysters32,761,575 oysters
*Half of the 62 possible farms; does not include 5 existing farms (17 acres). Estimates assume Year 0 seeding rate of 750,000 juveniles/acre.

How Many Aquaculture Sites FitHow Many Aquaculture Sites Fit Within This Area? Within This Area?
Hypothetical Hypothetical two-acretwo-acre farm farm
50m buffer: 9 acres50m buffer: 9 acres
83 (buffered) farms
166 acres harvestable area
Likely an overestimate– depth, substrate, others
Assume unidentified constraints eliminate half of the 83 farms

# Oysters on 2-Acre Farm# Oysters on 2-Acre FarmMultiple Age Classes on Four 0.5 acre SubplotsMultiple Age Classes on Four 0.5 acre Subplots
TypicalTypical
Two-Acre FarmTwo-Acre Farm41 Two-Acre 41 Two-Acre
Farms*Farms*
OystersOysters
375,000 (yr 0)375,000 (yr 0)
150,000 (yr 1)150,000 (yr 1)
105,000 (yr 2)105,000 (yr 2)
74,550 (yr 3)74,550 (yr 3)
15,375,000 (yr 0)15,375,000 (yr 0)
6,150,000 (yr 1)6,150,000 (yr 1)
4,305,000 (yr 2)4,305,000 (yr 2)
3,056,550 (yr 3)3,056,550 (yr 3)
TotalTotal 704,550 oysters704,550 oysters 28,886,550 oysters28,886,550 oysters
*Half of the 83 possible farms; does not include 5 existing farms (17 acres).Estimates assume Year 0 seeding rate of 750,000 juveniles/acre.

ScenariosScenarios
Farm SizeFarm SizeNumber Number
of Farmsof Farms
Annual OysterAnnual Oyster
ProductionProduction
2 acres2 acres 20 - 4120 - 41 1.52 – 3.06 million1.52 – 3.06 million
3 acres3 acres 16 – 3116 – 31 1.73 - 3.47 million1.73 - 3.47 million
4 acres4 acres 9 – 189 – 18 1.34 – 2.68 million1.34 – 2.68 million
Low-end production estimates assume ¼ of the potential farms identified are licensed.High-end production estimates assume ½ of the potential farms identified are licensed.

Potential Market-Sized Annual Potential Market-Sized Annual Oyster ProductionOyster Production
0
500,000
1,000,000
1,500,000
2,000,000
2,500,000
3,000,000
3,500,000
2-AcFarms
3-AcFarms
4-AcFarms
High Est.
Low Est.

Upweller: Preferred ConditionsUpweller: Preferred Conditions
Salinity: 12-32 ppt Salinity: 12-32 ppt
Required Depth: 3–4 ftRequired Depth: 3–4 ft
Water Temp: > 50Water Temp: > 50°F °F
Nutrients: Influx of Nutrient-Rich WaterNutrients: Influx of Nutrient-Rich Water
Power Source Power Source
Stable AttachmentStable Attachment

Assumed Production of Assumed Production of Spat from UpwellersSpat from Upwellers
Assume each upweller produces 1.8 million juveniles from 2 Assume each upweller produces 1.8 million juveniles from 2 million seed each season. million seed each season.
Farm SizeFarm Size
(acres)(acres)
Estimated # SpatEstimated # Spat
Needed per YearNeeded per Year
EstimatedEstimated
# Upwellers# Upwellers
22 7.7 - 15.4 million7.7 - 15.4 million 5 - 95 - 9
33 8.7 - 17.4 million8.7 - 17.4 million 5 - 105 - 10
44 6.8 - 13.5 million6.8 - 13.5 million 4 - 84 - 8
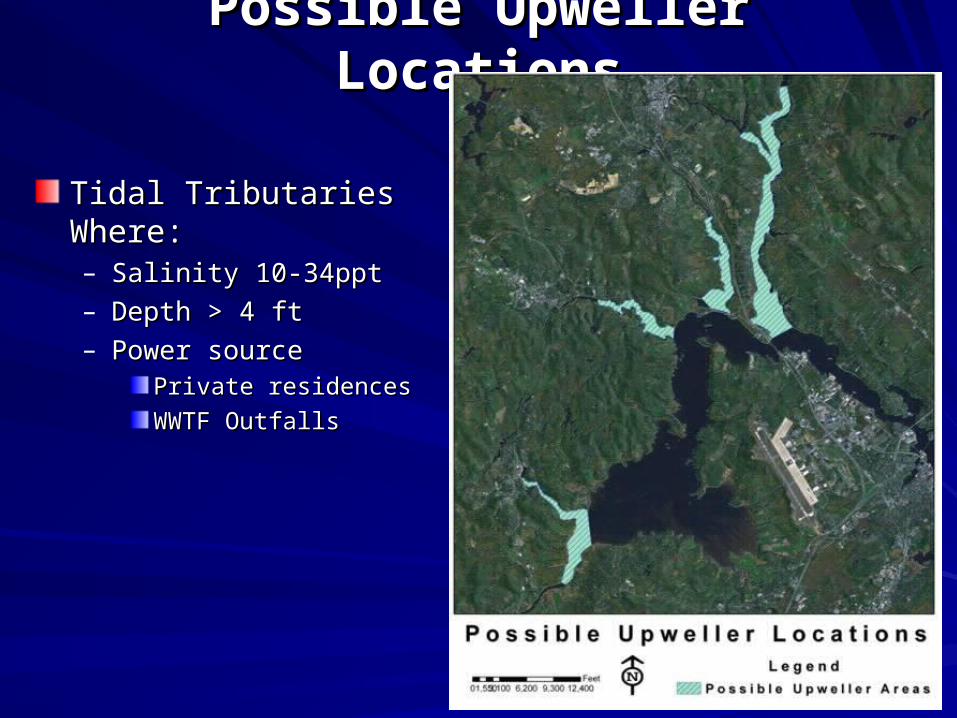
Possible Upweller LocationsPossible Upweller Locations
Tidal Tributaries Where:Tidal Tributaries Where:– Salinity 10-34ppt Salinity 10-34ppt – Depth > 4 ftDepth > 4 ft– Power sourcePower source
Private residencesPrivate residences
WWTF OutfallsWWTF Outfalls

Possible Upweller LocationsPossible Upweller Locations
Little Bay Where:Little Bay Where:– Salinity 10-34ppt Salinity 10-34ppt – Depth > 4 ftDepth > 4 ft– Power SourcePower Source
MarinasMarinas
Private residencesPrivate residences