potential to inactivate microorganisms in sewage sludge by...
TRANSCRIPT

Potential to inactivate microorganisms in sewage sludge by ammonia treatment – Different temperatures and urea additions Fredrik Wirell Master’s thesis
Institutionen för Energi och Teknik Examensarbete 2015:10 Department of Energy and Technology ISSN 1654-9392 Uppsala 2015
SLU, Swedish University of Agricultural Sciences Faculty of Natural Resources and Agricultural Sciences Department of Energy and Technology Title: Potential to inactivate microorganisms in sewage sludge by ammonia treatment - different temperatures and urea additions Author: Fredrik Wirell Supervisor: Annika Nordin, Department of Energy and Technology, SLU Examiner: Anna Mårtensson, Department of Soil and Environment, SLU Course: Independent project/degree project in Soil Science - Master's thesis Course code: EX0430 Credits: 30hp Level: A2E Programme/education: Agriculture Programme – Soil and Plant Sciences Series title: Examensarbete (Institutionen för energi och teknik, SLU), 2015:10 ISSN: 1654-9392 Uppsala 2015 Keywords: Ammonia, Urea, Sewage sludge, inactivation, reduction, Thermo tolerant coliform bacteria, Salmonella, E. coli, Enterococci, Somatic coliphage Online publication: http://stud.epsilon.slu.se

Abstract
Sewage sludge is rich in nutrients and organic matter, both of which can be useful in the agricultural
system. By recycling the nutrients from our excreta, a more sustainable use of nutrients in agriculture
can be achieved and the use of mineral fertilizer can thereby be decreased. There are however risks
associated with the use of sewage sludge in agriculture, and these must be minimized to guarantee the
safety of the environment and general public. The dispersion of heavy metals, organic pollutants and
pathogens are the main risk factors generally considered. The focus of this study was on the reduction
of pathogens in anaerobically digested, dewatered sewage sludge. Combinations of different
temperatures (28.0, 33.0, 38.0, 41.5 and 44.0°C) and additions of urea (0.5, 1.0 and 1.5% wet weight)
resulted in 20 treatments that were studied for seven days. The effect from added urea and temperature
on the reduction of Enterococcus spp., thermo tolerant coliform bacteria (TTC), somatic coliphages
and Salmonella spp. was analyzed. Additionally the treatments effect on pH, total nitrogen (N-tot) and
total ammonia nitrogen (TAN) concentrations was also analyzed. The efficiency for treatments to
reach threshold values proposed for Swedish future legislations concerning the studied organisms was
assessed. Treatment temperature had a positive effect on reduction of all studied organisms and added
urea had a positive effect on Enterococcus spp. and TTC reduction. Mean log10 reduction for
Enterococcus spp. was 2.28 and five of the treatments (0.5, 1.0 and 1.5% urea at 44.0°C and 1.5% urea
at 38 and 41.5°C) reached proposed (2010) legislative threshold values. Mean log10 reduction of TTC
was 4.22 and proposed threshold concentrations were reached using most treatments, only control
treatments (no added urea) at 28, 33 and 38°C, and 0.5 and 1.0% urea treatment at 28°C failed to reach
proposed concentrations. Mean log10 reduction of somatic coliphages was 1.27 and none of the
treatments reached proposed threshold reductions for viruses. The overall thresholds for 2010 years
regulatory proposal was reached for most treatments. Complete compliance with the 2013 proposal
could not be verified in this study since parasite reduction was not studied, and since the model
organism for viruses used was conservative. The efficient reduction observed for most of the studied
organisms lead to the conclusion that the method has great potential in this field of use. When also
considering the added value of increased nitrogen content in the final product, to be used as closed-
loop based fertilizer, the benefits using the method seem even greater. To further enhance the method,
facilitating the fulfillment of future regulations, further calibrating is needed.

1
Sammanfattning
Avloppsslam innehåller näring och organiskt material som kan vara till nytta som gödselmedel och
jordförbättrare i jordbruksmark. Ett mer cykliskt, hållbarare system för användande av växtnäring kan
uppnås om andelen mineralgödsel som används inom jordbruket minskas och ersätts med
avloppsslam. Det finns risker med användning av slam i jordbruket. Halter av tungmetaller, organiska
föroreningar och patogena organismer är de tre huvudsakliga riskerna som rör slamhanteringen. För att
slam ska kunna användas på mark där foder och livsmedel odlas måste dessa risker minimeras. Denna
studie har undersökt möjligheterna att reducera oönskade organismer i avvattnat förbehandlat
avloppslam från kommunala reningsverk. Försök gjordes i 20 kombinationer av olika temperaturer
(28.0, 33.0, 38.0, 41.5 och 44.0°C) och tillsatser av urea (0.5, 1.0 and 1.5% våtvikt). Varje behandling
pågick i sju dagar och behandlingarnas effekt på enterokocker, termotolleranta koliforma bakterier
(TTC), somatiska kolifager och Salmonella spp. i slammet analyserades.
Behandlingskombinationernas effekt på slammets pH, koncentration av totalkväve (N-tot) och
koncentration av totalt ammoniumkväve (TAN = ammonium (NH4 +)
och ammoniak (NH3))
analyserades också. De studerade behandlingarnas förmåga att nå föreslagna framtida gränsvärden för
de aktuella organismerna fastställdes. En hög temperatur gav ökad reducering av alla studerade
organismer. Tillsats av urea hade en positiv effekt på reducering av enterokocker och TTC. Den
genomsnittliga 10log-reduceringen av enterokocker var 2,28 och de föreslagna gränsvärdena för
enterokocker nåddes i fem av behandlingarna. För TTC var den genomsnittliga 10log-reduceringen
4,22 och de föreslagna gränsvärdena uppfylldes med de flesta behandlingsmetoderna. Somatiska
kolifager reducerades inte till föreslagna gränsvärden med någon av de använda behandlingarna, den
genomsnittliga 10log-reduceringen var 1,27. Föreslagna gränsvärden från 2010 uppfylldes med de
flesta av studiens behandlingar. Gränsvärden från 2013 års förslag, där andra organismer regleras,
uppnåddes inte av någon av de använda behandlingarna. Detta berodde till stor del på att virus och
parasiter tagits med som reglerade organismer. Inaktivering av parasiter studerades inte i denna studie
och modellen för virus-inaktivering som använts var för konservativ för att uppfylla 2013 års
lagförslag. Den effektiva reduktionen av de flesta av studerade organismer leder till slutsatsen att den
studerade metoden lämpar sig bra för rening av avloppsslam. Tas även det ökade gödselvärdet, som
skapas då kväve blandas i slammet, i åtanke verkar metoden lämpa sig speciellt bra för att skapa ett
kretsloppsbaserat gödselmedel för användning i jordbruket. Fortsatta studier behövs dock för att
optimera hygieniseringsprocessen så att den kan användas för att uppfylla framtida regleringskrav.

2
Contents
1 Introduction 4
1.1 Aim 7
2 Background 8
2.1 Legislations 8
2.2 Ammonia treatment 8
2.3 Model organisms 9
2.3.1 Enterococcus spp. 10
2.3.2 Thermo tolerant coliform bacteria and Escherichia coli 10
2.3.3 Bacteriophages 10
2.3.4 Salmonella spp. 10
3 Materials and methods 11
3.1 The sludge 11
3.2 The experimental set up 12
3.3 Sampling 13
3.4 Analyses 13
3.4.1 Total solids 13
3.4.2 pH and nutrient analysis 13
3.4.3 Microbiological analyses 13
3.5 Statistical analysis 15
4 Results 16
4.1 Initial sludge 16
4.2 After treatment 19
4.2.1 Sludge chemical properties 19
4.2.2 Enterococcus spp. inactivation 22
4.2.3 TTC inactivation 25
4.2.4 Somatic coliphage inactivation 26
4.2.5 Salmonella spp. inactivation 27
3
5 Discussion 28
5.1 Reduction 28
5.1.1 Enterococcus spp. 28
5.1.2 TTC 29
5.1.3 Somatic coliphages 29
5.1.4 Salmonella spp. 30
5.1.5 Over-all compliance with proposed regulations 30
5.2 Treatment effect on sludge chemical properties 31
5.3 Initial sludge quality 31
5.3.1 Recommendations 32
6 Conclusions 33
7 Acknowledgements 34
8 References 35
9 Appendix 39
9.1 Populärvetenskaplig sammanfattning 39

4
1 Introduction
The harvest of crops in an agricultural system inevitably leads to an export of nutrients from the fields
where the crops are grown. Much of these nutrients are transported to urban areas for human
consumption. At the end of the line in such a system a surplus of nutrients is created, with most of the
nutrient ending up in the human excreta. To avoid nutrient depletion in the fields, a balance of nutrient
flows in the cropping system need to be maintained by adding nutrients so that the field import and
export are balanced. On Swedish crop production farms the import of nutrients commonly consists of
mineral fertilizer. If the surplus of nutrient at the end of the line such as phosphorous (P) and nitrogen
(N) is not taken advantage of by recycling to the field, a linear system depending on import of new
nutrients to the system is maintained. The production of mineral fertilizer is dependent on energy and
therefore exposed to uncertainties and fluctuations in price. Furthermore, the availability of easily
extractable nutrient fractions as e.g. phosphorus is limited. By recycling, and thus to some extent
replace the mineral fertilizer, a more cyclic system can be established. About 90% of Swedish
households are connected to municipal sewage systems. As a result a majority of human excreta
produced in Sweden is transported to, and treated at, municipal sewage treatment plants (STPs).
Nutrient rich sewage sludge is produced at these STPs in the process of cleaning the waste water
before it is allowed to be discharged into the natural water course.
The annual national sludge production 2012 was 207 Gg (TS). With a mean phosphorous
concentration of 26.4 g/kg (TS) the total phosphorous in the produced sludge amounted to 5.5 Gg SCB
(2014d). Of the produced sludge 83% (4547 Mg P) reached accepted threshold levels for use in
agriculture, however, only 23% (1300 Mg P) was used for this purpose in 2012. According to the
reported figures, the use of mineral fertilizer P could potentially be reduced by about 40% if all sludge
that reach accepted threshold values were to be used to its potential in agriculture. In the current
situation however, only approximately 12% of mineral fertilizer phosphorous application is substituted
by the use of sludge. Differences in plant availability of phosphorus in sludge and inorganic
phosphorous fertilizer as well as practical factors regarding logistics and distribution may cause
practical problems for replacing mineral fertilizer with sewage sludge. Such factors are only briefly
discussed in this study.
The use of sludge in agriculture is beneficial in many aspects. The most obvious benefit is perhaps the
fertilizing effect of the sludge. Sewage sludge contains many plant nutrients, most importantly
phosphorous and nitrogen, but also micronutrients. In a Swedish environmental perspective
phosphorous is important as Swedish environmental objectives specifically focus on phosphorous
recycling. However, it is important to remember that sludge also contains other important plant
nutrients.

5
The soil phosphorous content is divided in to organic and inorganic phosphorous and the distribution
between these pools depends on the properties of each soil. The inorganic pool can be further divided
in to three fractions: directly plant available, indirectly plant available and non-plant available
phosphorous. The inorganic non-plant available phosphorous consist of phosphorous absorbed to
minerals. This stable phosphorous fraction is generally the largest in Swedish soils. The slow
weathering of these minerals is the main source of nutrients in natural, undisturbed soils. The
indirectly plant available phosphorous fraction consists of phosphates adsorbed to surfaces of iron and
aluminum oxides and clay particles as well as bound to calcium (Djodjic, 2001). The phosphates in
this fraction adsorb/desorb from the surfaces, thus becoming unavailable/available for plant uptake in
a process regulated by equilibrium reactions (Sims and Sharpley, 2005).
The phosphorous available for plant uptake consists of mono- and di hydrogen phosphates present in
the soil solution. Due to the low solubility of phosphates these available ions represents a very small
part of the total soil phosphorous content and could easily be depleted through plant uptake. However,
in Swedish agricultural soils total phosphorous is generally high, and the equilibrium between the
fractions is restored as phosphates are desorbed from oxides and particle surfaces. The organic
phosphorous exists in living organisms, in residues of dead organisms and as soil organic matter. The
soil organic matter mainly consists of humic substances, stable organic compounds that originate from
decomposed organisms. The availability of phosphorous in these compounds differs depending on
degree of degradation (Nardi et al., 2002). Living organisms play a significant role of the phosphorous
cycle. They take up and immobilize the available phosphates as well as mineralize and solubilize
organic and inorganic compounds, enabling plant uptake. Additionally plant microbe interactions are
also important to enhance plant phosphorous uptake (Turner et al., 2005).
The plant availability for phosphorous added to the soil with sludge is related to the methods used in
the sewage treatment plant. In Sweden, sludge phosphorous is mostly bound to calcium, iron or
aluminum and thus not immediately plant available. Fertilizing with such sludge increases the soil
phosphorous reserve from which plant available phosphorous can be solubilized in a longer
perspective. Due to the complexity of the phosphorous cycle, the plant availability cannot be easily
assessed by only analyzing the source of phosphorous input. External factors such as climate and
geography as well as the inherent properties of each soil (including chemical, physical and biological
aspects) and farming operations (cultivation, crop rotation, liming etc.) are important in determining
the fate of the applied fertilizer.
In addition to the fertilizing effect organic material in the sludge is also beneficial for the soil as it
increases soil organic matter. This improves the soil aggregation and helps the maintenance of the soil
structure (Six et al., 2000). This makes the soil less vulnerable to erosion and compaction while it
becomes easier to cultivate and facilitates plant root growth. The improved soil structure also increases
aeration, drainage and water and nutrient retention and microbial diversity (Joshua et al., 1998,
Khaleel et al., 1981). These effects are especially beneficial for soils where organic fertilizer is not
regularly applied, i.e. crop production farms where animal manure is not available and forage is not
grown. Additionally, application of sludge to soil has proven an increase the activity of the enzymes
urease and phosphatase in the soil which are important for increasing plant availability of nitrogen and
phosphorous (Pascual et al., 2002).
By comparing the inputs and outputs of nutrients in an agricultural system, a balance can be made
showing eventual surpluses. Of all the sewage sludge produced in Sweden in 2010, 25% was applied
on arable land (SCB, 2012). Phosphorous is mainly applied in form of animal manure, and in 2013

6
72% of the phosphorous applied to arable land in Sweden was from manure (SCB, 2014a). The
phosphorous used on Swedish arable land was 37 Gg 2010/11 and 37 Gg 2012/13 (SCB, 2014c, SCB,
2014b). Mineral fertilizer P application amounted to 9.9 Gg 2010/11. Removal of phosphorous by
harvest of crops and crop residue year 2011 was 37 Gg and additional 1.6 Gg were reported as lost
through leaching (SCB, 2014b).
There are several concerns associated with the use of sewage sludge as fertilizer. One concern is the
risk of spreading and accumulating heavy metals and organic contaminants in the fields used for food
production, as this could potentially contaminate soil, ground water and crop. The content of unwanted
contaminants in sewage sludge reflects the use of different products in the society, and sewage sludge
has been indicated to be a suitable matrix for tracking the use of chemicals in society at large
(Olofsson et al., 2012). The heavy metals found in sewage can, to varying degrees depending on the
element, be traced back to households (food, pipes and taps, tooth fillings, laundry detergents, paint,
drinking water) and industries (car washes, dentists, pipes and taps, drinking water) as well as storm
water (runoff from roofs and roads) (Sorme and Lagerkvist, 2002). Organic contaminants reaching the
STPs may originate from households , hospitals and industry (Olofsson et al., 2012). Other risks when
using sludge as fertilizer include spreading microorganisms that may cause diseases, pathogens.
Sewage sludge contains high concentrations of enteric and pathogenic organisms including Listeria
spp, Salmonella spp., Escherichia coli among others as well as viruses (Dudley et al., 1980, Dumontet
et al., 2001, Arthurson, 2008). Both the risk of spreading heavy metals and organic contaminants as
well as unwanted organisms must be assessed and minimized before sludge can be used. The focus of
this thesis is on minimizing the risk of spreading unwanted microorganisms by reducing their
concentrations in the sewage sludge to a level considered safe for use.
Pathways for spread of pathogens can be divided in to direct and indirect contact (Kowal, 1985).
Direct contact include touching the sludge or the soil where sludge has been applied as well as
inhaling microbes that have become airborne during i.e. cultivation of the soil. Indirect contact can
occur as a result of ingestion of water and food contaminated. Example of such ingestion can be
consumption of contaminated food produced on fields where sludge has been applied or ingestion of
contaminated drinking water, groundwater or recreational water. Another way of indirect contact can
be through contact with pathogens or sludge transported through vectors, including insects, birds,
rodents, grazing animals and pets. By inactivating the unwanted organisms at the STP site before
transport and application, many of the above mentioned risks can be efficiently minimized at an early
stage.
There are several methods for sanitational treatment of sludge and other fecal material. By adding ash
or lime to the material, a high material pH can be accomplished. This high pH and the drying effect of
the additive are both factors that help inactivation of organisms. Though, the high pH may also lead to
significant losses of gaseous ammonia, leading to loss of nitrogen and consequently reduced fertilizer
value of the material. Other treatment methods include different variations of heating the material to
accomplish inactivation. Such methods include pasteurization, thermic hydrolysis, thermophilic
composting, incineration and thermic dewatering (Vinnerås, 2013, Nordin, 2010).
Most of the sewage sludge used in Swedish agriculture is applied in the autumn since the nitrogen
concentration of sludge is often not considered sufficient for spring application. When sludge is spread
during spring farming operations, additional nitrogen fertilizer is often used to compensate for this
lack of nitrogen. In addition to the mentioned sanitation methods there is sludge ammonia treatment.
The treatment involves addition of nitrogen to the sludge in the form of urea or ammonium hydroxide

7
solution. This makes the ammonia method for sanitizing sludge interesting, as it increases nitrogen
content of the sludge. Thus using this method, the need for compensatory nitrogen application could
be avoided, saving time during spring cropping operations when timeliness is important. This thesis
paper attempts to validate how ammonia treatment using different urea additions in combination with
different temperatures could be used to sanitize anaerobically digested dewatered sewage sludge from
two sewage treatment plants (STPs).
1.1 Aim The general aim of this thesis was to determine the efficiency of different combinations of temperature
and urea additions in reducing microorganisms in dewatered sewage sludge. Specifically the reduction
of Enterococcus spp., thermo tolerant coliform bacteria (TTC), bacteriophages and Salmonella spp.
was in focus of the study. The most relevant factors assumed related to the reduction were examined.
Additionally the possibility of inactivating the studied organisms in compliance with future legislative
thresholds was assessed. Four hypotheses were tested in this study:
1. An addition of urea-N leads to an increase of TAN concentration corresponding to the amount
of added urea-N.
2. Increased temperature and additions of urea-N have a positive effect on reduction of the
studied organisms.
3. The reduction of the studied organisms is mainly affected by the sludge NH3-N concentration
in combination with temperature.
4. Reduction of the studied organisms to levels complying with proposed future legislative
thresholds is achievable using treatment combinations.
By finding the most efficient treatment combinations as well as the contributing factors for organism
inactivation this study aim to serve as decision basis in further development of full scale treatment.
8
2 Background
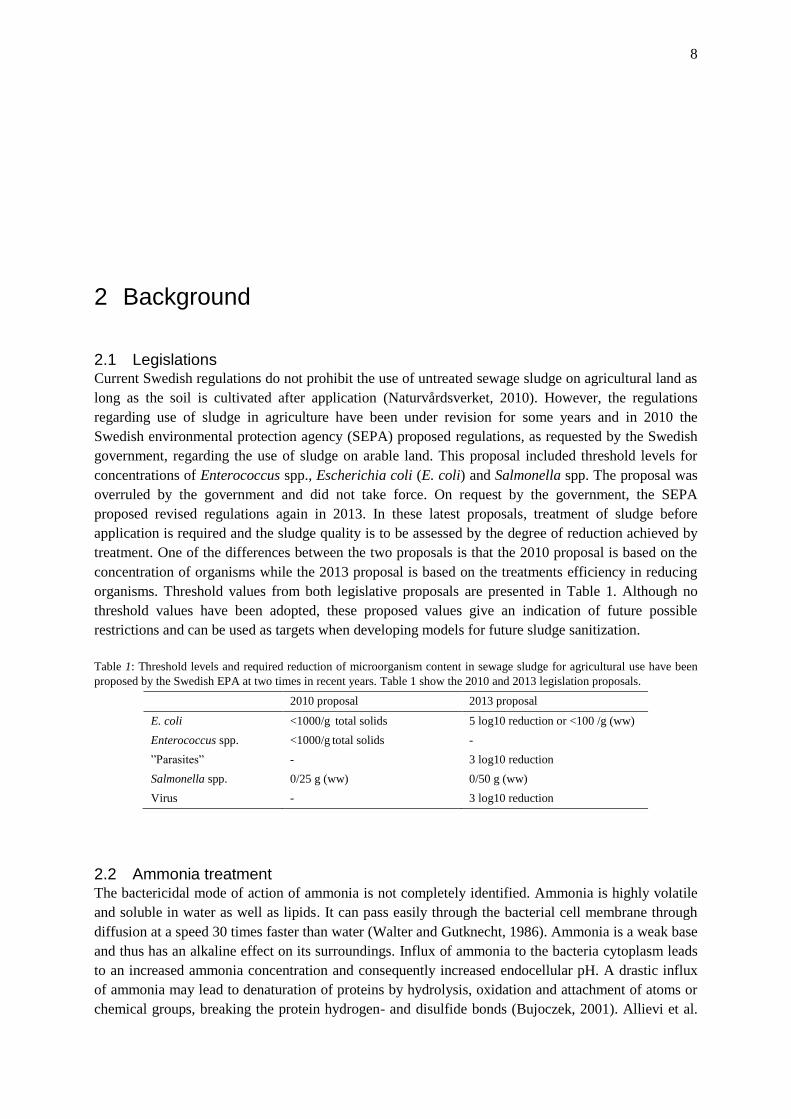
2.1 Legislations Current Swedish regulations do not prohibit the use of untreated sewage sludge on agricultural land as
long as the soil is cultivated after application (Naturvårdsverket, 2010). However, the regulations
regarding use of sludge in agriculture have been under revision for some years and in 2010 the
Swedish environmental protection agency (SEPA) proposed regulations, as requested by the Swedish
government, regarding the use of sludge on arable land. This proposal included threshold levels for
concentrations of Enterococcus spp., Escherichia coli (E. coli) and Salmonella spp. The proposal was
overruled by the government and did not take force. On request by the government, the SEPA
proposed revised regulations again in 2013. In these latest proposals, treatment of sludge before
application is required and the sludge quality is to be assessed by the degree of reduction achieved by
treatment. One of the differences between the two proposals is that the 2010 proposal is based on the
concentration of organisms while the 2013 proposal is based on the treatments efficiency in reducing
organisms. Threshold values from both legislative proposals are presented in Table 1. Although no
threshold values have been adopted, these proposed values give an indication of future possible
restrictions and can be used as targets when developing models for future sludge sanitization.
Table 1: Threshold levels and required reduction of microorganism content in sewage sludge for agricultural use have been
proposed by the Swedish EPA at two times in recent years. Table 1 show the 2010 and 2013 legislation proposals.
2010 proposal 2013 proposal
E. coli <1000/g total solids 5 log10 reduction or <100 /g (ww)
Enterococcus spp. <1000/g total solids -
”Parasites” - 3 log10 reduction
Salmonella spp. 0/25 g (ww) 0/50 g (ww)
Virus - 3 log10 reduction
2.2 Ammonia treatment The bactericidal mode of action of ammonia is not completely identified. Ammonia is highly volatile
and soluble in water as well as lipids. It can pass easily through the bacterial cell membrane through
diffusion at a speed 30 times faster than water (Walter and Gutknecht, 1986). Ammonia is a weak base
and thus has an alkaline effect on its surroundings. Influx of ammonia to the bacteria cytoplasm leads
to an increased ammonia concentration and consequently increased endocellular pH. A drastic influx
of ammonia may lead to denaturation of proteins by hydrolysis, oxidation and attachment of atoms or
chemical groups, breaking the protein hydrogen- and disulfide bonds (Bujoczek, 2001). Allievi et al.

9
(1994) concluded that using KOH and NH4OH respectively to elevate pH resulted in a higher
inactivation for the ammonium hydroxide treatment, even though the same pH was reached, a
difference that was attributed to the ammonia content.
The virucidal mode of action of ammonia is also not completely known. Inactivation of poliovirus by
ammonia is related to cleavage of RNA inside of the virus particle. Ammonia can freely diffuse
through the virus coating and suggested inactivation mechanisms of action include stimulation of
nuclease activity and alkaline hydrolysis as a result of increased pH. In turn this leads to irreversible
degradation of the viral RNA (Ward, 1978, Ward and Ashley, 1977).
The ammonia (NH3) concentration is largely controlled by three factors: temperature, pH and total
ammonia nitrogen (TAN) concentration. These factors are combined in two equations (Equation 1 and
Equation 2) that are used to model the NH3 concentration (Emerson et al., 1975). As pH and
temperature increase, so does the NH3-N/TAN fraction (f). The addition of urea to the sludge increases
the TAN concentration and, as a result, pH also increases. Measured values of temperature, pH and
TAN can then be used to calculate the ammonia (NH3) concentrations using Equation 1 and Equation
2.
Equation 1
Equation 2
Additionally, temperature affects the permeability of cell membrane (Booth et al., 1999). As higher
temperature increase the permeability of the cell membrane, this may cause an increased influx of
ammonia to the cell. Ammonia treatment of excreta based material has previously been proven
successful by (Nordin et al. (2009), Mendez et al. (2008)) and Allievi et al. (1994) among others. The
inactivation of Salmonella spp. and Enterococcus spp. in manure using combinations of temperature
and ammonia content was examined by Ottoson et al. (2008). Both temperature, ammonia content and
the combination of these two had a significant effect on inactivation of both Salmonella spp. and
Enterococcus spp. Mendez et al. (2008) also confirmed that a higher temperature resulted in a
significantly increased inactivation of both fecal coliforms and Salmonella spp. when treating with
ammonia. When adding ammonia to the sludge, urea can be used as the ammonia source. When urea is
added to sludge it is degrades to CO2 and ammonia. This hydrolysis is catalyzed by the enzyme urease
that abounds in fecal matter.
2.3 Model organisms There is a wide range of microorganisms and potential pathogens in the fecal matter and it is not
feasible to investigate the presence and inactivation of all of these. Fecal indicator organisms are
organisms that can be used as indicators for fecal contamination. The presence and/or concentration of
indicator organisms can be examined, giving indication of the extent of an eventual fecal
contamination. Another use of the indicator organisms is to evaluate the treatment efficiency in
relation to their concentrations in the treated material since they always are present at high

10
concentrations at start. Key fecal indicator organisms include thermo tolerant coliforms (TTC),
Enterococcus spp. and bacteriophages. The following organisms were used in this study.
2.3.1 Enterococcus spp.
Enterococcus spp. are gram positive bacteria commonly used as indicator for fecal contamination. Due
to its gram positive cell wall it is more resistant to external stress factors than the gram negative TTC
and consequently it is a more conservative indicator for enteric pathogens. Enterococcus spp. bacteria
are part of the genus Enterococcus and exist as commensal bacteria in relatively high numbers in the
faeces of human and other warm blooded animals (Ashbolt et al., 2001, Zhang, 2012).They are
opportunistic pathogens and are generally able to survive harsh conditions, including saline conditions
as well as wide temperature (10-45° C) and pH (4.5-10) range. Optimal growth temperature is 35° C
and the predominant species found in animal and human faeces is E. faecalis followed by E. faecium
(Vinnerås, 2013). Due to its resilience to different conditions Enterococcus spp. is almost omnipresent
in the environment. Antibiotic resistance is a concern regarding Enterococcus spp. as it has been found
to develop resistance to several antibiotics (Bouki et al., 2013). The interest of Enterococcus spp.
inactivation in sewage sludge is partly related to controlling spread of these resistant genes and
bacteria in the environment (Hammack, 2012, Vinnerås, 2013).
2.3.2 Thermo tolerant coliform bacteria and Escherichia coli
Thermo tolerant coliform bacteria (TTC), also known as fecal coliforms, are gram negative bacteria
that can produce acid and gas at 44.5°C. This group of bacteria has traditionally been used as a fecal
indicator, especially for water quality. Escherichia coli are part of the TTC group and one of the most
common enteric species in the human intestine, as a part of the normal intestinal flora. It is the most
appropriate group to use for detection of fecal contamination from warm blooded animals, i.e. humans
(Ashbolt et al., 2001). The majority of E. coli does not cause disease whilst in the gut, however there
are some pathogenic strains causing gastroenteritis. Though E. coli mostly is harmless while in the gut,
it a great cause of foodborne illness when ingested as a result of contamination (Feng, 2012). In this
study it is used as a model for gram negative enteric bacteria.
2.3.3 Bacteriophages
Bacteriophages (phages) are viruses that infect bacteria, but apart from that are physiologically similar
to human viruses. In this thesis they were used as a model organism for enteric virus inactivation.
2.3.4 Salmonella spp.
Salmonella spp. is a gram negative bacterium in the family Enterobacteriacea and in the genus
Salmonellae. It is one of the most prevalent bacterial pathogens and it is problematic for use of bio
solid fertilizer due to its zoonotic properties and its capability to survive and re-grow in the
environment. Salmonella spp. can cause two types of illness, gastrointestinal illness and typhoid fever
and the species of greatest concern for public health is S. enterica (Hammack, 2012). Presence and
inactivation of Salmonella spp. was analyzed in this study. Salmonella spp. is an important organism
to study as it is a pathogen that is commonly found in treated sewage sludge and it is often considered
in legislations regarding use of organic waste.
11
3 Materials and methods
3.1 The sludge The sludge used in this study was collected at Kungsängen STP, Uppsala and at Bromma STP,
Stockholm. Kungsängen STP treat 120 500 population equivalents and 166 000 people live in its
catchment area. Corresponding figures for Bromma STP are 184 000 and 328 000 respectively
(Vatten, vatten, 2013, Lindh, 2013). In both STPs the sludge was stabilized and used for methane
production using mesophilic anaerobic digestion. The sludge mean retention time in the digesters was
20 days at Kungsängen and 31 days at Bromma. Kungsängen STP used ferric chloride as a flocculent
while Bromma STP used ferric sulfate.
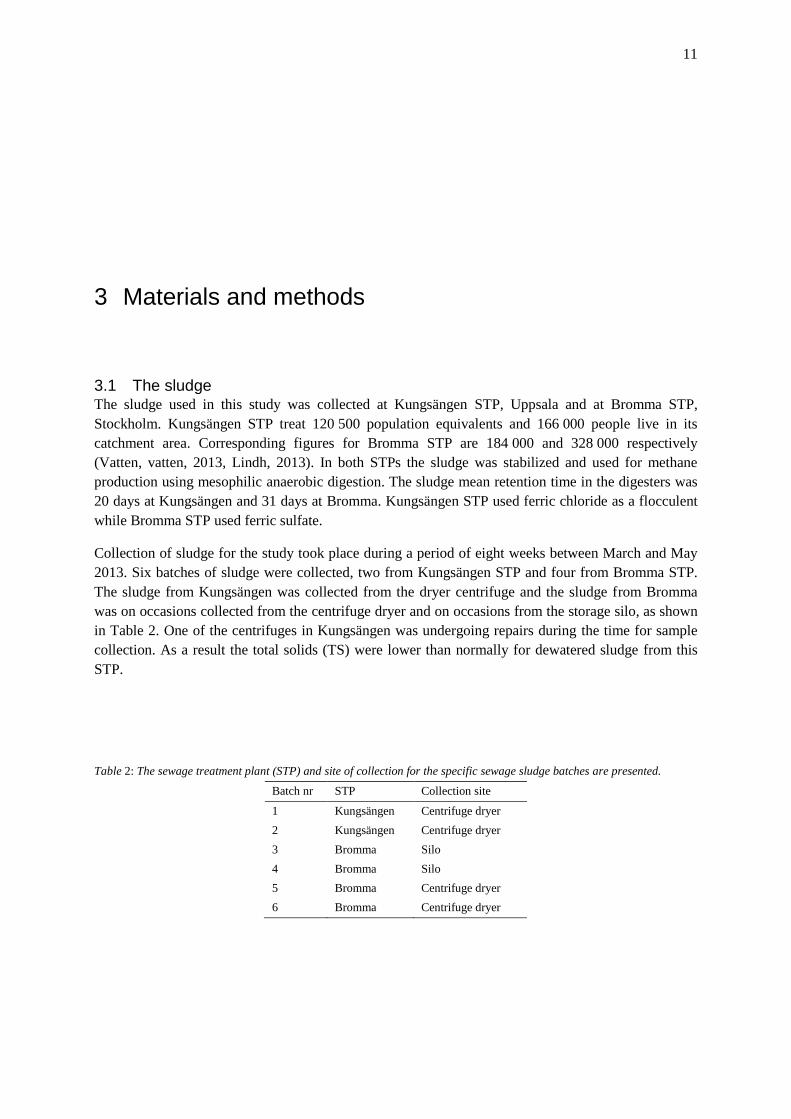
Collection of sludge for the study took place during a period of eight weeks between March and May
2013. Six batches of sludge were collected, two from Kungsängen STP and four from Bromma STP.
The sludge from Kungsängen was collected from the dryer centrifuge and the sludge from Bromma
was on occasions collected from the centrifuge dryer and on occasions from the storage silo, as shown
in Table 2. One of the centrifuges in Kungsängen was undergoing repairs during the time for sample
collection. As a result the total solids (TS) were lower than normally for dewatered sludge from this
STP.
Table 2: The sewage treatment plant (STP) and site of collection for the specific sewage sludge batches are presented.
Batch nr STP Collection site
1 Kungsängen Centrifuge dryer
2 Kungsängen Centrifuge dryer
3 Bromma Silo
4 Bromma Silo
5 Bromma Centrifuge dryer
6 Bromma Centrifuge dryer

12
3.2 The experimental set up Twenty different combinations of temperature and urea concentration (treatments) were used for
assessing inactivation of Enterococcus spp., TTC, bacteriophages and salmonella. Temperatures of:
28, 33, 38, 41.5 and 44°C were used in combinations with urea added in ratios of: 0.5, 1.0, and 1.5%
(wet weight). Additionally, for each temperature a control treatment with no added urea was studied.
The batches used for the different treatment replicates and their treatment codes are shown in Table 3.
Table 3: The different combinations of added urea and temperatures used to treat the sludge. The sludge batches used for the
specific treatments are presented (given in brackets) as well as the treatment code (in bold).
urea (% weight) Temp (°C)
28 (°C) 33 (°C) 38 (°C) 41.5 (°C) 44 (°C)
0 00@28
(1, 3, 6)
00@33
(2, 3, 5)
00@38
(1, 4, 6)
00@415
(2, 4, 5)
00@44
(1, 3, 6)
0.5 05@28
(2, 4, 6)
05@33
(1, 4, 5)
05@38
(2, 3, 6)
05@415
(1, 3, 5)
05@44
(2, 4, 5)
1.0 10@28
(1, 3, 5)
10@33
(2, 3, 6)
10@38
(1, 4, 5)
10@415
(2, 4, 6)
10@44
(1, 3, 6)
1.5 15@28
(2, 4, 5)
15@33
(1, 4, 6)
15@38
(2, 3, 5)
15@415
(1, 3, 6)
15@44
(2, 4, 5)
The sludge used for treatment was collected as six batches, and each of the six sludge batches was
used for one incubation session consisting of ten different treatments (Table 3).The urea and
temperature combinations. Each of the ten urea and temperature combinations (treatments) was tested
in three replications, using different batches for each replication to cover eventual temporal and spatial
variations of the sludge.
During startup approximately 110 g of wet sludge per treatment replicate was placed in a Stomacher
bag® (Seward, UK). The bags were then shaken manually for homogenization and to break up larger
chunks of sludge. Urea was added to the bags according to the treatment combinations given in Table
3. The bags were then shaken manually to maximize incorporation of urea into the sludge. After
shaking the bags, the mix of sludge and urea was emptied into 250 ml plastic cups. The cups were
closed with a lid and, additionally, silicone was used to seal the lids to prevent loss of ammonia gas.
The sealed cups were put in heat incubators according to Table 3 for one week (7 days).
Four of the sealed cup lids broke during treatment due to high pressure in the cup when using sludge
from batch 5. These treatment replicates were canceled and repeated using sludge from batch 6
instead. Consequently only six treatment replicates were performed using batch 5 and 14 treatment
replicates were performed using batch 6. For treatments using sludge from batch 6 a special nozzle
was made using a syringe and a balloon to minimize the pressure on the plastic cups and avoid leakage
of ammonia gas.

13
3.3 Sampling Analysis of total solids (TS), pH, total nitrogen (N-tot), total phosphorous (P-tot), total ammonia
nitrogen (TAN), Salmonella spp., thermo tolerant coliform bacteria (TTC), Enterococcus spp., somatic
coliphages and f-RNA phages was performed on the sludge before and after each treatment. Before
treatment, sludge analysis was performed using three samples per batch. After one week of sludge
treatment the analyses were repeated, except for total solids and total phosphorus. The post- treatment
sludge was analyzed using one sample per treatment replicate, resulting in three analyzed samples per
treatment.
Before sampling, the sludge was mixed manually to minimize effects of eventual sludge
heterogeneity. The sludge was scooped up from the batch container/treatment-cup and transferred to
sample container using plastic spoons. Approximately 10 g of sludge per sample was separated was
used for pH and nutrient analysis. For TS analysis 25-35 g of sludge per sample was collected. To
prepare dilution series for analysis of TTC, Enterococcus spp. and bacteriophages, 10 g of sludge per
sample was used. For Salmonella spp. analysis 25 g samples of sludge were used.
3.4 Analyses
3.4.1 Total solids
Samples were put in a cold oven that was heated up to 105°C for 24 h. After heating, samples were left
to cool in the oven for 14h. After cooling the weight change was used to calculate the total solids
content.
3.4.2 pH and nutrient analysis
The samples used for pH and nutrient analysis were diluted 1:4 (weight based) using deionized water
in a Stomacher bag ® (Seward, UK) mixed by hand and subsequently transferred to and left to rest in
a sealed container for 1h. After resting, pH was measured using a standard pH meter (PHM 210,
Radiometer, Copenhagen) and electrode (PHC 2051, Radiometer, Copenhagen). For analysis of
nutrient content, volume based dilution series were produced from the initial 1:4 slurry to obtain
concentrations in accordance with Spectroquant cell test range. TAN analysis was performed using the
indophenol blue method (Spectroquant 1.14559.0001; Merck, Darmstadt). Total nitrogen was
analyzed using oxidation and 2.6-Dimethylphenol method (Spectroquant 1.14763.0001; Merck,
Darmstadt). Total phosphorus was analyzed using oxidation and phosphomolybdenum blue method
(Spectroquant 1.14729.0001; Merck, Darmstadt). Instruments used for nutrient analysis were
Spectroquant NOVA 60 spectrophotometer (Merck, Darmstadt) and Thermoreactor TR 420 (Merck,
Darmstadt) for oxidation/digestion of N-tot and P-tot samples.
The ammonia-N (NH3-N) concentration was obtained by multiplying measured TAN concentrations
with the fraction of NH3, calculated using Equation 1 and Equation 2 (Emerson et al., 1975).
3.4.3 Microbiological analyses
For microbial analyses, except Salmonella spp., the sludge samples were diluted 1:9 in Stomacher
bags using buffered NaCl peptone solution (pH 7.2) with tween (SVA, Sweden). The bag was
massaged to obtain a homogenous slurry. These first dilutions were then further 10-fold diluted up to 3
14
times using the same dilution solution. The prepared dilution series were left to rest for 20-30 minutes
before plating.
Thermo tolerant coliform bacteria were enumerated with Violet red bile agar (VRG) pour plate
method using 1 ml of 1 and 2 log10 diluted sludge, resulting in a detection limit of 10 CFU/g wet
sludge. The plates were incubated in 44 ±1°C for 24 ±3 hours before typical colonies were counted. In
the startup analysis for each batch a representative selection of ten typical TTC colonies from each
plate were further analyzed in lactose tryptone lauryl sulphate broth (LTLSB) tubes with Durham
tubes to analyze if the colonies were E. coli. Gas in Durham tubes after 24 h in 44°C was considered a
confirmation off general TTC presence. These TTC positive tubes were added 0.3-0.5 ml of Kovacs
reagent to detect E. coli presence. Positive reaction, indicating presence of E coli, was confirmed by a
change of color to red-ish.
Two plating approaches were used for Enterococcus spp. enumeration on Slanetz-Bartley (SlaBa)
plates. Sludge treated with a combination of high urea and temperature were plated using 0.2 ml of 1
log10 diluted sludge on five plates per replicate. This method was used to push the detection limit for
the most efficient treatments, enabling CFU detection at a lower dilution, and resulted in a detection
level of 10 CFU/g (ww) sludge. Treatments predicted to be less efficient, due to treatment using lower
temperature and urea addition, were plated using 0.1 ml of 2 and 3 log10 diluted sludge on one plate
per dilution and replicate. This resulted in a detection limit of 100 CFU / g wet sludge. The plates were
then incubated for 48 ±2 h in 44°C ± 0.2. After incubation, all red, maroon and pink colonies were
presumed to be Enterococcus spp.
The host bacteria used for detection of f-RNA phages and somatic coliphages was S. typhimurium WG
49 (ATCC® 700730™) and E. coli 13706 (ATCC® 13706™), respectively. Host solutions were
cultivated in nutrient broth (SVA, Sweden) at 38°C ±1 during shaking and used within approximately
3 h and while still in log growth phase. One (1) ml of sample and 1 ml of host solution was added to
tubes containing 2 ml of melted soft agar in (46°C) heat blocks (Grant Instruments Ltd, England).
After vortexing a tube, the content was spread on blood base agar (BAB) plates (SVA, Sweden). The
plates were incubated at 38°C ±1 for 11 h. Plaque forming units (PFU) were counted and used to
calculate phage concentrations. The plating was performed using 10log dilutions of 1 and 2, resulting
in a detection limit of 10 CFU / g of wet sludge.
Salmonella
Salmonella spp. was enriched giving the presence or absence in 25 g of wet sludge. In the enrichment
procedure 25 g of sludge was diluted 1:9 using buffered peptone water (BPW) (SVA, Sweden).
Resulting slurry was incubated for 18 h in 38°C ±1. Three drops of the incubated slurry was applied
on to modified semisolid Rappaport Vassiliadis semisolid plates (MSRV) incubated 24 h at 41.5°C.
After incubation, positive samples showed loss of color in the agar around the drops, indicating
presence of flagellated salmonella. Plates with negative results were returned to the incubator for 24
more hours. If no positive results were seen after 48 hours the samples were considered free from
salmonella. If positive samples appeared during the first or second incubation time the droplet sites
were further examined for Salmonella confirmation. To confirm Salmonella spp. presence, colorless
agar from the positive droplet sites on the MSRV plates were spread on Xylose Lysine Deoxycholat
agar (XLD) and Brilliant Green agar (BG) plates. Xylose Lysine Deoxycholat and BG plates were
incubated for 24 h at 38°C. After incubation, typical Salmonella spp. looking colonies were further
confirmed using triple sugar iron tubes and urea broth.

15
3.5 Statistical analysis The average start concentrations in different batches of sludge used in the experiment was compared
by single factor analysis of variance (Anova) followed by post hoc analysis with Tukey’s Honestly
Significant Difference (HSD) test (at family rate 5). Correlation between the analyzed sludge factors
was performed using Pearson product moment correlation coefficient. General regression analysis was
performed for bacteria and coliphage inactivation using temperature vs added urea-N and post
treatment NH3-N concentrations. If not indicated other, all statistical analysis has alpha levels ≤ 0.05.
All statistical analyses were performed in Minitab 16 (Minitab Inc., USA).

16
4 Results
4.1 Initial sludge In the initial sludge, TS was significantly lower for sludge collected at Kungsängen STP (mean
20.8%) than sludge collected at Bromma STP (mean 31.5%). Mean TS from all batches was 28.0%.
As seen in Table 4, TS was positively correlated with TAN, P-tot, TTC and Enterococcus spp.
concentrations and negatively correlated to N-tot concentrations.
Table 4: Levels of Total solids (TS), pH, total N (N-tot) total ammonia nitrogen (TAN), total P (P-tot) thermo tolerant
Coliform bacteria (TTC) Enterococcus spp., and somatic coliphages were examined in the initial sludge before treatment.
The mean results are presented below. Standard deviation (SD) and coefficient of variation is also presented as well as range
and correlations between the different factors.
Factor (unit) Mean (SD) CV Min-max Correlations
TS (% of ww) 28.0
(5.57)
0.19 19.6 - 34.6 TAN+, TTC+, P-tot+,
Enterococcus spp.+, Ntot-
pH 7.90
(0.25)
0.030 7.5 - 8.2 TAN-
N-tot
(mg / g)
4.41
(1.85)
0.42 1.50 - 9.00 P-tot-, TTC-, TS-
TAN
(mg / g)
1.44
(0.50)
0.35 0.79 - 2.20 TS+, TTC+, Ptot+,
Enterococcus spp.+, pH-
P-tot
(mg / g)
6.30
(2.68)
0.42 2.85 - 11.70 TS+, TAN+, TTC+,
Enterococcus spp.+, Ntot-
TTC (CFU / g ww) 7.68×10⁶
(1.49×10⁷)
1.94 1.70×10⁴ -
4.70×10⁷
TS+, TAN+, P-tot+,
Enterococcus spp.+, Ntot-
Enterococcus spp.
(CFU / g ww)
1.74×10⁶
(2.47×10⁵)
1.41 1.82×10⁴ -
7.00×10⁶
TS+, TAN+, P-tot+, TTC+
Somatic coliphages
(CFU / g ww)
2.69×10³
(1.89×10³)
0.70 5.45×10² -
8.27×10³
-
Initial sludge mean pH was 7.9 with a standard deviation of 0.25. The initial pH differed between
batches (figure 1) but there was no difference in pH between sludge collected from the different
treatment plants. However, there were differences in batch pH related to the batch collection site
(Table 2). Sludge collected from the centrifuge dryer (batch 1, 2, 5 and 6) had a higher mean pH than
sludge collected from the silo (batch 3 and 4) 8.1 and 7.6 respectively. The pH had a negative
correlation with TAN, but did not correlate with other factors.

17
654321
8.3
8.2
8.1
8.0
7.9
7.8
7.7
7.6
7.5
7.4
batch
pH
Figure 1: The measured pH in the sludge before treatment of the different batches, see table 2 for explanation of batches.
The nutrient content varied greatly between sludge batches, as seen in Figure 2 and Figure 3. Mean N-
tot concentration was 4.41 mg/g and the mean coefficient of variation within batches sample replicates
was 0.22. The corresponding values for P-tot were 6.30 mg/g and 0.12. Total ammonia nitrogen mean
value was 1.44 mg/g and the mean coefficient of variation within batches was 0.042, substantially
lower than for both N-tot and P-tot. N-tot correlated negatively with P-tot, TTC and TS, but no
correlation was found with TAN. A positive correlation was seen between TAN and P-tot and both of
these independently showed positive correlations with Enterococcus spp., TTC and TS. Mean N-tot
and P-tot concentrations were not different for sludge collected at the two STPs. The mean TAN
concentration was higher in sludge collected at Bromma compared to Kungsängen (1.71 and 0.90
respectively). The different collection sites used (centrifuge and silo) did not result in different
concentrations of N-tot, TAN or P-tot.
654321
12
10
8
6
4
2
0
(mg
/g
)
Figure 2: Total N (N-tot)(●) and total P (P-tot)(■) concentrations (mg/g) measured before treatment of the different batches,
see table 2 for explanation of batches.

18
654321
2.2
2.0
1.8
1.6
1.4
1.2
1.0
0.8
0.6
(mg
/g
)
Figure 3: measured total ammonia nitrogen (TAN) (mg/g) of the different batches before treatment, see table 2 for
explanation of batches.
Sludge collected at Bromma STP had higher Enterococcus spp. and TTC mean concentrations than
Kungsängen sludge: 6.12 vs 4.51 log10 CFU/g for Enterococcus spp. and 6.43 vs 4.47 log10 CFU/g
for TTC. However, large variations of TTC concentration were observed for batches of Bromma
sludge. The different collection sites (silo or dryer) did not influence Enterococcus spp. or TTC
concentrations significantly. Enterococcus spp. and TTC concentrations were in the same range as one
another in the individual batches (Figure 4), and the concentrations were also correlated to each other.
The analysis of presumed TTC colonies on the pre-treatment plates confirmed that 86% of colonies
were general TTC and 66% of colonies were confirmed as E. coli. Salmonella spp. presence per 25 g
wet sludge was confirmed in all batches of sewage sludge used.
Before treatment, only low concentrations of f-RNA phages were found in sludge from batch 2 and 5.
The analysis of f-RNA phages was subsequently excluded from the study. The mean concentration of
somatic coliphages in initial sludge was 2.7 × 10³ PFU/g ww and levels did not differ significantly
between Bromma and Kungsängen STPs. The concentrations of somatic coli phages varied less than
the other studied organisms and no significant correlations were found with any of the other examined
factors of the initial sludge.
654321
8
7
6
5
4
(CFU
/ g
)
Figure 4: Concentrations (cfu g-1) of Enterococcus spp. (○), thermo tolerant coliform bacteria (■) in the sludge of the
different batches pre-treatment, see table 2 for explanation of batches.

19
4.2 After treatment
4.2.1 Sludge chemical properties
Regression analyses showed that an increased addition of urea had a positive correlation with post
treatment pH, N-tot and TAN after the one week incubation (Figure 5 a-c) whereas no significant
effect from temperature was observed on the mentioned parameters. (Table 5). Even though no urea
was added, mean values for pH, N-tot and TAN increased also in the control treatments (Table 5).
Table 5: Mean pH and mean concentrations of N-tot, TAN and calculated NH3-N (mg/g wet weight) after treatment is
presented for the different urea-N additions. The increase of these parameters during treatment is also presented. Coefficient
of variation (CV) is presented within parenthesis.
Added
urea
(% ww)
Added urea-
N (mg/g
ww)
pHEND
(CV)
TANEND
(mg/g
ww)
(CV)
Increase of TAN
(mg/g ww)
(CV)
NtotEND
(mg/g ww)
(CV)
Increase of Ntot (mg/g
ww)
(CV)
NH3-N
(mg/g
ww)
(CV)
0.0 0.0 8.0
(2.8)
4.00
(37.8)
2.61
(44.3)
7.85
(38.3)
3.29
(111)
0.44
(55)
0.5 2.3 8.2
(1.6)
6.81
(21.7)
5.40
(23.5)
11.60
(17.9)
7.23
(40.4)
1.16
(60.3)
1.0* 4.7 8.4
(1.4)
8.24
(14.7)
6.85
(14.2)
13.7
(24.0)
9.17
(48.3)
1.92
(42.5)
1.5* 7.0 8.5
(1.1)
11.0
(15.0)
9.61
(16.8)
17.3
(17.4)
12.9
(31.6)
3.17
(25.1)
*Values for TAN and increase of TAN have been adjusted with respect to three outliers in replicates of treatments 15@28
and 10@38 of batch 5 and 10@44 of batch 6.
.
treatment temp (C)
% added urea
44.0
41.5
38.0
33.0
28.0
1.5
1.0
0.5
0.0
1.5
1.0
0.5
0.0
1.5
1.0
0.5
0.0
1.5
1.0
0.5
0.0
1.5
1.0
0.5
0.0
8.6
8.4
8.2
8.0
7.8
7.6
pH
A
treatment temp (C)
% added urea
44.0
41.5
38.0
33.0
28.0
1.5
1.0
0.5
0.0
1.5
1.0
0.5
0.0
1.5
1.0
0.5
0.0
1.5
1.0
0.5
0.0
1.5
1.0
0.5
0.0
14
12
10
8
6
4
2
(mg
/g
)
C
treatment temp (C)
% added urea
44.0
41.5
38.0
33.0
28.0
1.5
1.0
0.5
0.0
1.5
1.0
0.5
0.0
1.5
1.0
0.5
0.0
1.5
1.0
0.5
0.0
1.5
1.0
0.5
0.0
25
20
15
10
5
(mg
/g
)
B
Figure 5a-c: The mean pH, N-tot and TAN
after treatment for each of the used treatment
combinations. The values for TAN were
adjusted for three outliers. (Bars indicate One
Standard Error from the Mean).

20
Three outliers were identified when plotting the increase in TAN (mg/g) against added urea-N (mg/g),
15@28 and 10@38 of batch 5 and 10@44 of batch 6 (Figure 6). These treatments were prepared with
urea-N additions of 7.0 (15@28), 4.7 (10@38) and 4.7 (10@44) mg/g, but the measured TAN increase
was 15.23, 15.18 and 11.47 respectively resulting in post treatment TAN values of 17.20, 17.15 and
12.90 mg/g. This was higher than expected based added urea, especially in the 10@38 replicate (the
third largest increase of all examined replicates). The validity of these unproportionally high TAN
values was not confirmed by a corresponding increase in pH or in reduction of any of the studied
organisms. Two of these replicates (15@28 and 10@38) also showed an unexpectedly high increase of
N-tot. This indicated that a sampling error may have occurred, as both TAN and N-tot samples were
performed using the same dilution series. Subsequently the post treatment TAN values for these
replicates were considered flawed and substituted with the mean TAN of the remaining two replicates
of the same treatment. This affects the independence of the results for these treatments and reduces the
variation, which should be considered when analyzing the results.
The measured mean increase of both TAN and N-tot was high compared to the expected increase
based on the added urea in the treatments, up to two times higher (Table 6). These increases of TAN in
the control treatments that could not be attributed to addition of urea were used as an indicator of the
normal conversion of non-TAN nitrogen to TAN during the treatment process. When the mean
increases of N-tot and TAN in the controls (representing the “natural” increase at each temperature)
were subtracted from the total increase of the treatments using added urea, more likely values for the
N-increase from the addition of urea was obtained. As seen in Figure 7, especially the values for TAN
increase are close to the expected values, represented by the black thick line.
76543210
16
14
12
10
8
6
4
2
0
(mg/g ww)
(mg
/g
ww
)
Figure 6: The relation between added urea and increase in TAN (total ammonia nitrogen) concentration (r2= 69.6 and
regression coefficient = 1.1). The original values for outliers 15@28, 10@38 of batch 4 and 10@44 of batch 5 are shown in
squares. These were replaced with mean of the remaining two treatment replicates in further analyses.
21
76543210
15
10
5
0
-5
(mg/g ww)
(mg
/ g
ww
)
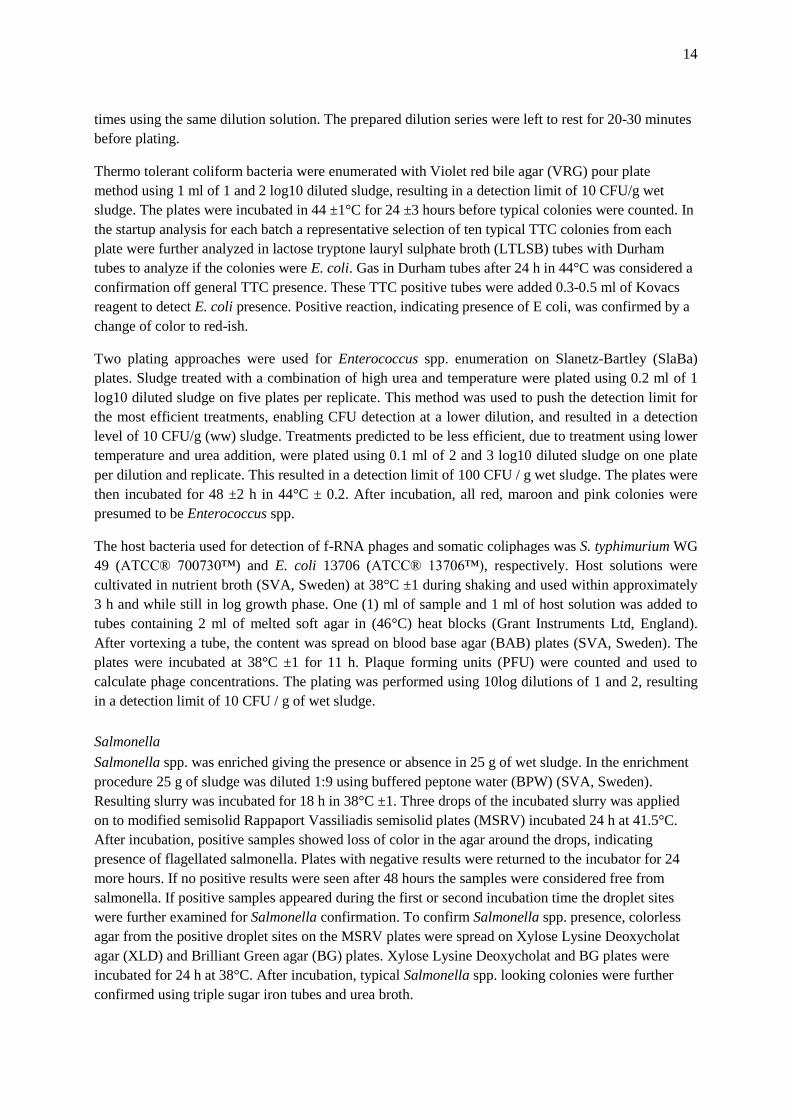
Figure 7: Mean increase in total ammonia nitrogen (TAN) (∆ and ) as well as total nitrogen (N-tot) (● and - - -) (mg/g wet
weight) by the addition of urea nitrogen. Values adjusted for “natural” increase in concentrations obtained from control
treatments are plotted. A bold black line is representing the expected increase of TAN.
Table 6: The change in total ammonia nitrogen (TAN) as well as total nitrogen (N-tot) in control treatments (no urea added)
for the different treatment temperatures.
Temp (°C) Increase of TAN in
control treatment (mg/g ww)
Increase of N-tot in
control treatment (mg/g ww)
28 1.58 0.420
33 2.58 3.12
38 2.28 5.92
41.5 3.42 4.34
44 3.16 2.63
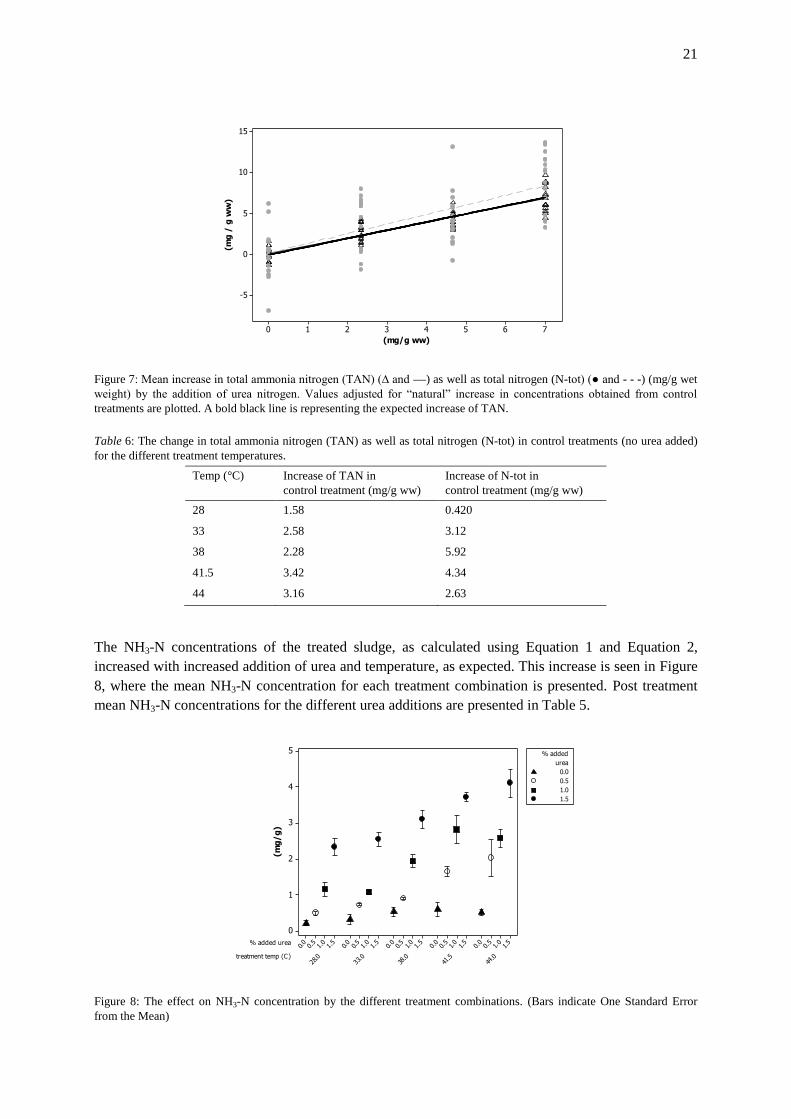
The NH3-N concentrations of the treated sludge, as calculated using Equation 1 and Equation 2,
increased with increased addition of urea and temperature, as expected. This increase is seen in Figure
8, where the mean NH3-N concentration for each treatment combination is presented. Post treatment
mean NH3-N concentrations for the different urea additions are presented in Table 5.
treatment temp (C)
% added urea
44.0
41.5
38.0
33.0
28.0
1.5
1.0
0.5
0.0
1.5
1.0
0.5
0.0
1.5
1.0
0.5
0.0
1.5
1.0
0.5
0.0
1.5
1.0
0.5
0.0
5
4
3
2
1
0
(mg
/g
)
0.0
0.5
1.0
1.5
urea
% added
Figure 8: The effect on NH3-N concentration by the different treatment combinations. (Bars indicate One Standard Error
from the Mean)

22
4.2.2 Enterococcus spp. inactivation
The mean log10 reduction of Enterococcus spp. for all treatment replicates at all temperatures was 2.3
ranging from -0.06 (growth in one replicate of 10@28 treatment) to 5.6. A 3 log10 reduction was
reached with 1.0 and 1.5% urea at 38°C and for all the treatments (including controls) at 41.5 and
44.0°C (Table 8 and Figure 9). Temperature and post treatment NH3-N concentrations were significant
factors for the Enterococcus spp. log10 reduction (Pearson correlation). Regression analyses showed
that temperature and NH3-N concentration combined were the most suitable factors for modeling the
inactivation of Enterococcus spp.. At 38°C the Enterococcus spp. reduction was related to added urea
and NH3-N concentrations (Figure 9 and Figure 10) with treatments with 1.0 and 1.5% added urea,
reaching noticeably higher reduction than control and 0.5% urea treatments. All treatments at 44.0°C,
except the control, reached concentrations below 1000 CFU / g (TS), the threshold concentration in
the 2010 legislation proposal whereas at 38 and 41.5°C only the highest urea addition of 1.5% reached
the proposed level (Table 7).
Treatment replicates using batch 5 resulted in higher mean post treatment concentrations than the other
replicates despite same reduction, this due to the high initial concentration in this batch. Sludge from
Bromma STP did for the same reason result in a higher post treatment Enterococcus spp.
concentration than Kungsängen.
Table 7: The mean concentration of thermo tolerant coliform bacteria (TTC) and Enterococcus spp. after the different
treatments. Standard error of the mean is also presented.
Mean post-
treatment
concentrations
TTC (CFU/g ww)
(100 = threshold -2013
proposal)
TTC (CFU/g TS)
(1000 = threshold -2010
proposal)
Enterococcus spp. (CFU/g
TS) (1000 = threshold -2010
proposal)
Treatment code Mean SE Mean Mean SE Mean Mean SE Mean
00@28 3.5×10⁴ Ö 1.9×10
4 1.3×10
5 Ö 6.6×10
4 2.5×10
5 Ö 1.3×10
5
05@28 1.2×10³*
Ö 1.1×10
3 3.7×10
3*
Ö 3.5×10
3 1.0×10
6 Ö 9.5×10
5
10@28 3.2×10²*
Ö 3.2×10
2 9.2×10
2* 9.2×10
2 1.9×10
6 Ö 1.2×10
6
15@28 <100 CFU/ g - <1 CFU /10 g - 1.3×10⁶ Ö 6.5×10
5
00@33 3.4×10⁴ Ö 2.1×10
4 1.1×10
5 Ö 5.7×10
4 9.1×10
5 Ö 7.2×10
5
05@33 <100 CFU/ g - <1 CFU /10 g - 1.1×10⁶ Ö 8.9×10
5
10@33 <100 CFU/ g - <1 CFU /10 g - 9.9×10⁴ Ö 5.8×10
4
15@33 <100 CFU/ g - <1 CFU /10 g - 2.7×10⁵ Ö 2.3×10
5
00@38 4.4×10²*
Ö 4.4×10
2 2.2×10
3*
Ö 2.2×10
3 1.4×10
5 Ö 1.1×10
5
05@38 3.3×101* 3.3×10
1 1.5×10
2* 1.5×10
2 4.7×10
4 Ö 2.3×10
4
10@38 <100 CFU/ g - <1 CFU /10 g - 7.2×10⁴*
Ö 4.9×10
4
15@38 <100 CFU/ g - <1 CFU /10 g - 5.2×102* 5.2×10
2
00@415 <10 CFU/ g - <1 CFU /10 g - 3.9×10⁴*
Ö 2.0×10
4
05@415 <10 CFU/ g - <1 CFU /10 g - 1.7×10⁴*
Ö 1.6×10
4
10@415 <10 CFU/ g - <1 CFU /10 g - 6.4×10³*
Ö 6.4×10
3
15@415 <10 CFU/ g - <1 CFU /10 g - 5.7×102* 3.7×10
2
00@44 <10 CFU/ g - <1 CFU /10 g - 4.0×10³*
Ö 3.8×10
3
05@44 <10 CFU/ g - <1 CFU /10 g - 1.0×101* 1.1×10
1
10@44 <10 CFU/ g - <1 CFU /10 g - <10 CFU/ g -
15@44 <10 CFU/ g - <1 CFU /10 g - <10 CFU/ g -
* At least one of the underlying treatment replications failed to detect the level of reduction. Ö Over proposed threshold value.

23
Tukey analysis showed that the mean log10 reduction of Enterococcus spp. was not affected by initial
TS, STP, batch, pH, added urea-N, initial TAN or STP collection site. Treatment temperatures
however did result in different grouping of the mean log10 reductions with a higher reduction at
higher temperatures.
For nine of the treatments at temperatures 38.0, 41.5 and 44.0 ° C the detection limit was reached in at
least one replicate (Table 8 and Figure 9). In the two lower temperatures where the Enterococcus spp.
reduction limit was not reached and the actual reduction could be analyzed, it was increased by both
higher temperature and more added urea (Figure 10). As expressed in Equation 1, the NH3-N
concentration increases with increasing temperature; however the reduction was further affected by
temperature (Figure 10).
Table 8: Mean log10 reduction for thermo tolerant coliform bacteria (TTC), Enterococcus spp. and somatic coliphages is
presented for each of the used treatment combinations. Standard error of the mean is also presented.
Log10 red. Thermo tolerant coliform
bacteria (TTC)
Enterococcus spp. Somatic coliphages
Treatment Mean SE Mean Mean SE Mean Mean SE Mean
00@28 1.0 0.61 0.63 0.27 1.1 0.30
05@28 >3.6 0.87 0.76 0.43 0.93 0.50
10@28 >4.2 0.29 0.52 0.31 0.99 0.31
15@28 >5.2£ 2.0 0.96 0.12 0.80 0.41
00@33 2.3 1.1 0.77 0.11 0.46 0.26
05@33 >4.7£ 1.0 0.71 0.054 1.0 0.26
10@33 >4.3 0.56 1.1 0.15 0.91 0.42
15@33 >4.9£ 0.62 2.0 0.72 1.1 0.31
00@38 >4.2 1.3 1.5 0.057 1.4 0.39
05@38 >4.0 0.86 1.2 0.31 1.3 0.45
10@38 >5.3£ 0.87 >2.7 0.52 1.6 0.48
15@38 >4.3 0.56 >3.6 0.48 1.2 0.38
00@415 >5.2£ 0.98 2.7 0.31 >1.5 0.65
05@415 >4.8£ 0.90 >3.1 0.34 1.5 0.31
10@415 >4.7£ 0.72 >3.5 0.97 1.4 0.45
15@415 >4.4 0.47 >3.4 0.18 >1.7 0.54
00@44 >4.4 0.47 >3.1 0.49 1.3 0.32
05@44 >4.7£ 0.72 > 4.5 0.66 1.2 0.27
10@44 >4.4 0.47 > 4.3 0.31 2.0 0.43
15@44 >4.7£ 0.72 > 4.5 0.66 >2.0 0.43
> reduction beyond detection limit in at least one treatment replicate £ log10 reduction is in compliance with the proposed legislation threshold.
24
treatment temp (C)
% added urea
44.0
41.5
38.0
33.0
28.0
1.5
1.0
0.5
0.0
1.5
1.0
0.5
0.0
1.5
1.0
0.5
0.0
1.5
1.0
0.5
0.0
1.5
1.0
0.5
0.0
5
4
3
2
1
0
Bars are One Standard Error from the Mean
enterococci log10 reduction
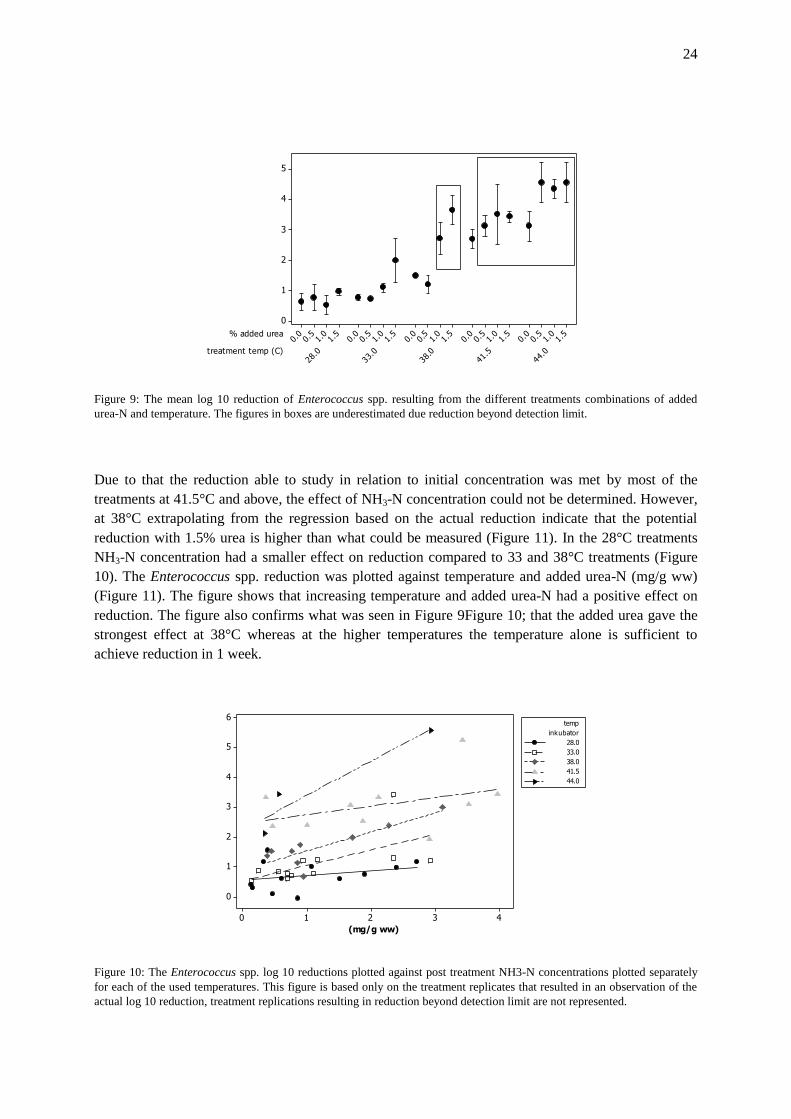
Figure 9: The mean log 10 reduction of Enterococcus spp. resulting from the different treatments combinations of added
urea-N and temperature. The figures in boxes are underestimated due reduction beyond detection limit.
Due to that the reduction able to study in relation to initial concentration was met by most of the
treatments at 41.5°C and above, the effect of NH3-N concentration could not be determined. However,
at 38°C extrapolating from the regression based on the actual reduction indicate that the potential
reduction with 1.5% urea is higher than what could be measured (Figure 11). In the 28°C treatments
NH3-N concentration had a smaller effect on reduction compared to 33 and 38°C treatments (Figure
10). The Enterococcus spp. reduction was plotted against temperature and added urea-N (mg/g ww)
(Figure 11). The figure shows that increasing temperature and added urea-N had a positive effect on
reduction. The figure also confirms what was seen in Figure 9Figure 10; that the added urea gave the
strongest effect at 38°C whereas at the higher temperatures the temperature alone is sufficient to
achieve reduction in 1 week.
43210
6
5
4
3
2
1
0
(mg/g ww)
28.0
33.0
38.0
41.5
44.0
inkubator
temp
Figure 10: The Enterococcus spp. log 10 reductions plotted against post treatment NH3-N concentrations plotted separately
for each of the used temperatures. This figure is based only on the treatment replicates that resulted in an observation of the
actual log 10 reduction, treatment replications resulting in reduction beyond detection limit are not represented.

25
(mg/g ww)
(C°)
6.45.64.84.03.22.41.60.80.0
42.5
40.0
37.5
35.0
32.5
30.0
>
–
–
–
–
–
< 0
0 1
1 2
2 3
3 4
4 5
5
log10 red
enterococci
Figure 11 The effect of temperature and added urea-N on the log 10 reduction of Enterococcus spp.. The plot shows the
individual replications and their resulting log 10 reductions.
4.2.3 TTC inactivation
Post treatment TTC log10 reduction was correlated to added urea-N, NH3-N concentration and
treatment temperature (Pearson correlation). The Mean TTC log10 reduction for all treatments and
temperatures was 4.22 and this reduction had a stronger relation to NH3-N concentration than to added
urea. General regression analysis showed that treatment temperature and added urea-N in combination
were the most suitable factors to model post treatment log10 reduction. However, these models were
poor in predicting the treatment outcome (with r2 of 19.8 and 20.5 respectively). TTC concentrations
were reduced to less than 1000 CFU /g TS (legislative proposal 2010) for all treatments with urea
except 0.5% urea treatment in 28°C. Control treatments (no urea added) at 41°C and above did also
reach this threshold. Less than 100 CFU /g ww (legislative proposal 2013) was reached for all
treatments with urea except with 0.5 and 1.0% urea treatment in 28°C as did controls (no added urea-
N) at 41°C and above (Table 7). The initial concentration in most sludge from Kungsängen was too
low to confirm the 5 log 10 reductions required for validation of treatments in the year 2013 proposal
(Figure 12). A mean log 10 reduction meeting this threshold was only reached for nine of the used
treatment combinations, mainly when using sludge form Bromma (Table 8).
The Bromma sludge reached a significantly higher mean log10 reduction (4.84) than the Kungsängen
sludge (2.96) (Figure 12). For 49 out of 60 (82%) the detection limit was reached after 1 weeks
treatment resulting in mainly censored values for the reduction. A positive effect of NH3-N
concentration on the log 10 reductions was only seen in the lower temperatures, 28.0 and 33.0°C
(Figure 12). These combinations were also the only ones where the level of reduction was detected for
all replicates. The control treatments at 38°C and above all resulted in a reduction beyond detection
limit. As shown in Figure 8, the NH3-N concentration in the three control treatments at 38°C and
above was not higher than NH3-N concentrations in the controls treatments of the two lower
temperatures. Due to problems detecting the reduction level, the real TTC reduction as a function of
temperature and NH3-N could not be properly modeled using this data.
26
treatment temp (C)
% added urea
44.0
41.5
38.0
33.0
28.0
1.5
1.0
0.5
0.0
1.5
1.0
0.5
0.0
1.5
1.0
0.5
0.0
1.5
1.0
0.5
0.0
1.5
1.0
0.5
0.0
7
6
5
4
3
2
1
0
4.5
2
2
1
2
2
1
2
2
1
2
2
1
2
2
1
2
2
1
2
2
1
2
2
1
2
2
1
2
2
1
2
2
1
2
2
1
2
2
1
2
2
1
2
2
1
2
2
1
2
2
1
22
1
2
2
12
21
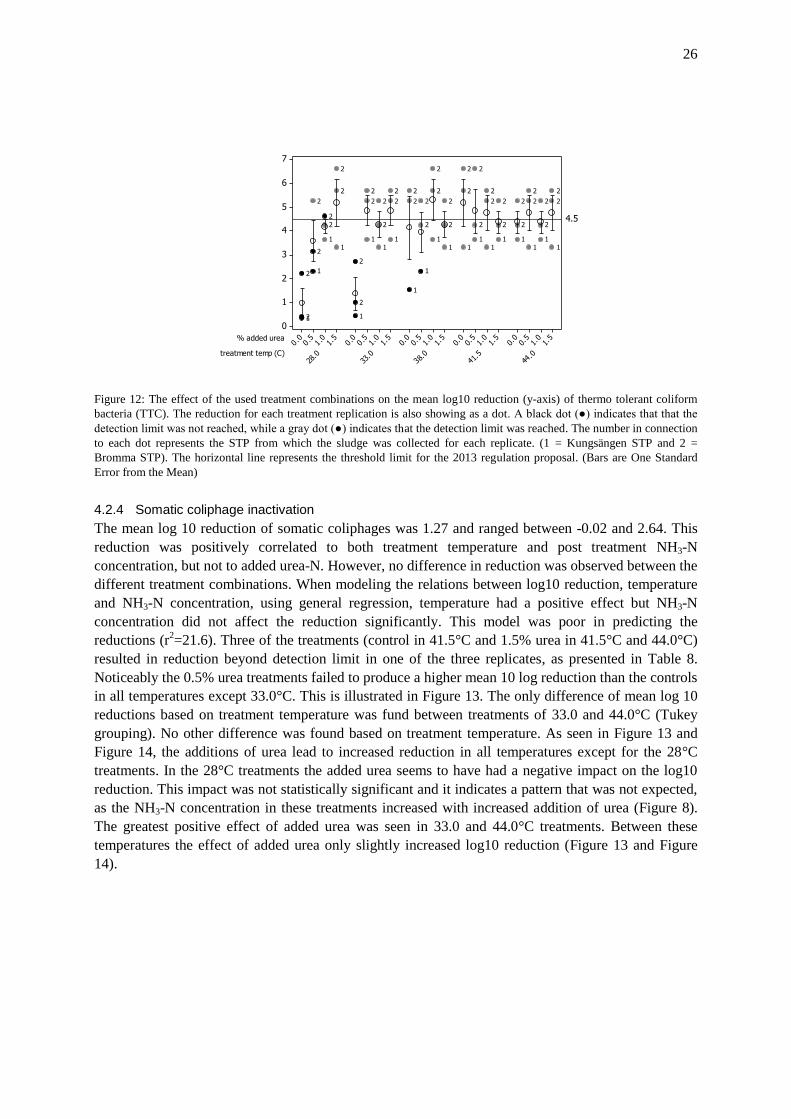
Figure 12: The effect of the used treatment combinations on the mean log10 reduction (y-axis) of thermo tolerant coliform
bacteria (TTC). The reduction for each treatment replication is also showing as a dot. A black dot (●) indicates that that the
detection limit was not reached, while a gray dot (●) indicates that the detection limit was reached. The number in connection
to each dot represents the STP from which the sludge was collected for each replicate. (1 = Kungsängen STP and 2 =
Bromma STP). The horizontal line represents the threshold limit for the 2013 regulation proposal. (Bars are One Standard
Error from the Mean)
4.2.4 Somatic coliphage inactivation
The mean log 10 reduction of somatic coliphages was 1.27 and ranged between -0.02 and 2.64. This
reduction was positively correlated to both treatment temperature and post treatment NH3-N
concentration, but not to added urea-N. However, no difference in reduction was observed between the
different treatment combinations. When modeling the relations between log10 reduction, temperature
and NH3-N concentration, using general regression, temperature had a positive effect but NH3-N
concentration did not affect the reduction significantly. This model was poor in predicting the
reductions (r2=21.6). Three of the treatments (control in 41.5°C and 1.5% urea in 41.5°C and 44.0°C)
resulted in reduction beyond detection limit in one of the three replicates, as presented in Table 8.
Noticeably the 0.5% urea treatments failed to produce a higher mean 10 log reduction than the controls
in all temperatures except 33.0°C. This is illustrated in Figure 13. The only difference of mean log 10
reductions based on treatment temperature was fund between treatments of 33.0 and 44.0°C (Tukey
grouping). No other difference was found based on treatment temperature. As seen in Figure 13 and
Figure 14, the additions of urea lead to increased reduction in all temperatures except for the 28°C
treatments. In the 28°C treatments the added urea seems to have had a negative impact on the log10
reduction. This impact was not statistically significant and it indicates a pattern that was not expected,
as the NH3-N concentration in these treatments increased with increased addition of urea (Figure 8).
The greatest positive effect of added urea was seen in 33.0 and 44.0°C treatments. Between these
temperatures the effect of added urea only slightly increased log10 reduction (Figure 13 and Figure
14).

27
treatment temp (C)
% added urea (ww)
44.0
41.5
38.0
33.0
28.0
1.5
1.0
0.5
0.0
1.5
1.0
0.5
0.0
1.5
1.0
0.5
0.0
1.5
1.0
0.5
0.0
1.5
1.0
0.5
0.0
2.5
2.0
1.5
1.0
0.5
0.0
Figure 13. The mean log 10 reductions of coliphages for each of the studied treatment. (Bars are One Standard Error from the
Mean)
543210
3.0
2.5
2.0
1.5
1.0
0.5
0.0
(mg/g ww)
28.0
33.0
38.0
41.5
44.0
inkubator
temp
Figure 14. Log 10 reductions of coliphages plotted against post treatment NH3-N concentrations, here plotted separately for
each of the used temperatures.
4.2.5 Salmonella spp. inactivation
Salmonella spp. presence was confirmed in post treatment sludge of two replicates from controls
treated at 28°C. All other treatments managed to reduce Salmonella spp. beyond detection level (>1
CFU /25g).

28
5 Discussion
5.1 Reduction
5.1.1 Enterococcus spp.
The positive impact of both temperature and NH3-N concentration on Enterococcus spp. 10log
reduction (as presented in Table 8 and figures 9, 10 and 11) was in accordance with previous results
(Ottoson et al., 2008, Allievi et al., 1994). However, the Enterococcus spp. log 10 reductions were
lower than the suggested by the D-values reported by Nordin et al. (2009) in comparable treatment
combinations. Reported D-value times for 34°C in the mentioned study were 4.7, 3.7, 2.6, and 2.1
days for 0.0, 0.5, 1.0, and 1.5% of added urea respectively. The corresponding treatment combinations
in the present study (33.0°C treatments) did not reach 1 log10 reduction for the control and the 0.5%
urea combinations. Only 1.0 and 1.5% urea treatments in this temperature reached 1 log10 reduction
(mean log10 reductions of 1.1 and 2.0 respectively). The previous study used non processed human
feces with added Enterococcus spp., differing from the sludge used in the present study in aspects of
TS and pH among others. As the sludge used in the present study had previously been through
mesophilic treatment, it is possible that weaker strains of Enterococcus spp. could already have been
inactivated. This would explain the difference in results from such similar treatment methods.
The effect from the added urea and subsequently the NH3-N concentration on log10 reduction was
most pronounced in the 38°C treatments. This is shown in Figure 9 and Figure 9 where the reduction
is almost 2 log10 higher for 1.0% urea than for 0.5% urea. The effect of urea and NH3-N concentration
at the higher temperatures could not be established since detection limit was reached at time for
sampling and the reduction level could not be determined. In the lower temperatures (28 and 33°C)
however, as seen in Figure 9 and Figure 10, the effect of added urea and increased NH3-N
concentration was not as great as in the 38°C treatments, still there was an effect. The effect on
inactivation from ammonia at 38°C, in comparison to the lower and higher temperatures, is further
confirmed in figure 11. In this figure the 38°C treatments show a greater response in log10 reduction
vs. added urea-N. Due to the rapid reduction in the higher temperatures, the effect of adding urea in
these temperatures was not verified (Figure 9). The relatively smaller effect of ammonia concentration
on reduction in the higher temperatures (41.5 and 44°C) can be partly explained by a relatively
efficient inactivation even using low ammonia concentrations. This in combination with reduction
beyond detection limit in the higher temperatures results in a less steep slope for this temperature in
Figure 10.
29
5.1.2 TTC
The observed positive effect on reduction based of added urea-N in the two lowest temperatures is a
pattern that would also be expected in higher temperatures. Because no TTC was found in most of the
sludge treated with the higher temperatures, it is difficult to draw conclusions regarding the differences
in efficiency of these individual treatment combinations. As seen in Figure 12 the addition of urea in
the three highest temperatures did not cause a higher reduction than the control treatment. This does
not mean that higher temperature treatments were not more efficient than the lower temperature
treatments, it simply reflects that TTC was completely reduced in many of these higher temperature
treatments. For the treatment time studied here (7 days) temperature alone above 38°C was sufficient
to reach the detection limit and thus
Due to the high efficiency of most of the treatment combinations using the higher temperatures, an
effect of temperature on the TTC log10 reduction was only observed in the lower temperatures, as
seen in Figure 12. The missing effect of increased additions of urea and temperature in the higher
temperatures is misleading and can be explained by the problems detecting levels of reduction. For
TTC in contrast to Enterococcus spp. the log10 reduction was mainly affected by added urea-N and
treatment temperature in combination. The results show that TTC reduction was affected more by
NH3-N concentration than by temperature. This differs from the results concluded by Mendez et al.
(2008) showing that temperature was the significant factor for fecal coliforms, and that NH3-N
concentration was not. The reduction of TTC differed depending on the STP from which the sludge
originated (Figure 12). This difference in reduction based on STP can be explained by the quality of
the initial sludge. Sludge from Bromma had a higher initial TTC concentration than Kungsängen
sludge. In the cases where the reduction level was not detected, meaning that no TTC was found after
treatment, the initial bacterial concentration was the limiting factor in deciding the treatment
efficiency. As the reduction cannot be larger than the initial concentration, a larger initial
concentration resulted in a larger reduction in these cases. The perceived reduction thus became
tainted by the initial concentration, a factor that itself varied between batches (Figure 4). Bromma had
a higher initial TTC concentration and as a result the efficiency in treatment of Bromma sludge seems
more efficient. The problems detecting the level of reduction in the higher temperatures and the
resulting lack of data makes it difficult to draw any conclusions for these treatments. The results for
log10 reduction of TTC in this study are not suitable to base conclusions regarding exact levels of
reduction to expect from the treatments. This is due to the problems determining the real reduction.
However, what the results do show is the level of reduction that at least can be reached using the
treatment combinations. The failure in detecting levels of reduction was partly caused by an
underestimation of the treatment efficiencies in reducing TTC. To examine if there is a difference in
reduction between the treatments using the higher spectrum of NH3-N concentrations and
temperatures, these combinations of could be studied using a shorter treatment period.
5.1.3 Somatic coliphages
The results showed that temperature was the most important factor to reduce the somatic coliphages in
this study. However, the different treatment combinations had no significant relevance to the resulting
reduction of coliphage and the resulting reductions did not differ significantly between the used
treatments. This result coincides with the results of (Emmoth et al., 2008, Emmoth et al., 2007), in
which increased NH3-N concentration had no effect on the reduction of somatic coliphages. In the
mentioned study, the treatment consisted in treating hatchery waste spiked with somatic coliphages
using temperatures of 14°C in combination with NH3-N concentrations in the range of 0.0 – 0.75%
30
(w/w). In the present study, treatments used higher temperature and NH3-N concentrations.
Consequently a greater reduction was achieved, as expected. Increasing the NH3-N concentration by
addition of urea-N cannot be motivated based on the present results. Increased NH3-N concentration
seemed, however, to have a slightly greater effect at temperatures of 33 and 44°C compared to the
other temperatures used (Figure 13 and Figure 14), motivating further investigation using these
specific temperatures. As these were the temperatures where the added urea had greatest effect, a
greater amount of added urea using the same temperatures may lead to a more distinct reduction. The
over-all results, considering all used temperatures, supports results from (Emmoth et al., 2008,
Emmoth et al., 2007) concluding that somatic coliphage seem resistant to ammonia treatment. As
illustrated in previous studies (Emmoth et al., 2008, Emmoth et al., 2007), and confirmed in this study,
somatic coliphages can be seen as a conservative indicator for virus inactivation. Thus, the reduction
of the complete sewage sludge viral flora cannot be directly interpolated from the results of this study.
None of the treatments in the present study were able to reduce the somatic coliphages to levels
complying with proposed thresholds for viruses. Furthermore, the concentration of somatic coliphages
in the initial sludge was lower than the log 10 reduction required in the proposed legislation.
Therefore, compliance with these proposals would have been impossible to prove, even at complete
reduction, using the sludge of this study.
5.1.4 Salmonella spp.
As Salmonella spp. was only found in the control after treatment in 28°C, the necessity of adding urea
as a mean of reducing Salmonella spp. in the higher temperatures is not considered necessary. With
the exception of the 28°C control treatment, all other treatments complied with the proposed accepted
reduction threshold value for 2010. Absence of Salmonella spp. per 50 g material, in accordance with
the 2013 proposal, could not be verified in this study since 25 g samples was used. Ammonia
treatment has previously been shown to reduce Salmonella spp. to the same degree as TTC (Mendez et
al., 2008) and to higher degree than (Nordin et al., 2009). This indicates that the reduction of
Salmonella spp. was more efficient than could be verified with the method used for analysis in the
present study.
5.1.5 Over-all compliance with proposed regulations
The treatment compliance with the threshold values differed between 2010 and 2013 legislative
proposals. The threshold concentrations of the 2010 proposal (Table 1) were met by five of the
treatments (15@38, 15@415, 05@44, 10@44 and 15@44) (Table 7). An insufficient observed
reduction of Enterococcus spp. was the main reason for the relatively low compliance to these
threshold values. However, as previously discussed, this observed reduction was misrepresentative due
to very efficient reduction in relation to the initial concentration.. The reduction of TTC and
Salmonella spp. complied with the 2010 proposed threshold to a higher degree. The threshold values
from the 2013 year proposal were not reached regarding the suggested 3 log10 reduction of viruses in
any of the treatments in this study, as shown in Table 7 and Table 8. However, the somatic coliphages
studied in the present work can be considered a conservative model for viruses. This means that that a
reduction in general viral flora is expected to be higher than the observed phage reduction in this
study. Additionally “parasites” was also a criteria in the 2013 proposal, but not included in this study,
restricting confirmation of over-all compliance to the suggested levels. The presence of Salmonella
spp. was studied per 25 g of sludge in comparison to in 50 g of sludge, as proposed in the 2013
proposal. Thus fulfillment of this criterion cannot be concluded for any of the treatments. When
excluding the criteria for virus reduction and Salmonella spp. absence, most treatment reached
compliance with the proposed thresholds (year 2013).

31
5.2 Treatment effect on sludge chemical properties Treatment temperature had no effect on pH, N-tot and TAN concentrations, as seen in Figure 5 a-c.
The concentrations of N-tot and TAN after treatment was higher than expected based on amount of
added urea (Figure 6). The unexpectedly high levels of post treatment TAN concentration could
possibly be explained by conversion of non-TAN N sources to TAN. Concerning N-tot however, the
unexpected increase could not be attributed to such conversions between different N-sources. An
alternative explanation is that water may have condensed on the cup walls. This would have increased
the sludge TS, and thus the sludge TAN and N-tot concentration. The adjustments made to the post
treatment N-tot and TAN concentrations (based on the calculated “natural” increase) resulted in values
much closer to expected (Figure 7). Although such an adjustment does not affect the measured post
treatment concentrations, it can be used as an indicator of the effect of the added urea. The deviation
between added with urea and measured post treatment TAN lead to the possibility to use either of
these factors when analyzing the reduction. As NH3-N is believed the most important factor for
inactivation, it is central to understand the effect added urea has on the final TAN, and thereby NH3-N,
concentration. Also, this deviation exposes the importance of calibrating the amount of urea needed
for any specific NH3-N concentration. As the NH3-N concentration (Figure 8) is calculated using the
measured TAN, understanding of this factor is important.
5.3 Initial sludge quality Mean sludge total solids (TS), as presented in the environmental reports for the two STPs 2013, was
34.2 and 26.3 for Bromma and Kungsängen respectively. The measured TS of Bromma sludge
matched the reported values well while Kungsängen sludge mean TS was lower than presented values.
This difference can be explained by the repair service of one centrifuge during sampling. The fraction
of TS can be seen as a degree of dilution of the non-water soluble components in the sludge. Meaning
that as water, and water soluble components, are extracted by the centrifuge dryer – the concentrations
of less, water soluble components becomes higher. Thus, a negative correlation between TS and water
soluble sludge components can be expected. The positive correlation between TS and bacteria
concentration can be explained by the above mentioned relationship. As bacteria is to a large degree
bound to particles, their concentration increased with increased TS.
The mean pH in the studied sludge was higher than reported by the both STPs, 8.1 and 7.8
respectively for Bromma and Kungsängen. Reported values were 7.5 and 7.4 respectively. When
looking at the different collection sites (centrifuge and silo) individually the batches collected in the
silo matched the reported pH, while the sludge from the centrifuge was higher in pH, pushing up the
mean. This indicates that the values in the environmental report could be based on samples collected
from the silo. The lower pH in the sludge collected in from the silo may be explained by leakage of
ammonia gas from the sludge when stored in the silo. As ammonia is a weak base, the loss of TAN in
the sludge would then cause a lower sludge pH, as seen in the results for batches collected from the
silo (Figure 1). As the pH is a factor involved in the regulation of NH3/NH4+ ratio, this is an important
factor to consider.
Mean N-tot, TAN and P-tot concentration (mg/g ww) in the sludge was considerably lower than the
reported values from both STPs. Reported values were slightly higher for Bromma sludge as
compared to Kungsängen. The measured concentrations of N-tot were 14.66 and 13.15 for Bromma
and Kungsängen respectively. Corresponding values for TAN were 3.43 and 2.89 and for P-tot 9.98
and 7.89 (Lindh, 2013, vatten, 2013). The big variations in the initial sludge batches between N-tot

32
and P-tot concentrations seemed too large to be caused by normal temporal variations in the sludge.
Instead, they may in part be explained by the sampling- and analysis method. The methods for N-tot
and P-tot analysis is originally intended for waste water, a homogenous solution, whereas the slurry
analyzed in this study was not homogenous but contained solid particles not evenly distributed. This
may have caused the relatively large variation between replicates from the same batch (Figure 2). The
method used for TAN analysis included a filtering phase, resulting in a homogenous solution for
analysis. This homogeneity is reflected by the smaller variation between the replicates of same batch
TAN samples (Figure 3). The deviation of the measured results and the results reported from the STPs
brings further suspicions over the reliability of the performed measurements. However, the increase in
TAN in the treatment samples corresponded well to the addition of urea-N, indicating that, at least,
TAN analysis was functioning as expected.
5.3.1 Recommendations
One problem during this study had to do with detecting the treatment reduction level, especially for
TTC. As a result, no substantial relationship could be established between treatment factors and TTC
reduction. To avoid such problems, proper planning and continuous adjustments between treatment
replicates should be performed. Future studies using similar treatment combinations should pay close,
continuous, attention to dilution series and the duration of the treatments. Both of these factors are
important to optimize treatments to achieve that reductions of organisms does not reach beyond the
detection limit.
33
6 Conclusions
The observed increase of sludge mean TAN concentration was greater than added urea-N. An increase
of TAN in control treatments, where no urea was added, suggests that there was a “natural” convesion
between the sludge nitrogen fractions during treatment. This is an important factor to consider, as the
concentration of NH3-N (the bactericidal and virucidal component) is directly dependent on the TAN
concentration. The first null hypothesis – that that an addition of urea-N leads to an increase of TAN
concentration corresponding to the amount of added urea-N – can be rejected, as the increase of TAN
was greater than the added urea-N.
A general conclusion regarding the effect of added urea-N and temperature on reduction of the studied
organisms could not be made based on the obtained results. Added urea-N did not correlate with 10
log reduction of any of the studied organisms. The lack of correlation between reductions and added
urea-N may be explained by the discrepancy between measured increase of TAN concentration and
the added urea-N. Treatment temperature correlated with 10 log reduction of Enterococcus spp. and
somatic coliphages. Due to the fast inactivation of TTC in relation to the treatment time temperature
alone at temperatures of 38 and above resulted in end concentrations below the detection limit, so did
urea addition at all temperature. A correlation between 10 log reduction of TTC and temperature
could not be confirmed in this study. This lack of correlation is not credible and does not correspond
well to results from previous studies. The cause of this dissonance is probably related to the problems
finding the real level of reduction of TTC and should be seen as a reflection of the high treatment
efficiencies. The treatment period was too long to observe the expected correlation; a shorter treatment
period could most likely be used to observe such a correlation. The second null hypothesis cannot be
rejected.
The NH3-N concentration, calculated using equation 1 and 2 combining treatment temperature and
measured post treatment TAN concentrations, was the most suitable predictor for 10 log reduction of
the organisms in this study. It correlated positively to 10 log reductions of all of the studied organisms
except Salmonella spp.. Thus, the third null hypothesis can be rejected. The observed disagreement
between added urea-N and measured increase of TAN underlines the importance understanding the
flows of nitrogen between different fractions in the sludge during treatment. Finding the factors
controlling these internal flows during treatment may be important in development of an efficient
process of treatment.
The treatments used in this study were insufficient in reaching some of the proposed future threshold
levels of reduction. Compliance to the legislative proposal from year 2010 was reached using five of
the treatments in the higher range of temperature and added urea. The thresholds of the 2013 year
proposal could not be met by the treatments in this study. The fourth null hypothesis can be rejected.

34
7 Acknowledgements
I want to thank many people for outstanding support and patience. I am extra thankful to my
Supervisor Annika Nordin and Examiner Anna Mårtensson. I also want to thank all people from the
lab that helped me with invaluable advice (Cecilia, Jörgen, Modibo among others). I also thank my
family and friends, especially my beautiful wife and daughter.
35
8 References Allievi, L., Colombi, A., Calcaterra, E. & Ferrari, A. 1994. Inactivation of fecal bacteria in sewage-
sludge by alkaline treatment. Bioresource Technology, 49, 25-30.
Arthurson, V. 2008. Proper sanitization of sewage sludge: A critical issue for a sustainable society.
Applied and Environmental Microbiology, 74, 5267-5275.
Ashbolt, N. J., Grabow, W. & Snozzi, M. 2001. Indicators of microbial water quality. In: Bartram, F.
L. (ed.) Water quality: guidelines, standards and health. London: IWA Publishing.
Booth, I. R., Krulwich, T. A., Padan, E., Stock, J. B., Cook, G. M., Skulachev, V., Bennett, G. N.,
Epstein, W., Slonczewski, J. L., Rowbury, R. J., Matin, A., Foster, J. W., Poole, R. K., Konings, W.
N., Schafer, G. & Dimroth, P. 1999. The regulation of intracellular pH in bacteria, Chichester, John
Wiley & Sons Ltd.
Bouki, C., Venieri, D. & Diamadopoulos, E. 2013. Detection and fate of antibiotic resistant bacteria
in wastewater treatment plants: A review. Ecotoxicology and Environmental Safety, 91, 1-9.
Bujoczek, G. 2001. Influence of ammonia and other abiotic factors on microbial activity and
pathogen inactivation during processing of high-solid residues. Ph.D Dissertation, University of
Manitoba, Winnipeg, MB, Canada.
Djodjic, F. 2001. Displacement of phosphorus in structured soils. Acta Universitatis Agriculturae
Sueciae - Agraria, 283.
Dudley, D. J., Guentzel, M. N., Ibarra, M. J., Moore, B. E. & Sagik, B. P. 1980. Enumeration of
potentially pathogenic bacteria from sewage sludges. Applied and Environmental Microbiology, 39,
118-126.
Dumontet, S., Scopa, A., Kerje, S. & Krovacek, K. 2001. The importance of pathogenic organisms in
sewage and sewage sludge. Journal of the Air & Waste Management Association, 51, 13.
Emerson, K., Russo, R. C., Lund, R. E. & Thurston, R. V. 1975. Aqueous ammonia equilibrium
calculations - Effect of pH and temperature. Journal of the Fisheries Research Board of Canada, 32,
2379-2383.
Emmoth, E., Vinneras, B., Ottoson, J., Albihn, A. & Belak, S. 2007. Ammonia treatment of hatchery
waste for elimination of avian influenza virus. In: Aland, A. (ed.) Animal health, animal welfare and
36
biosecurity. Proceedings of 13th International Congress in Animal Hygiene, Tartu, Estonia, 17-21
June, 2007. volume 1.
Emmoth, E., Vinnerås, B., Ottoson, J., Albihn, A. & Belák, S. 2008. Ammonia treatment of hatchery
waste for elimination of avian flu and model viruses: treatment recommendations. Ramiran 2008,
13th International Conference of the FAO ESCORENA Network on Recycling of Agricultural,
Municipal and Industrial Residues in Agriculture
Feng, P. 2012. Big bug book; Handbook of Foodborne Pathogenic Microorganisms and Natural
Toxins. In: Lampel, K. A. (ed.) Second ed.: Center for Food Safety and Applied Nutrition (CFSAN)
of the Food and Drug Administration (FDA), U.S. Department of Health and Human Services.
Hammack, T. 2012. Big bug book; Handbook of Foodborne Pathogenic Microorganisms and Natural
Toxins. In: Lampel, K. A. (ed.) Second ed.: Center for Food Safety and Applied Nutrition (CFSAN)
of the Food and Drug Administration (FDA), U.S. Department of Health and Human Services.
Joshua, W. D., Michalk, D. L., Curtis, I. H., Salt, M. & Osborne, G. J. 1998. The potential for
contamination of soil and surface waters from sewage sludge (biosolids) in a sheep grazing study,
Australia. Geoderma, 84, 135-156.
Khaleel, R., Reddy, K. R. & Overcash, M. R. 1981. Changes in Soil Physical Properties Due to
Organic Waste Applications: A Review1. Journal of Environmental Quality, 10, 133-141.
Kowal, N. E. 1985. Health Effects of Land Application of Municipal Sludge. U.S. Environmental
Protection Agency, . Cincinnati, Ohio - USA.
Linderholm, K. 2011. Fosfor och dess växttillgänglighet i slam – en litteraturstudie. Svenskt Vatten
Utveckling Rapport 2011.
Lindh, G. 2013. Miljörapport 2013 Stockholm Vatten. Stockholm vatten VA AB.
Mendez, J. M., Gonzalez, C., Alvarado-Lassman, A., Alvarado-Kinnell, G. & Martinez-Delgadillo,
S. 2008. Fecal bacteria survival in ammonia-treated wastewater dewatered sludges. Revista
Mexicana De Ingenieria Quimica, 7, 229-235.
Nardi, S., Pizzeghello, D., Muscolo, A. & Vianello, A. 2002. Physiological effects of humic
substances on higher plants. Soil Biology & Biochemistry, 34, 1527-1536.
Naturvårdsverket 2010. Redovisning av regeringsuppdrag 21 - Uppdatering av aktionsplan för
återföring av fosfor ur avlopp (Rapport 5214). Stockholm. [Online]. Available:
http://www.naturvardsverket.se/Nerladdningssida/?fileType=pdf&downloadUrl=/upload/stod-i-
miljoarbetet/vagledning/avloppsslam/uppdat-aktionsplan-aterforing-fosfor-avlopp.pdf. [Accessed
12/12-2014 2014].
Nordin, A. 2010. Ammonia sanitisation of human excreta. Acta Universitatis Agriculturae Sueciae -
Agraria, 2010:67.

37
Nordin, A., Ottoson, J. R. & Vinneras, B. 2009. Sanitation of faeces from source-separating dry
toilets using urea. Journal of Applied Microbiology, 107, 1579-1587.
Olofsson, U., Bignert, A. & Haglund, P. 2012. Time-trends of metals and organic contaminants in
sewage sludge. Water Research, 46, 4841-4851.
Ottoson, J., Nordin, A., von Rosen, D. & Vinneras, B. 2008. Salmonella reduction in manure by the
addition of urea and ammonia. Bioresource Technology, 99, 1610-1615.
Pascual, J. A., Moreno, J. L., Hernandez, T. & Garcia, C. 2002. Persistence of immobilised and total
urease and phosphatase activities in a soil amended with organic wastes. Bioresource Technology,
82, 73-78.
SCB 2012. Discharges to water and sewage sludge production in 2010 - Municipal wastewater
treatment plants, pulp and paper industry and other industry. Statistiska medelanden MI 22 SM 1201.
SCB 2014a. Yearbook of agricultural statistics 2014 including food statistics. Yearbook of
Agricultural Statistics. Örebro.
SCB. 2014b. Näringsbalansen i jordbruksmark efter region, växtnäringsämne och källa. År 2007 -
2011[Online].available:http://www.statistikdatabasen.scb.se/pxweb/sv/ssd/START__MI__MI1004/
Naringsbalanser2/?rxid=670ac592-3f62-4ec4-9fa0-3458a82e8fca# [Accessed 12/12-2014 2014].
SCB. 2014c. Användning av kväve (N) och fosfor (P) från stall- och mineralgödsel 2012/13 [Online].
Available: http://www.scb.se/sv_/Hitta-statistik/Statistik-efter-amne/Miljo/Godselmedel-och-
kalk/Godselmedel-och-odlingsatgarder-i-jordbruket/21236/21243/21273/ [Accessed 12/12-2014
2014].
SCB 2014d. Discharges to water and sewage sludge production in 2012 - Municipal wastewater
treatment plants, pulp and paper industry and other industry. Statistiska medelanden MI 22 SM 1401.
Sims, J. T. & Sharpley, A. N. 2005. Phosphorus: agriculture and the environment, Madison, WI,
American Society of Agronomy - Crop Science Society of America - Soil Science Society of
America.
Six, J., Elliott, E. T. & Paustian, K. 2000. Soil structure and soil organic matter: II. A normalized
stability index and the effect of mineralogy. Soil Science Society of America Journal, 64, 1042-1049.
Sorme, L. & Lagerkvist, R. 2002. Sources of heavy metals in urban wastewater in Stockholm.
Science of the Total Environment, 298, 131-145.
Turner, B. L., Frossard, E. & Baldwin, D. S. 2005. Organic phosphorus in the environment,
Wallingford, UK, CABI Pub.
Walter, A. & Gutknecht, J. 1986. Permeability of small nonelectrolytes through lipid bilayer-
membranes. Journal of Membrane Biology, 90, 207-217.

38
Ward, R. L. 1978. Mechanism of poliovirus inactivation by ammonia. Journal of Virology, 26, 299-
305.
Ward, R. L. & Ashley, C. S. 1977. Identification of virucidal agent in wastewater-sludge. Applied
and Environmental Microbiology, 33, 860-864.
vatten, m. u. 2013.
Vatten, S. Bromma Avloppsreningsverk - För stockholmarnas och miljöns bästa. Stockholm:
Stockholm Vatten AB.
Vinnerås, B. 2013. Hygieniseringsteknik för säker återföring av fosfor i kretsloppet. Available:
http://www.naturvardsverket.se/Nerladdningssida/?fileType=pdf&downloadUrl=/upload/miljoarbete
-i-samhallet/miljoarbete-i-
sverige/regeringsuppdrag/2013/fosfor/underlagsrapporter/hygieniseringsteknik-aterforing-fosfor-
2013.pdf. [Accessed 2013-05-08].
Zhang, G. 2012. Big bug book; Handbook of Foodborne Pathogenic Microorganisms and Natural
Toxins. In: Lampel, K. A. (ed.) second ed.

39
9 Appendix
9.1 Populärvetenskaplig sammanfattning När vi äter mat så är det dels för att få energi och dels för att få i oss näring. Maten vi äter innehåller
många näringsämnen som vi måste få i oss för att kunna överleva. När barn och fram till att vi är
fullvuxna går en del av näringsämnen åt som byggstenar för vår kropp. Efter tillväxtfasen i början av
livet infinner sig en balans av den mängd näringsämnen som vi tar in (som mat och dryck) och den
mängd som lämnar oss (som kiss och bajs).
Samma näringsämnen som är livsviktiga för oss är också livsviktiga för andra djur, men även för
växter. Till exempel har de växter som vi äter mycket av – så som vete och ris – behov av samma
näringsämnen som vi människor. Till stor del används idag mineralgödsel för att växterna vi odlar ska
få sina näringsbehov uppfyllda. Detta är till viss del problematiskt, dels eftersom vissa av
näringsämnena är ändliga, och dels för att det krävs energi för att utvinna och förädla näringsämnen
för användning som gödselmedel. En större återanvändning av den näringen vi får i oss skulle kunna
leda till en mer cyklisk växtnäringsförsörjning. Detta skulle innebära ett mer hållbart system för
användande av växtnäring där andelen mineralgödsel som används inom jordbruket minskas till fördel
för användning av avloppsslam.
Det finns dock risker med användning av slam i jordbruket. Tungmetaller, organiska föroreningar och
sjukdomsframkallande mikroorganismer är de tre huvudsakliga riskerna med slamanvändningen. För
att slam ska kunna användas på mark där foder och livsmedel odlas måste dessa risker minimeras.
Denna studie har undersökt möjligheterna att reducera olika oönskade bakterier som finns i det slam
som produceras när vårt avloppsvatten renas. I studien gjordes försök där slam blandades med olika
tillsatser av urea och fick stå i olika temperaturer. Tanken var att testa hur detta påverkar avdödningen
av oönskade organismer. Eftersom att urea innehåller kväve, ett viktigt näringsämne inom
växtproduktion, så kan man säga att slammets växtnäringsvärde ökar när urea tillsätts. Totalt testades
20 olika behandlingar som kombinerade olika urea-tillsatser och temperaturer. Varje behandling
pågick i sju dagar och därefter studerades behandlingarnas effekt på olika bakterier och virus. Dels
analyserades vilka faktorer som var viktiga för att döda de olika organismerna, och dels studerades
vilka olika behandlings-metoder som var bäst på att döda organismerna. För att veta om de olika
metoderna skulle kunna användas i verkligheten i framtiden så jämfördes de mot förslagna framtida
gränsvärden för hur mycket av dessa bakterier och virus som skulle kunna accepteras i slam för
användning i växtproduktion. Två föreslag fanns för reglering av olika organismers förekomst i
slammet, ett från 2010 och ett från 2013.

40
Det visade sig att hög temperatur gav ökad reducering av alla studerade bakterier och virus. Tillsats av
urea hade en positiv effekt på reducering av vissa bakterier (enterokocker och termotoleranta
koliformer (TTC)). De föreslagna gränsvärdena för enterokocker nåddes i fem av behandlingarna. För
TTC uppfylldes de föreslagna gränsvärdena med de flesta behandlingsmetoderna. Somatiska kolifager
reducerades inte till föreslagna gränsvärden med någon av de använda behandlingarna. Föreslagna
gränsvärden från 2010 uppfylldes med de flesta av studiens behandlingar. Gränsvärden från 2013 års
förslag, där andra organismer (än de som var med i denna studie) regleras, uppnåddes inte av någon av
de använda behandlingarna, och modellen för virus-inaktivering som använts i denna studie var
relativt konservativ.
Den effektiva reduktionen av de flesta av studerade bakterier och virus ledde slutsatsen att den
studerade metoden lämpar sig bra för rening av avloppsslam. Tas även det ökade gödselvärdet, som
skapas då kväve blandas i slammet, i åtanke verkar metoden lämpa sig speciellt bra för att skapa ett
kretsloppsbaserat gödselmedel för användning i jordbruket. Innan denna metod kan börja användas i
stor skala så behövs dock en fortsatt kalibrering av vilka temperaturer och tillsatser av urea som passar
bäst för att uppnå olika reduceringsgrader för specifika bakterier och virus. Resultatet av denna studie
kan förhoppningsvis komma till användning för att fullfölja ett sådant kalibreringsprojekt.

Sveriges Lantbruksuniversitet Institutionen för energi och teknik Box 7032 750 07 UPPSALA www.slu.se/energiochteknik
Swedish University of Agricultural Sciences Department of Energy and Technology P. O. Box 7032 SE-750 07 UPPSALA SWEDEN http://www.slu.se/en/departments/energy-technology/