poverty and universal access to tb care services improving availability of services: the example of...
TRANSCRIPT

Poverty and Universal Access
to TB Care Services
Improving Availability of Services:
The Example of Brazil
NTP Coordinator Dr. Draurio Barreira
Departamento de Vigilância Epidemiológica

Brazil
• 192.000.000 inhabitants (5th
world largest population)
• 27 States, 5562 municipalities
• TB incidence rate: 37.1 cases
per 100.000 inhabitants
• 72.000 TB cases per year
• 1.4% of TB-MDR
• Approximately 4.500 deaths per
year (1st cause of death among
AIDS patients)
• 18th highest country in burden of
TB
• 108th in TB incidence rate

Health System Organization
PRIMARY HEALTHCARE – Traditional Basic Unities and the Family Health Strategy (FHS)
SECONDARY HEALTHCARE – Reference Unities
TERTIARY HEALTHCARE - Hospitals, Maternities (emergency and research centers)
• 94% municipalities covered by FHS in 2009
• 49,7% population covered by FHS in 2009
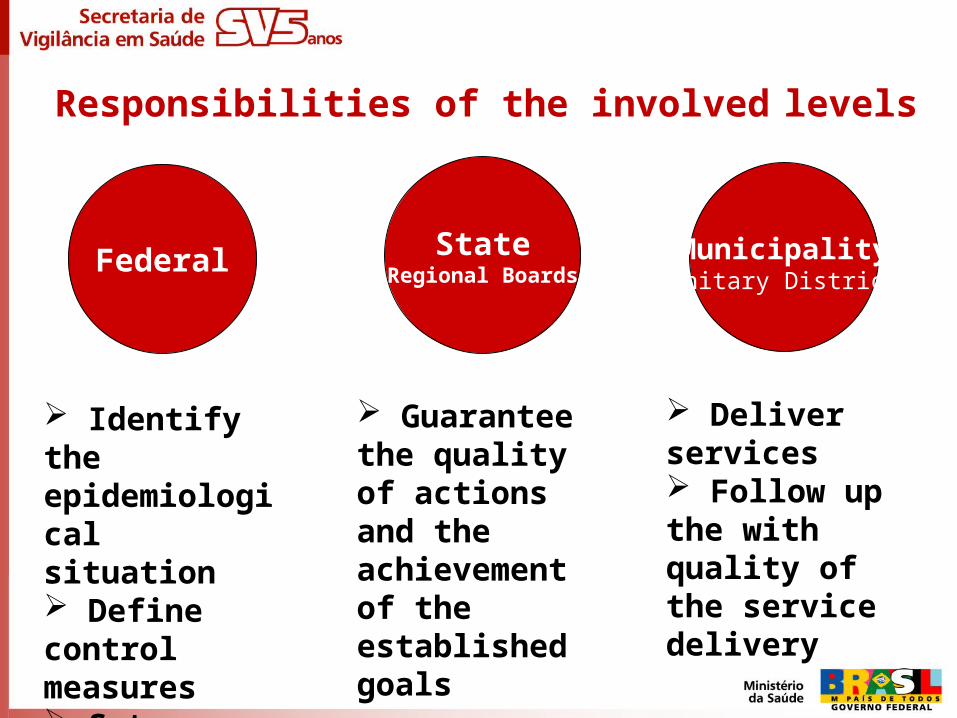
Responsibilities of the involved levels
Identify the epidemiological situation Define control measures Set political guidelines
Guarantee the quality of actions and the achievement of the established goals
Deliver services Follow up the with quality of the service delivery
Federal StateRegional Boards
MunicipalitySanitary Districts
Health context
TB is one of the 5 top priorities in public health for the Brazilian MoH
Brazilian Public Health Care System
• Unified and universal
• Primary, secondary, and tertiary healthcare is provided for all and
free of charge
• Approximately 25% of the population is covered also by health
insurance plans (National Agency of Supplemental Health)
• All this is determined by our Federal Constitution (article 196: “The
health is right of all and an obligation of the State, guaranteed by
social and economical politics that seek to the reduction of the risk
of disease and other offences and to the universal and
equalitarian access to the actions and services for promotion,
protection and recovery“)

0
10
20
30
40
50
60
70
80
2000 2001 2002 2003 2004 2005 2006 2007 2008 2009
Milh
õe
s
Available resources (in US$ millions) for TB in Brazil, from 2000 to 2009 (medicines included).
9.3 6.3 5.2
13.6
27.4 29.7
44.3
58.8
71.674.0
Fonte: MS / SVS / PNCT
Ano
US$
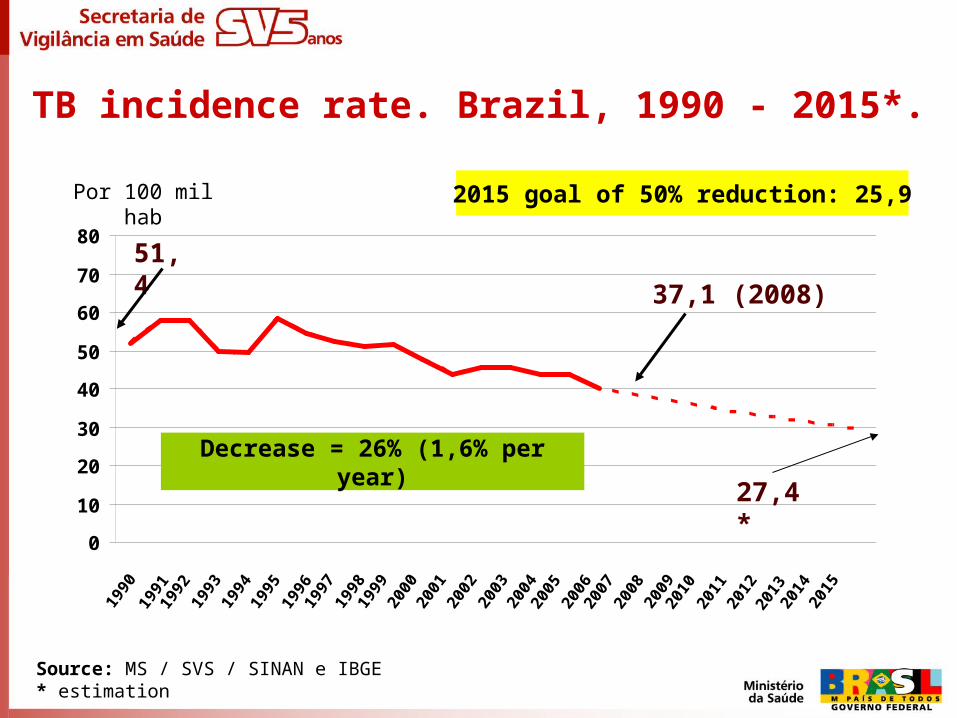
TB incidence rate. Brazil, 1990 - 2015*.
Source: MS / SVS / SINAN e IBGE* estimation
0
10
20
30
40
50
60
70
80
1990
1991
1992
1993
1994
2015
1995
2014
1997
1998
1999
2000
2001
1996
2002
2003
2004
2005
2010
2011
2012
2013
2006
2007
2008
2009
51,4
2015 goal of 50% reduction: 25,9Por 100 mil hab
37,1 (2008)
Decrease = 26% (1,6% per year)
27,4*

TB mortality rate. Brazil, from 1990 to 2015*.
Source: MS / SVS / SIM e IBGE* estimation
0
1
2
3
4
5
1990
1991
1992
1993
1994
2015
1995
2014
1997
1998
1999
2000
2001
1996
2002
2003
2004
2005
2010
2011
2012
2013
2006
2007
2008
2009
Óbitos por 100 mil hab
3,6
2,4
2015 goal 50% reduction: 1,8
1,5*Decrease= 32% (2% per year)

All forms of TB incidence rate.Brazil, 2008.
Brasil: 37,1/ 100.000 hab.
Fonte: MS / SVS / SINAN e IBGE* Casos por 100.000 habitantes.
30,33
40,88
68,93
28,34
43,05
36,69
13,82
33,84
27,92
42,60
31,10
27,68
47,69
37,25
28,76
37,65
22,89
38,08
66,56 37,45
23,87
27,26
42,14
37,50
36,28
13,82
13,88 Coef INC 2008
até 20,00
20,00 --| 37,10
37,10 --| 47,70
47,70 --| 68,93
Southeast: 39,6/100.000
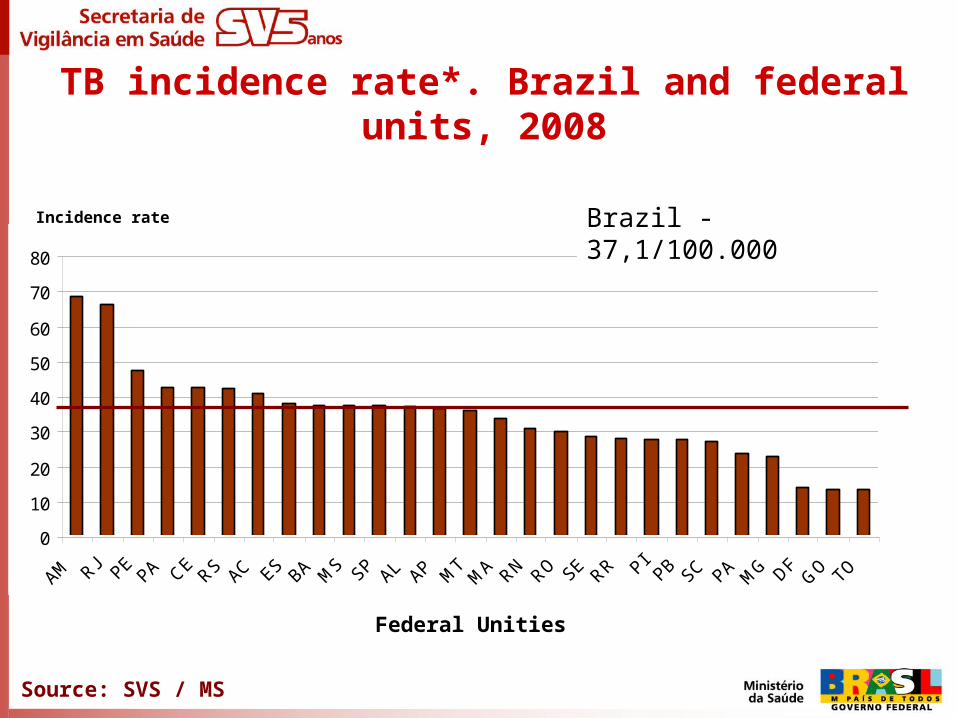
TB incidence rate*. Brazil and federal units, 2008
Federal Unities
Source: SVS / MS
0
10
20
30
40
50
60
70
80
AM RJ PEPA CE
RS AC ES BA MS SP AL AP M
TM
A RN RO SE RR PIPB SC PA M
G DFG
O TO
Brazil - 37,1/100.000 Incidence rate

0
20
40
60
80
100
120
Incidence rate
TB incidence rate*. Brazil city capitals, 2008.
Brazil city capitals - 58,4/100.000

TB mortality rate per State. Brazil, 2007.
• Brasil: 2,4/100.000 habitantes
Source: SIM – SVS - MSSource: SIM – SVS - MS
0,00
1,00
2,00
3,00
4,00
5,00
6,00
RJ PE AC BA CE MT AM AL MA PI RS PA RN SP MS ES PB AP SE RO MG TO PA GO SC DF RR
Brazil - 2,5/100.000

0,0
1,0
2,0
3,0
4,0
5,0
6,0
7,0
8,0
9,0
10,0
TB mortality rate in Brazil’s city capitals.
Brazil – 2007.
Source: SIM – SVS - MSSource: SIM – SVS - MS
Rate per 100.000Brazil city capitals - 3,5/100.000

TB P+ incidence rate, according to gender and age. Brazil, 2008.
0
20
40
60
80
100
< 14 15 - 24 25 - 34 35 - 44 45 - 54 55 - 64 > 65 Brasil
Homens Mulheres
SOURCE: MS/SVS/SINAN e IBGEUpdated data base: july/09
Por 100 mil hab.

Education percentage of TB identified cases. Brazil, 2008.
8,1
20,2
6,864,9
% Analfabeto
% E Médio
% E Sup
% E Fund.
Source: MS / SVS / SINAN – set_09

Education percentage of TB identified cases. Brazil, 2008.
8,1
20,2
6,864,9
% Analfabeto
% E Médio
% E Sup
% E Fund.
Source: MS / SVS / SINAN – set_09
73% have less than 8 years of study

Population according to race. New diagnosed TB cases percentage in 2008. Brazil, 2008
0,0
10,0
20,0
30,0
40,0
50,0
60,0
Branca Parda Preta Amarela IndigenaRaça
Pe
rce
ntu
al (
%)
CN TB 2008 IBGE 2006

• Indigenous peoples: 4 times
• Convicts: 25 times
• PLHA: 30 times
• Homeless: 60 times
Vulnerable Groups (in relation to the general population)

Advances

Advances
• Political commitment (budget, Mais Saúde, GF, etc.) • Strengthening partnerships (Brazilian Stop TB Partnership,
creation of metropolitan committees, NGOs forums, etc.)• Widening of the civil society participation and social control• Joint activities with Global Fund, National Program of Aids,
Department of Primary Health and other governmental institutions and non governmental organizations
• Contacts with National Council of State Health Secretaries and National Council of Municipal Health Secretaries and Health Councils at the three levels of the Public Administration
• Decentralization (FHS e Primary Health)continue...

• New National TB Guidelines• Change in the therapeutic scheme (adoption of four drugs,
FDC presentation)• Increase of counseling and testing for HIV and TB
chemoprophylaxis • DOT Expansion
Advances
