poverty measurement in ukraine: criteria, challenges, perspectives state statistics service of...
TRANSCRIPT

Poverty Measurement in Ukraine:Criteria, Challenges, Perspectives
State Statistics Service of Ukraine
Household Survey Department
Inna Ossipova, Director of Department Xenia Plisko, Deputy Director of Department
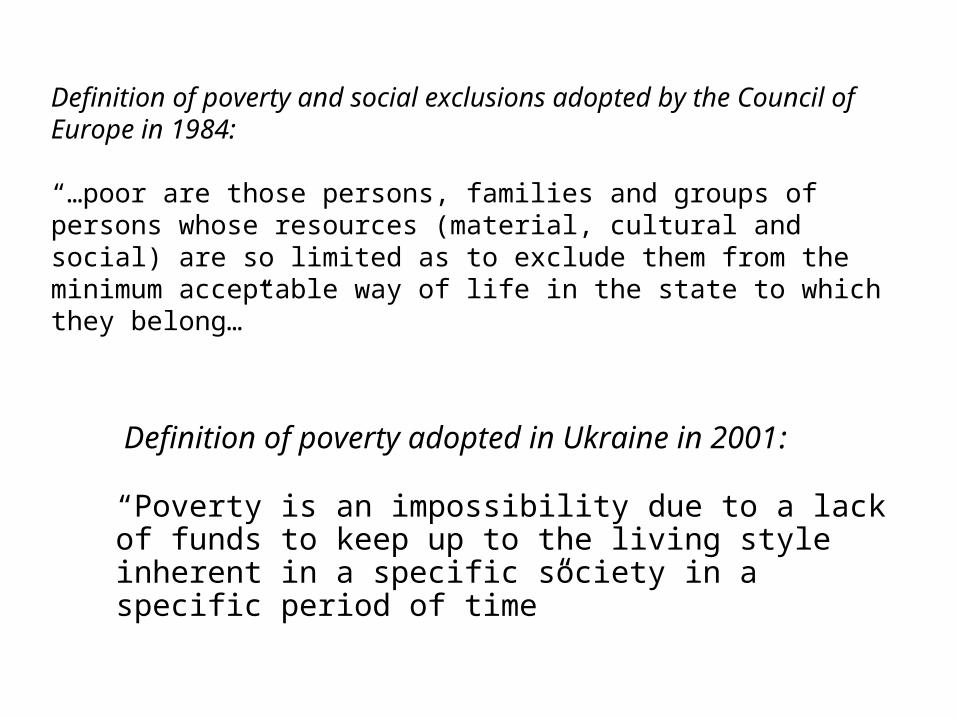
Definition of poverty and social exclusions adopted by the Council of Europe in 1984:
“…poor are those persons, families and groups of persons whose resources (material, cultural and social) are so limited as to exclude them from the minimum acceptable way of life in the state to which they belong…”
Definition of poverty adopted in Ukraine in 2001:
“Poverty is an impossibility due to a lack of funds to keep up to the living style inherent in a specific society in a specific period of time”

Approaches to defining poverty criteria
monetary non-monetary
relative absolute
income-based consumption-based
objective subjective
Most researchers recognize that a combined use of several different approaches is the most effective way to measure such a complex and multifaceted phenomenon as poverty.

Approaches to defining a poverty line for international comparisons
monetary – minimum funds required for survival, per day
consumption-based – minimum dietary energy intake or quantity of microelements in daily food consumption
structural – maximum percentage of household expenditures for food in the total household expenditures
relative criteria
deprivations
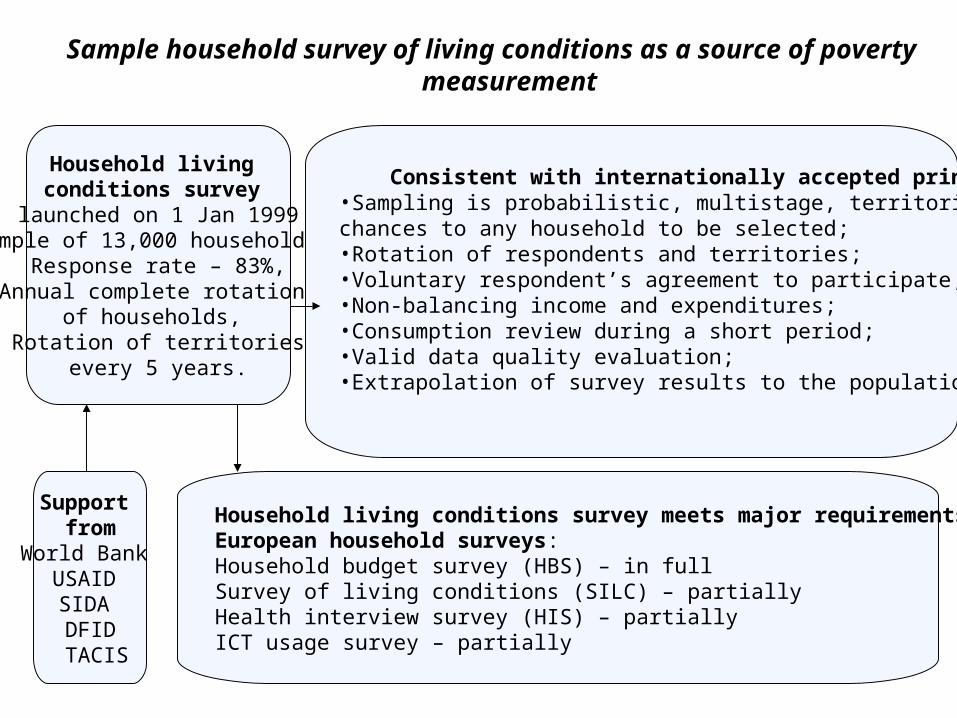
Sample household survey of living conditions as a source of poverty measurement
Household living conditions survey
launched on 1 Jan 1999Sample of 13,000 households,
Response rate – 83%,Annual complete rotation
of households, Rotation of territories
every 5 years.
Support from
World Bank USAID SIDA DFID
TACIS
Household living conditions survey meets major requirements of European household surveys:Household budget survey (HBS) – in fullSurvey of living conditions (SILC) – partiallyHealth interview survey (HIS) – partiallyICT usage survey – partially
Consistent with internationally accepted principles:•Sampling is probabilistic, multistage, territorial providing equal chances to any household to be selected;•Rotation of respondents and territories;•Voluntary respondent’s agreement to participate;•Non-balancing income and expenditures;•Consumption review during a short period;•Valid data quality evaluation;•Extrapolation of survey results to the population.

Information potential of a survey
- social-demographic characteristics of household members - expenditures and consumption - income and other resources, including those coming from subsidiary farming - housing conditions - availability of durable goods - evaluation of health conditions and access to medical goods and services - evaluation of well-being level and economic expectations - access to certain goods and services - access to information and communication technologies
The information potential of the survey, the availability of microdata and the inclusion of additional modules with sociology oriented questions help to measure poverty using all above criteria.
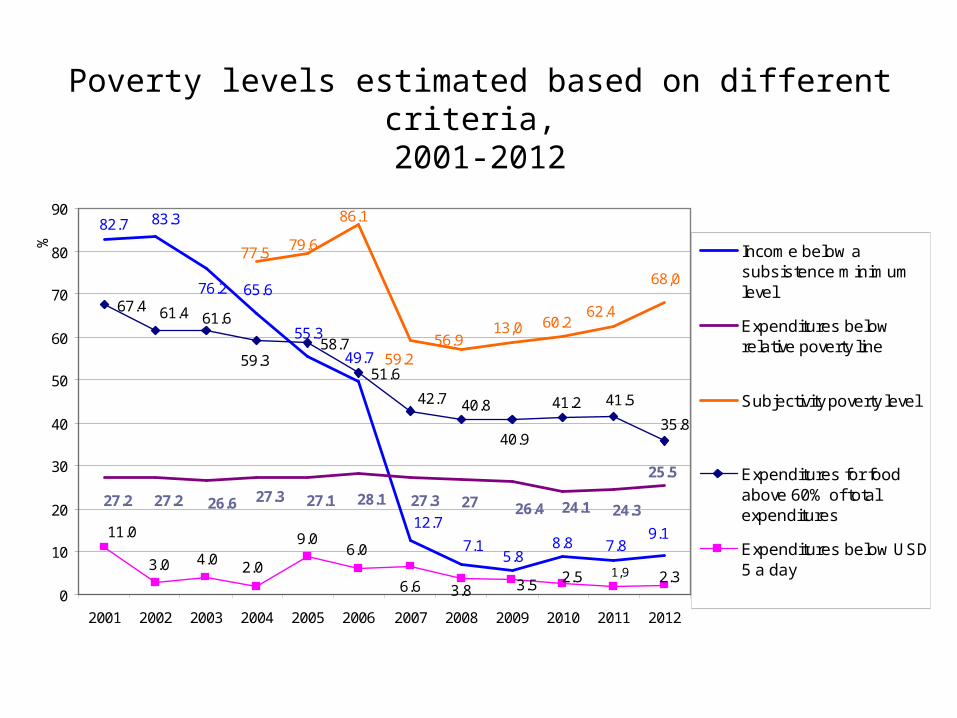
Poverty levels estimated based on different criteria, 2001-2012
65.6
55.3
49.7
67.4
58.7
51.6
12.79.1
82.7 83.3
76.2
7.15.8
8.8 7.8
25.5
27.2 27.2 26.6 27.3 27.1 28.1 27.3 27 26.4 24.1 24.3
68,0
62.460.213,0
56.959.2
86.1
79.677.5
35.8
41.541.2
40.9
40.842.7
59.3
61.661.4
2.31,92.53.53.86.6
6.09.0
2.04.03.0
11.0
0
10
20
30
40
50
60
70
80
90
2001 2002 2003 2004 2005 2006 2007 2008 2009 2010 2011 2012
% Income below asubsistence minimumlevel
Expenditures belowrelative poverty line
Subjectivity poverty level
Expenditures for foodabove 60% of totalexpenditures
Expenditures below USD5 a day

Poverty measurement in Ukraine In accordance with the National Social Poverty Reduction and Prevention Programme until 2015 the following criteria are used:- poverty line based on a relative threshold of 75% median equivalized total expenditures per capita;- extreme poverty line based on a relative threshold of 60% median equivalized total expenditures per capita;- absolute poverty line at the level of statutory subsistence minimum;- absolute poverty line for international comparisons determined by daily consumption value of USD 5 (PPP) per capita.
Indicators measured quarterly:Poverty level Poverty depth Aggregate income deficit of the poor Average income deficit of the poor Stratification indicators of the poor population (proportion of extremely poor among the poor, inequality index)
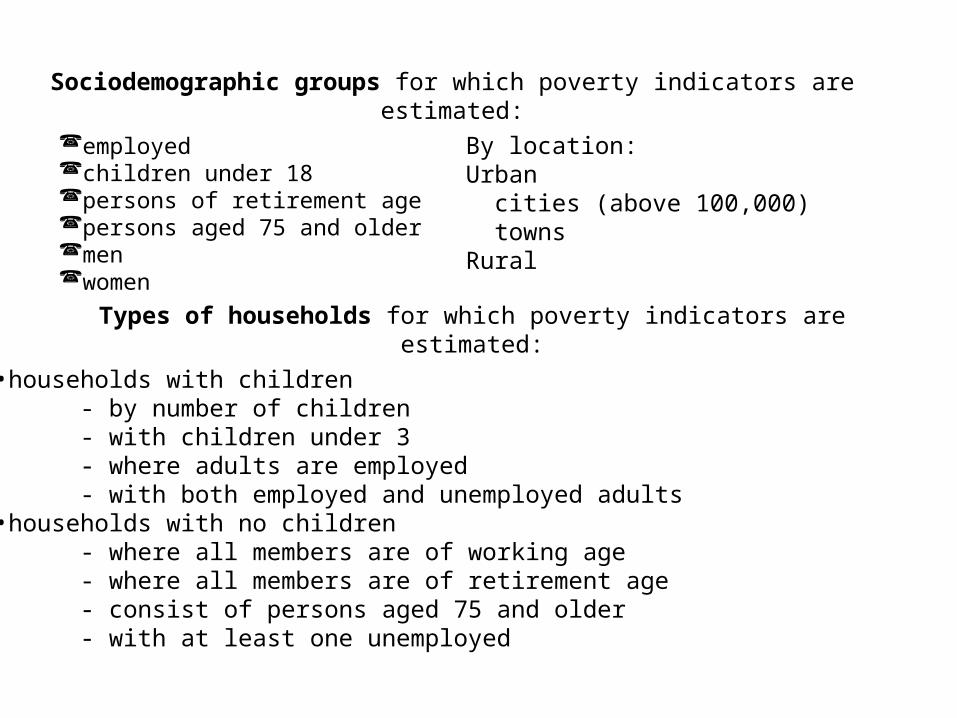
Sociodemographic groups for which poverty indicators are estimated:
employedchildren under 18persons of retirement agepersons aged 75 and oldermenwomen
Types of households for which poverty indicators are estimated:
•households with children - by number of children - with children under 3 - where adults are employed - with both employed and unemployed adults•households with no children - where all members are of working age - where all members are of retirement age - consist of persons aged 75 and older - with at least one unemployed
By location:Urban cities (above 100,000) townsRural

Poverty by deprivations: list of attributes
Limited economic opportunities (no funds): 1) to buy basic inexpensive foods;2) to buy, when necessary, new outerwear and footwear for cold seasons, once in
5 years for adults;3) to buy, when necessary, new clothes and footwear for children;4) to buy a a TV set;5) to buy a refrigerator;6) for major repairs of housing which is damp, slum, or old);7) for timely and full payment of bills for housing and necessary maintenance
services or payment for gas used for cooking;8) to improve housing (available housing floorspace does not exceed 5 sq.
meters per person); 9) to pay for required health services (excluding dentists) in a health care facility
(in case of no or difficult access to free services), tests, examinations and procedures prescribed by a doctor;
10) to pay for required drugs and medical supplies prescribed by a doctor;

List of attributes (cont.)
11) to pay for in-patient services without surgery (if such services are not provided for free) or vital surgery (excluding cosmetic surgery) and relevant in-patient treatment (if such services are not provided for free);
12) to get any professional education;
- limited possibilities related to infrastructural development as a criterion of geographical accessibility of services and non-geographical barriers:
13) lack of retail points of sale in the neighbourhood;14) lack of personal service providers in a settlement;15) lack of a health care facility, pharmacies in the neighbourhood; 16) lack of emergency ambulance services in a settlement;17) lack of child facilities in the neighbourhood;18) lack of regular daily transport links with another settlement with better
infrastructure.
Poverty level by deprivations represents a proportion of households in the distribution by the concentration of deprivation attributes; most closely it can be associated with the relative monetary poverty level. The category of the poor includes households that experience 4 or more attributes out of 18 deprivations.
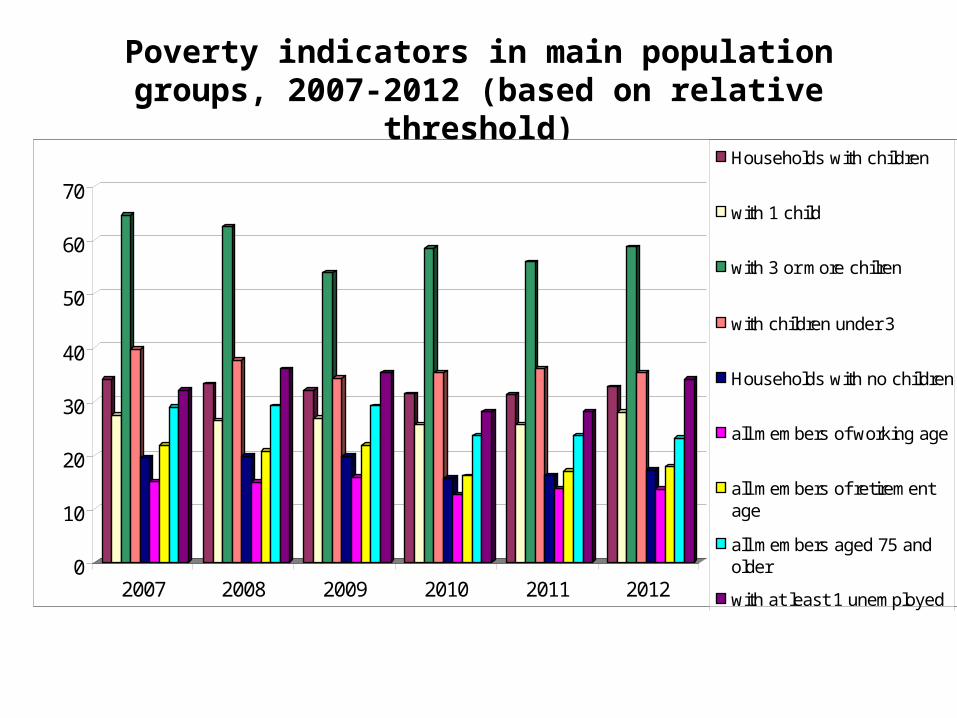
Poverty indicators in main population groups, 2007-2012 (based on relative threshold)
0
10
20
30
40
50
60
70
2007 2008 2009 2010 2011 2012
Households with children
with 1 child
with 3 or more chilren
with children under 3
Households with no children
all members of working age
all members of retirementage
all members aged 75 andolder
with at least 1 unemployed
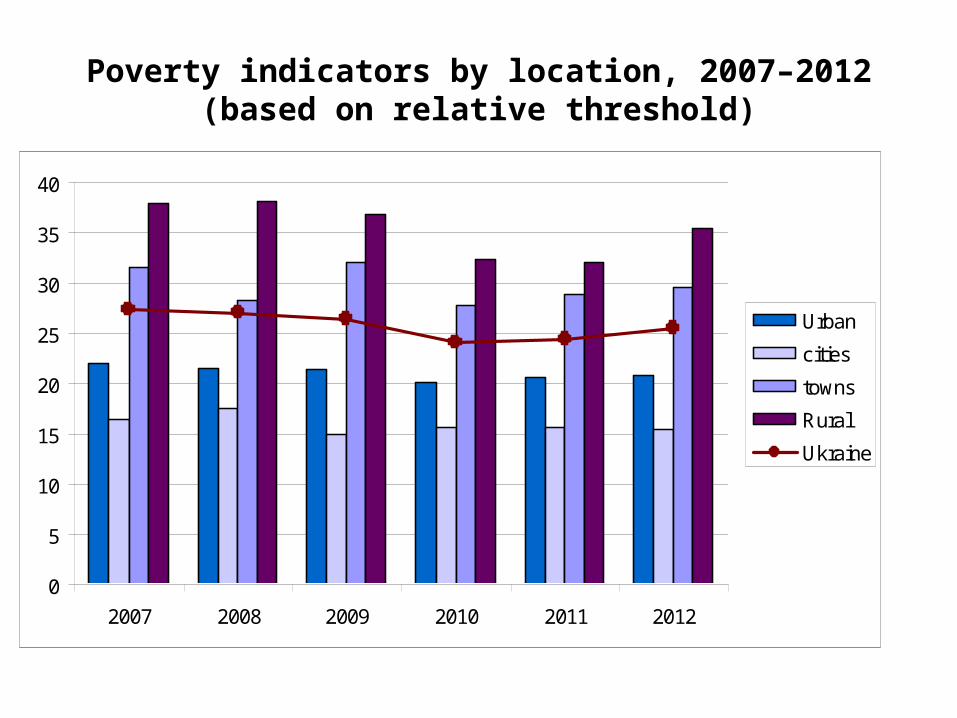
Poverty indicators by location, 2007–2012 (based on relative threshold)
0
5
10
15
20
25
30
35
40
2007 2008 2009 2010 2011 2012
Urban
cities
towns
Rural
Ukraine
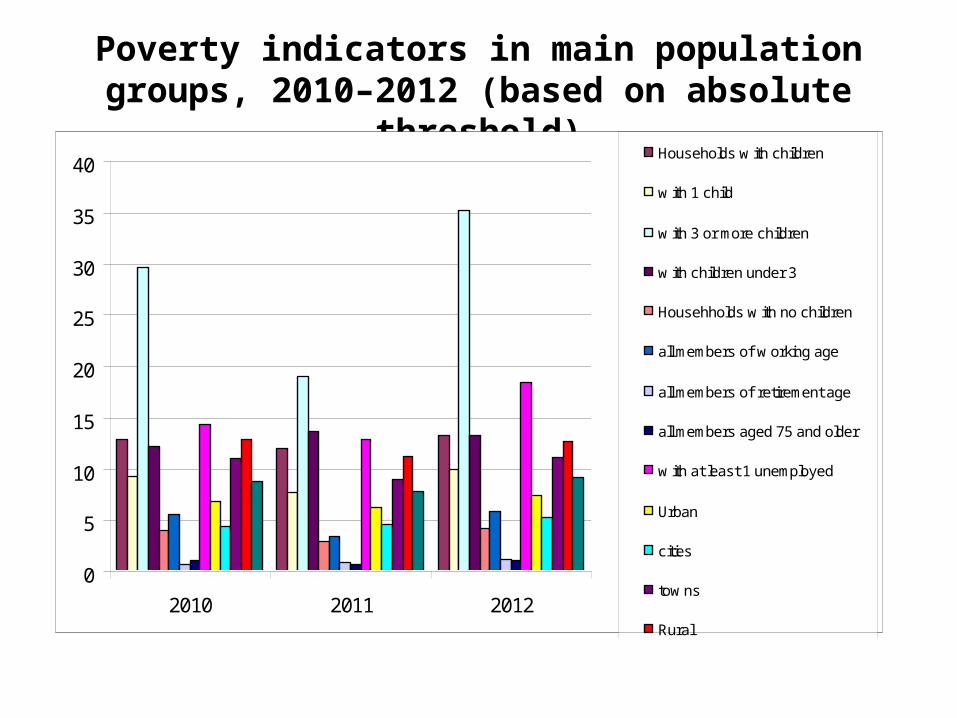
Poverty indicators in main population groups, 2010–2012 (based on absolute threshold)
0
5
10
15
20
25
30
35
40
2010 2011 2012
Households w ith children
w ith 1 child
w ith 3 or more children
w ith children under 3
Househholds w ith no children
all members of w orking age
all members of retirement age
all members aged 75 and older
w ith at least 1 unemployed
Urban
cities
tow ns
Rural
Ukraine

Poverty indicators 2007 2008 2009 2010 2011 2012
Poverty line based on relative threshold
526 778 835 944 1,062 1,125
Extreme poverty line based on relative threshold
420 622 668 755 850 900
Poverty level based on relative threshold, %
27.3 27.0 26.4 24.1 24.3 25.5
Extreme poverty level based on relative threshold, %
13.8 13.6 13.0 11.2 10.7 11.2
Poverty depth based on relative threshold, %
23.1 23.4 22.3 20.9 20.5 20.5
Subsistence minimum level, Hryvnia 518.5 607.5 638.5 843.2 914.1 1,042.4
Poverty level based on absolute threshold, %
12.7 7.1 5.8 8.8 7.8 9.1
Poverty level based on daily consumption of USD 5
6.6 3.8 3.5 2.5 1.9 2.3
Subjective poverty level 59.2 56.9 58.7 60.2 62.4 68.0
Poverty level by deprivations 28.6 Х 25.4 Х 25.5 Х
Expenditures for food exceeding 60% of total expenditures
42.7 40.8 40.9 41.2 41.5 35.8
Daily calorie intake below 2100 kcal 14.3 13.2 13.1 13.7 16.2 15.6

Poverty level based on the relative threshold is shown in yellow (24.3%).Poverty level by deprivation is shown in blue (25.5%).Poverty level based on the absolute threshold is shown in pink (7.8%).
6,0%
Poor based on relative threshold 11.7%
3/2%
0.4%
3.4%
0.8%
Poor based on absolute threshold
Poverty levels based on different criteria, 2011
Poor by deprivation 15.9%

• Monitoring framework was developed in pursuance of the Government Resolution
Concerning monitoring and performance evaluation of social assistance. • Fundamental methodological approaches were developed under the World Bank Project
“Social Assistance System Modernization”• The objective is to evaluate impact of social assistance programmes on the wellbeing of
specific groups of households and to measure social outcomes• The impact of social assistance programmes on poverty will be assessed through
analyzing changes in poverty levels• Two types of monitoring: ongoing (annual) and periodic (in-depth, once in 5 years)
Various data sources for monitoring: Administrative data Statistical monitoring Sample household living conditions survey Public opinion poll on effectiveness of social assistance programmes
A new opinion poll on effectiveness of social assistance programmes will be carried out in January 2014. The analysis of the poll results will be issued at the end of 2014.
Monitoring and performance evaluation of social assistance programmes
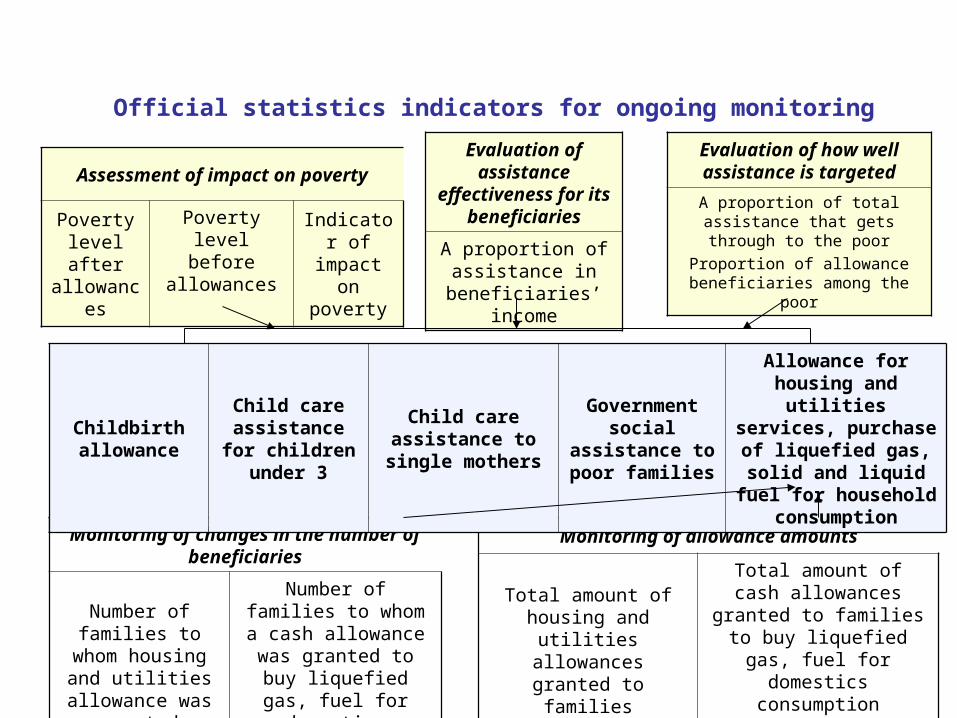
Monitoring of changes in the number of beneficiaries
Number of families to whom housing
and utilities allowance was
granted
Number of families to whom a cash allowance
was granted to buy liquefied gas, fuel for
domestics consumption
Monitoring of allowance amounts
Total amount of housing and utilities allowances
granted to families
Total amount of cash allowances granted to
families to buy liquefied gas, fuel for domestics
consumption
Childbirth allowance
Child care assistance for
children under 3
Child care assistance to single mothers
Government social assistance to poor families
Allowance for housing and utilities services, purchase of liquefied
gas, solid and liquid fuel for household consumption
Assessment of impact on poverty
Poverty level after allowances
Poverty level before
allowances
Indicator of impact on poverty
Evaluation of assistance
effectiveness for its beneficiaries
A proportion of assistance in
beneficiaries’ income
Evaluation of how well assistance is targeted
A proportion of total assistance that gets through to the poor
Proportion of allowance beneficiaries among the poor
Official statistics indicators for ongoing monitoring
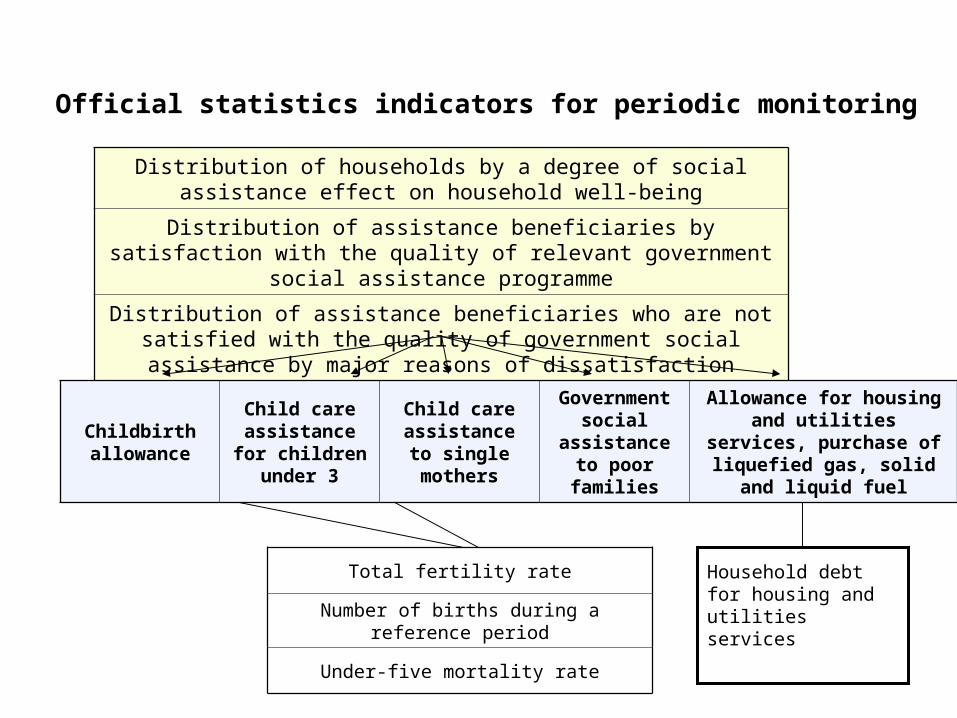
Official statistics indicators for periodic monitoring
Distribution of households by a degree of social assistance effect on household well-being
Distribution of assistance beneficiaries by satisfaction with the quality of relevant government social assistance programme
Distribution of assistance beneficiaries who are not satisfied with the quality of government social assistance by major reasons of dissatisfaction
Total fertility rate
Number of births during a reference period
Under-five mortality rate
Household debt for housing and utilities services
Childbirth allowance
Child care assistance for
children under 3
Child care assistance to
single mothers
Government social assistance to poor families
Allowance for housing and utilities services, purchase of liquefied gas, solid and liquid
fuel

Social assistance effectiveness indicators
Social assistance targeting evaluation
Proportion of actual assistance beneficiaries in a total number of eligible persons
Distribution of households by reasons due to which potential beneficiaries did not seek assistance
Proportion of households to whom assistance was not granted in the total number of those who requested such assistance, by reasons of refusal
Distribution of households by evaluation of changes in the social assistance system over the last 2 years
Distribution of households by the number of social assistance programmes in which they participate
Proportion of households who need but are not eligible for any assistance, by types of assistance

• The use of only one poverty measure does not allow adequately evaluating the
incidence and dynamics of this multidimensional phenomenon. The most effective way to look into poverty issues is to use a combination of various approaches to poverty measurement.
• The EU integration processes in Ukraine increase the need for activities aimed at the harmonization with the approaches used in the EU countries.
• Ukraine plans to enlarge the criteria used for poverty measurement based on living conditions (by deprivations), including those related to access to goods and services in health care and education.
• An important area in developing poverty statistics is to improve the reliability of poverty criteria through the use of indirect evaluation methods, including for small territories.
• In the nearest future Ukraine plans to assess the impact of targeted social assistance system on poverty.
• In the context of an increased interest of policy makers, other users and the public to the information on poverty incidence it is important to elaborate a unified approach (threshold) usable for international comparisons. Such threshold may vary for countries with different human development levels (an example is such a threshold as daily consumption below USD 5 per capita). At the same time, for the purposes of social and economic policymaking each country may apply national threshold framework for comprehensive poverty monitoring.
Summary and perspectives