powder diffraction application - ornl€¦ · powder diffraction applications. oak ridge national...
TRANSCRIPT

Ashfia HuqSpallation Neutron SourceNational School on Neutron and X-ray ScatteringOctober 2, 2008
Powder Diffraction Applications

OAK RIDGE NATIONAL LABORATORYU. S. DEPARTMENT OF ENERGY
Phase ID and Quantitative analysisStructure and transportNeutron Powder DiffractionCombine X-rays and NeutronsTime resolved in-situ studiesAb-initio structure solutionProteins and Powder Diffraction

Archeology and Powder Diffraction

OAK RIDGE NATIONAL LABORATORYU. S. DEPARTMENT OF ENERGY
4
Phase ID: “Finger Printing”Huq et.al. Appl. Phys. A 83, 253 (2006)
Natural antique colorants include red pigments such as cinnabar and ochre and pink pigments such as madder. These archaeological pigments have been used as ritual and cosmetic make-up and they are a material proof of handcraft activities and trade in the Mediterranean.
The pigments were discovered during different excavations in archaeological sites of Tunisia (Carthage, Kerkouane, Bekalta, Bouaaradaand elsewhere).

OAK RIDGE NATIONAL LABORATORYU. S. DEPARTMENT OF ENERGY
5
fit peak: searchdatabase for matches.
Look up structure.
Rietveld refinement.
For mixture quantitative phase analysis.

OAK RIDGE NATIONAL LABORATORYU. S. DEPARTMENT OF ENERGY
6
Conclusions
Ten punic make-up samples were studied with SR-XRD using a 2D CDD detector and high angular resolution powder diffraction. Four samples (B1, B2, B3 and FCC5) contain quartz and cinnabar while four other samples (B10, FCC4, FCC6 and OCRB) contain quartz and hematite. The presence of quartz is probably due to sand/clay from the excavation area.
These results are similar to what would be obtained from raw materials indicating that these eight samples were not subject to any preparation by the Carthaginians. These eight samples were used as ritual make-up. However, the last two samples (FCC2 and C41C) showed an amorphous background, their preparation required sophisticated techniques corresponding to cosmetic make-up; they contain purpurin as major pigment which is formulated in a similar fashion as a lacquer.

Superconductivity in Fullerenes and Scientific Ethics! (Publishing in high profile journal)

OAK RIDGE NATIONAL LABORATORYU. S. DEPARTMENT OF ENERGY
Buckminsterfullerene1985 : R.F Curt, H.W. Croto & R.E. Smalley discover C60. They areawarded the Nobel prize in Chemistry in 1996.
1990 : W. Kratchmer and D.R. Huffman produces isolable quantities of C60.
1991 : A group at AT&T Bell labs, finds superconductivity in alkali doped C60 with Tc=18K for K3C60. Later Tc=28K is observed for Rb3C60
Diameter of molecule 10Å. The atoms are positioned at the 60 vertices of a truncated icosahedron. 90 edges, 12
pentagons, 20 hexagons.

OAK RIDGE NATIONAL LABORATORYU. S. DEPARTMENT OF ENERGY
Alkali(K,Rb,Cs) doped C60
fcc C60(a=14.17Å) AC60(a=14.06-14.13Å) A in octahedral site
A3C60(a=14.24-14.44)A in both tetrahedral And octahedral site
A4C60 bct (Cs4C60 orthorhombic & orientationally ordered.) A6C60 bcc(a=11.39-11.84Å)
2/3 fillingbut a band insulator !

OAK RIDGE NATIONAL LABORATORYU. S. DEPARTMENT OF ENERGY
C60 base Superconductors:
)VN(E1exp1.13FB
logC k
ωT According to BCS theory
Increase in N(EF) => Increase in Tc
*Yildrim T et. al., 1995, Solid State Commun. 93 269-74
Changing the lattice parameter in Alkali doped fullerides, (either decreasing it with pressure or increasing it by substitution of a larger cation) increases the DOS N(EF).
Interesting new superconductors,FET of organic materials (anthracine, pentacene, tetracene C60. Record Tc=117K
for C60 / CHBr3. (Tc=80K for C60 / CHCl3)J.H. Schön, Ch. Kloc, B. Battlogg, Science293, 2432-4 (2001).

OAK RIDGE NATIONAL LABORATORYU. S. DEPARTMENT OF ENERGY
What happens to the crystal structure as we decrease T ?
Hexagonal
Heating-cooling cycles showed pronounced hysteresis and co-existence of the different phases over a large temperature range.
Monoclinic
Triclinic

OAK RIDGE NATIONAL LABORATORYU. S. DEPARTMENT OF ENERGY
C60 · 2CHCl3 at room temp.Hexagonal, a = 10.096, c = 10.101Å

OAK RIDGE NATIONAL LABORATORYU. S. DEPARTMENT OF ENERGY
C60 · 2CHCl3 at 170Kmonoclinic(16.821Å, 10.330Å, 10.159Å, 102.051°)

OAK RIDGE NATIONAL LABORATORYU. S. DEPARTMENT OF ENERGY
C60 · 2CHCl3 at 50K(9.836Å, 10.091Å, 9.818Å, 101.36°, 116.46°, 79.78°)

OAK RIDGE NATIONAL LABORATORYU. S. DEPARTMENT OF ENERGY
The crystal structure of C60 intercalated with CHCl3/CHBr3 is not fcc but hcp. More over when it is cooled it undergoes a phase transition and at ~150K they are converted into a fully order triclinic phase.
10.0135214.16,
(14.04)
Fm3m, (Pa-3)
C60
117
80
28 (e-)
18 (e-)
Tc
10.21110.211,
10.216
P 6/mmmC60.2CHBr3
10.0910.09,
10.095
P 6/mmmC60.2CHCl3
10.21114.44Fm3mRb3C60
10.06914.24Fm3mK3C60
dnnLattice Sp Group
12.781-110
12.6165011
10.348101
10.091010
9.8361100
9.8179001
dnn (Å)along
C60.2CHCl3 (P –1)

OAK RIDGE NATIONAL LABORATORYU. S. DEPARTMENT OF ENERGY
Interfullerene distances
C60 · 2CHCl3In plane:9.82, 9.84, 10.35Between plane: 10.09
C60 · 2CHBr3In plane:9.90, 9.90, 10.50Between plane: 10.34
cf. C60: 9.93 (5K)K3C60: 10.07
Conclude: Strong increase of Tc from intercalations is not just an effect of simple lattice expansion.

OAK RIDGE NATIONAL LABORATORYU. S. DEPARTMENT OF ENERGY
In 2001 he was listed as an author on an average of one research paper every eight days!
On October 31, 2002, Science withdrew eight papers written by Schön. On December 20, 2002, the Physical Review journalswithdrew six papers written by Schön. On March 5, 2003, Naturewithdrew seven papers written by Schön.

Neutron Powder Diffraction

OAK RIDGE NATIONAL LABORATORYU. S. DEPARTMENT OF ENERGY
Why Neutrons ?
Electrically neutral; penetrates centimeters of bulk material (allows non-destructive bulk analysis)
Detects light atoms even in the presence of heavy atoms (organic crystallography) – H is special!
Distinguishes atoms adjacent in Periodic table and even isotopes of the same element (changing scattering picture without changing chemistry)
Magnetic moment (magnetic structure) Ease of in-situ experiments, e.g. variable temperature, pressure, magnetic field, chemical reaction etc.

OAK RIDGE NATIONAL LABORATORYU. S. DEPARTMENT OF ENERGY
20
Ba2CuWO6: An Ordered Tetragonal Perovskite
Simple cubic AMX3perovskite: a = 3.8045.
Double Perovskites A2MM’O6: Out of 3 possible ordering only 2 observed
Model #1: Ordered alternation of MO6 and M’O6octahedra in one direction, leading to formation of layered perovskite.
Model #2: Ordered alternation in the three directions of space, resulting in rock-salt ordered superstructure.

OAK RIDGE NATIONAL LABORATORYU. S. DEPARTMENT OF ENERGY
21
Model #1 – Layered Ordering:
SpaceGroup
P4/mmm
Lattice a = 3.94 Å; c = 8.64 Å
Atom x y z Occupancy
Ba ¼ ¼ ½ 1
Cu 0 0 0 1
W 0 0 0 1
O(1) 0 0 ¼ 1
O(2) ½ 0 0 1
O(3) ½ 0 ½ 1
Space Group
I4/m
Lattice a = 5.57 Å; c = 8.64 Å
Atom x y z Occupancy
Ba 0 ½ ¼ 1
Cu 0 0 0 1
W 0 0 0 1
O(1) 0 0 0.25 1
O(2) 0.25 0.25 0 1
Model #2 – Rock Salt Type Ordering:

OAK RIDGE NATIONAL LABORATORYU. S. DEPARTMENT OF ENERGY
Jahn Teller Distortion?Iwanaga et. al. J. Solid State. Chem. 147, 291(1999)
Recall Cu2+ electronic configuration(t2g)6(eg)3 : So in fact CuO6 octahedra are elongated along the c axis. The eg orbital is split into
(dx2-y2 and d2z2)

Magnetism & powder diffraction

OAK RIDGE NATIONAL LABORATORYU. S. DEPARTMENT OF ENERGY
Introduction to Magnetism Origin of magnetism – electrons.
Electrons have a magnetic moment (dipole; μS). Magnetic moments arise from two properties of an electron:
1. Motion around the nucleus (gyromagnetic ratio) 2. Total spin quantum number (S = Σ s; s = ±½)
Dipole unit – Bohr magnetons (μB). 1 μB = 9.2742×10⁻²⁴ J/T
21
OAK RIDGE NATIONAL LABORATORYU. S. DEPARTMENT OF ENERGY
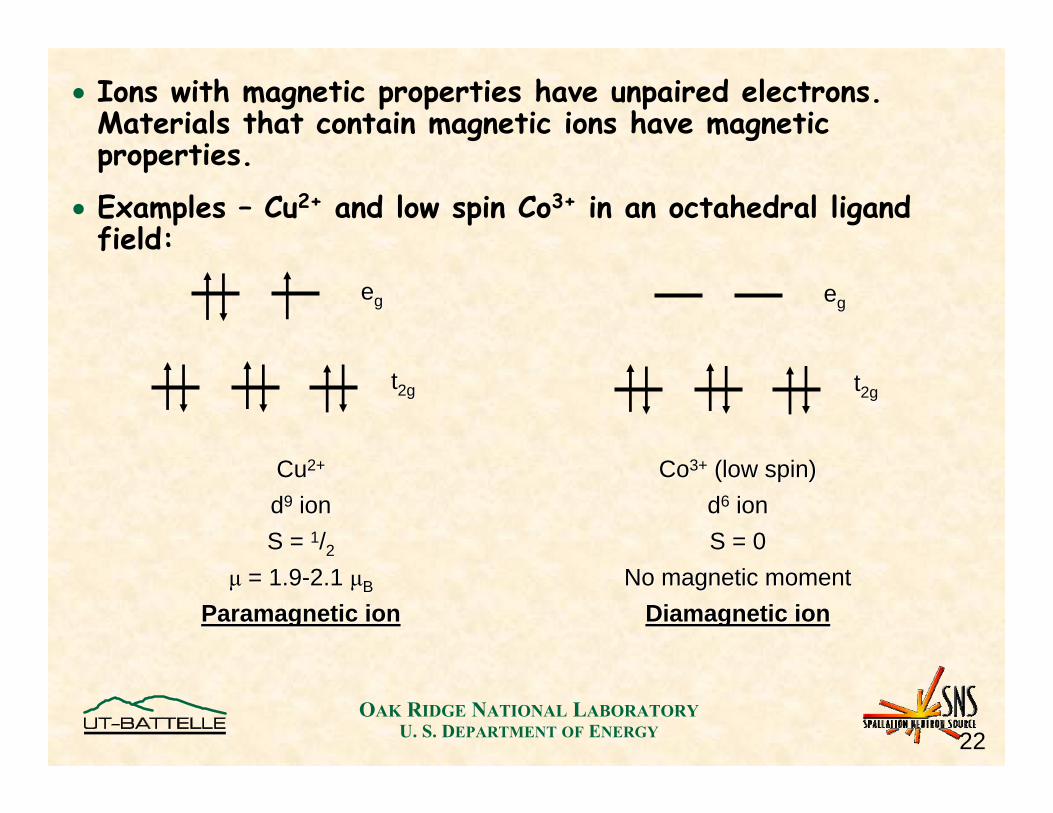
Ions with magnetic properties have unpaired electrons. Materials that contain magnetic ions have magnetic properties.
Examples – Cu2+ and low spin Co3+ in an octahedral ligandfield:
22
CuCu2+2+
dd99 ionionS = S = 11//22
μμ = 1.9= 1.9--2.1 2.1 μμBB
Paramagnetic ionParamagnetic ion
CoCo3+3+ (low spin)(low spin)dd66 ionionS = 0S = 0
No magnetic momentNo magnetic momentDiamagnetic ionDiamagnetic ion
tt2g2g
eegg
tt2g2g
eegg

OAK RIDGE NATIONAL LABORATORYU. S. DEPARTMENT OF ENERGY
Magnetic Ordering Types
Paramagnetic (PM)Paramagnetic (PM)
AntiferromagneticAntiferromagnetic (AFM)(AFM)
Ferromagnetic (FM)Ferromagnetic (FM)
FerrimagneticFerrimagnetic
23

OAK RIDGE NATIONAL LABORATORYU. S. DEPARTMENT OF ENERGY
FERRIMAGNETIC AB2O4 SPINEL STRUCTURE
2-phase refinementnuclear + magnetic
structure
nuclear phase
magnetic phase
B
A
Results givelattice parameteroxygen positiondistribution of Mn/Fe on T and O sitesatomic displacement parametersmagnetic moments on the T and O sites (e.g., -2.9 and 2.0 B)
(Mn0.81Fe0.19)(Fe0.80Mn0.20)2O4
Zhang ZJ et. al. JACS, 120 1800 (1998)

OAK RIDGE NATIONAL LABORATORYU. S. DEPARTMENT OF ENERGY
28
Magnetic Ordering: Oxygen-deficient A-site Layered Perovskite NdBaCo2O5+Burley et. al. J. Solid State. Chem. 170, 339 (2003)
Magnetic phase diagram
G type AF ordering in a simple perovskite
G G FMG+SSO
300
200
100
0
Tem
pera
ture
(K)
1.00.90.80.70.60.50.4
in NdBaCo 2O5+
Fauth et al. TN_G (neutron) TC (suscept.) TC_neut (neutron) T_G_peak (neutron) TN_SSO (neutron)
‘SSO’ +minority
G
G-AFM
G-AFM

Very often life is not so simple and one has to use both X-rays and Neutrons to get to the right picture

OAK RIDGE NATIONAL LABORATORYU. S. DEPARTMENT OF ENERGY
(a)
(c)(b)
Classic example of geometric frustration (Triangular lattice)
(a) Frustration for three equidistant Ising spinscoupled via Antiferromagnetic exchange.
(b,c) For Heisengberg spins with a given spin orientation of the upper atom, two degenerate arrangements with +ve and –ve chirality are possible.
Mechanisms lifting the degeneracy often determine the phase diagrams and other physical properties of these systems.
Frustrated Lattice:
S
N
S
N
N
S
N
S
?

OAK RIDGE NATIONAL LABORATORYU. S. DEPARTMENT OF ENERGY
RBaCo4O7± : Phase transition
Comparison of synchrotron data collected above and below structural phase transition in a single phase YbBaCo4O6.95 and biphasic YbBaCo4O7.2 samples. Biphasic phase is formed in the presence of excess oxygen. Note that the minority phase does not transform upon cooling down to 10K. It is suspected that the excess O may enhance Ba-O bonding to the extent that the P 3 1c to P b n 21 transition is no longer favorable.
Ba2+
Yb3+
8
6
4
2
0
Cou
nts (
103 )
1.3851.3801.3751.370
d-spacing (Å)
225 K
150 K
YbBaCo4O6.95
1.3851.3801.3751.370
d-spacing (Å)
6
4
2
0C
ounts (103)
226 K
152 K
YbBaCo4O7.20(2)

OAK RIDGE NATIONAL LABORATORYU. S. DEPARTMENT OF ENERGY
Above the transition temperatureBa2+ is severely under bonded, givingrise to a structural instability. Bond Valence Calculation show convincingly that the O environment does not satisfy the bonding requirements of the Ba2+ ion.To compensate for this under bondingYb 114 undergoes a structural phasetransition. No compelling structural evidence of Co charge ordering.

OAK RIDGE NATIONAL LABORATORYU. S. DEPARTMENT OF ENERGY
We find that a large orthorhombic Pbc21superstructure is formed with lattice parameters 2aoxboxco . Charge ordered Co ions form long range tetrahedral and octahedral zigzag patterns or chains of edge-sharing Co octahedra. No evidence for any structural phase transition or antiferromagnetic ordering observed at 10 K. Structural building block
of YBaCo4O7(left) & YBaCo4O8 (right) showing drastic displacement of some oxygen atoms and the location of two new ones.
When R = Y and x=1 (YBaCo4O8)
OAK RIDGE NATIONAL LABORATORYU. S. DEPARTMENT OF ENERGY
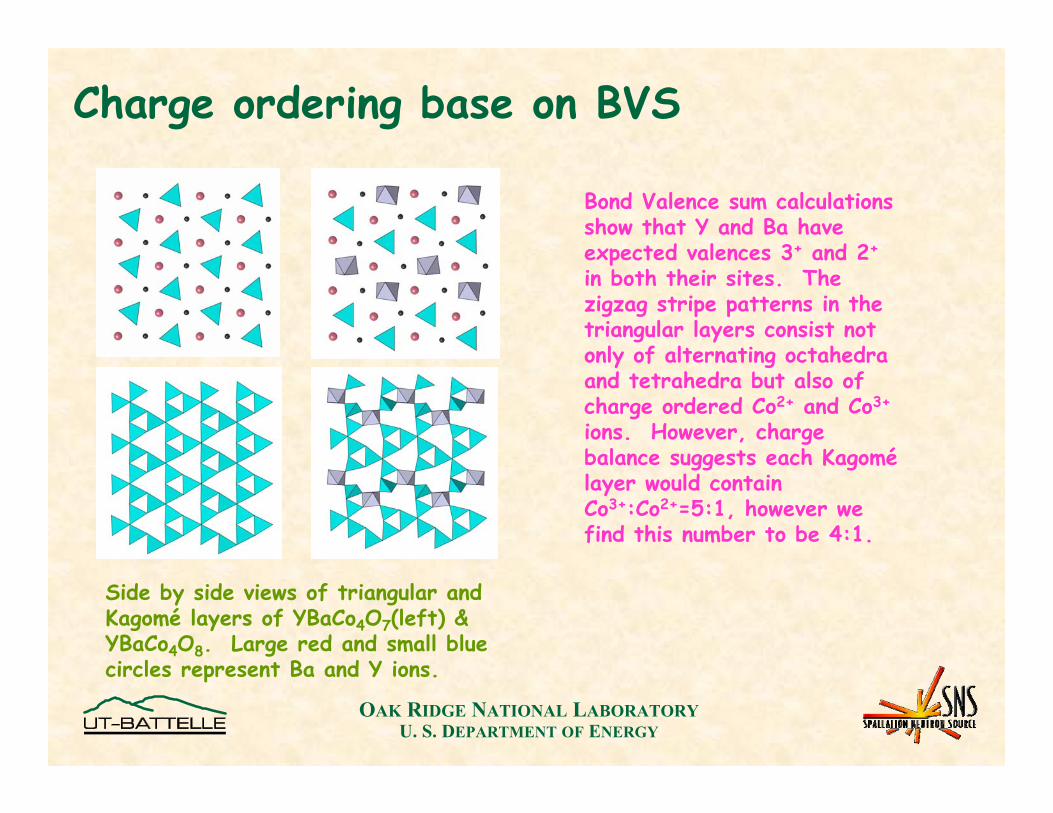
Charge ordering base on BVS
Side by side views of triangular and Kagomé layers of YBaCo4O7(left) & YBaCo4O8. Large red and small blue circles represent Ba and Y ions.
Bond Valence sum calculations show that Y and Ba have expected valences 3+ and 2+
in both their sites. The zigzag stripe patterns in the triangular layers consist not only of alternating octahedraand tetrahedra but also of charge ordered Co2+ and Co3+
ions. However, charge balance suggests each Kagomélayer would contain Co3+:Co2+=5:1, however we find this number to be 4:1.

OAK RIDGE NATIONAL LABORATORYU. S. DEPARTMENT OF ENERGY
What about magnetism?
Portion of the Neutron data collected at GEM at 90K(dashed) and 1.7K (solid). Magnetic scattering due to AF order in the 1.7K pattern is marked by two observed propagation vectors.
Since k2=(1/2,0,0) is missing in R=Y, it is reasonable to conclude that k2 involves a contribution of rare earth. Magnetic structure not yet solved.

OAK RIDGE NATIONAL LABORATORYU. S. DEPARTMENT OF ENERGY
Non magnetic rare earth R=Y
When R = Y and x=0, (Y114), the system also transforms from trigonal to orthorhombic, with Ts = 310 K. Magnetic superlattice reflections appear at TN = 108 K. The complex magnetic structure was solved by simulated annealing and exhibits features of the negative chiralityordering pattern in the Kagome plane.

Time resolved Powder Diffraction:Hydrogen Storage Materials for mobile application
OAK RIDGE NATIONAL LABORATORYU. S. DEPARTMENT OF ENERGY
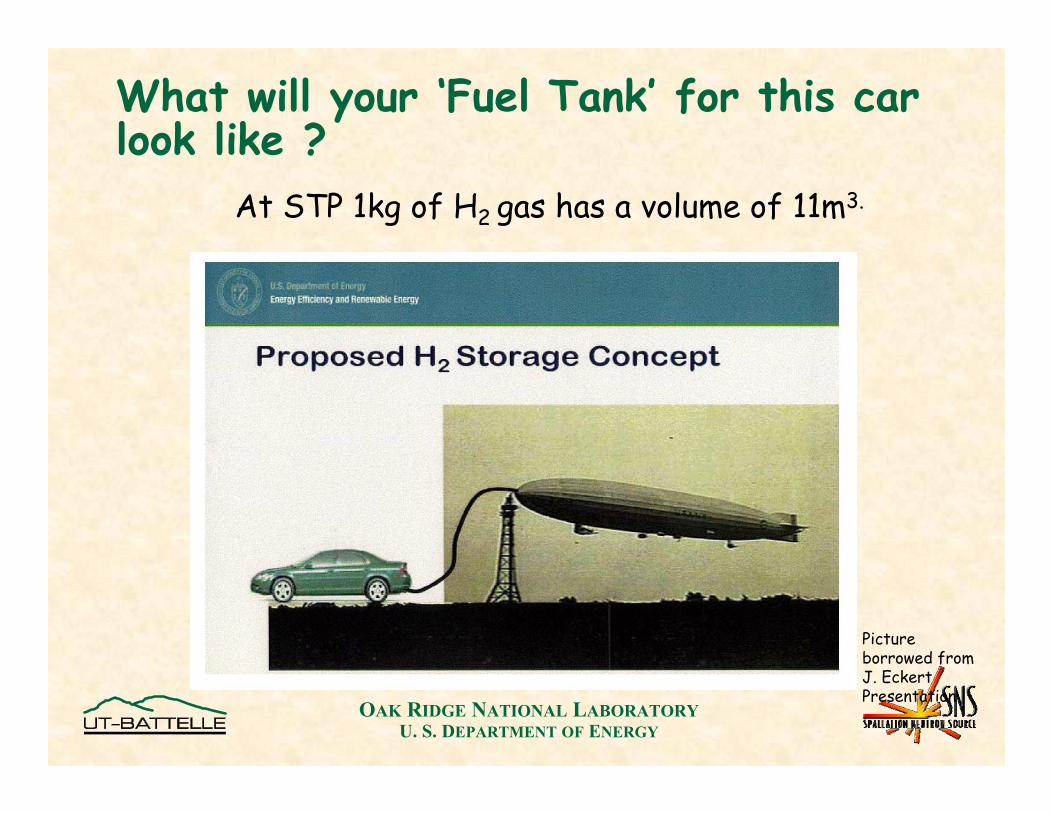
What will your ‘Fuel Tank’ for this car look like ?
Picture borrowed from J. Eckert Presentation
At STP 1kg of H2 gas has a volume of 11m3.
OAK RIDGE NATIONAL LABORATORYU. S. DEPARTMENT OF ENERGY
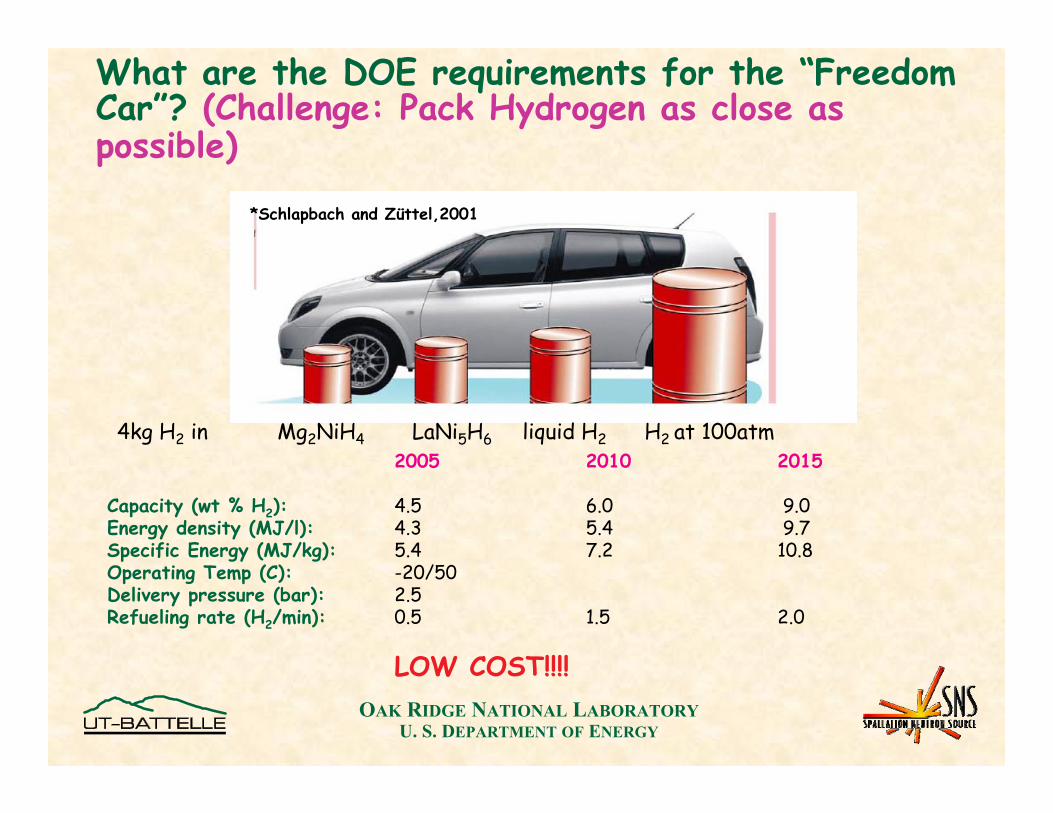
What are the DOE requirements for the “Freedom Car”? (Challenge: Pack Hydrogen as close as possible)
4kg H2 in Mg2NiH4 LaNi5H6 liquid H2 H2 at 100atm2005 2010 2015
Capacity (wt % H2): 4.5 6.0 9.0Energy density (MJ/l): 4.3 5.4 9.7Specific Energy (MJ/kg): 5.4 7.2 10.8Operating Temp (C): -20/50Delivery pressure (bar): 2.5Refueling rate (H2/min): 0.5 1.5 2.0
LOW COST!!!!
*Schlapbach and Züttel,2001

OAK RIDGE NATIONAL LABORATORYU. S. DEPARTMENT OF ENERGY
40
Li3N : Hydrogen Storage CandidateChen et. al: (Nature Nov 2002) Chen et. al: (Nature Nov 2002)
LiLi33N + 2HN + 2H22 LiLi22NH + NH + LiHLiH + H+ H22 LiNHLiNH2 2 + 2LiH+ 2LiHHH22 Absorption 9.3 wt% gain at 255Absorption 9.3 wt% gain at 255ººCCHH22 Desorption 6.3 wt% at 200Desorption 6.3 wt% at 200ººC + 3wt % above 320C + 3wt % above 320ººCC
More recently (2004More recently (2004--2005) 2005) MeisnerMeisner et. al. & others:et. al. & others:
1.1. LiLi33N + 2HN + 2H22 LiLi22NH + NH + LiHLiH + H+ H22
2.2. LiLi22NH + NH + LiHLiH + H+ H22 LiNHLiNH2 2 + 2LiH + 2LiH (~5.2% (~5.2% cyclablecyclable HH22))
Li Imide Li Amide
Our Goal: To study this reaction in-situ in bulk material. Huq et. al. J. Phys. Chem. C 111, 10712 (2007)

OAK RIDGE NATIONAL LABORATORYU. S. DEPARTMENT OF ENERGY
Experimental Setup for in-situ measurementsNote: We cannot use null scatteringmaterial e.g. V or TiZr for sample holderas they are great H getter and oftenused for catalysis.
Pressuretransducer
Turbo pumpD2 Gas
display
Inconel cell: 100 bar and 500C

OAK RIDGE NATIONAL LABORATORYU. S. DEPARTMENT OF ENERGY
42
In situ Deuteration & De-deuteration
deuteration 150C
deuteration 200C
deuteration250C
de-deuteration 250C
LiND2+Li2ND
Li3N
LiD
Li3N
34h: deuteration10h: pumping
d spacing
Time

OAK RIDGE NATIONAL LABORATORYU. S. DEPARTMENT OF ENERGY
43
Moles of Phases PresentCubic phase constraint to LixND3-x
0
20
40
60
80
100
0 9 18 27 36 45Time (Hours)
Moles
-0.50
0.00
0.50
1.00
1.50
2.00
2.50
3.00
3.50
a Li3N LiDLi2ND LiND2b Li3N cubic Licubic: D LixND3-x/LiDLiD : D occ
250C250C
200C150C
Hydriding
De-hydriding

OAK RIDGE NATIONAL LABORATORYU. S. DEPARTMENT OF ENERGY
44
Imide – Amide : Structural relationshipDavid et. al., JACS 129,1594
blue: Ngreen: Ligrey: H
Anti fluoridecubic imide
shift origin ¼ ¼ ¼
a x a x 2a,
Tetragonalamide
show unoccupiedLi sites by red

Ab-initio Structure Solution from Powder Diffraction

OAK RIDGE NATIONAL LABORATORYU. S. DEPARTMENT OF ENERGY
46Title_date
Undertake a project like this with very good data

OAK RIDGE NATIONAL LABORATORYU. S. DEPARTMENT OF ENERGY
47
Space Group : P 21/n
3 spatial coordinates : position3 Eulerian angles : orientation 11 torsions.
Ranitidine HCl (Zantac®) is a very widely used drug for ulcers, excess production of stomach acid. There is an interesting subtlety
in its crystal structure. Huq et. al. J. Pharm. Sci. 92, 244 (2003)
Monoclinic, Z=4
a=18.808Å,
b=12.981Å,
c=7.211Å
=95.057°,

OAK RIDGE NATIONAL LABORATORYU. S. DEPARTMENT OF ENERGY
48
Two candidate solutions from PSSP
Two others
All four, superimposed.
Disorder,
or inability of powder
data to distinguish
a few of the atoms?

OAK RIDGE NATIONAL LABORATORYU. S. DEPARTMENT OF ENERGY
49
C18
N19
O20O21
C15N16
C17N14C13
C12
S11
C10
O1
C2
C3C4
C5
C6
N7
C9
C8
Atomic structure of our best Rietveld refinement of a single molecule.Essentially independent of which solution we start from.
Rwp = 11.12%, 2 = 10.56
Rietveld plot of Ranitidine Hydrochloride single configuration (from pssp)
(a)
(b)
(c)
5.00 15.00 25.00 35.00 45.00
Two Theta (degrees)
-6000-3000
030006000
Diff
eren
ce
20000
40000
60000
Nor
mal
ized
X-r
ay c
ount
s
x5

OAK RIDGE NATIONAL LABORATORYU. S. DEPARTMENT OF ENERGY
50
Cl
O20'
C8
C9
N7
C3C4
C5
O1C2C6 C10
S11
C13
C12
N14
O20
O21O21'
N19
C16' C17
N14'C16C15
C18'C18
Refinement incorporating disorder. 50% occupancy of each of twosites for N14, C16, C18, O20, and O21.
Rwp =8.39%, 2 = 4.51
All thermal parameters independently refined! Gentle restraints on bond lengths.
This is clearly the correct solution, which includes molecular disorder.

OAK RIDGE NATIONAL LABORATORYU. S. DEPARTMENT OF ENERGY
51
Rwp = 8.43%, 2 = 4.51
Rietveld plot of Ranitidine Hydrochloride with disorder
(a)
(b)
(c)
5.00 15.00 25.00 35.00 45.00
Two Theta (degrees)
-6000-3000
030006000
Diff
eren
ce
20000
40000
60000N
orm
aliz
ed X
-ray
cou
nts
x5

OAK RIDGE NATIONAL LABORATORYU. S. DEPARTMENT OF ENERGY
52
Cl
O20'
C8
C9
N7
C3C4
C5
O1C2C6 C10
S11
C13
C12
N14
O20
O21O21'
N19
C16' C17
N14'C16
C15
C18'C18
The answer, including disorder, was already known from single crystal experiment. T. Ishida, Y. In, M. Inoue (1990)

Proteins and Powder Diffraction

OAK RIDGE NATIONAL LABORATORYU. S. DEPARTMENT OF ENERGY
Extreme limit: ProteinsWork done by R. Von Dreele (Los Alamos) & P.W. StephensIt is possible to get usable data, and to refine it with sufficient chemical restraints.
T3R3 HP Zn insulin RT 1.5mm cap 1.401107 693+694 Hist 1Lambda 1.4011 A, L-S cycle 335 Obsd. and Diff. Profiles
2-Theta, deg
Counts
X10E 1 .5 1.0 1.5 2.0 2.5
X10E 3
-2.0 .0 2.0 4.0 6.0
T3r3 Zn insulin hard grind fresh RT 1.5mm cap 0.700233 Scan no. = 1 Lambda1,lambda2 = .700 Observed Profile
2-Theta, deg
Counts
1.0 2.0 3.0 4.0
X10E 3
.5 1.0 1.5 2.0 2.5

Native
a=80.96Åc=37.59ÅNrefined = 1754Nrestraints=3871Nreflections=9871Resolution 3.06ÅRwp=3.34%
Ground
81.28Å73.04Å29257934127343.22Å3.77%
R.B. Von Dreele, P.W. Stephens, G.D. Smith, and R.H. Blessing, “The First Protein Crystal Structure Determined from X-ray Powder Diffraction Data: a Variant of T3R3 Human Insulin Zinc Complex Produced by Grinding,” Acta Crystallographica D 56, 1549-53 (2000).

OAK RIDGE NATIONAL LABORATORYU. S. DEPARTMENT OF ENERGY
Current work at APS:Structure solution viamolecular replacement
0
2000
4000
6000
8000
10000
12000
14000
2 3 4 5 6 7 8 9 10 11 12
2 theta

OAK RIDGE NATIONAL LABORATORYU. S. DEPARTMENT OF ENERGY
Take home message
Powder diffraction is an extremely powerful technique to study structural properties of a very wide variety of materials. To understand physical and chemical properties of materials it is crucial that we know how the “atoms are put together” and if you cannot grow those big single crystals….you can still learn quite a lot about your system using powder diffraction.