power and sample size calculations for primary open angle glaucoma / ocular hupertension clinical...
DESCRIPTION
Dale W. Usner, Ph.D. presented the poster above on power and sample size calculations in glaucoma clinical trials at the ARVO Annual Meeting in Orlando, FL on May 4, 2014. Dr. Usner has over 17 years of experience leading and executing clinical trial research, including over 9 years in ophthalmic pharmaceuticals and devices. His presentation, “Power and Sample Size Calculations for Primary Open Angle Glaucoma / Ocular Hypertension Clinical Trials Accounting for Correlation of Measures among the Time Points across Visits,” is supported by his research and experience in clinical trial design and statistical consulting specifically in this ophthalmic indication. Dr. Usner is Vice President of Biostatistics and Data Management at SDC, a specialized biostatistics and clinical data management Clinical Research Organization (CRO). To learn more about SDC, Dr. Usner, and the above presentation, please visit http://www.sdcclinical.com.TRANSCRIPT
Dale W. Usner, PhD, 1 Richard Abelson, PhD, 1 1Statistics and Data Corporation, Tempe, AZ, USA
Power and Sample Size Calculations for Primary Open Angle Glaucoma / Ocular Hypertension Clinical Trials Accounting for Correlation of Measures among the Time Points across Visits.
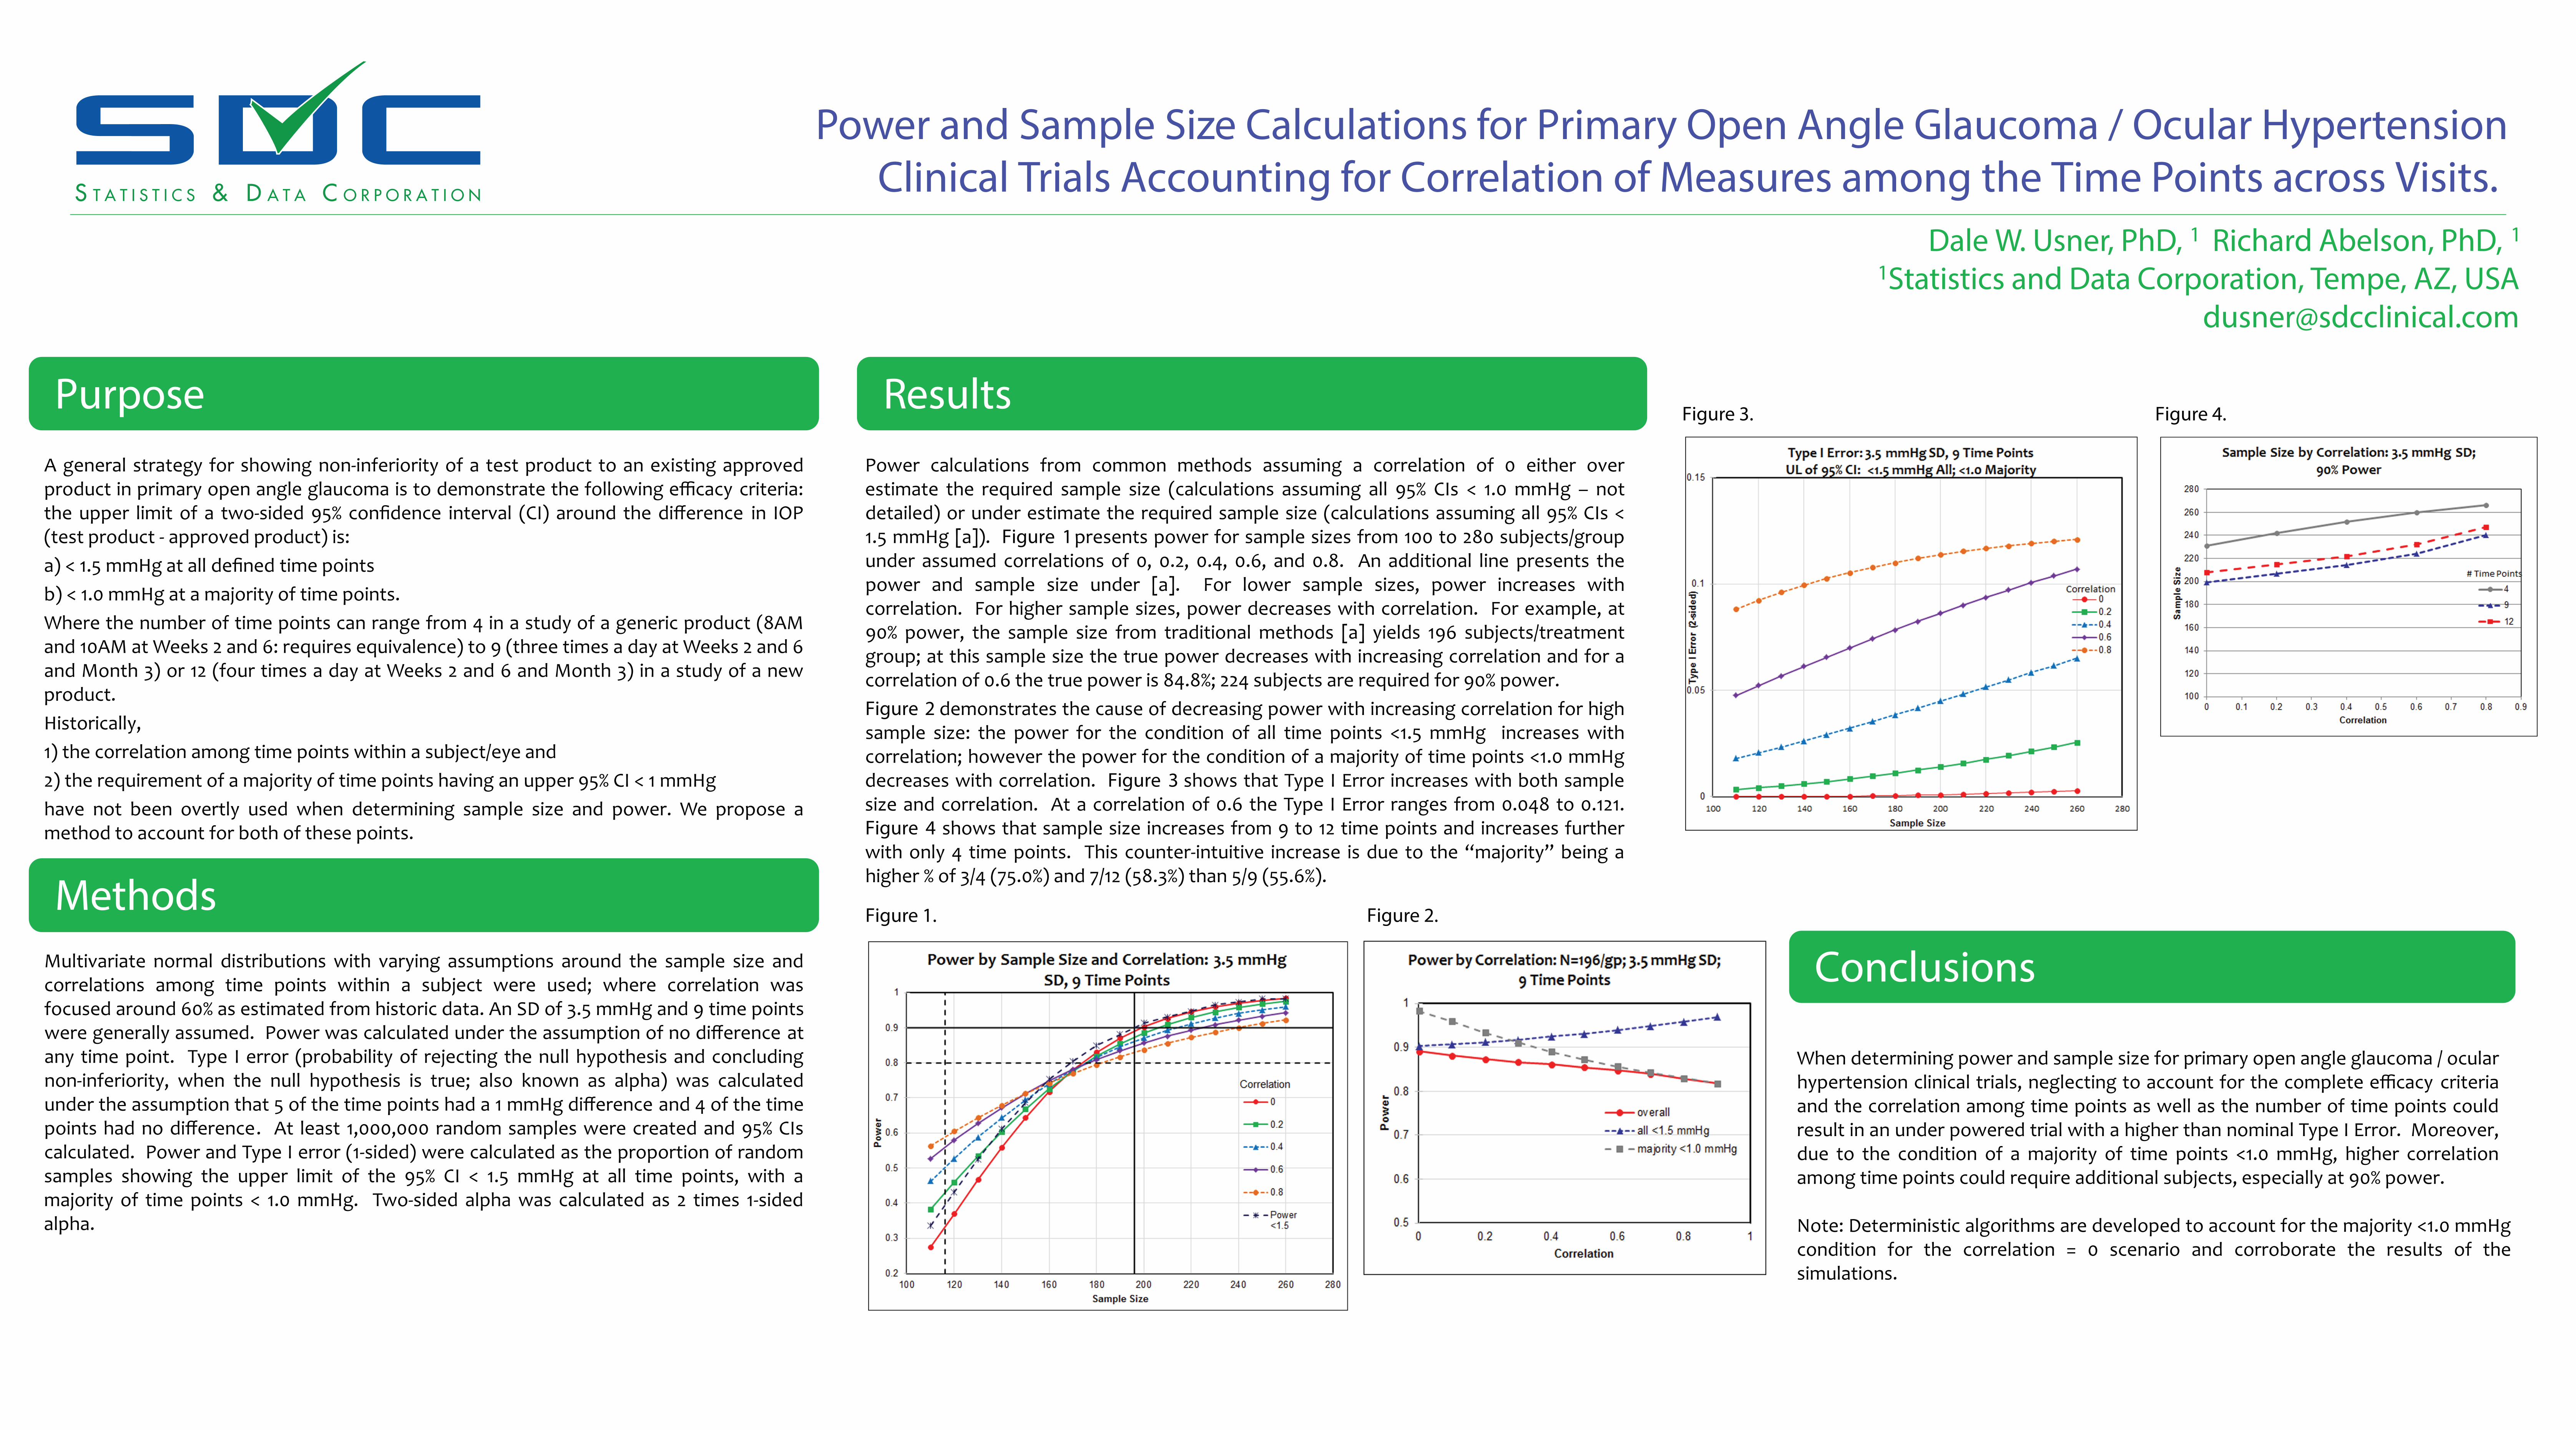
A general strategy for showing non-inferiority of a test product to an existing approved product in primary open angle glaucoma is to demonstrate the following efficacy criteria: the upper limit of a two-sided 95% confidence interval (CI) around the difference in IOP (test product - approved product) is: a) < 1.5 mmHg at all defined time points b) < 1.0 mmHg at a majority of time points. Where the number of time points can range from 4 in a study of a generic product (8AM and 10AM at Weeks 2 and 6: requires equivalence) to 9 (three times a day at Weeks 2 and 6 and Month 3) or 12 (four times a day at Weeks 2 and 6 and Month 3) in a study of a new product. Historically, 1) the correlation among time points within a subject/eye and 2) the requirement of a majority of time points having an upper 95% CI < 1 mmHg have not been overtly used when determining sample size and power. We propose a method to account for both of these points.
Multivariate normal distributions with varying assumptions around the sample size and correlations among time points within a subject were used; where correlation was focused around 60% as estimated from historic data. An SD of 3.5 mmHg and 9 time points were generally assumed. Power was calculated under the assumption of no difference at any time point. Type I error (probability of rejecting the null hypothesis and concluding non-inferiority, when the null hypothesis is true; also known as alpha) was calculated under the assumption that 5 of the time points had a 1 mmHg difference and 4 of the time points had no difference. At least 1,000,000 random samples were created and 95% CIs calculated. Power and Type I error (1-sided) were calculated as the proportion of random samples showing the upper limit of the 95% CI < 1.5 mmHg at all time points, with a majority of time points < 1.0 mmHg. Two-sided alpha was calculated as 2 times 1-sided alpha.
Power calculations from common methods assuming a correlation of 0 either over estimate the required sample size (calculations assuming all 95% CIs < 1.0 mmHg – not detailed) or under estimate the required sample size (calculations assuming all 95% CIs < 1.5 mmHg [a]). Figure 1 presents power for sample sizes from 100 to 280 subjects/group under assumed correlations of 0, 0.2, 0.4, 0.6, and 0.8. An additional line presents the power and sample size under [a]. For lower sample sizes, power increases with correlation. For higher sample sizes, power decreases with correlation. For example, at 90% power, the sample size from traditional methods [a] yields 196 subjects/treatment group; at this sample size the true power decreases with increasing correlation and for a correlation of 0.6 the true power is 84.8%; 224 subjects are required for 90% power. Figure 2 demonstrates the cause of decreasing power with increasing correlation for high sample size: the power for the condition of all time points <1.5 mmHg increases with correlation; however the power for the condition of a majority of time points <1.0 mmHg decreases with correlation. Figure 3 shows that Type I Error increases with both sample size and correlation. At a correlation of 0.6 the Type I Error ranges from 0.048 to 0.121. Figure 4 shows that sample size increases from 9 to 12 time points and increases further with only 4 time points. This counter-intuitive increase is due to the “majority” being a higher % of 3/4 (75.0%) and 7/12 (58.3%) than 5/9 (55.6%).
When determining power and sample size for primary open angle glaucoma / ocular hypertension clinical trials, neglecting to account for the complete efficacy criteria and the correlation among time points as well as the number of time points could result in an under powered trial with a higher than nominal Type I Error. Moreover, due to the condition of a majority of time points <1.0 mmHg, higher correlation among time points could require additional subjects, especially at 90% power.
Purpose
Methods
Results
Conclusions Figure 1. Figure 2.
Figure 3. Figure 4.
Note: Deterministic algorithms are developed to account for the majority <1.0 mmHg condition for the correlation = 0 scenario and corroborate the results of the simulations.