power generation 2015 - chambre de commerce€¦ · 2015 profile: electric power in colombia -...
TRANSCRIPT

2015
Profile: Electric power in Colombia -
Investment opportunities - Power
Generation
Electric Power in Colombia Power Generation
The outlook for the Colombian energy sector is broadly positive;
demand for electricity is steadily growing and the Government has
taken several positive steps to encourage investment in the sector.
Business Monitor, 2015.
According to Business Monitor, during the period 2015-2019,
Colombia's overall power generation will increase by an annual
average of 3.6%, reaching 81,300 GWh in 2019. Business Monitor,
2015.
The main driver of this growth is the increase in annual average
gains of 4.0% in hydroelectric power generation, while coal and
gas-fired generation are forecast to increase by an annual average
of 2.7% and 2.5% respectively. Business Monitor, 2015.
2
Contenido
Why to Invest in Power Generation in Colombia? ...................................................................... 4
Power Generation .................................................................................................................... 5
Installed Capacity ............................................................................................................................ 5
Agents of the Energy Market in Colombia ...................................................................................... 5
Energy Production .................................................................................................................... 5
Power Generation Agents ............................................................................................................... 7
Energy Demand ........................................................................................................................ 7
Regulated and Non-regulated Market ............................................................................................ 8
Energy Demand by Region .............................................................................................................. 8
Energy Demand by Industry ............................................................................................................ 9
Power Demand Forecast (Installed Capacity) ................................................................................. 9
International Power Network ....................................................................................................... 10
Hydroelectric Power Generation ............................................................................................. 10
Main Hydropower Plants in Colombia and future projects .......................................................... 11
Price of Hydropower Generation .................................................................................................. 12
Thermal Power Generation ..................................................................................................... 12
Main Thermal Plants in Colombia ................................................................................................. 13
Main Thermal Projects .................................................................................................................. 13
Top Thermal Resources for Energy Production ............................................................................ 14
Production and consumption of gas in Colombia ..................................................................... 14
Gas Reserves in Colombia ......................................................................................................... 14
Price of Thermal Generation with Gas Resources ..................................................................... 15
Coal in Colombia........................................................................................................................ 15
................................................................................................................................................... 16
Price of Energy Generated from Coal Resources .......................................................................... 16
Renewable Nonconventional Energy Generation ..................................................................... 16
Connected and Non-connected Zones in Colombia ...................................................................... 17
Wind Power Generation ......................................................................................................... 17
Regions with Electricity- Producing Potential ............................................................................... 18
Wind Park in Colombia La Guajira and wind potential map ..................................................... 18
Solar Power Generation .......................................................................................................... 19

3
Approximate Multiyear Average Availability of Solar Energy by Region ...................................... 19
Biomass Power ....................................................................................................................... 20
Biomass in Colombia - Map ....................................................................................................... 20
Geothermal Power Generation ............................................................................................... 21
Geothermal in Colombia ........................................................................................................... 21
Bibliography ........................................................................................................................... 22
4
Why to Invest in Power Generation in Colombia?
Colombia has a solid and well-established regulatory framework: Since 1994, 2 reforms (laws 142 and 143) were implemented aiming primarily to foster the private investment in the sector. This has translated into business opportunities for companies that have specific projects. In addition, currently the property of companies in the stages of generation and distribution is mainly from foreign companies.
Resources to enhance the expansions: Colombia has natural resources for power generation: water, coal and the possibility of gas in amounts that allow greater supply than that of the country's demand. "The hydropower resources inventory conducted in 1979, shows a potential in generation capacity of 93,085 MW." (Acolgen, the Expansion of Power Generation, 2012-2018.)
The Expansion of Power Generation and Transmission Plan 2012-2018 By UPME (Mining and
Power Planning Unit) indicates for 2019-2028 time frame, that Colombia requires a power installed
capacity increase, in order to guarantee the power supply reliability.
The World Bank forecasts that power demand in Latin America will double between 2008 and
2030, reaching 2,500 TWh by the end of that year. This growth implies the need for an additional 239 GW in the region approaching 330 GW of installed capacity.
Attractive international interconnection projects that will increase energy exports to Latin American countries. Interconnection project between Colombia – Panama (2018), Andean Electrical Interconnection System between Ecuador, Peru, and Chile.
The National Interconnected System (NIS) connects 48% of the national territory and covers 97% of the population. The non-connected zones (ZNI) account for 52% of the country´s area (17 departments and 1,441 municipalities) and 625 thousand people. Currently, these zones produce energy with diesel.
Thanks to its geospatial position, Colombia has potential to generate energy from non-conventional resources such as solar, wind, biomass, geothermal and solid waste.
Law 1715 of 2014 integrates non-conventional renewable energy to the national energy system. This law promotes the development and use of non-conventional energy sources (especially those from renewable sources), in the national energy system, establishes the legal framework and instruments for the use of non-conventional energy sources (FNCE for its acronym in Spanish), especially those from renewable sources, and creates tax incentives for the investment in this kind of projects.
110 power generation projects under development in different stages, which add up to 4,974 MW. 97 hydraulic projects which add up to 3,631 MW, 8 thermal projects equivalent to 858 MW, 4 wind projects which estimate to produce 654 MW, and 1 solar with an installed capacity of 19.9 MW
5
Power Generation
Installed Capacity
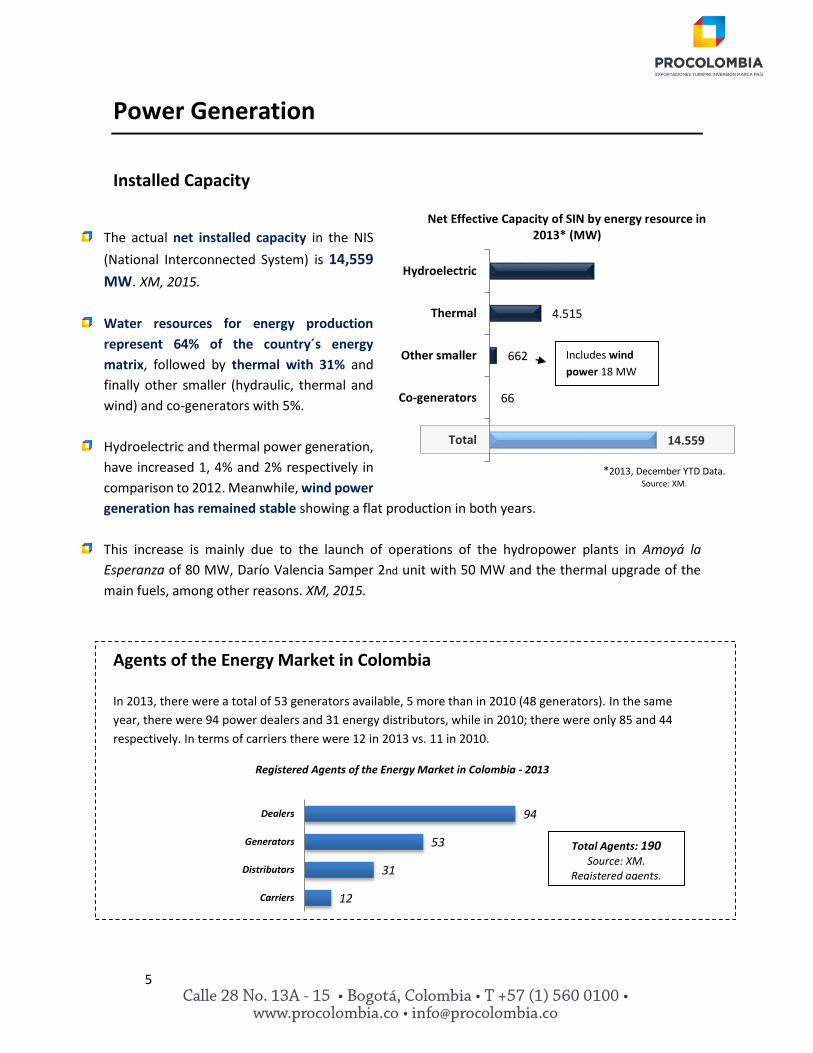
The actual net installed capacity in the NIS
(National Interconnected System) is 14,559
MW. XM, 2015.
Water resources for energy production
represent 64% of the country´s energy
matrix, followed by thermal with 31% and
finally other smaller (hydraulic, thermal and
wind) and co-generators with 5%.
Hydroelectric and thermal power generation,
have increased 1, 4% and 2% respectively in
comparison to 2012. Meanwhile, wind power
generation has remained stable showing a flat production in both years.
This increase is mainly due to the launch of operations of the hydropower plants in Amoyá la
Esperanza of 80 MW, Darío Valencia Samper 2nd unit with 50 MW and the thermal upgrade of the
main fuels, among other reasons. XM, 2015.
Agents of the Energy Market in Colombia
In 2013, there were a total of 53 generators available, 5 more than in 2010 (48 generators). In the same
year, there were 94 power dealers and 31 energy distributors, while in 2010; there were only 85 and 44
respectively. In terms of carriers there were 12 in 2013 vs. 11 in 2010.
Registered Agents of the Energy Market in Colombia - 2013
12
31
53
94
Carriers
Distributors
Generators
Dealers
14.559
66
662
4.515
Total
Co-generators
Other smaller
Thermal
Hydroelectric
Net Effective Capacity of SIN by energy resource in 2013* (MW)
Total Agents: 190 Source: XM.
Registered agents.
*2013, December YTD Data. Source: XM.
Includes wind
power 18 MW
6
Energy Production
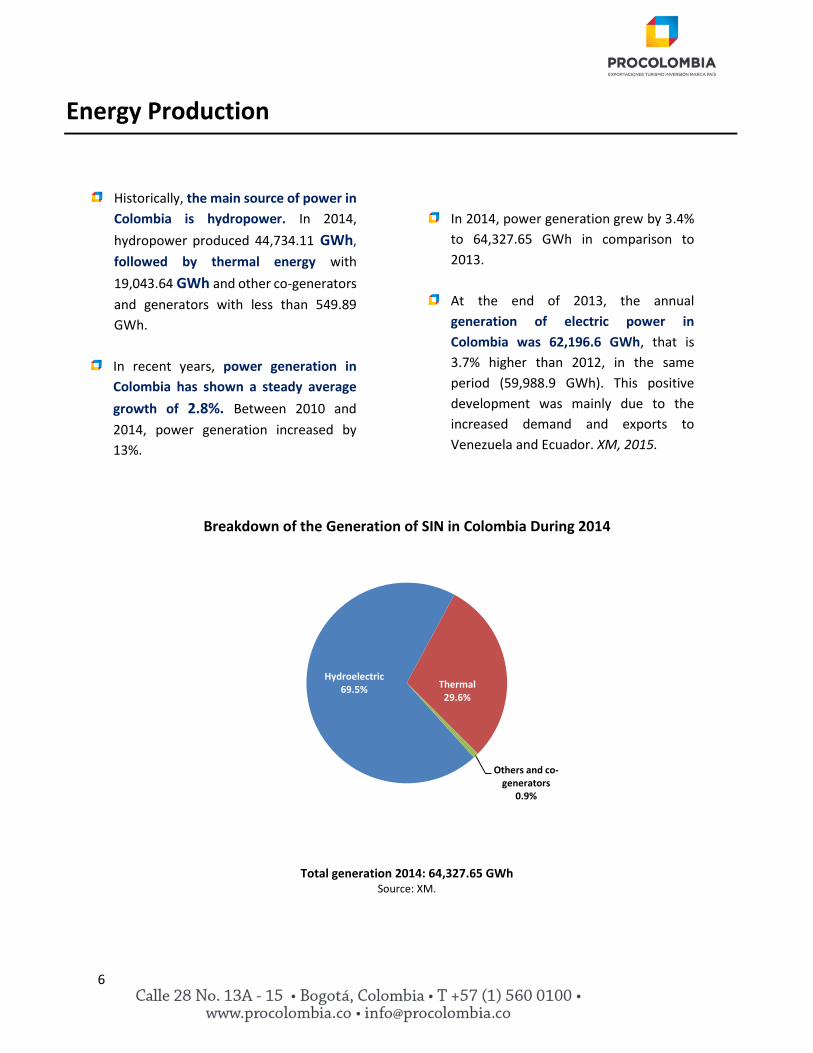
Historically, the main source of power in
Colombia is hydropower. In 2014,
hydropower produced 44,734.11 GWh,
followed by thermal energy with
19,043.64 GWh and other co-generators
and generators with less than 549.89
GWh.
In recent years, power generation in
Colombia has shown a steady average
growth of 2.8%. Between 2010 and
2014, power generation increased by
13%.
In 2014, power generation grew by 3.4%
to 64,327.65 GWh in comparison to
2013.
At the end of 2013, the annual
generation of electric power in
Colombia was 62,196.6 GWh, that is
3.7% higher than 2012, in the same
period (59,988.9 GWh). This positive
development was mainly due to the
increased demand and exports to
Venezuela and Ecuador. XM, 2015.
Breakdown of the Generation of SIN in Colombia During 2014
Total generation 2014: 64,327.65 GWh Source: XM.
Hydroelectric69.5% Thermal
29.6%
Others and co-generators
0.9%
7
Power Generation Agents
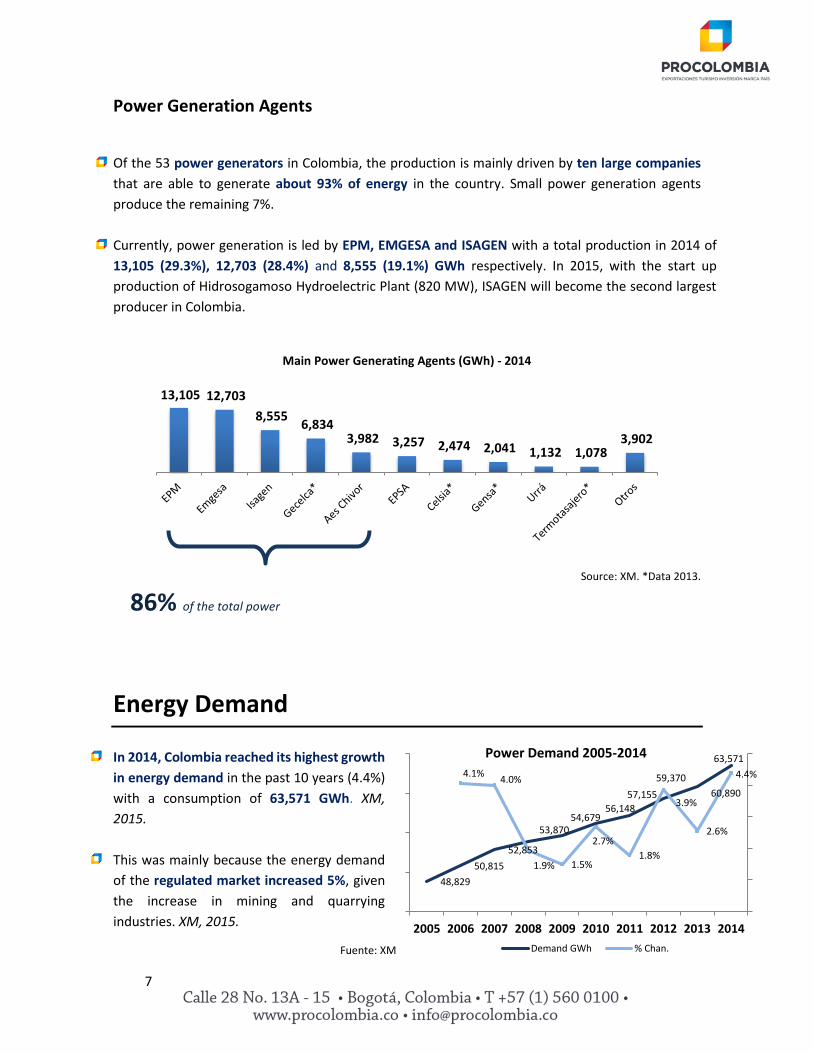
Of the 53 power generators in Colombia, the production is mainly driven by ten large companies
that are able to generate about 93% of energy in the country. Small power generation agents
produce the remaining 7%.
Currently, power generation is led by EPM, EMGESA and ISAGEN with a total production in 2014 of
13,105 (29.3%), 12,703 (28.4%) and 8,555 (19.1%) GWh respectively. In 2015, with the start up
production of Hidrosogamoso Hydroelectric Plant (820 MW), ISAGEN will become the second largest
producer in Colombia.
Main Power Generating Agents (GWh) - 2014
Source: XM. *Data 2013.
Energy Demand
In 2014, Colombia reached its highest growth
in energy demand in the past 10 years (4.4%)
with a consumption of 63,571 GWh. XM,
2015.
This was mainly because the energy demand
of the regulated market increased 5%, given
the increase in mining and quarrying
industries. XM, 2015.
13,105 12,703
8,555 6,834
3,982 3,257 2,474 2,041 1,132 1,078 3,902
86% of the total power
generation in Colombia.
Fuente: XM
48,829
50,815
52,853
53,870 54,679
56,148
57,155
59,370
60,890
63,571
4.1%4.0%
1.9% 1.5%
2.7%
1.8%
3.9%
2.6%
4.4%
2005 2006 2007 2008 2009 2010 2011 2012 2013 2014
Power Demand 2005-2014
Demand GWh % Chan.

8
Meanwhile, the non-regulated market represented 32.4% of the total demand growing by 2.5% in
comparison to 2012.
Regulated and Non-regulated Market Non-regulated users (also known as Large Users) are those who consume more than 100 kW, or
its equivalent in power consumption of 55 MWh/month. These users can sign bilateral contracts
with dealers where prices and quantities are negotiated freely between the two parties.
Users who do not fit within this category are classified as Regulated Users and therefore, subject to
CREG (The Energy and Gas Regulation Commission) regulated rates that are subject to having a
general pricing structure.
Energy Demand by Region
Between 1996 and 2013, the regions that demanded the largest amounts of energy were the central
regions with an average of 12,120 GWh, followed by the northwestern region with an average
demand of 7,657 GWh. UPME, 2015.
According to the energy expansion plan in Colombia, the Coffee Triangle region is the area that will
have a higher energy demand growth rate between 2014 and 2024 (5.3%). The second region will
be the Caribbean with an average growth rate of 3.6% and the Eastern area with 3.5% in the same
period. UPME, 2015.
Energy Demand by Region - Historical and Forecasted - (GWh)
Caribbean (North) Historical: 1996-2013: 5,636 Forecast: 2014-2024: 10,198
Coast Historical: 1996-2013: 4,091 Forecast:
2014-2024: 6,647
Northeast Historical: 1996-2013: 7,657 Forecast: 2014-2024: 9,625
CQR Historical: 1996-2013: 2,165 Forecast: 2014-2024: 3,559
Valle Historical: 1996-2013: 5,286 Forecast: 2014-2024: 7,503
Tolima Historical: 1996-2013: 2,110 Forecast: 2014-2024: 3,194
Center Historical: 1996-2013: 12,180 Forecast: 2014-2024: 18,536
East Historical: 1996-2013: 4,655 Forecast: 2014-2024: 8,058
Source: UPME.

9
Energy Demand by Industry
The manufacturing industry was the largest user
of energy, demanding 9,546 GWh, followed by
mining and quarrying (4,386 GWh) and in third
place social, community and personal services
with 2,423 GWh.
The demand of these three sectors represented
73% of the total demand of nonregulated market.
Power Demand Forecast (Installed Capacity)
From 2022, energy production will tend to present a deficit thanks to the delay in specific projects such as Ituango and the non-execution of Porvenir II project.
In the short term, forecasted between 2014 and 2019, it can be determined that the plants governed under the Reliability Framework and those that are in development, can meet the criteria for energy reliability established by the regulation taking into account the assumptions included in this plan, and possible project delays. UPME
For the long-term period (2019-2028), an installed capacity increase is required to achieve the "cargos de confiabilidad" criteria.
The UPME has been evaluating several options to diversify the power generation matrix. In this
regard, the "Expansion and reference plan of power generation and transmission 2014-2018" approaches those exercises, leveraged also with the Law 1715 of 2014 (nonconventional renewable energy).
The results have established important reciprocities between renewable resources of Non Conventional Energy Sources - NCES, and water alternatives traditionally contemplated.
Total demand: 20,867 GWh Source: XM.
13,629
13,30312,985
8.000
9.000
10.000
11.000
12.000
13.000
14.000
15.000Power Demand Forecast Scenarios (MW) 2014 - 2028
Upper Moderate Lower
Manufacturing industries
47%
Mining and quarrying
21%
Social, community and personal
services11%
Trade, repairs, restaurants and
hotels8%
Electricity, city gas and water
5%
Transportation, storage and
communication3%
Others5%
Power Demand by Economic Activity - 2013
Source: UPME.

10
International Power Network
Currently, Colombia is structuring and participating in several regional projects for power network
expansion. For instance, there is a project with Panama for the Central America interconnection.
This project would have a capacity of 100 MW.
For 2018, a new interconnecting network is expected with Ecuador. This project would have a total
transport capacity of 300 MW and is also a great effort to develop the ‘Andean Power
Interconnection System’ with Bolivia, Chile, Ecuador and Peru.
Hydroelectric Power Generation
In 2014, hydroelectric power generation represented 69.5% of the total production in the country.
The availability of water resources to
generate power in Colombia is determined,
amongst other factors, by the geographical
location of our territory, the topography and
its interaction with the Intertropical
Convergence Zone (ITCZ), determining the
annual rainfall patterns in each region.
UPME, 2015.
Under normal conditions and in most of the
country, there are two rainy seasons that
supply reservoirs; however, climatic
phenomenon (e.g. El Niño phenomenon)
have affected the normal conditions during
some years. UPME, 2015.
Rainfall levels in Colombia vary within the different regions, ranging from 500 mm (19 inches) per year
in the Guajira in the north of the country to 2,000 mm (78 inches) in Chocó located in the western side
of the nation. Blue planet.1 Planeta azul, 2015.
Between 2014-2018, hydroelectric power production will increase by 5,443 GWh per month as a
result of the launch of the first stage of the projects: Ituango and Porvenir II (2018-2020). In addition,
1. Banco de Occidente - Planeta azul. See bibliography.
40,557.46
48,427.48 47,581.71
44,362.79 44,734.11
2010 2011 2012 2013 2014
Hydroelectric Power Generation 2010-2014 (GWh)
Source: UPME-SIEL

11
with the launch of the second stage of Ituango, hydroelectric generation is expected to reach a
production of 6,200 GWh per month (2022-2028).2 UPME, 2015.
Main Hydropower Plants in Colombia and future projects
2. UPME. Expansion plan and reference, p. 272.
12
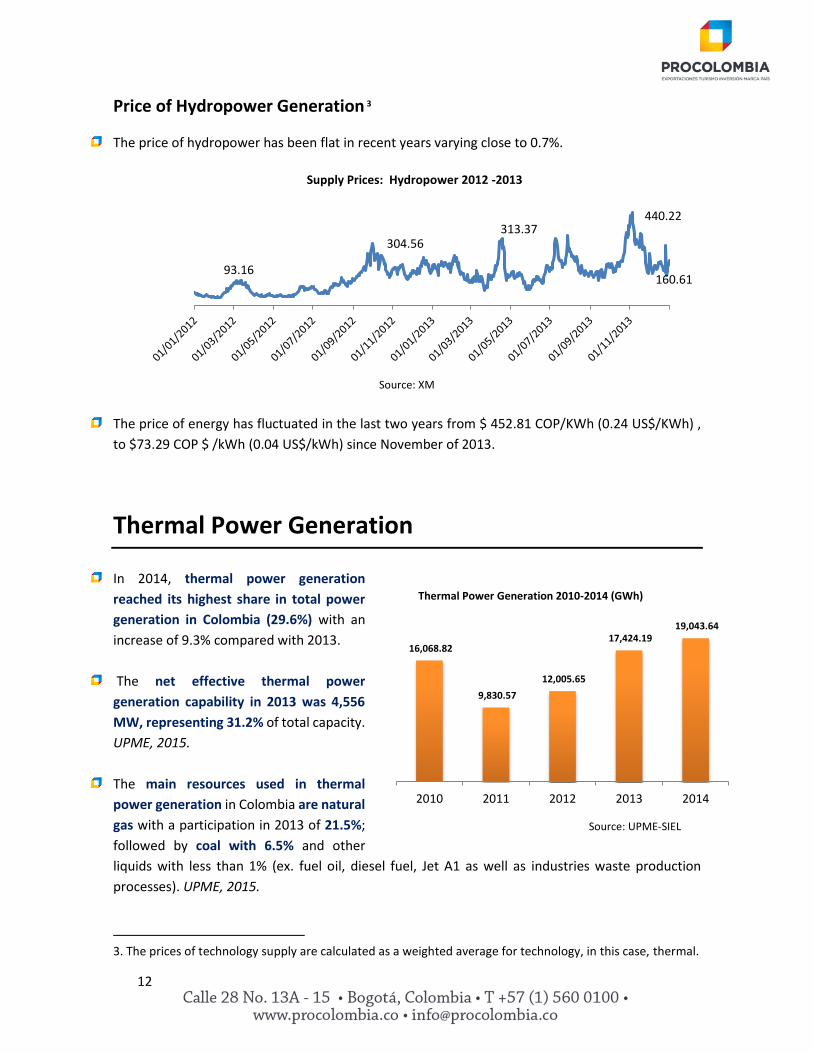
Price of Hydropower Generation 3
The price of hydropower has been flat in recent years varying close to 0.7%.
Source: XM
The price of energy has fluctuated in the last two years from $ 452.81 COP/KWh (0.24 US$/KWh) ,
to $73.29 COP $ /kWh (0.04 US$/kWh) since November of 2013.
Thermal Power Generation
In 2014, thermal power generation
reached its highest share in total power
generation in Colombia (29.6%) with an
increase of 9.3% compared with 2013.
The net effective thermal power
generation capability in 2013 was 4,556
MW, representing 31.2% of total capacity.
UPME, 2015.
The main resources used in thermal
power generation in Colombia are natural
gas with a participation in 2013 of 21.5%;
followed by coal with 6.5% and other
liquids with less than 1% (ex. fuel oil, diesel fuel, Jet A1 as well as industries waste production
processes). UPME, 2015.
3. The prices of technology supply are calculated as a weighted average for technology, in this case, thermal.
Source: UPME -
SIEL
Source: UPME -
SIEL
93.16
304.56 313.37
440.22
160.61
Supply Prices: Hydropower 2012 -2013
16,068.82
9,830.57
12,005.65
17,424.19 19,043.64
2010 2011 2012 2013 2014
Thermal Power Generation 2010-2014 (GWh)
Source: UPME-SIEL
13
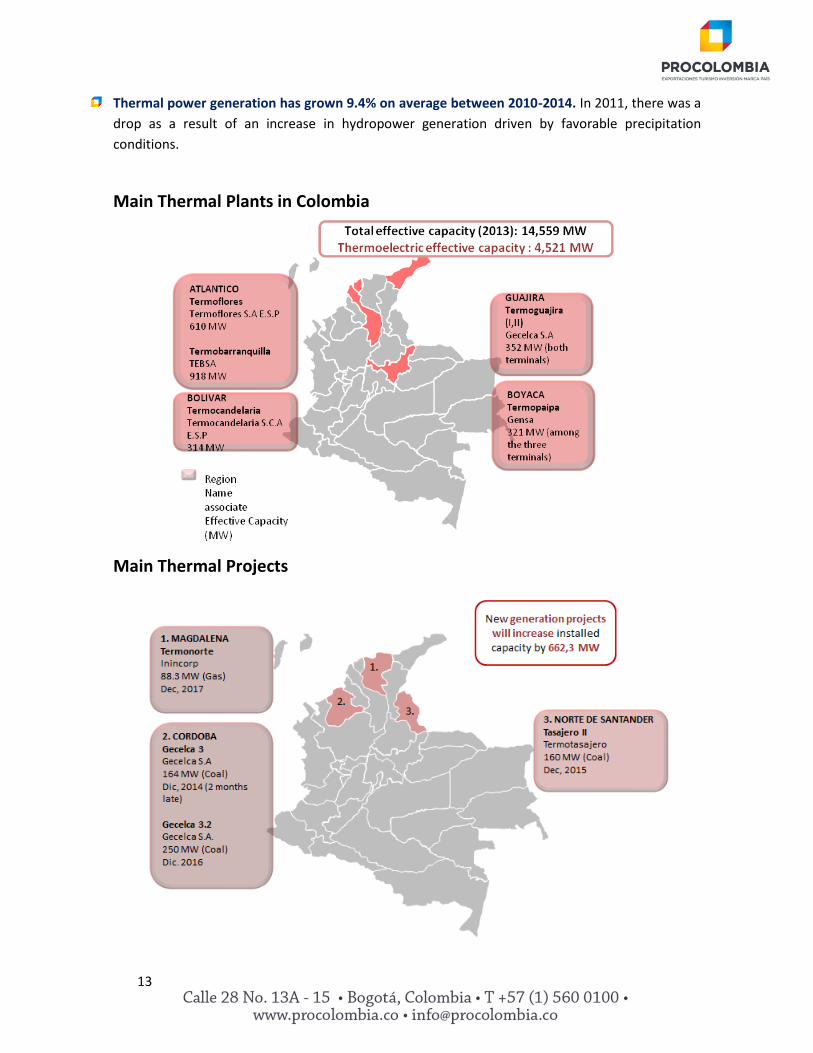
Thermal power generation has grown 9.4% on average between 2010-2014. In 2011, there was a
drop as a result of an increase in hydropower generation driven by favorable precipitation
conditions.
Main Thermal Plants in Colombia
Main Thermal Projects
14
Top Thermal Resources for Energy Production
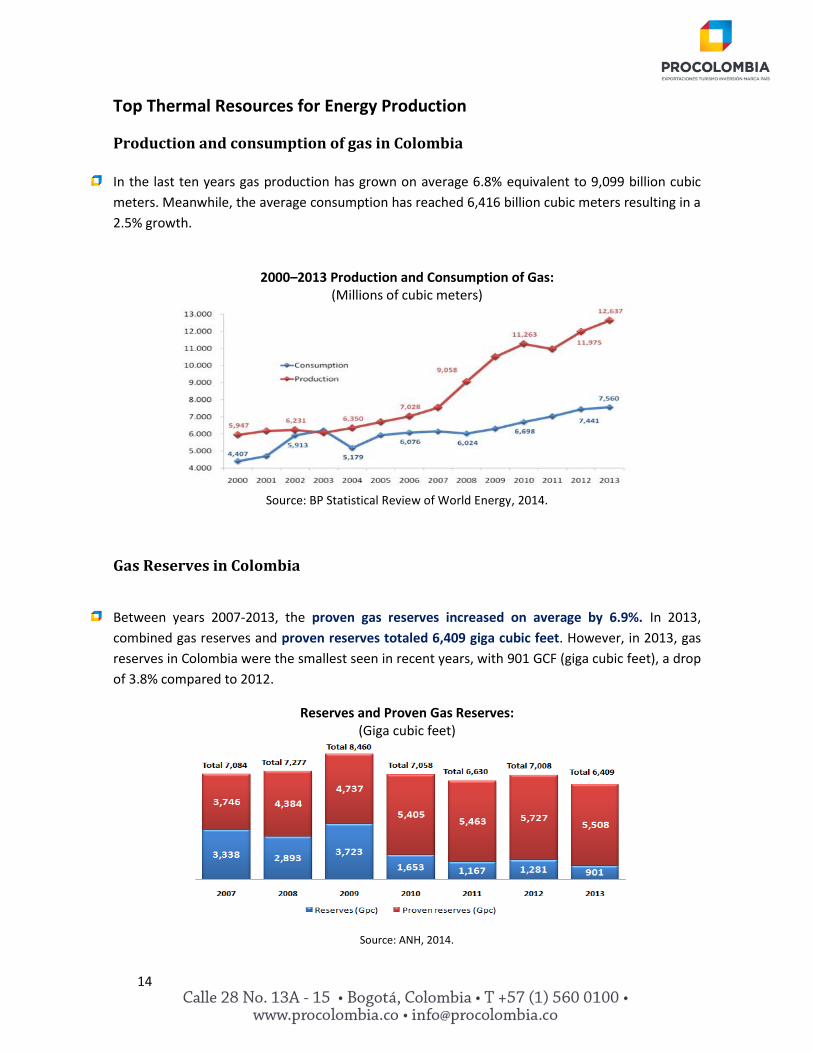
Production and consumption of gas in Colombia
In the last ten years gas production has grown on average 6.8% equivalent to 9,099 billion cubic
meters. Meanwhile, the average consumption has reached 6,416 billion cubic meters resulting in a
2.5% growth.
2000–2013 Production and Consumption of Gas: (Millions of cubic meters)
Source: BP Statistical Review of World Energy, 2014.
Gas Reserves in Colombia
Between years 2007-2013, the proven gas reserves increased on average by 6.9%. In 2013,
combined gas reserves and proven reserves totaled 6,409 giga cubic feet. However, in 2013, gas
reserves in Colombia were the smallest seen in recent years, with 901 GCF (giga cubic feet), a drop
of 3.8% compared to 2012.
Reserves and Proven Gas Reserves: (Giga cubic feet)
Source: ANH, 2014.
15
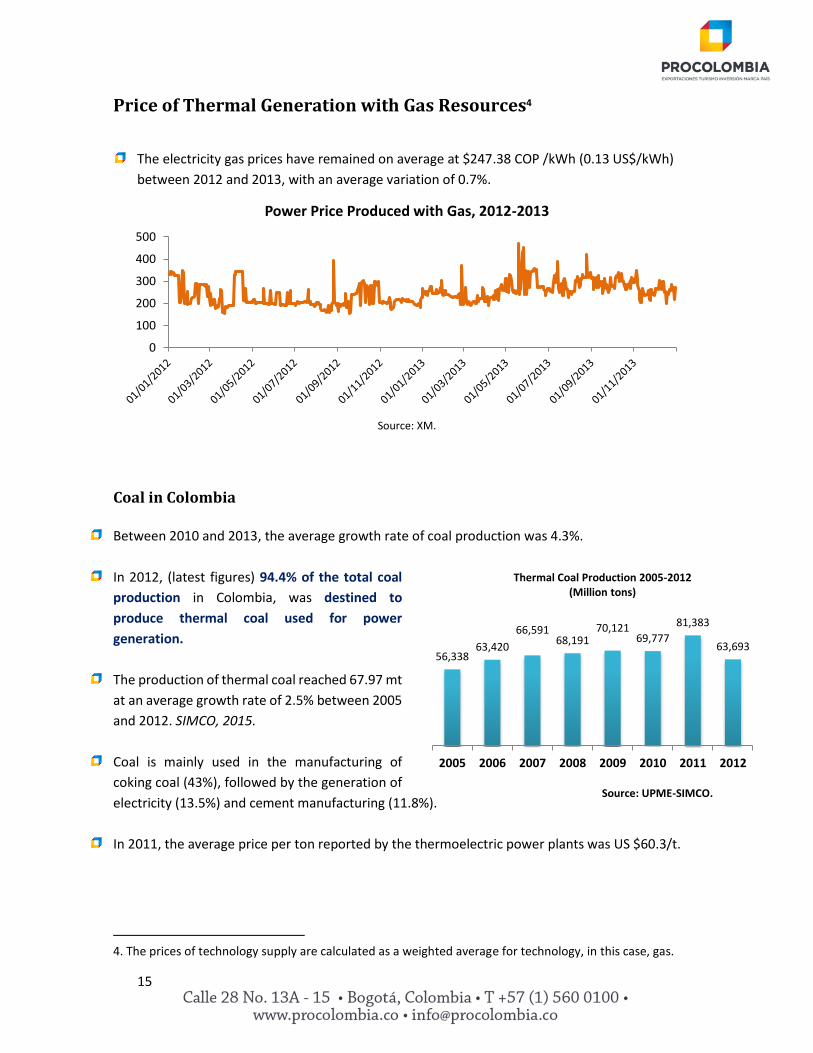
Price of Thermal Generation with Gas Resources4
The electricity gas prices have remained on average at $247.38 COP /kWh (0.13 US$/kWh)
between 2012 and 2013, with an average variation of 0.7%.
Source: XM.
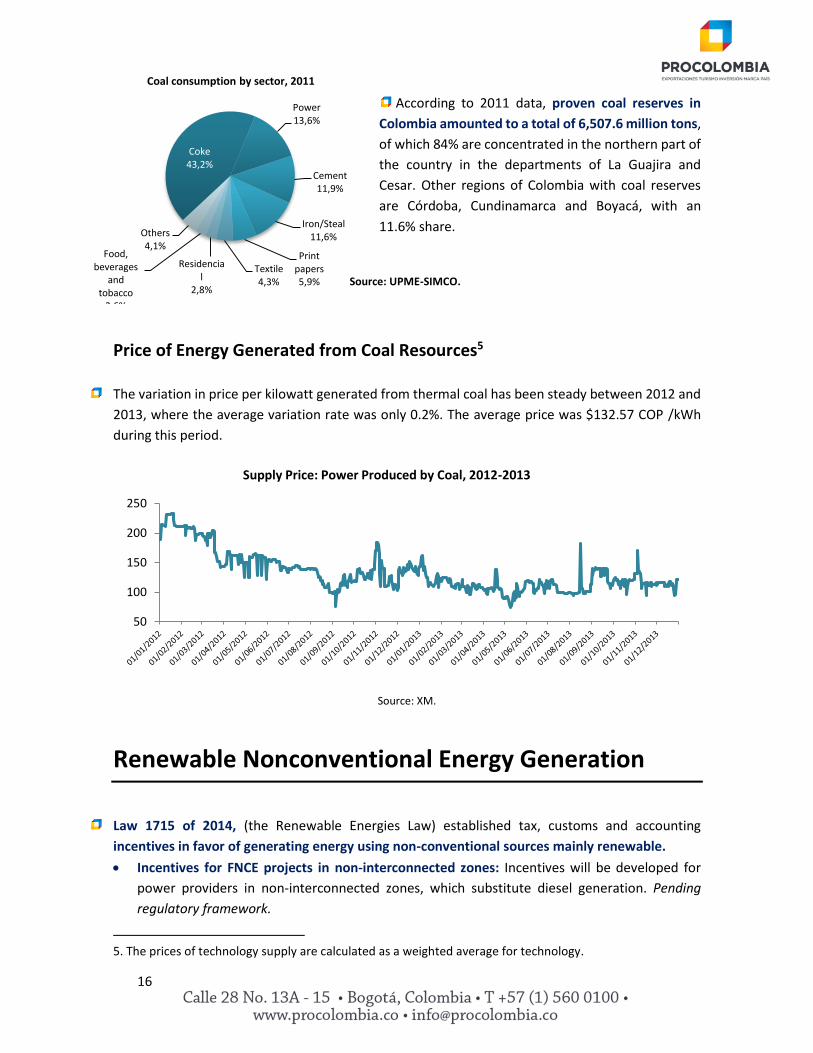
Coal in Colombia
Between 2010 and 2013, the average growth rate of coal production was 4.3%.
In 2012, (latest figures) 94.4% of the total coal
production in Colombia, was destined to
produce thermal coal used for power
generation.
The production of thermal coal reached 67.97 mt
at an average growth rate of 2.5% between 2005
and 2012. SIMCO, 2015.
Coal is mainly used in the manufacturing of
coking coal (43%), followed by the generation of
electricity (13.5%) and cement manufacturing (11.8%).
In 2011, the average price per ton reported by the thermoelectric power plants was US $60.3/t.
4. The prices of technology supply are calculated as a weighted average for technology, in this case, gas.
0
100
200
300
400
500
Power Price Produced with Gas, 2012-2013
Source: UPME - SIMCO
Fuente: ANH
56,33863,420
66,59168,191
70,12169,777
81,383
63,693
2005 2006 2007 2008 2009 2010 2011 2012
Thermal Coal Production 2005-2012(Million tons)
Source: UPME-SIMCO.
16
According to 2011 data, proven coal reserves in
Colombia amounted to a total of 6,507.6 million tons,
of which 84% are concentrated in the northern part of
the country in the departments of La Guajira and
Cesar. Other regions of Colombia with coal reserves
are Córdoba, Cundinamarca and Boyacá, with an
11.6% share.
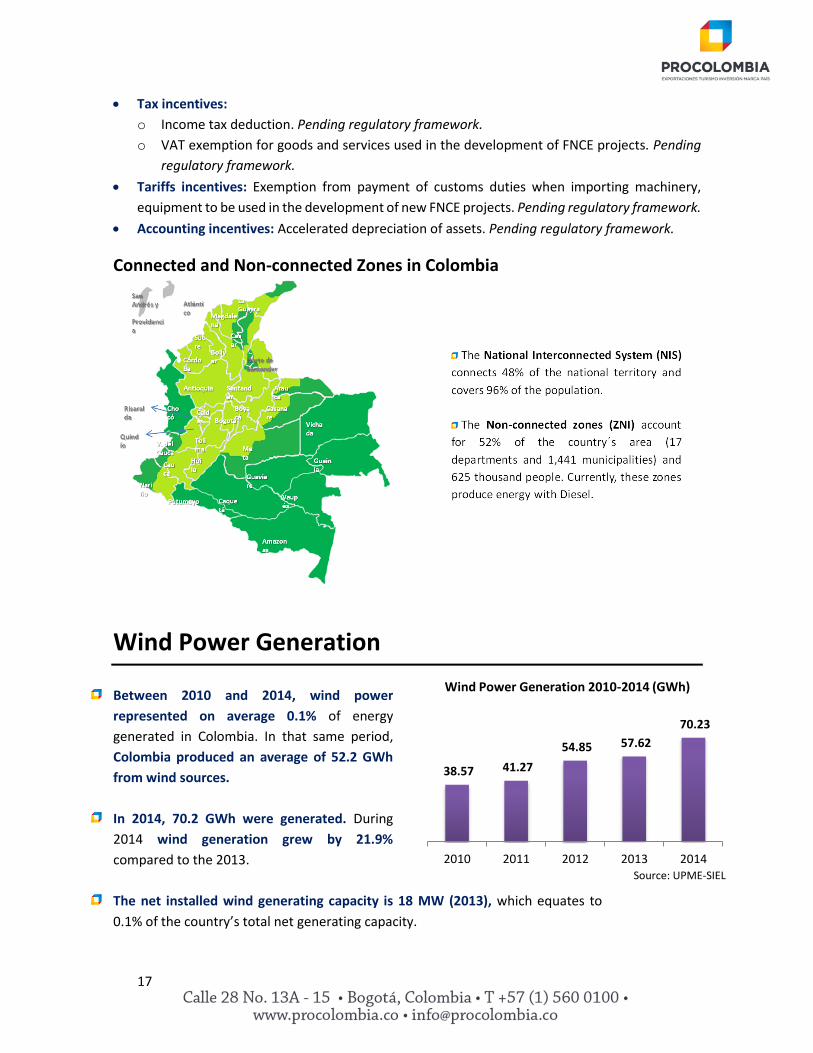
Price of Energy Generated from Coal Resources5
The variation in price per kilowatt generated from thermal coal has been steady between 2012 and
2013, where the average variation rate was only 0.2%. The average price was $132.57 COP /kWh
during this period.
Source: XM.
Renewable Nonconventional Energy Generation
Law 1715 of 2014, (the Renewable Energies Law) established tax, customs and accounting
incentives in favor of generating energy using non-conventional sources mainly renewable.
Incentives for FNCE projects in non-interconnected zones: Incentives will be developed for
power providers in non-interconnected zones, which substitute diesel generation. Pending
regulatory framework.
5. The prices of technology supply are calculated as a weighted average for technology.
50
100
150
200
250
Supply Price: Power Produced by Coal, 2012-2013
Source: UPME-SIMCO.
Coke43,2%
Power13,6%
Cement11,9%
Iron/Steal11,6%
Print papers5,9%
Textile4,3%
Residencial
2,8%
Food, beverages
and tobacco
2,6%
Others4,1%
Coal consumption by sector, 2011
17
Tax incentives:
o Income tax deduction. Pending regulatory framework.
o VAT exemption for goods and services used in the development of FNCE projects. Pending
regulatory framework.
Tariffs incentives: Exemption from payment of customs duties when importing machinery,
equipment to be used in the development of new FNCE projects. Pending regulatory framework.
Accounting incentives: Accelerated depreciation of assets. Pending regulatory framework.
Connected and Non-connected Zones in Colombia
Wind Power Generation
Between 2010 and 2014, wind power
represented on average 0.1% of energy
generated in Colombia. In that same period,
Colombia produced an average of 52.2 GWh
from wind sources.
In 2014, 70.2 GWh were generated. During
2014 wind generation grew by 21.9%
compared to the 2013.
The net installed wind generating capacity is 18 MW (2013), which equates to
0.1% of the country’s total net generating capacity.
38.57 41.27
54.85 57.62
70.23
2010 2011 2012 2013 2014
Wind Power Generation 2010-2014 (GWh)
Source: UPME-SIEL
18
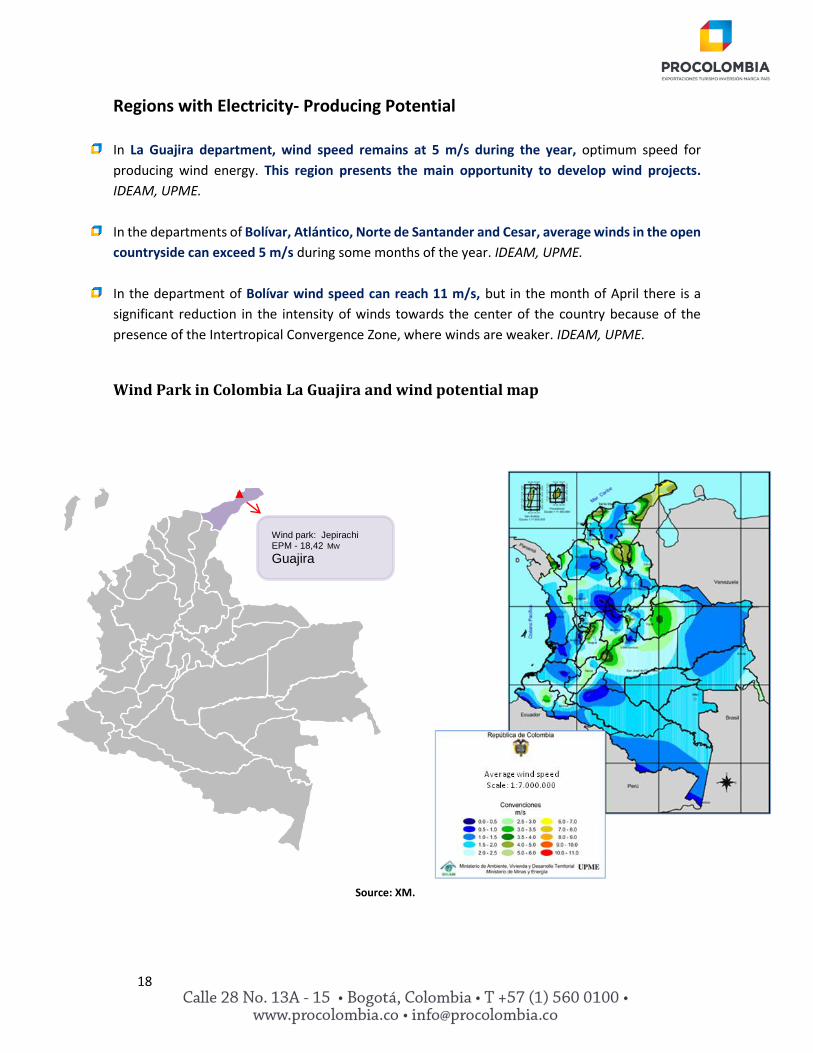
Regions with Electricity- Producing Potential
In La Guajira department, wind speed remains at 5 m/s during the year, optimum speed for
producing wind energy. This region presents the main opportunity to develop wind projects.
IDEAM, UPME.
In the departments of Bolívar, Atlántico, Norte de Santander and Cesar, average winds in the open
countryside can exceed 5 m/s during some months of the year. IDEAM, UPME.
In the department of Bolívar wind speed can reach 11 m/s, but in the month of April there is a
significant reduction in the intensity of winds towards the center of the country because of the
presence of the Intertropical Convergence Zone, where winds are weaker. IDEAM, UPME.
Wind Park in Colombia La Guajira and wind potential map
Source: XM.
Wind park: Jepirachi EPM - 18,42 MW Guajira
19
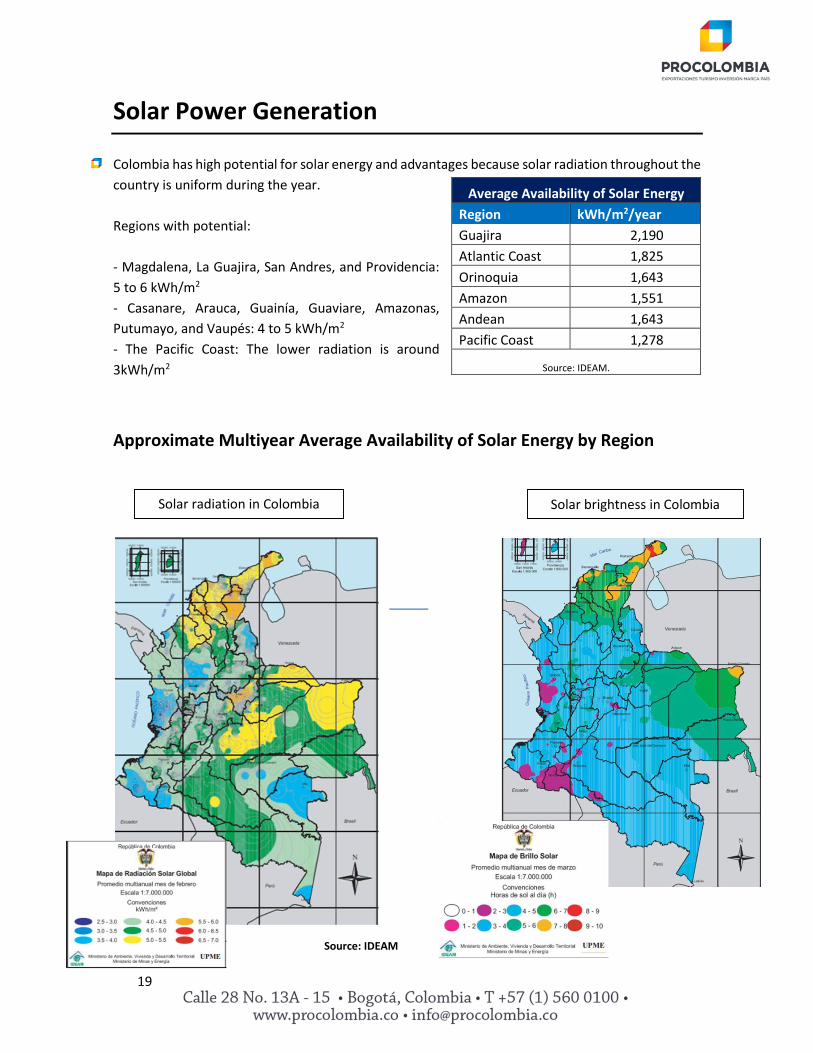
Solar Power Generation
Colombia has high potential for solar energy and advantages because solar radiation throughout the
country is uniform during the year.
Regions with potential:
- Magdalena, La Guajira, San Andres, and Providencia:
5 to 6 kWh/m2
- Casanare, Arauca, Guainía, Guaviare, Amazonas,
Putumayo, and Vaupés: 4 to 5 kWh/m2
- The Pacific Coast: The lower radiation is around
3kWh/m2
Approximate Multiyear Average Availability of Solar Energy by Region
Average Availability of Solar Energy
Region kWh/m2/year
Guajira 2,190
Atlantic Coast 1,825
Orinoquia 1,643
Amazon 1,551
Andean 1,643
Pacific Coast 1,278
Source: IDEAM.
Solar radiation in Colombia
(average)
Solar brightness in Colombia
(average)
Source: IDEAM
20
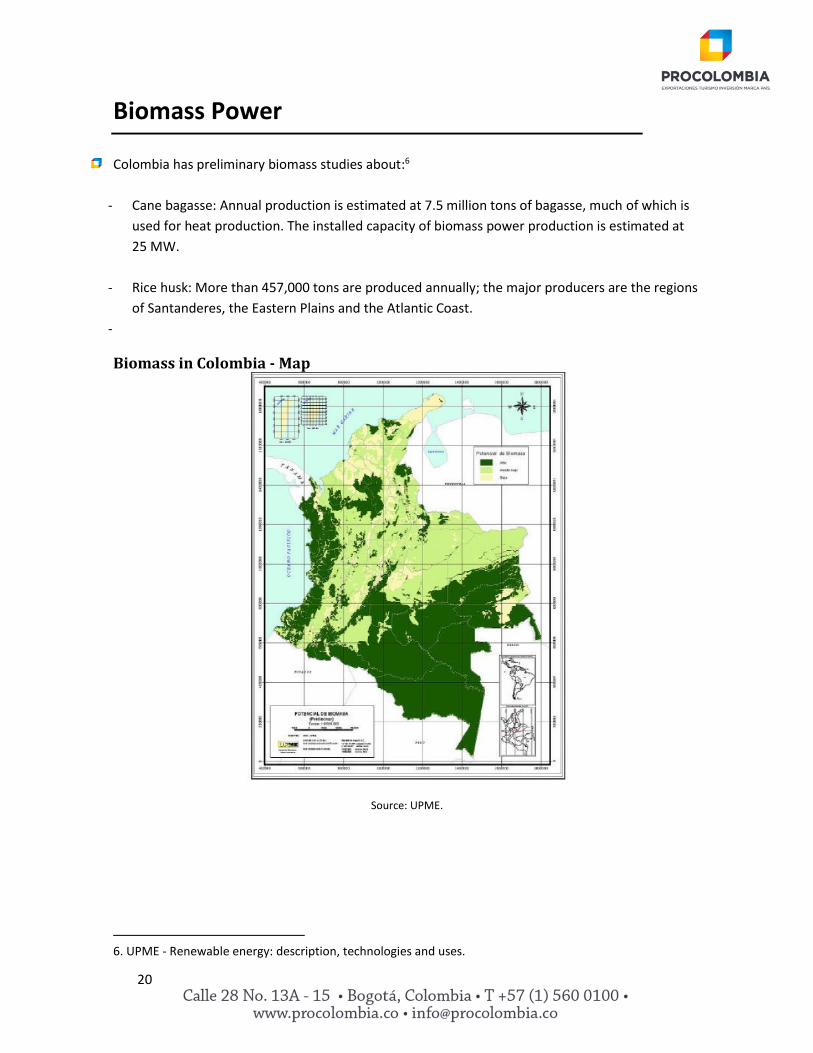
Biomass Power
Colombia has preliminary biomass studies about:6
- Cane bagasse: Annual production is estimated at 7.5 million tons of bagasse, much of which is
used for heat production. The installed capacity of biomass power production is estimated at
25 MW.
- Rice husk: More than 457,000 tons are produced annually; the major producers are the regions
of Santanderes, the Eastern Plains and the Atlantic Coast.
-
Biomass in Colombia - Map
Source: UPME.
6. UPME - Renewable energy: description, technologies and uses.
Source: IDEAM
21
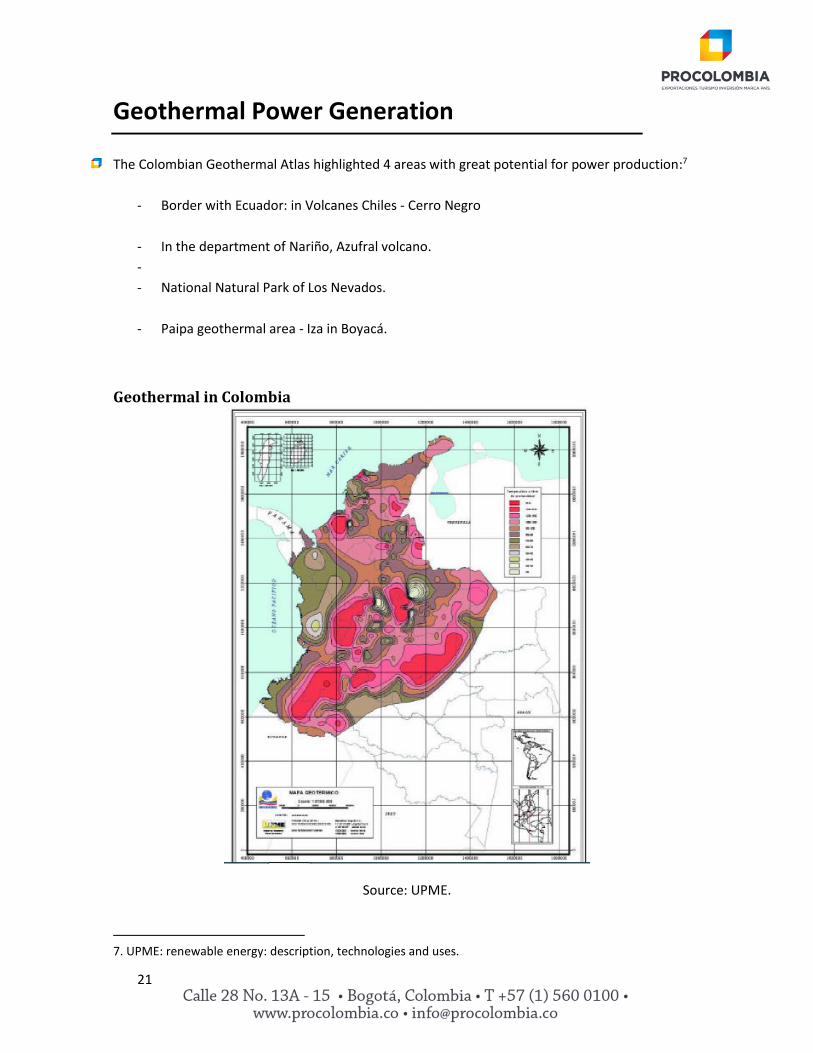
Geothermal Power Generation
The Colombian Geothermal Atlas highlighted 4 areas with great potential for power production:7
- Border with Ecuador: in Volcanes Chiles - Cerro Negro
- In the department of Nariño, Azufral volcano.
-
- National Natural Park of Los Nevados.
- Paipa geothermal area - Iza in Boyacá.
Geothermal in Colombia
Source: UPME.
7. UPME: renewable energy: description, technologies and uses.
22
Bibliography
Business Monitor International
UPME (Unidad de Planeación Minero Energética) En: Plan de expansión de referencia
generación - Trasmisión 2014-2018. "Expansion and plan reference of power generation
and transmission, 2014-2018.
UPME: Energías Renovables: descripción, tecnologías y usos finales. Renewable energy:
description, technologies and uses.
SIEL: Sistema de información de energía eléctrica - Electric power information system.
SIPG: Sistema de información de petróleo y gas - Oil and gas information system.
XM: Informe de operación del SIN y administración del mercado. INS operation
information.
BP: Statistical review of world energy, June 2014.
IDEAM: Atlas de viento y energía eólica de Colombia y Atlas de radicación solar en
Colombia - Wind and wind energy atlas in Colombia and solar radiation atlas in Colombia.
Front photo: © Alfonso Giraldo – Photography.

23
The information contained in this document is for orientation and general guidance only. In no
event PROEXPORT or its employees would be liable to you or anyone else for any decision made or
action taken in reliance on the information provided.
This memo reflects the valid Colombian legislation at the date it was sent and it seeks to provide
general and basic information of the Colombian law. This message does not represent or replace
legal counsel of a specific or particular matter. Such legal counsel must be obtained from
specialized legal services. To that effect, we suggest that you contact any of the law firms that can
be found in the Legal Services Directory located on the webpage of PROEXPORT.
www.procolombia.co