power increase - nautel supportsupport.nautel.com/content/user_files/sites/2/2018/07/... ·...
TRANSCRIPT
Power IncreaseReality in 2010
HD Radio is a trademark of iBiquity Digital Corp
Tampa-St. Petersburg SBE Chapter 39
February 11, 2010
Gary Liebisch, CPBE
Nautel East Regional Sales Mgr.

Power Increase Timeline
• Early 2007 Experimental Period testing of -10 dBc• 2007 – FCC issues 9 STAs for -10 dBc testing• June 10, 2008 “Joint Parties” and iBiquity request power increase• July 18, 2008 – NPR Labs DRCIA Report: 1% inadequate, 10% more
than adequate but interference potential identified• Oct 23, 2008 – FCC issues Public Notice seeking comment on increase• April, 2009 – NPR Labs develops “metric” for determining interference• May 22, 2009 – FCC issues 2nd Public Notice – more specific on
objectives: defer or not defer until NPR studies done?• Nov 4, 2009 – NPR Labs submits AICCS Report to FCC – Impact on
listeners to interference in the mobile environment• Nov 5, 2009 –iBiquity and NPR Labs jointly submit 5-point proposal to
FCC

Key Points of Report & Order
• Blanket 6 dB for all stations except “Super B”• Beyond 6 dB, up to 10 dB, subject to formula
developed by NPR Labs• Established procedures for remediating harmful
interference cases above -20 dBc• FCC may revisit the issue if widespread interference
results• Asymmetrical sidebands not specifically addressed,
but it would presumably be compliant with established interference criteria in the R&O.

Adjacent Channel Protection
PROTECTED
-60 dBu
-57 dBu(50,10)
(50,50)
-54 dBu
>51.2 dBu: -14 dBc<49.5 dBu: -10 dBc
PROPONENT
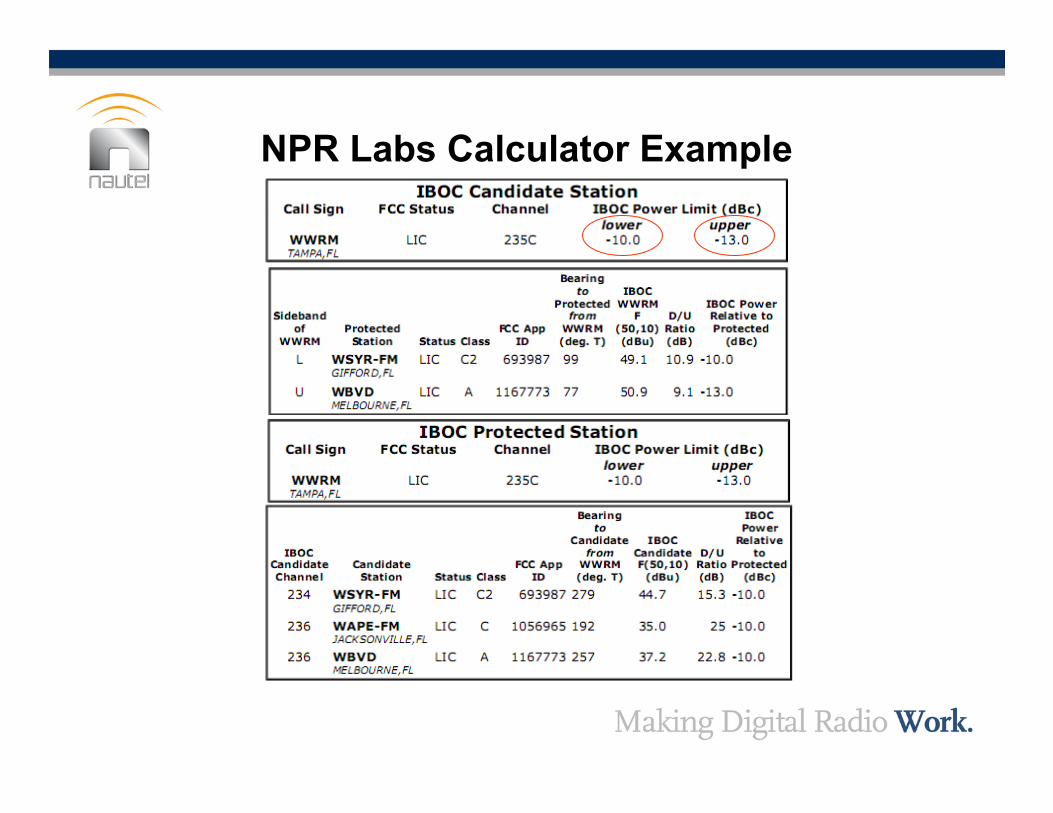
NPR Labs Calculator Example

TAMPA-ST. PETERSBURG MARKET
WWRMWQYK*WUSFWXGLWFUSWSUNWHPTWPOIWSJTWLLDWRBQWBTPWXTBWFLZWBVMWMTX
WMNFWDUVWYUU-14 dBc (both SB)Asymmetrical-10 dBc (both SB)
* -10.3 and -10
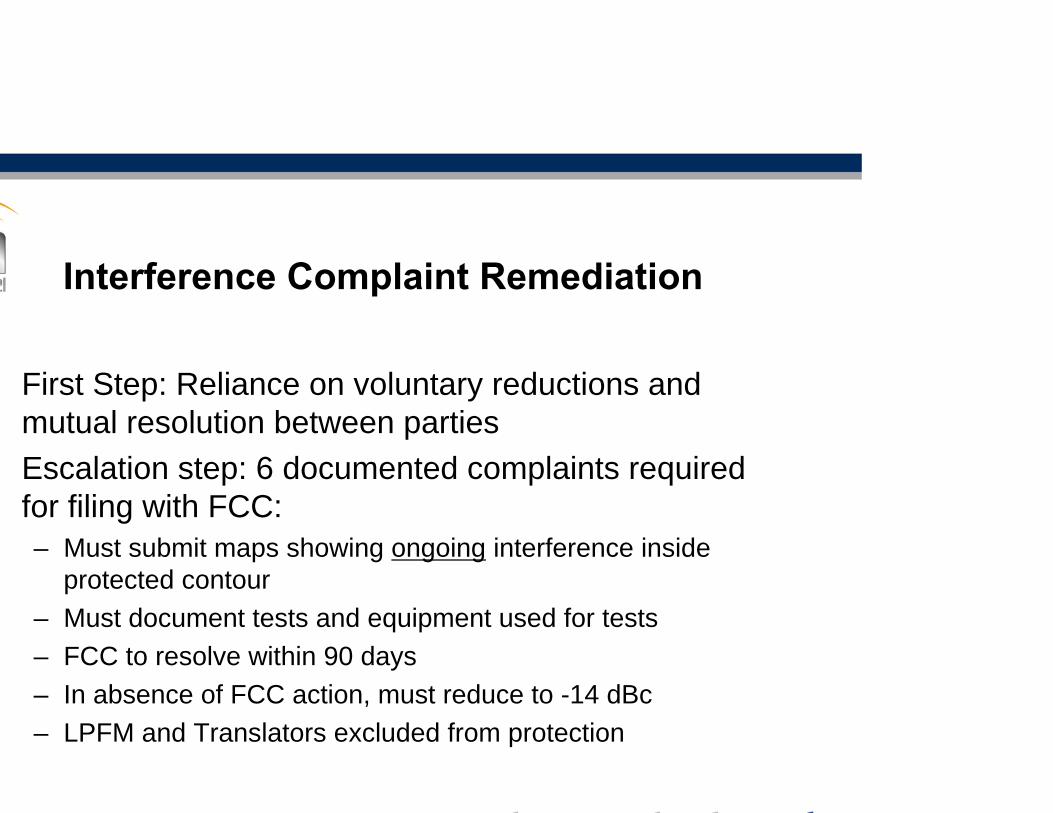
Interference Complaint Remediation
First Step: Reliance on voluntary reductions and mutual resolution between partiesEscalation step: 6 documented complaints required for filing with FCC:– Must submit maps showing ongoing interference inside
protected contour– Must document tests and equipment used for tests– FCC to resolve within 90 days– In absence of FCC action, must reduce to -14 dBc– LPFM and Translators excluded from protection
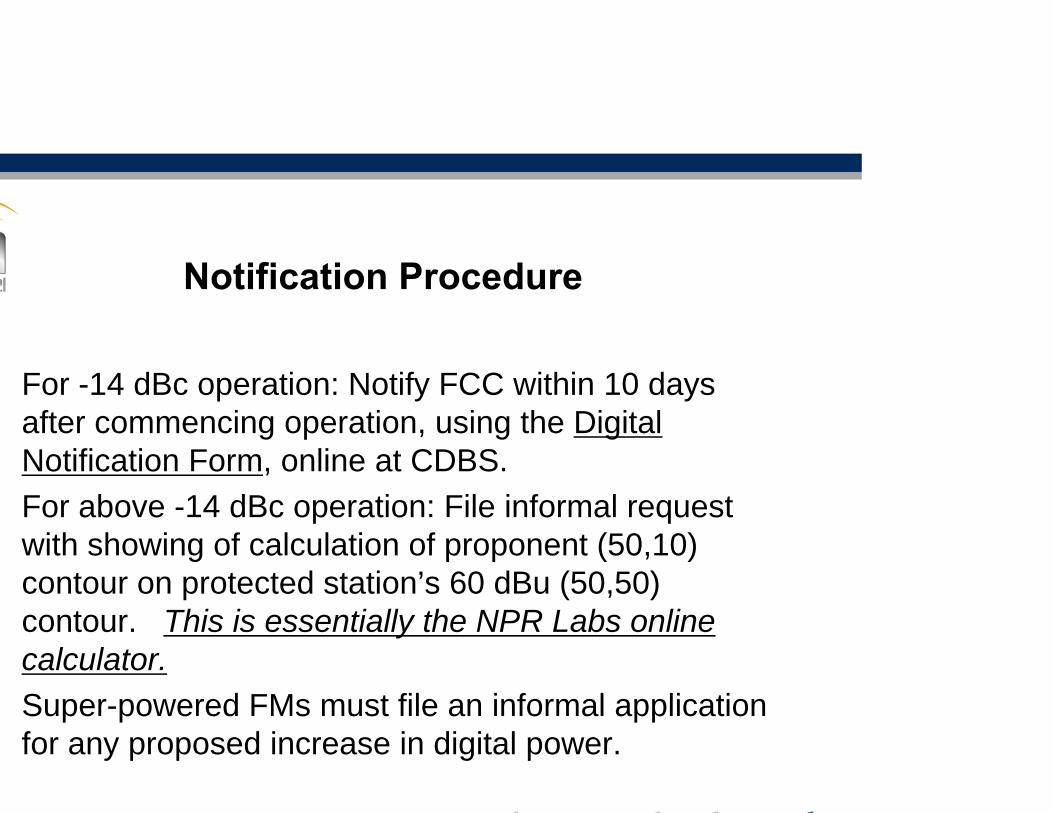
Notification Procedure
For -14 dBc operation: Notify FCC within 10 days after commencing operation, using the Digital Notification Form, online at CDBS.For above -14 dBc operation: File informal request with showing of calculation of proponent (50,10) contour on protected station’s 60 dBu (50,50) contour. This is essentially the NPR Labs online calculator.Super-powered FMs must file an informal application for any proposed increase in digital power.

Changes in Implementation Methods
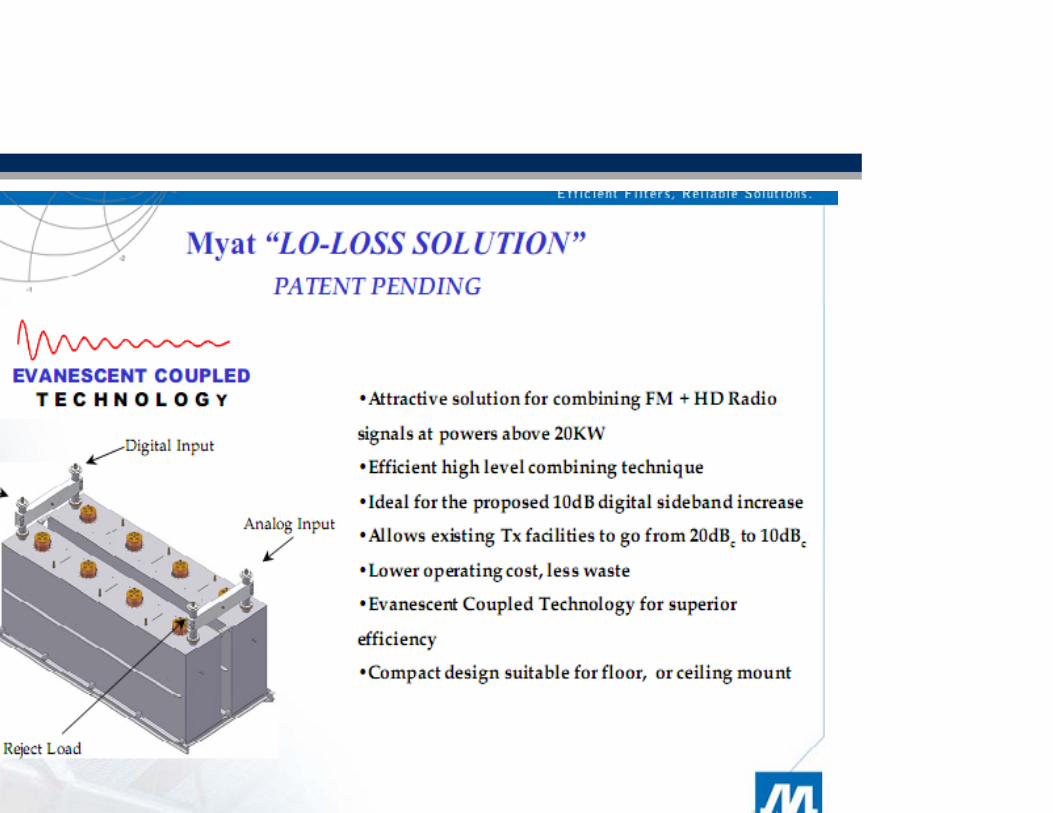
Low Loss Combining(sharp tuned filters)
Common Amp/ Low Level with headroom/de-rating factors
Common Amp/Low Level
Space Combined (improved interleaved, and dual input)
Space Combined
Change or remove combinerHigh Level/Split Level*
-14 / -10 dBc Combining Options
20 dBc Combining Options
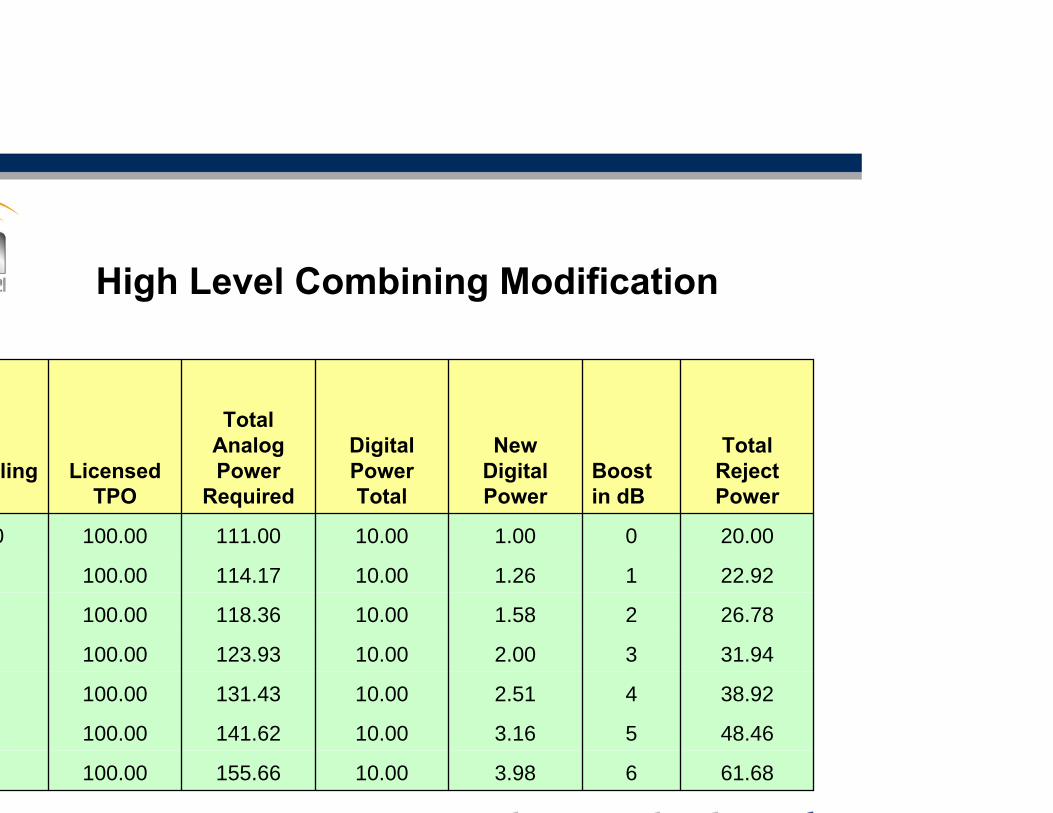
High Level Combining Modification
61.6863.9810.00155.66100.00
48.4653.1610.00141.62100.00
38.9242.5110.00131.43100.00
31.9432.0010.00123.93100.00
26.7821.5810.00118.36100.00
22.9211.2610.00114.17100.00
20.0001.0010.00111.00100.000
Total Reject Power
Boost in dB
New Digital Power
Digital Power Total
Total Analog Power
RequiredLicensed
TPOling
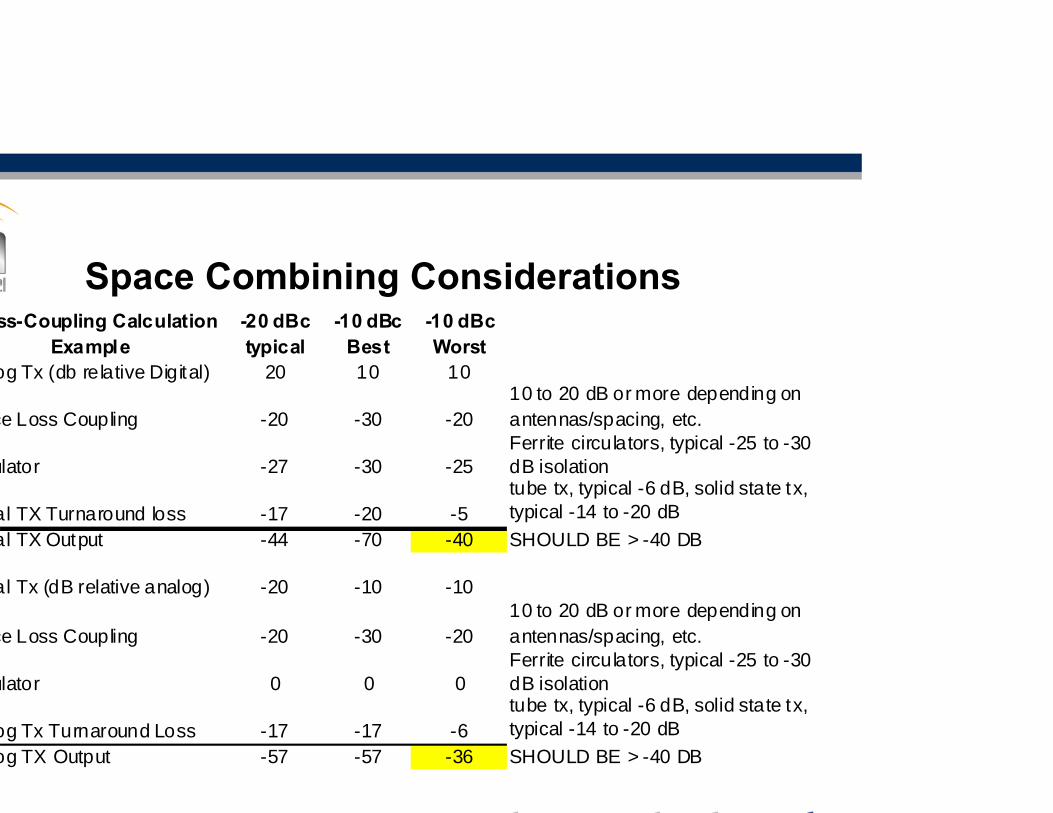
Space Combining Considerationsss-Coupling Calculation
Example-20 dBc typical
-10 dBc Best
-10 dBc Worst
og Tx (db relative Digital) 20 10 10
ce Loss Coupling -20 -30 -2010 to 20 dB or more depending on antennas/spacing, etc.
ulator -27 -30 -25Ferrite circulators, typical -25 to -30 dB isolation
al TX Turnaround loss -17 -20 -5tube tx, typical -6 dB, solid state tx, typical -14 to -20 dB
al TX Output -44 -70 -40 SHOULD BE > -40 DB
al Tx (dB relative analog) -20 -10 -10
ce Loss Coupling -20 -30 -2010 to 20 dB or more depending on antennas/spacing, etc.
ulator 0 0 0Ferrite circulators, typical -25 to -30 dB isolation
og Tx Turnaround Loss -17 -17 -6tube tx, typical -6 dB, solid state tx, typical -14 to -20 dB
og TX Output -57 -57 -36 SHOULD BE > -40 DB

Full Wave vs. Half Wave Antennas
Low Loss Combining

23,000
Model -20dB -18dB -16dB -14db -12dB -10dBNV3.5 3,375 3,206 3,038 2,700 2,312 1,941NV5 4,500 4,275 4,050 3,600 3,083 2,588
NV7.5 6,750 6,413 6,075 5,400 4,624 3,881NV10 9,000 8,550 8,100 7,200 6,165 5,175NV15 13,500 12,825 12,150 10,800 9,248 7,763NV20 18,000 17,100 16,200 14,400 12,330 10,350NV30 27,000 25,650 24,300 21,600 18,495 15,525NV40 36,000 34,200 32,400 28,800 24,660 20,700NV60 54,000 51,300 48,600 43,200 36,990 31,050NV80 72,000 68,400 64,800 57,600 49,320 41,400
All specifications subject to change. Rev 11/26/09 CWKAll estimates based on VSWR < 1.05:1, 3dB headroom to HD mask, and current NRSC measurement recommendations.For example, if you enter 11,000 as the Analog TPO, the cells highlighted in Green indicate the Transmitter Model / Injection level combinations that are possible with the standard transmitter. Blue cells indicate combinations which requires the useof HD PowerBoost and Yellow cells indicate the need to upgrade the transmitter via an in-cabinet upgrade.
Capable of meeting injection level at that Analog TPO with in-cabinet upgrade
HD Radio Injection Level Analysis Tool
HD Injection Level / Analog TPO
Capable of meeting injection level at that Analog TPOCapable of meeting injection level at that Analog TPO with HD PowerBoost
Enter analog TPO here in watts →

Attention to Specifications
Comb FM (TPO) IBOCNV 3.75 2,184 1,985 199NV 5 2,912 2,647 265NV 7.5 4,368 3,971 397NV 10 5,824 5,294 529NV 15 8,736 7,941 794NV 20 11,647 10,589 1,059NV 30 17,471 15,883 1,588NV 40 23,295 21,177 2,118
#Model -10
• Keep in mind the relationship between combined total RMS power, and available analog FM TPO.

Efficiency vs. Injection Level for Common Amp (Low Level)
Nautel NV Series
30.0%35.0%40.0%45.0%50.0%55.0%60.0%65.0%
-20 -18 -16 -14 -12 -10
Injection Level
Effic
ienc
y_
88 Mhz98 Mhz

Factors That Can Improve De-rating
Peak-to-Average Power Ratio Reduction (PAPR) such as Nautel PowerBoost™, can yield an addition 1 to 1.3 dB in available analog powerAsymmetrical sideband technology – optimizes power in upper and lower sidebands.
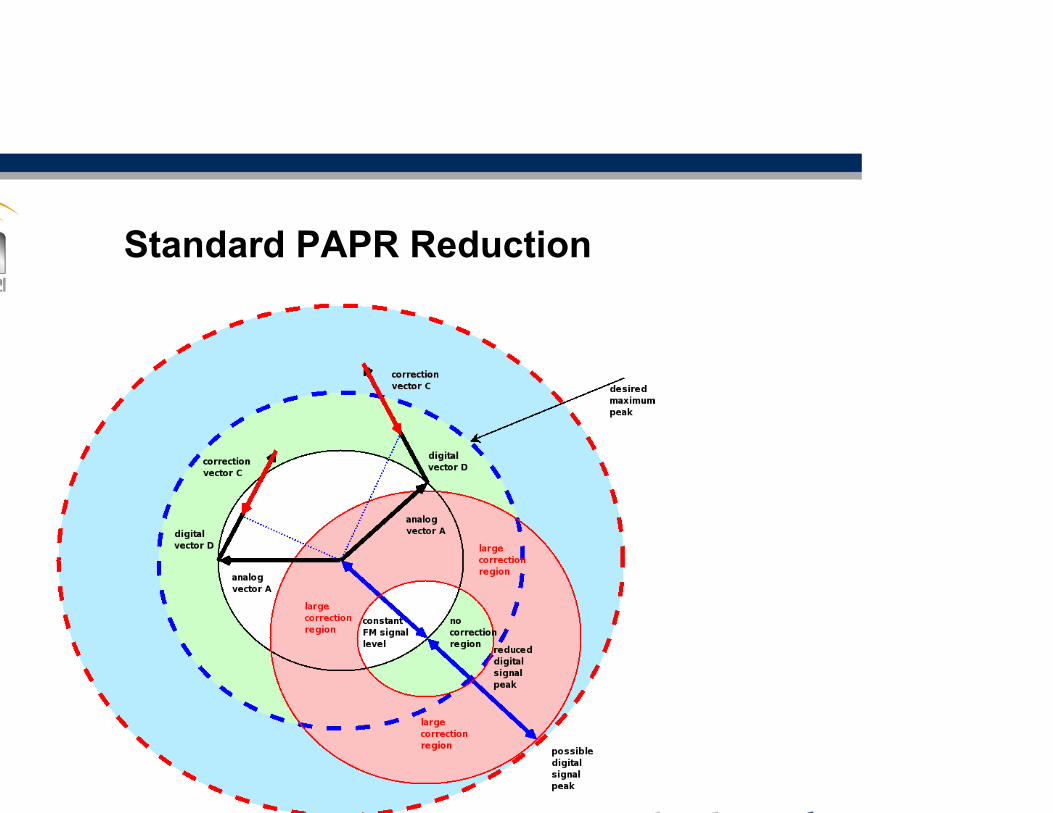
Standard PAPR Reduction
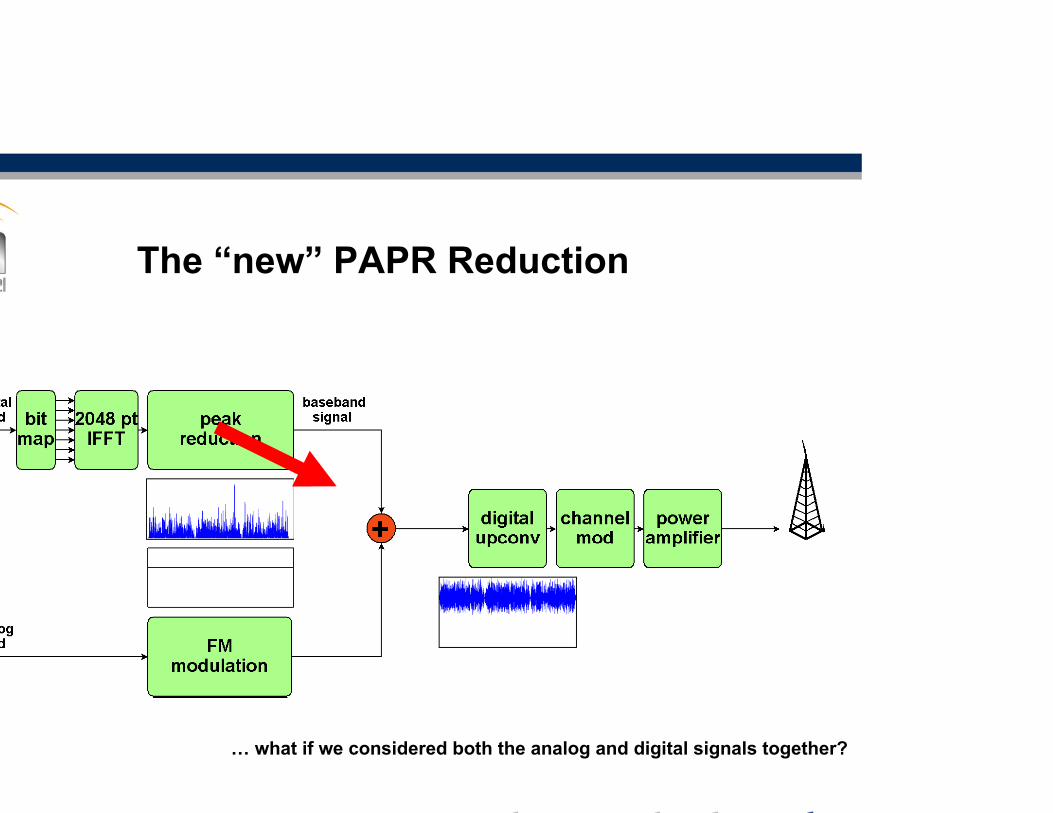
The “new” PAPR Reduction
… what if we considered both the analog and digital signals together?

Nautel PowerBoost™ PAPR
Factors That Can Degrade De-rating
Tube vs. Solid State – Tubes generally de-rate faster as injection approaches -10 dBc
Extended hybrid modes – Depending on the Mode (MP2, MP3, MP11,etc.), may require 10% to 40% additional DIGITAL power due to additional carriers

Extended Hybrid Modes
Analog FM Signal
198 kHz129 kHzChannel Center
PrimaryPrimary
Upper DigitalSideband
Extended
MainMainExtended
102 kHz
-198 kHz -129 kHz
-102 kHz
10frequency partitions
10frequency partitions
1, 2, or 4frequencypartitions
1, 2, or 4frequencypartitions
Lower DigitalSideband

Considerations for Extended Hybrid Modes
• MP2 uses 10% more carriers than MP1 (1 additional pair of partitions), and adds 12.4 kbps.
• MP3 uses 20% more carriers than MP1 2 additional pairs of partitions), and adds 24.8 kbps.
• Additional carriers further de-rate analog capability.
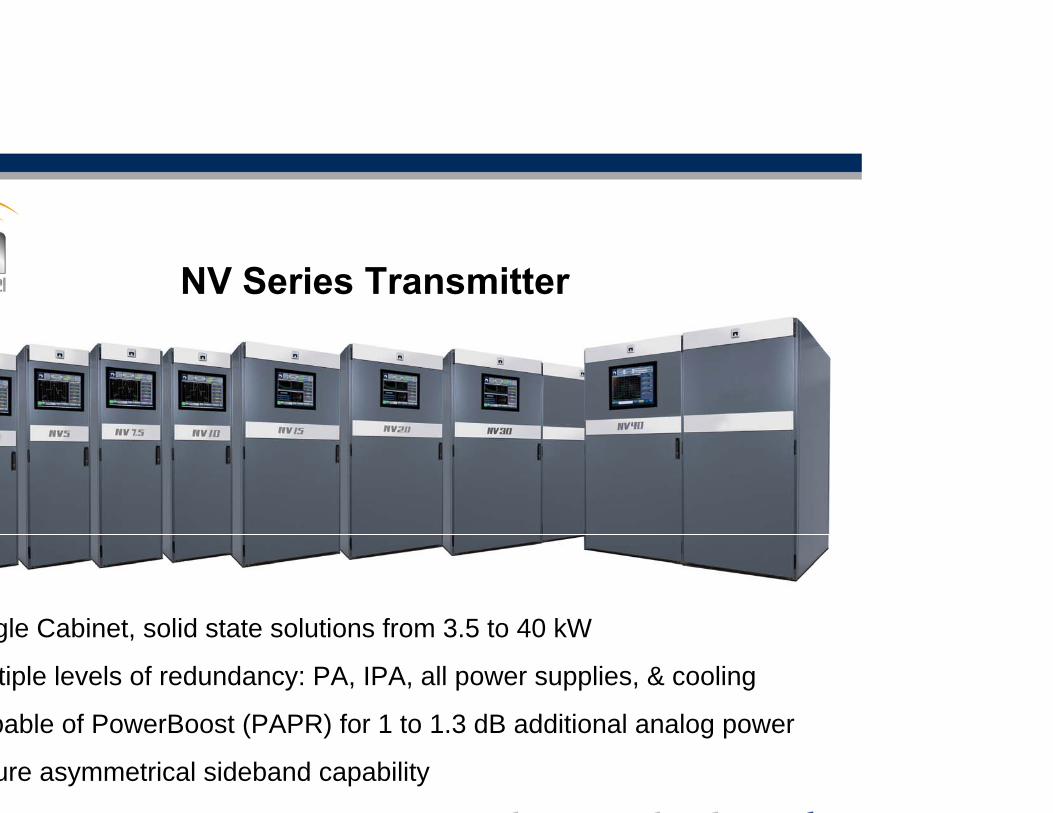
NV Series Transmitter
gle Cabinet, solid state solutions from 3.5 to 40 kW
tiple levels of redundancy: PA, IPA, all power supplies, & cooling
pable of PowerBoost (PAPR) for 1 to 1.3 dB additional analog power
ure asymmetrical sideband capability

Thank You!
Gary LiebischNAUTEL
Eastern Regional Sales Mgr.Milford, OH
[email protected](513) 576-6400