power management for an electrified bus undergraduate
TRANSCRIPT

Power Management for an Electrified Bus
UNDERGRADUATE HONORS THESIS
Presented in Partial Fulfillment of the Requirements for Graduation with
Distinction in Mechanical Engineering
By
Christopher Stanislovaitis
Honors Program in Mechanical Engineering
The Ohio State University
April 2014
Thesis Committee:
Dr. Giorgio Rizzoni, Advisor
Dr. Shawn Midlam-Mohler

Copyright by
Christopher Stanislovaitis
2014

ii
ABSTRACT
Transit buses are the most important form of public transportation, and there is a
continuing effort to make them more fuel efficient to reduce their economic and
environmental footprint. One means of improving the fuel economy of buses is by
replacing fuel consumed to power the vehicle and its accessory loads with electricity.
This can be accomplished by way of hybrid powertrains (hybrid-electric buses are a
common sight today), and by managing the accessory loads in a more efficient manner.
The focus of the research carried out in this project pertains to the increasing
electrification of buses. This electrification has created a high demand for additional
electrical energy to power accessory loads such as air conditioning, and air compressors.
Conventional buses use multiple alternators to supply the additional energy. In this
project we explore the possibility of using a single, larger electrical generator and an
optimal power management strategy to service the accessory loads more efficiently. An
important step in the process of developing a power management strategy is to develop
efficiency models of each of the subsystems to be managed. Efficiency models are
developed to understand the power consumption of fans, air conditioners, air
compressors, and power steering pumps, and these models are incorporated into a
computational model that includes the engine and all of its loads. The mathematical and

iii
computational models developed will make it possible to increase the overall efficiency
of a bus by enabling the design of optimal power management strategies. Results of
simulations show that while there isn’t a difference in fuel economy between a
conventional and electrified bus, adding regenerative breaking can increase fuel economy
by 13%. Buses are high mileage vehicles, so increases in fuel efficiency are extremely
important and make large differences in the amount of fuel used. This reduces the
economic and environmental impact of buses.

iv
ACKNOWLEDGEMENTS
First, I would like to thank my advisor, Giorgio Rizzoni. He not only guided me
through this entire process, answering any and every question I had, but also used his
connections to help me find a job this summer.
I would also like to thank Qadeer Ahmed, who spent hours looking at Matlab
code and Simulink diagrams with me, even taking time out of his day on a Sunday to help
me. Without him, I would never have solved many of the problems I faced with the
simulator.
Finally, I would like to thank Lorenzo Serrao, although I have never met him. The
simulator he built during his time at Ohio State saved me countless hours of modeling,
and the detail level in his simulator manual allowed me to understand how it operated
without spending an excessive amount of time staring at a computer screen.

v
TABLE OF CONTENTS
ABSTRACT ........................................................................................................................ ii
ACKNOWLEDGEMENTS ............................................................................................... iv
TABLE OF CONTENTS .................................................................................................... v
LIST OF TABLES ............................................................................................................. vi
LIST OF FIGURES .......................................................................................................... vii
CHAPTER 1: INTRODUCTION ....................................................................................... 1
1.1 Motivation............................................................................................................... 1 1.2 Background Research ............................................................................................. 4 1.3 Overview of Thesis ................................................................................................. 7
CHAPTER 2: PROJECT BACKGROUND ....................................................................... 7
2.1 Powertrain Architecture .......................................................................................... 7
2.2 Project Objectives ................................................................................................... 9 2.3 Project Methods .................................................................................................... 10
CHAPTER 3: ACCESSORIES......................................................................................... 10
3.1 Functional Analysis of Accessories ...................................................................... 10
3.2 Energy Modeling of Accessories .......................................................................... 19
CHAPTER 4: SIMULATIONS ........................................................................................ 30
4.1 Vehicle Simulator ................................................................................................. 30 4.2 Simulation Results ................................................................................................ 33
CHAPTER 5: CONCLUSION ......................................................................................... 38
5.1 Significance of Work ............................................................................................ 38 5.2 Future Work .......................................................................................................... 39
vi
LIST OF TABLES
Table 1- Current Drawn to Power Fan at Rated Speeds [15] ........................................... 22
Table 2- Bus Parameters ................................................................................................... 30
Table 3- Fuel Economy ..................................................................................................... 38
vii
LIST OF FIGURES
Figure 1- World Energy Consumption [1] .......................................................................... 1
Figure 2- Energy Flow Trends [2] ...................................................................................... 2
Figure 3- Passenger Miles Traveled [3] .............................................................................. 3
Figure 4- Transmission-Based Hybrid [4] .......................................................................... 4
Figure 5- Engine Based Hybrid Electric Bus [7] ................................................................ 6
Figure 6- Powertrain Architecture ...................................................................................... 7
Figure 7- Permanent Magnet Synchronous Generator ...................................................... 11
Figure 8- EMP MINI-HYBRID GenIII ............................................................................ 12
Figure 9- Air Compressor [13] ......................................................................................... 13
Figure 10- Power Steering Hydraulic Pump [12] ............................................................. 14
Figure 11- Vapor Compression Cycle for an HVAC [14] ................................................ 15
Figure 12- HVAC Diagram .............................................................................................. 16

viii
Figure 13- Square Wave to a Sin Wave ............................................................................ 18
Figure 14- Accessory Black Box Model ........................................................................... 19
Figure 15- Fan Torque Demand vs Operational Speed .................................................... 23
Figure 16- Air Compressor Torque Demand [9] .............................................................. 24
Figure 17- Torque Demand vs Speed for Power Steering ................................................ 26
Figure 18- Torque Demand vs Speed for HVAC ............................................................. 27
Figure 19- Torque Demand of Accessories ...................................................................... 29
Figure 20- Manhattan Cycle ............................................................................................. 30
Figure 21- Electric Generator Efficiency Map ................................................................. 33
Figure 22- Power Demand from Conventional Accessories............................................. 34
Figure 23- Power Demand from Electrified Accessories ................................................. 35
Figure 24- Battery State of Charge without Regenerative Braking .................................. 36
Figure 25- Battery State of Charge with Regenerative Braking ....................................... 37
1
CHAPTER 1: INTRODUCTION
1.1 Motivation
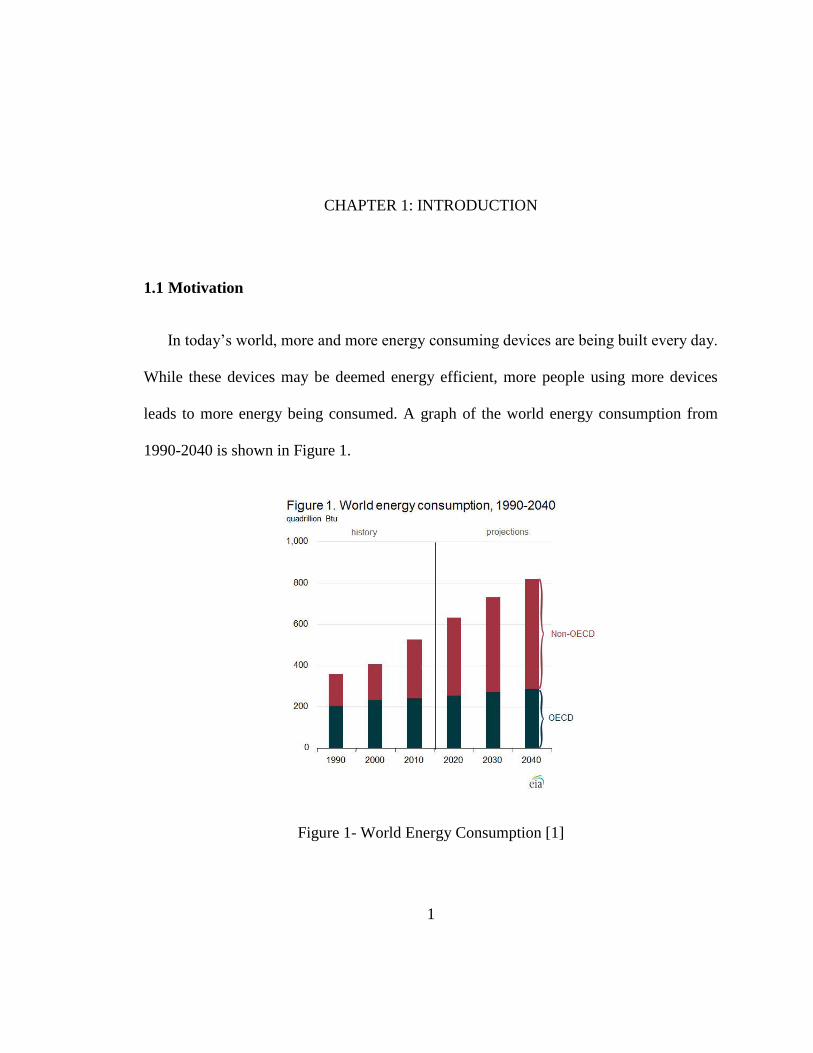
In today’s world, more and more energy consuming devices are being built every day.
While these devices may be deemed energy efficient, more people using more devices
leads to more energy being consumed. A graph of the world energy consumption from
1990-2040 is shown in Figure 1.
Figure 1- World Energy Consumption [1]

2
The world energy consumption is projected to increase by 200 quadrillion Btu over the
next 30 years, which is more than a 30% increase. Much of this increase will be seen in
regions that are non-OECD, however some growth will still be seen in OECD regions.
The increasing demand for energy calls for an increase in efficiency as a counterbalance.
The U.S. energy consumption by source and sector is shown in Figure 2.
Figure 2- Energy Flow Trends [2]
The energy consumption by sector shows that 26.7% of the energy consumed in the U.S.
is used for transportation purposes. Of this 26.7%, 93% comes from petroleum, while 3%
comes from natural gas and 4% comes from renewable energy sources. This shows that
the majority of the energy used for transportation isn’t renewable and provides a large
potential for an increase in overall efficiency. Public transportation can be used to

3
increase the overall efficiency of the transportation sector and overall energy use. The
passenger miles traveled over different modes of transportation is shown in Figure 3.
Figure 3- Passenger Miles Traveled [3]
A passenger mile traveled is the sum of the total miles traveled by each individual
passenger on each mode of transportation. For instance, one person traveling forty miles
on a bus is the same as forty people traveling one mile on a bus. Motor buses travel
approximately 21.2 billion passenger miles, which is 39.5% of the total passenger miles
4
traveled. This shows the high degree of utilization for buses in today’s society, and
provides motivation to increase fuel economy.
1.2 Background Research
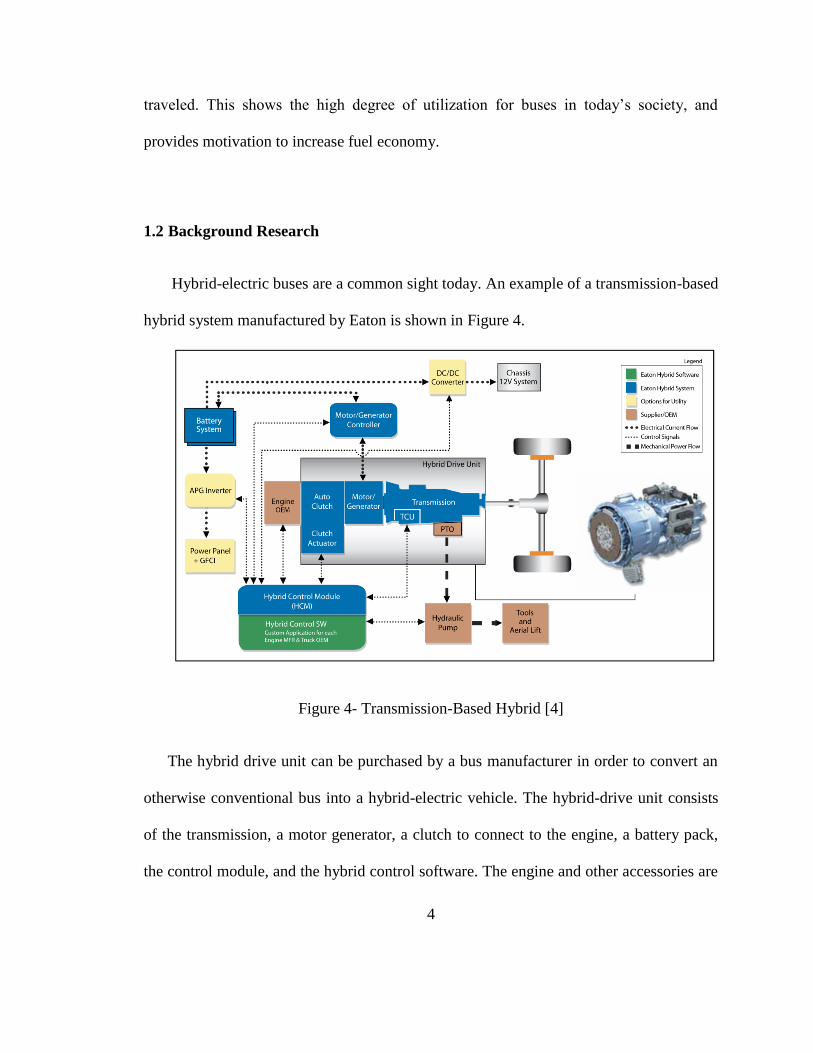
Hybrid-electric buses are a common sight today. An example of a transmission-based
hybrid system manufactured by Eaton is shown in Figure 4.
Figure 4- Transmission-Based Hybrid [4]
The hybrid drive unit can be purchased by a bus manufacturer in order to convert an
otherwise conventional bus into a hybrid-electric vehicle. The hybrid-drive unit consists
of the transmission, a motor generator, a clutch to connect to the engine, a battery pack,
the control module, and the hybrid control software. The engine and other accessories are

5
purchased by the bus manufacturer from other suppliers, and can be seen in brown in
Figure 4. Since the hybrid unit can be purchased in place of a conventional transmission,
the unit can be fitted onto a conventional bus to transform it into a hybrid-electric bus.
The auto clutch is an automated clutch that connects the engine to the electric machine.
The electric machine is then attached to the transmission, and then to the wheels. If the
clutch disengages, the engine can be turned off and the vehicle can be run entirely on
electrical power, or the engine can be turned on and the clutch closed to run with a
combination of electrical and mechanical power.
Transmission based hybrid buses can reduce emissions by up to 65% and increase
fuel economy by up to 65% [5]. However, the costs of these transmission based systems
can cause the bus to cost between $450,000 and $550,000, compared to about $290,000
for a conventional bus [6]. This 55% to 90% increase in cost prevents transmission-based
hybrid buses from being a financially attractive option to potential customers.
An engine-based hybrid-electric bus manufactured by BAE Systems is shown in
Figure 5.
6
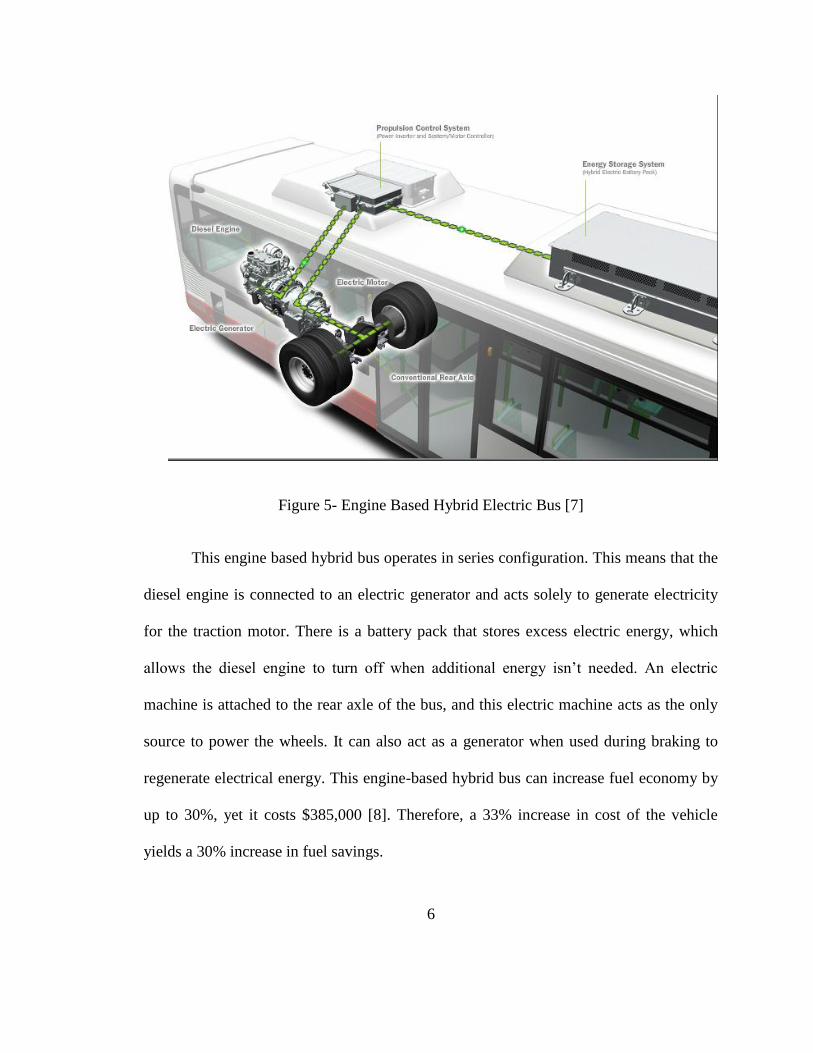
Figure 5- Engine Based Hybrid Electric Bus [7]
This engine based hybrid bus operates in series configuration. This means that the
diesel engine is connected to an electric generator and acts solely to generate electricity
for the traction motor. There is a battery pack that stores excess electric energy, which
allows the diesel engine to turn off when additional energy isn’t needed. An electric
machine is attached to the rear axle of the bus, and this electric machine acts as the only
source to power the wheels. It can also act as a generator when used during braking to
regenerate electrical energy. This engine-based hybrid bus can increase fuel economy by
up to 30%, yet it costs $385,000 [8]. Therefore, a 33% increase in cost of the vehicle
yields a 30% increase in fuel savings.
7
1.3 Overview of Thesis
This thesis provides an overview on power management for an electrified bus.
Chapter 2 discusses the powertrain architecture that will be used throughout this thesis
and defines the project objectives. Chapter three presents the models of accessories that
were used during the simulations. Chapter 4 discusses the vehicle simulator and the
results of the simulations. The conclusions are presented in Chapter 5.
CHAPTER 2: PROJECT BACKGROUND
2.1 Powertrain Architecture
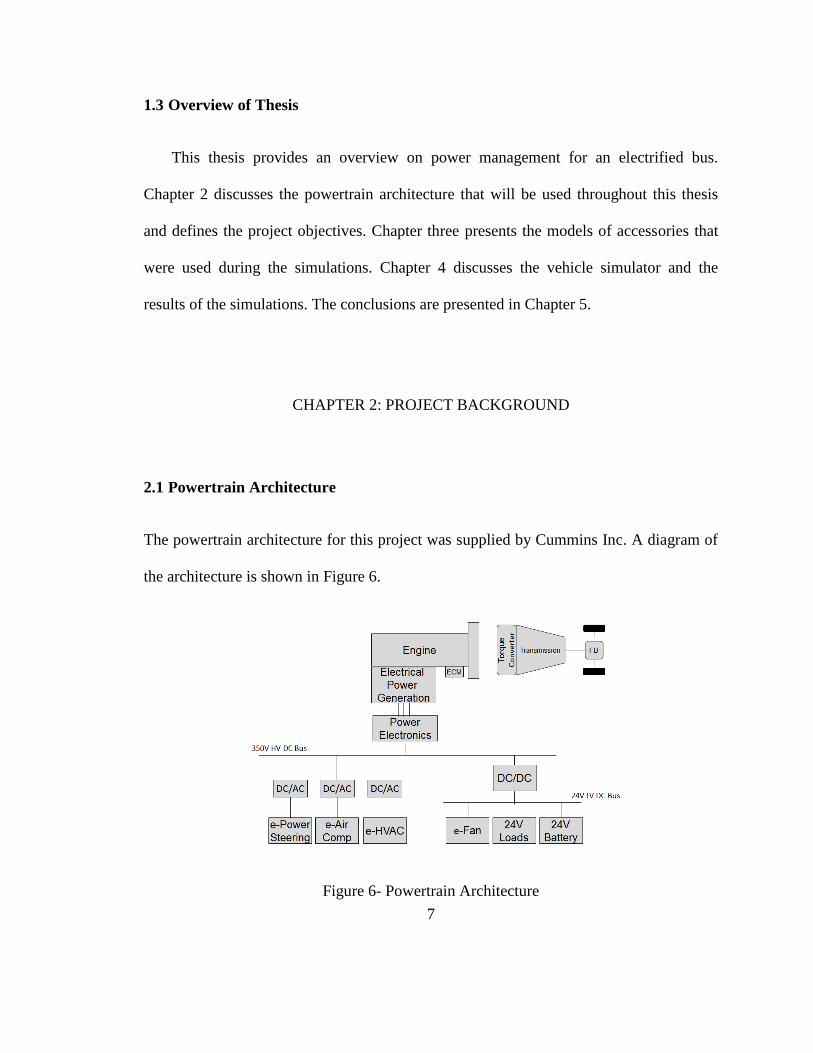
The powertrain architecture for this project was supplied by Cummins Inc. A diagram of
the architecture is shown in Figure 6.
Figure 6- Powertrain Architecture
8
The drive wheels are attached to an automatic transmission and torque converter,
which is identical to a conventional bus powertrain. The engine is attached to the torque
converter, and for the purpose of this specific powertrain, supplies all of the power to the
wheels. The integrated alternator is mechanically coupled to the engine through a gear
train. The alternator takes power from the wheels and engine and converts it to electricity.
The power electronics serve the purpose of regulating the alternating current of the
alternator and converting it into a constant direct current energy source for the high
voltage bus. Then, a series of smaller inverters convert the direct current energy back into
alternating current for the power steering, air compressor, and HVAC (heating,
ventilation, and air conditioning) to use. A DC/DC converter then steps down the voltage
to accommodate a low voltage bus, where the fan and other 24 volt loads will connect, as
well as a 24 volt battery.
Advantages of this powertrain as opposed to traditional hybrid powertrains (where
both the electric motor and internal combustion engine power the wheels) lie in the
smaller impact of the electronics on the overall system. A smaller battery will decrease
the cost of the system, as compared to a traction based hybrid with a larger battery. The
system also requires a smaller electric machine and other power electronics, because the
system only has to supply power to various accessories, instead of powering traction
motors that supply power to the wheels.

9
2.2 Project Objectives
A set of project objectives was defined by Cummins Inc. and the project team at
Ohio State at the start of the project. This project will expand beyond this thesis, so not
all of these objectives will be addressed in the body of this thesis. The first objective was
to develop accessory models to be used during the simulations. These models will be
modeled using a combination of energy and physics-based modeling. Energy based
modeling focuses on the power consumption of the accessories at various operating
conditions during the simulations. Physics-based modeling focuses on dynamics and the
physical responses of the system. The next objective is to develop or adapt a current
vehicle simulator into a simulator of a bus for this project.
The final objective is to develop a control strategy based on optimal principles.
Load management during idle and derates must be developed. Under these conditions, the
engine power is severely limited, so a strategy must be determined in order to manage
accessories with limited electrical power. Transient load management (when accessories
turn on) will provide a challenge because accessories draw more current when turning on.
A strategy for regenerative braking must also be determined. Since the battery in the
system is low voltage, it limits the possible energy storage capacity in the battery. This
provides a challenge for the regenerative braking, because the battery cannot necessarily
accept all of the energy from regenerative braking. Therefore, when additional electrical
energy is present, there needs to be a way to store it. Methods to do this include storing
air in tanks by using the air compressor, cooling the engine using the fan, or using the
HVAC unit to cool the cabin down.
10
2.3 Project Methods
The methods involved with completing this project were to develop energy
models of accessories. These models were created by obtaining data that related the input
speed of accessories to the torque demand of the accessory at the given speed. Since
speed was the model input and torque was the output, the power demand of the accessory
was known. These models were then implemented in Simulink. A simulator of a garbage
truck was then modified to eliminate excess loads and parameters were changed to be
consistent with that of a transit bus. After the parameters were implemented in the
simulator, the vehicle was run over a single Manhattan cycle. Finally, the power
consumption of the vehicle and the accessories were analyzed.
CHAPTER 3: ACCESSORIES
3.1 Functional Analysis of Accessories
This section overviews how each accessory operates.
Alternator
The integrated alternator provides the power for the entire electrical system. The
electric machine used in this system is a permanent magnet synchronous generator. A
diagram of a permanent magnet synchronous generator is shown in Figure 7.

11
Figure 7- Permanent Magnet Synchronous Generator
A permanent magnet is mounted on the inside rotor, and three phase windings are
wound on the outside stator. If a mechanical force causes the rotor to rotate, the rotating
magnetic field then excites the windings and produces a three phase alternating current
throughout the stator, with the frequency of the alternating current corresponding to the
speed of the rotation. The reverse reaction can also occur, where a voltage can be applied
across the windings to cause the rotor to rotate, however the electric machine will only be
used as a generator and not a These principles can be used to generate electrical energy
to power accessories or to be stored in the battery for later use.
Fan

12
Fans are comprised of an electric motor attached to a set of blades that rotate and
cause airflow in a certain direction. This air is then used to cool the engine’s water jacket
or charged air cooler. The fan used in the system is a Mini-Hybrid third generation fan
produced by EMP, shown in Figure 8.
Figure 8- EMP MINI-HYBRID GenIII
The electric fan consists of nine smaller fans, and they work together to cool
down the engine. There are multiple settings that the fan operates at, based on the engine
temperature. As the temperature rises, the fan speed and power draw increases in an
attempt to cool the engine down faster.
Air Compressor
The air compressor used with this powertrain architecture is a reciprocating,
piston based air compressor, driven by an electric motor, as shown in Figure 9.
13
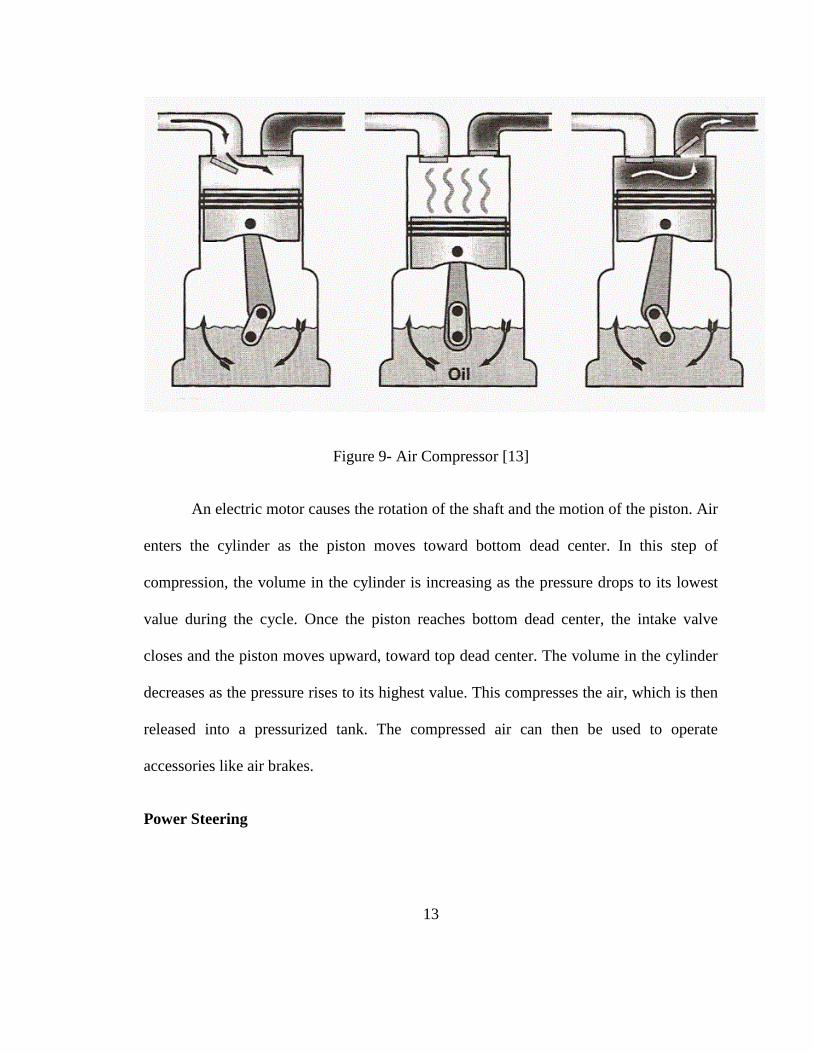
Figure 9- Air Compressor [13]
An electric motor causes the rotation of the shaft and the motion of the piston. Air
enters the cylinder as the piston moves toward bottom dead center. In this step of
compression, the volume in the cylinder is increasing as the pressure drops to its lowest
value during the cycle. Once the piston reaches bottom dead center, the intake valve
closes and the piston moves upward, toward top dead center. The volume in the cylinder
decreases as the pressure rises to its highest value. This compresses the air, which is then
released into a pressurized tank. The compressed air can then be used to operate
accessories like air brakes.
Power Steering
14
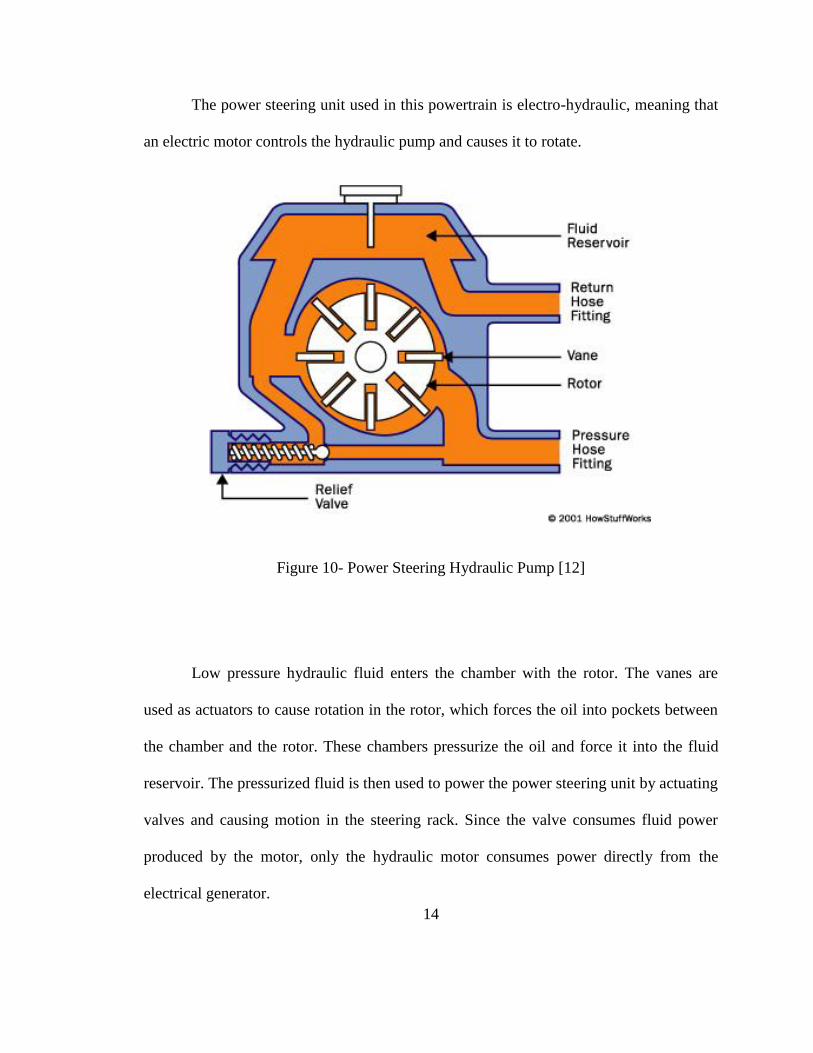
The power steering unit used in this powertrain is electro-hydraulic, meaning that
an electric motor controls the hydraulic pump and causes it to rotate.
Figure 10- Power Steering Hydraulic Pump [12]
Low pressure hydraulic fluid enters the chamber with the rotor. The vanes are
used as actuators to cause rotation in the rotor, which forces the oil into pockets between
the chamber and the rotor. These chambers pressurize the oil and force it into the fluid
reservoir. The pressurized fluid is then used to power the power steering unit by actuating
valves and causing motion in the steering rack. Since the valve consumes fluid power
produced by the motor, only the hydraulic motor consumes power directly from the
electrical generator.
15
HVAC
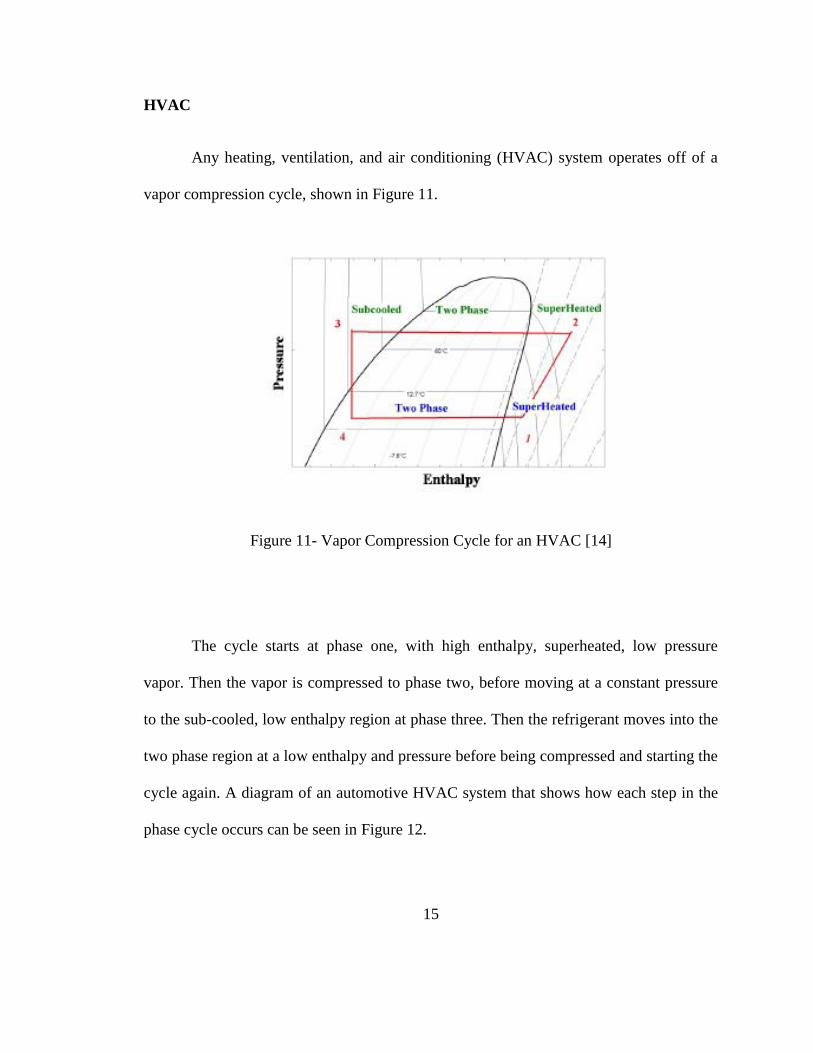
Any heating, ventilation, and air conditioning (HVAC) system operates off of a
vapor compression cycle, shown in Figure 11.
Figure 11- Vapor Compression Cycle for an HVAC [14]
The cycle starts at phase one, with high enthalpy, superheated, low pressure
vapor. Then the vapor is compressed to phase two, before moving at a constant pressure
to the sub-cooled, low enthalpy region at phase three. Then the refrigerant moves into the
two phase region at a low enthalpy and pressure before being compressed and starting the
cycle again. A diagram of an automotive HVAC system that shows how each step in the
phase cycle occurs can be seen in Figure 12.

16
Figure 12- HVAC Diagram
A fixed displacement piston compressor, fan, and blower are powered by electric
motors. The compressor compresses the refrigerant, which increases the pressure. The
refrigerant passes through the condenser and the dryer, which decreases the enthalpy of
the fluid. The fan forces air through the condenser, which removes heat from the
refrigerant. The refrigerant decreases pressure as it travels through the valve, and then
cools the cabin by accepting heat through the evaporator.
Power Electronics
There are two different types of power electronics in the system. A DC/DC
converter transfers energy from the high voltage bus to the low voltage bus so that the

17
low voltage loads and battery can connect to the system. The second type of power
electronics is an inverter, which takes the direct current energy at the high voltage bus
and turns it into alternating current energy.
DC/DC converters either increase or decrease the voltage between the input and
output while conserving power, minus small losses due to the efficiency of the converter.
Typically, DC/DC converters use a magnetic field to transfer power, using either a
transducer or an inductor. The magnetic field transforms power from one side of the
circuit to the other, but either steps the voltage up or down, depending on the application.
In the case of the bus, the DC/DC converter steps the voltage down, and since the power
is held relatively constant, the current that can be drawn out of the low voltage bus is
larger, proportionally to the step down in voltage.
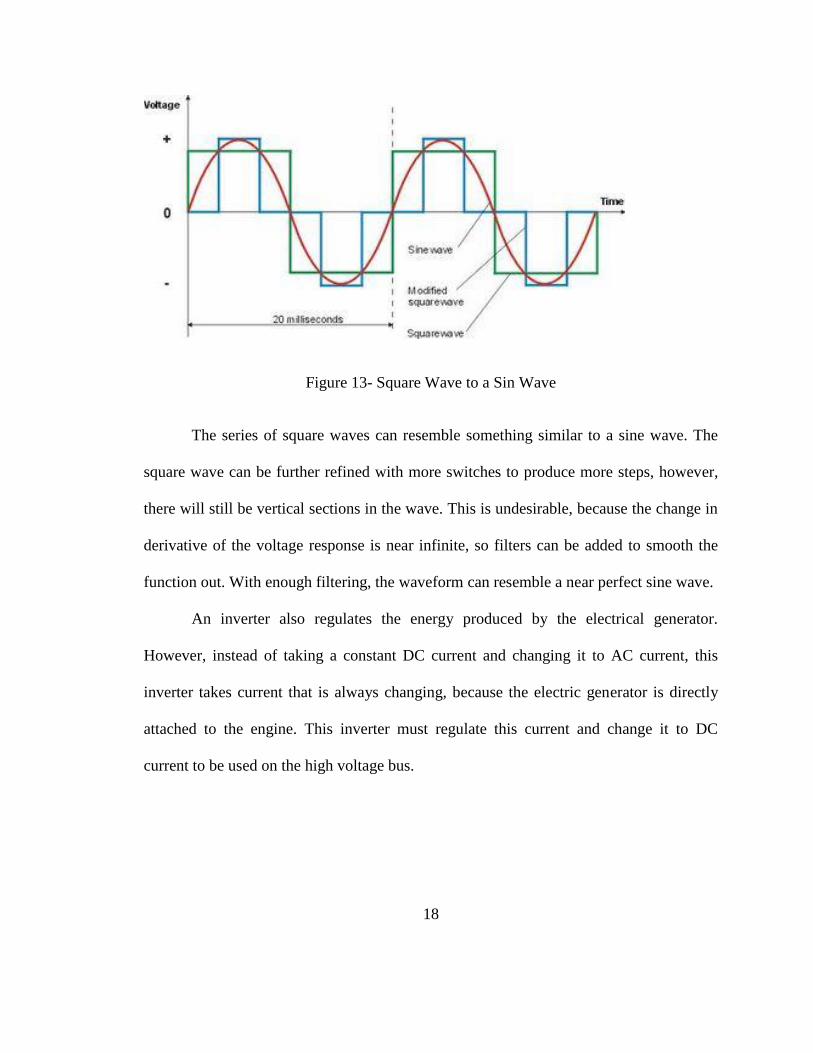
AC/DC converters, or inverters, convert a direct current power source to an
alternating current power source by using a series of switches. These switches turn on
and off very rapidly in a sequence that produces a square wave, which can be turned into
a modified sign wave with more switches and filters. A description of this is shown in
Figure 13.
18
Figure 13- Square Wave to a Sin Wave
The series of square waves can resemble something similar to a sine wave. The
square wave can be further refined with more switches to produce more steps, however,
there will still be vertical sections in the wave. This is undesirable, because the change in
derivative of the voltage response is near infinite, so filters can be added to smooth the
function out. With enough filtering, the waveform can resemble a near perfect sine wave.
An inverter also regulates the energy produced by the electrical generator.
However, instead of taking a constant DC current and changing it to AC current, this
inverter takes current that is always changing, because the electric generator is directly
attached to the engine. This inverter must regulate this current and change it to DC
current to be used on the high voltage bus.

19
3.2 Energy Modeling of Accessories
All of the accessories are modeled using the same black box model, shown in
Figure 14.
Figure 14- Accessory Black Box Model
All of the accessory models receive an input speed and a duty cycle signal. The
input speed determines the torque demand of the accessory. Since the input speed is the
input and the torque demand is the output, the power consumption of the accessory can
be determined, as shown in Equation 1.
𝑃 = 𝑇𝜔 [1]
Where:
P= Power consumed by accessory (w)
T= Torque demand of accessory (T)
ω= Rotational input speed to accessory (rad/s)

20
The input speed of the accessory models is equal to the engine speed for a
conventional bus. This constrains the every variable in the model, eliminating any
possible control strategy for conventional accessories, with the exception of the duty
cycle. However, for a bus with electrified accessories, the input speed to the accessories
is determined by the electronic motors connected to each of the accessories. This allows
each accessory to function independently from the engine and each other. The speed of
the electrified accessories was determined by comparing the energy consumed by the
conventional accessories and having this number be similar to the energy consumed by
the electrified accessories over a Manhattan cycle.
The duty cycle of each accessory determines whether the accessory is on or off.
Each of the accessories use different duty cycles, which were taken from a previous
simulator [9]. These duty cycles determine the amount of energy consumed by each
accessory, and the duty cycle remains unchanged between all of the simulations.
The torque demand of each accessory is determined from Equation 2.
𝑇 =1
𝜂
𝑃
𝜔 [2]
Where:
η= Efficiency of the accessory
These values are determined by look up tables that determine the torque demand
of the accessory from the input speed.

21
Each electrified accessory is powered by an electric motor that produces the
rotational energy that the accessory consumes. For the purpose of this thesis, these
electric actuators are modeled as ideal, meaning all of the electrical energy they consume
is converted into mechanical energy for the accessories to use.
Fan
The power consumption of the fan is determined by the speed of the fan. Since the
fan that is being used is electric, the speed of the fan determines the amount of current
that the fan consumes at a rated voltage of 24 volts. The power consumed by the fan can
be expressed as a product of the current and the voltage, as shown in Equation 3.
𝑃 = 𝐼𝑉 [3]
Where:
I= Current (A)
V= Voltage (V)
Once the power consumption of the fan is determined, it can be converted into a
mechanical torque using Equation 1. This allows the fan to be run off the engine and
demand a torque from the engine for the conventional bus simulations. The current drawn
from the fan at given speeds is shown in Table 1.

22
Table 1- Current Drawn to Power Fan at Rated Speeds [15]
Speed (RPM)
Current (A)
0 0
750 3
1812 14
2875 36
3938 80
5000 160
5500 204
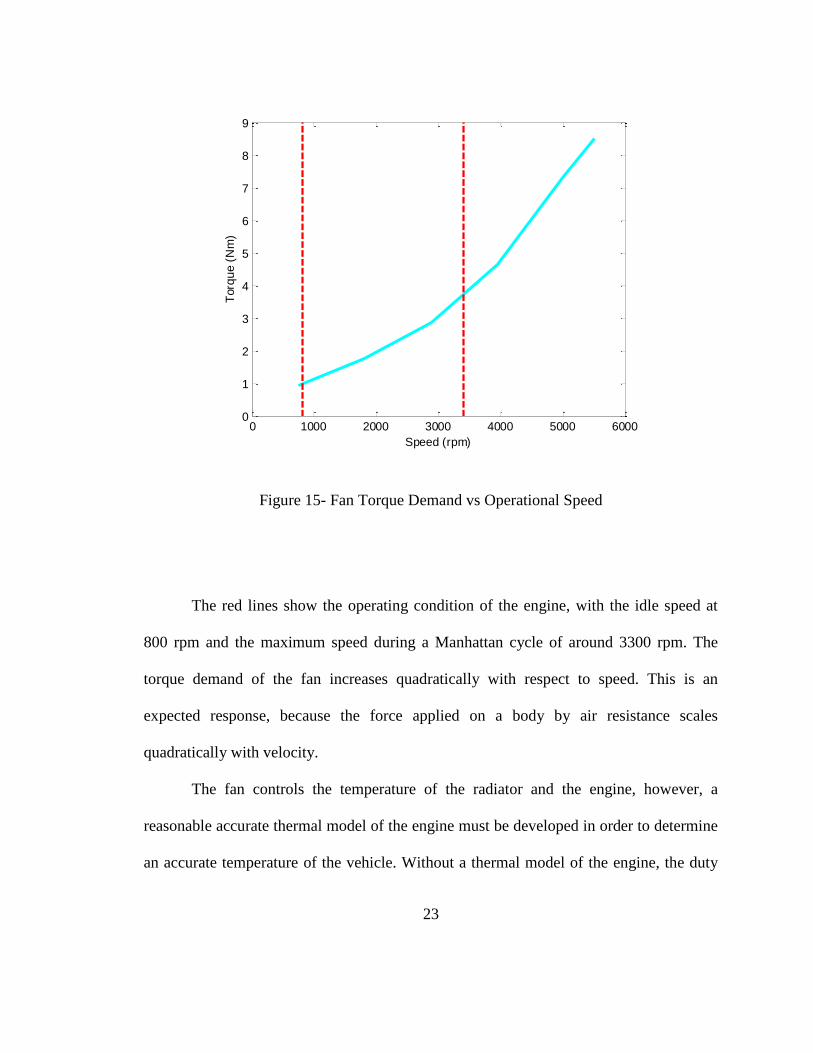
The torque versus speed response for the fan is shown in Figure 15.
23
Figure 15- Fan Torque Demand vs Operational Speed
The red lines show the operating condition of the engine, with the idle speed at
800 rpm and the maximum speed during a Manhattan cycle of around 3300 rpm. The
torque demand of the fan increases quadratically with respect to speed. This is an
expected response, because the force applied on a body by air resistance scales
quadratically with velocity.
The fan controls the temperature of the radiator and the engine, however, a
reasonable accurate thermal model of the engine must be developed in order to determine
an accurate temperature of the vehicle. Without a thermal model of the engine, the duty
0 1000 2000 3000 4000 5000 60000
1
2
3
4
5
6
7
8
9
Speed (rpm)
Torq
ue (
Nm
)

24
cycle of the fan can be used to simulate the amount of time that the fan needs to be on in
order to provide adequate cooling for the engine.
Air Compressor
The power consumption and therefor torque demand of the air compressor is
determined by the input speed. The torque demand at a given speed of the air compressor
is shown in Figure 16.
Figure 16- Air Compressor Torque Demand [9]
The air compressor model uses lookup tables with data from a garbage truck
simulator, where the data was originally provided by Cummins Inc. [9]. The torque
demand of the air compressor is a fairly constant value across the operating speeds of the
engine. It requires a high amount of torque at very low speeds, and then decreases to a
0 2000 4000 6000 8000 10000 120000
50
100
150
200
250
Speed (rpm)
Torq
ue (
Nm
)
25
constant value. This means that the power demanded by the air compressor scales with
the input speed, Equation 1, and the fact that the torque request is approximately
constant. The spike in torque demanded by the air compressor at very low speeds is most
likely attributed to the high amounts of friction that occurs when the piston speed is very
slow.
The air compressor puts compressed air into a tank with a constant volume. The
air compressor maintains the pressure in the tank, however, without modeling how the
compressed air is used on the vehicle, the pressure in the tank wouldn’t decrease.
Therefore, the air compressor duty cycle estimates how often the pressure in the tank
needs to be replenished, and the air compressor turns on accordingly.
Power Steering
The model for the power steering unit only contains the power steering pump, and
not the entire power steering assembly. This is because the assembly that controls the
power steering consumes the energy in the hydraulic fluid, and without modeling how
steering impacts the pressure in the reservoir or determining the amount of steering in a
drive cycle, this is impossible. However, this power consumption can be modeled as part
of the duty cycle input, where the duty cycle determines how often a power steering
pump would turn on over a given cycle. The more energy that the power steering
assembly consumes, the more often the power steering pump has to turn on. The torque
demand of the power steering pump at different input speeds is shown in Figure 17.

26
Figure 17- Torque Demand vs Speed for Power Steering
The power steering model uses lookup tables with data from a garbage truck
simulator, where the data was originally obtained from SAE (Society of Automotive
Engineers) literature [9].The torque demand of the power steering pump is fairly constant
within the operating speeds of the engine, so the power demand only scales with the input
speed to the power steering unit. Similar to the air compressor, the torque demand spikes
at very low speeds. This behavior can be attributed to the increase in friction in the
system at very low speeds.
0 2000 4000 6000 8000 10000 120000
50
100
150
Speed (rpm)
Torq
ue (
Nm
)
27
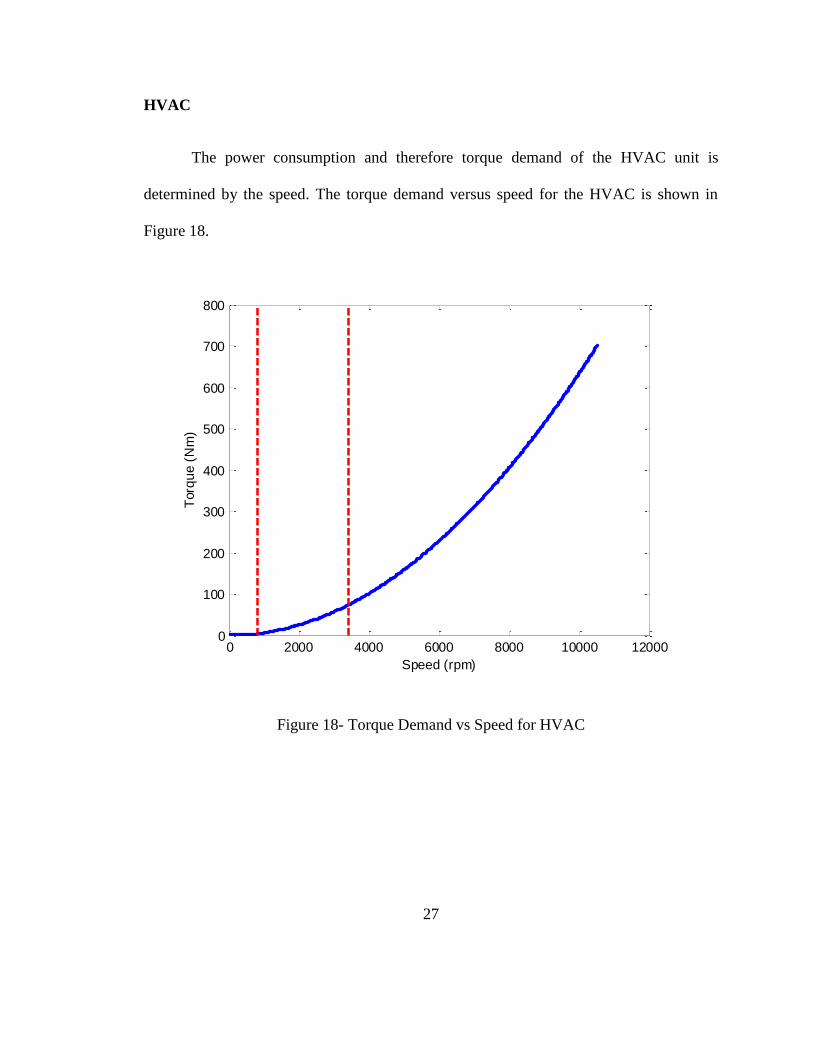
HVAC
The power consumption and therefore torque demand of the HVAC unit is
determined by the speed. The torque demand versus speed for the HVAC is shown in
Figure 18.
Figure 18- Torque Demand vs Speed for HVAC
0 2000 4000 6000 8000 10000 120000
100
200
300
400
500
600
700
800
Speed (rpm)
Torq
ue (
Nm
)

28
The torque demand of the HVAC unit increases quadratically with the input
speed. This causes the power demand of the air compressor to be a cubic function,
increasing with input speed, shown by Equation 1.
The air conditioning controls the temperature of the cabin. Without developing an
accurate model of the cabin temperature, the air conditioning can’t be accurately
controlled. However, the duty cycle input for the air compressor determines
approximately how often the air compressor needs to be turned on, and simulates
maintaining a constant cabin temperature.
Power Electronics
The power electronics in the bus transfer one type of electrical energy to another
type. These electronics transfer energy very quickly, and are mostly operating at steady
state. For this reason, the dynamics of the power electronics for these models are ignored,
namely because the transient for the power electronics is significantly faster than that of
the other accessories. This allows the model of the power electronics to be a simple gain,
which for this thesis is 90% [17] [18].
Comparison
A comparison of the torque demands by different accessories is shown in Figure
19.

29
Figure 19- Torque Demand of Accessories
Over the operating range of the engine, the HVAC always request a higher torque
than the fan, and the power steering pump always requests a higher torque than the air
compressor. At idle speed, the power steering pump demands the highest torque, and the
HVAC demands the second lowest amount of torque. However, at the maximum speed of
the engine, the HVAC unit demands the highest amount of torque.
0 2000 4000 6000 8000 10000 120000
100
200
300
400
500
600
700
800
Speed (rpm)
Torq
ue (
Nm
)
Power Steering
HVAC
Air Compressor
Fan

30
CHAPTER 4: SIMULATIONS
4.1 Vehicle Simulator
The simulator of a garbage truck that was previously used was modified to
perform as a bus [9]. The refuse loads of the garbage truck were removed, and the vehicle
parameters, shown in Table 2, where adjusted to meet those of a bus.
Table 2- Bus Parameters
Vehicle Mass (kg) Frontal Area (m^2) Coefficient of Drag (-) Wheelbase (m)
12636 7.24 0.79 6.85
The vehicle was simulated over a single Manhattan cycle, as shown in Figure 20.
Figure 20- Manhattan Cycle
0 200 400 600 800 1000 12000
5
10
15
20
25
30
Speed traces mph
Time (s)
Spe
ed
(m
ph)
Desired
Simulation

31
The Manhattan cycle was developed by studying urban buses in Manhattan, New
York. The top speed of the cycle is 25 mph and the average speed is 7 mph. This cycle
was chosen because it represents actual routes for transit buses in New York City. The
desired speed trace gives the simulated driver an ideal speed, which the simulation tries
to match. This speed is the simulation speed, which closely follows the desired speed
trace. This is important in terms of the drivability and performance of the vehicle. The
vehicle must be able to accelerate or decelerate within reasonable limits, which are set by
the drive cycle.
The vehicle speed and therefore engine speed is set by the drive cycle, because
the engine is mechanically coupled to the wheels. However, the power demand at the
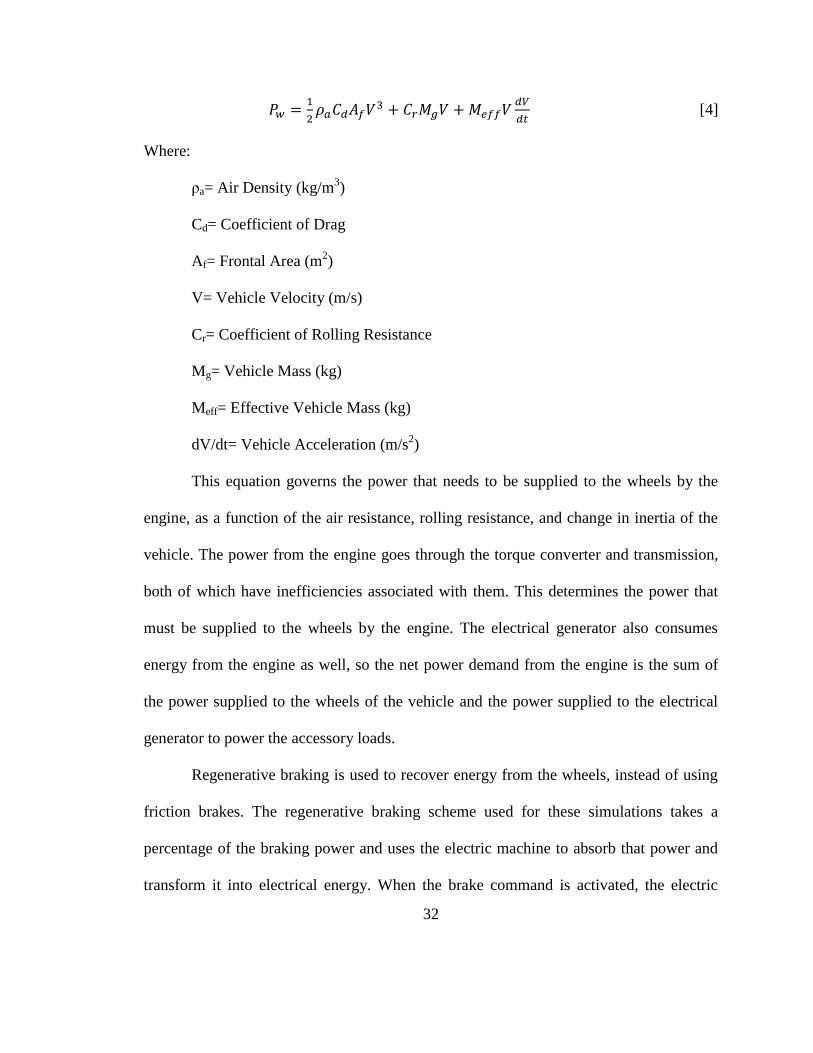
wheels is also a function of the vehicle speed, as shown in Equation 4 [19].
32
𝑃𝑤 =1
2𝜌𝑎𝐶𝑑𝐴𝑓𝑉3 + 𝐶𝑟𝑀𝑔𝑉 + 𝑀𝑒𝑓𝑓𝑉
𝑑𝑉
𝑑𝑡 [4]
Where:
ρa= Air Density (kg/m3)
Cd= Coefficient of Drag
Af= Frontal Area (m2)
V= Vehicle Velocity (m/s)
Cr= Coefficient of Rolling Resistance
Mg= Vehicle Mass (kg)
Meff= Effective Vehicle Mass (kg)
dV/dt= Vehicle Acceleration (m/s2)
This equation governs the power that needs to be supplied to the wheels by the
engine, as a function of the air resistance, rolling resistance, and change in inertia of the
vehicle. The power from the engine goes through the torque converter and transmission,
both of which have inefficiencies associated with them. This determines the power that
must be supplied to the wheels by the engine. The electrical generator also consumes
energy from the engine as well, so the net power demand from the engine is the sum of
the power supplied to the wheels of the vehicle and the power supplied to the electrical
generator to power the accessory loads.
Regenerative braking is used to recover energy from the wheels, instead of using
friction brakes. The regenerative braking scheme used for these simulations takes a
percentage of the braking power and uses the electric machine to absorb that power and
transform it into electrical energy. When the brake command is activated, the electric
33
machine then consumes the energy that is consumed by friction brakes on a conventional
bus. This increases the efficiency of the bus because instead of dissipating excess energy
into heat, the bus transforms excess energy into electricity.
4.2 Simulation Results
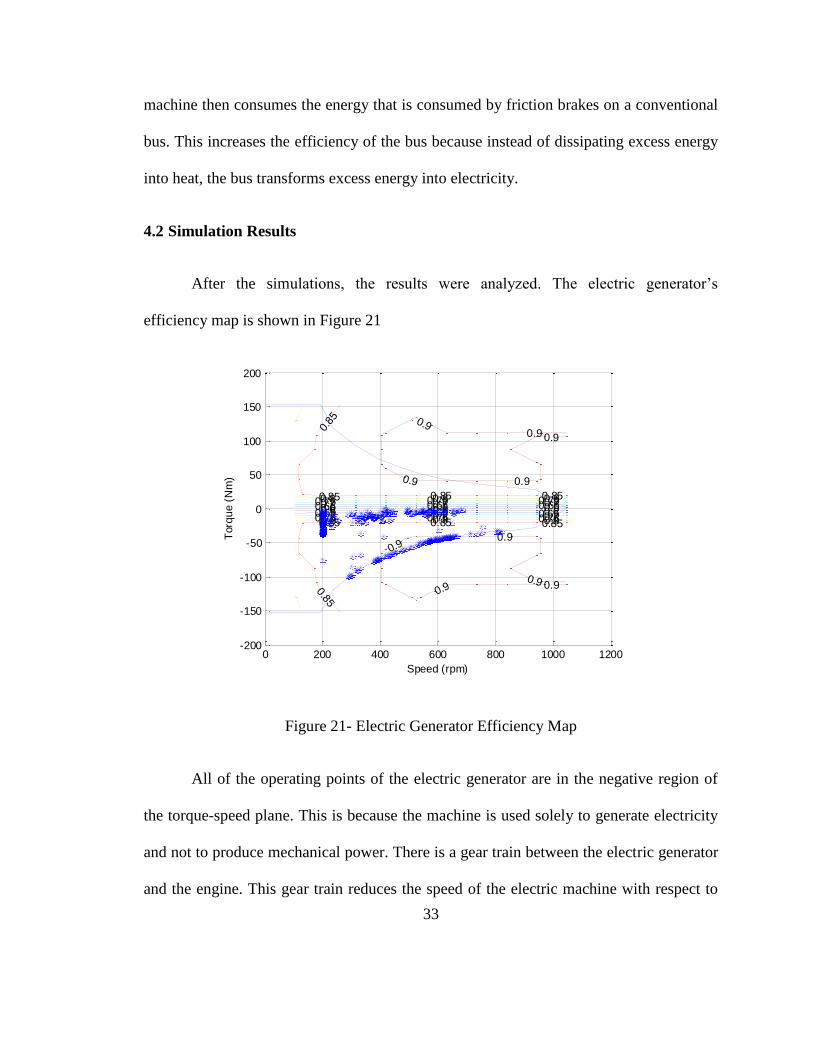
After the simulations, the results were analyzed. The electric generator’s
efficiency map is shown in Figure 21
Figure 21- Electric Generator Efficiency Map
All of the operating points of the electric generator are in the negative region of
the torque-speed plane. This is because the machine is used solely to generate electricity
and not to produce mechanical power. There is a gear train between the electric generator
and the engine. This gear train reduces the speed of the electric machine with respect to
0 200 400 600 800 1000 1200-200
-150
-100
-50
0
50
100
150
200
0.6 0.6 0.60.6 0.6 0.60.65 0.65 0.650.65 0.65 0.650.7 0.7 0.7
0.7 0.7 0.7
0.75 0.75 0.75
0.75 0.75 0.75
0.8 0.8 0.8
0.8 0.8 0.8
0.85
0.85 0.85 0.850.85
0.85 0.85 0.85
0.9
0.9
0.9 0.9
0.9
0.9
0.90.9
0.9 0.9
Torq
ue (
Nm
)
Speed (rpm)
34
the engine, which allows the electric machine to operate in more efficient regions on the
efficiency map.
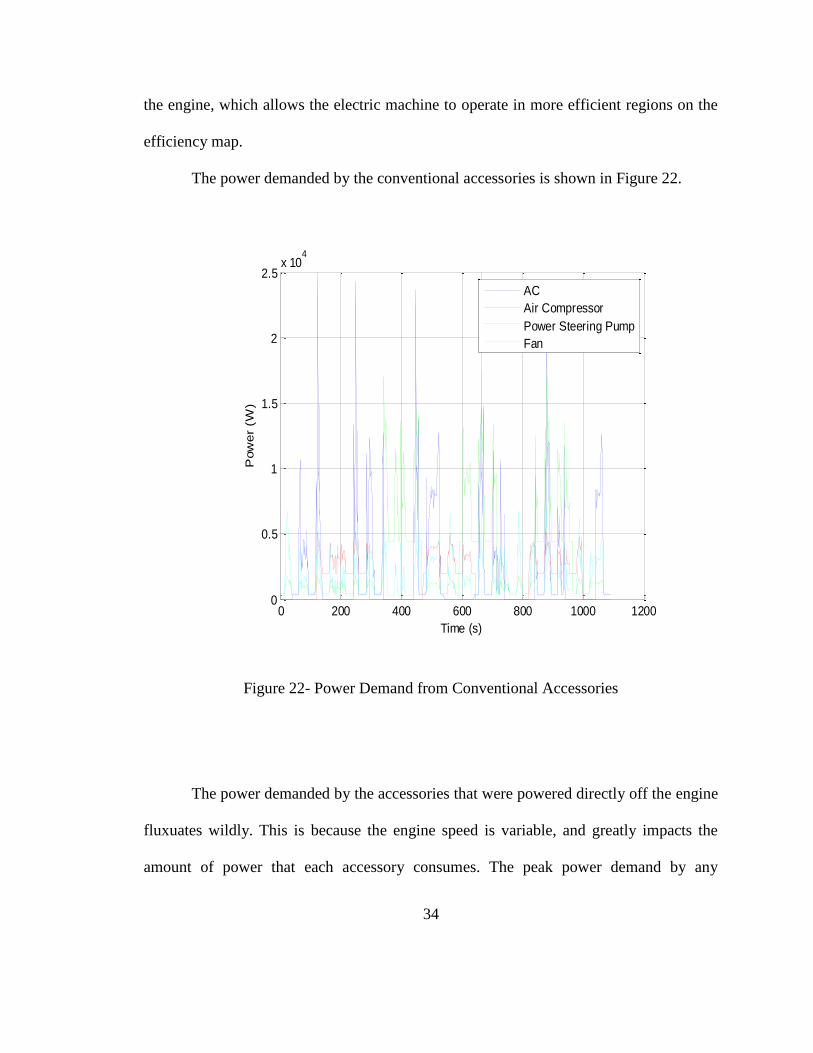
The power demanded by the conventional accessories is shown in Figure 22.
Figure 22- Power Demand from Conventional Accessories
The power demanded by the accessories that were powered directly off the engine
fluxuates wildly. This is because the engine speed is variable, and greatly impacts the
amount of power that each accessory consumes. The peak power demand by any
0 200 400 600 800 1000 12000
0.5
1
1.5
2
2.5x 10
4
Time (s)
Pow
er
(W)
AC
Air Compressor
Power Steering Pump
Fan
35
accessory is 25 kW, demanded by the HVAC. All of the accessories demand at least five
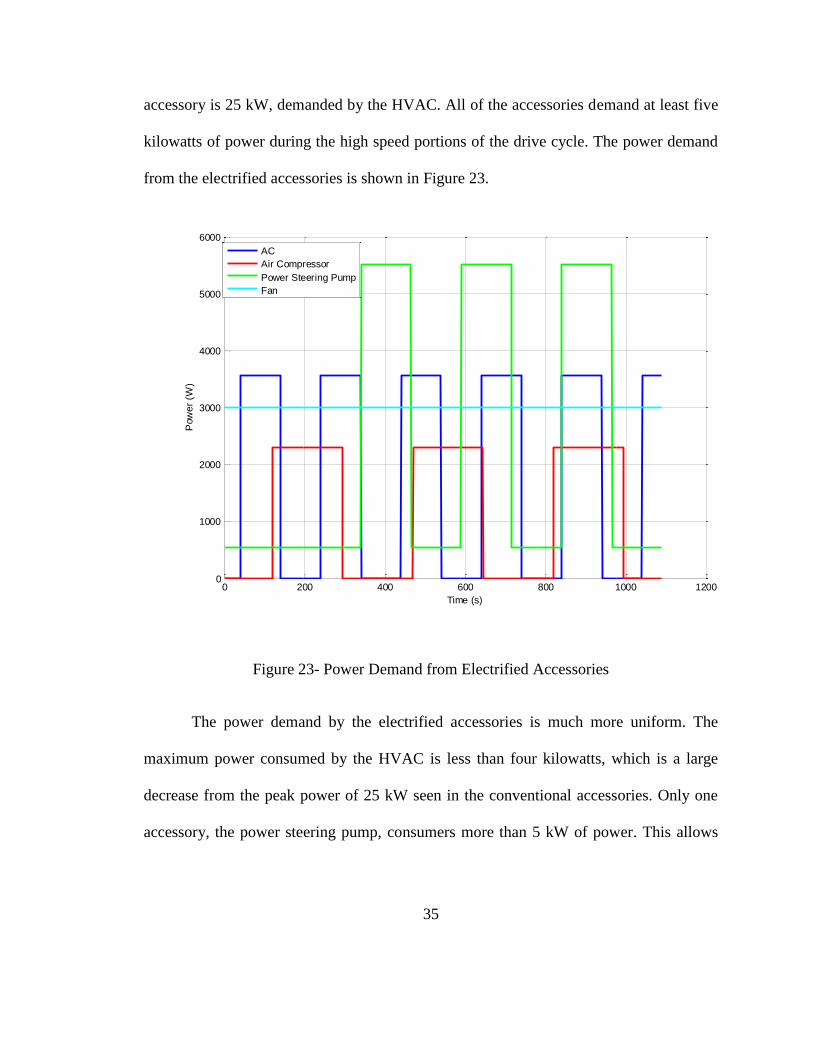
kilowatts of power during the high speed portions of the drive cycle. The power demand
from the electrified accessories is shown in Figure 23.
Figure 23- Power Demand from Electrified Accessories
The power demand by the electrified accessories is much more uniform. The
maximum power consumed by the HVAC is less than four kilowatts, which is a large
decrease from the peak power of 25 kW seen in the conventional accessories. Only one
accessory, the power steering pump, consumers more than 5 kW of power. This allows
0 200 400 600 800 1000 12000
1000
2000
3000
4000
5000
6000
Time (s)
Pow
er
(W)
AC
Air Compressor
Power Steering Pump
Fan

36
the engine to allocate additional power and torque to the wheels of the vehicle, because it
doesn’t have to supply as much power to the accessories at high vehicle speeds.
The accessories are run off the battery pack while there is energy in the battery
pack. The state of charge of the battery pack as a function of time without utilizing
regenerative braking is shown in Figure 24.
Figure 24- Battery State of Charge without Regenerative Braking
The state of charge of the battery is charge sustaining between 40% and 30%.
Only 10% of the total battery state of charge is used, because this powertrain operates in
charge sustaining mode. That means that the battery will never be charged be a source
external to the vehicle, so the battery must charge while being driven. The battery
0 200 400 600 800 1000 120028
30
32
34
36
38
40
42
Time (s)
Batt
ery
Sta
te o
f C
ha
rge
(%
)

37
operates under a control scheme such that when the battery state of charge decreases to
30%, the electric machine supplies its maximum torque at the engine speed to supply
energy to the battery and increase its state of charge and to power the accessories. When
the battery has 40% state of charge, it depletes by supplying energy to the accessories.
The state of charge of the battery as a function of time for the model that
utilizes regenerative braking is shown in Figure 25.
Figure 25- Battery State of Charge with Regenerative Braking
The control scheme changes slightly to allow for regenerative braking. When the
brake command is used, the electric generator takes power from the wheels to slow the
vehicle down. When this happens, the electrical energy goes to the battery to be stored.
0 200 400 600 800 1000 120029
30
31
32
33
34
35
36
Time (s)
Batt
ery
Sta
te o
f C
ha
rge
(%
)

38
After regenerative braking occurs, the battery goes into charge depleting mode, where
energy in the battery is used to power the accessories, until the battery depletes to 30%
state of charge. The battery remains charge sustaining for this mode of operation.
The fuel economy for a conventional bus, bus with electrified accessories, and a
bus with electrified accessories utilizing regenerative braking is shown in Table 3.
Table 3- Fuel Economy
Conventional Electric w/out
Regen Electric w/
Regen
Fuel Consumption (mpg) 2.16 2.17 2.45
% Increase - 0.5% 13.4%
The conventional bus and the bus with electrified accessories without regenerative
braking had similar fuel economies. However, the bus that utilized regenerative braking
experienced an increase in fuel economy by 13.4%, which shows that significant
increases in fuel economy can be obtained on a bus by electrifying the accessories and
implementing regenerative braking.
CHAPTER 5: CONCLUSION
5.1 Significance of Work
The purpose of this research was to develop models of the main accessory loads
that are commonly used on buses and determine the effects of electrifying these

39
accessories on the vehicle’s fuel economy. Hybrid electric bus powertrains have
previously been developed to increase fuel economy, however, these increases come at a
large financial price. This study determined that using a smaller electric machine and
battery to power the accessory loads produces a significant increase in fuel economy over
a drive cycle. The findings from this research show that further development of a bus
powertrain architecture that centers on electrified accessories instead of hybridizing the
traction system is advantageous from a fuel economy standpoint.
5.2 Future Work
The future of this project is to complete the additional objectives listed in Chapter
2. First, more complete models of accessories need to be developed. These models should
include the transient responses of the accessories, because electric accessories can draw
significantly higher amounts of current when turning on. This can lead to higher amounts
of energy consumed by the accessories than in the simulations if the accessories turn on
and off often.
Control schemes also need to be developed for each accessory. Currently, each
accessory runs off a duty cycle, which determines whether the accessory is on or off.
These duty cycles represent how often each accessory should be on over a drive cycle,
but not why the accessory turns on. This means that the energy consumed by each
accessory over a cycle is a function of the length of the cycle and nothing else. However,
controlling the accessory loads will affect when the accessories are on.

40
The fan controls the engine temperature. However, to control the engine
temperature, the temperature of the engine must first be calculated. To do this, a thermal
model of the engine must be developed that can accurately determine the temperature of
the engine. After this, the fan control system can be implemented that uses the fan to cool
the engine, so the fan only turns on when cooling is required.
Similarly, the HVAC controls the cabin temperature, so to develop a control
scheme for the HVAC, an accurate thermal model of the cabin must first be developed.
Once the cabin temperature is known, then a control scheme for the HVAC can be
developed that sets the cabin temperature to a constant value and only requires the HVAC
to turn on when the temperature needs to be changed.
The air compressor controls the pressure in the air tank. But to control the
pressure in the tank, the amount of air used from the tank needs to be known, so the
pressure in the tank can accurately be calculated. Once this is done, a control scheme for
the air compressor can be developed.
The power steering pump controls the pressure in the hydraulic reservoir. The
pressure in the reservoir depends on the amount of steering that is done while driving the
vehicle. Once the pressure in the reservoir is determined, a control system for the power
steering pump can be developed.
The battery that is currently in the simulator is a high voltage battery. The
powertrain architecture calls for a smaller, 24 volt battery, so this model will have to be
developed. This will impact the control scheme because far less electrical energy will be
able to be stored on the vehicle. This means that capturing all of the regenerative braking

41
energy will be challenging, as well as supplying power to the accessories when the
engine cannot supply sufficient energy.
42
BIBLIOGRAPHY
[1] International Energy Outlook 2013. U.S. Energy Information Administration.
July 25, 2013. [Online]. http://www.eia.gov/forecasts/ieo/
[2] Primary Energy Consumption by Source and Sector, 2012. U.S. Energy
Information Administration. January 2014. [Online].
http://www.eia.gov/totalenergy/data/monthly/pdf/flow/primary_energy.pdf
[3] 2010 Status of the Nation’s Highways, Bridges, and Transit: Conditions and
Performance. U.S. Department of Transportation, Federal Highway
Administration. [Online]. http://www.fhwa.dot.gov/policy/2010cpr/chap2.htm
[4] The Eaton Hybrid Electric System. Eaton Corporation. June 2009. [Online].
http://www.eaton.com/EN/ecm/groups/public/@pub/@eaton/@hyd/documents/co
ntent/ct_243198.pdf
[5] Wu, Y., Chen, B., Huang, K. The Effects of Control Strategy and Driving Pattern
on the Fuel Economy and Exhaust Emissions of a Hybrid Electric Bus. SAE
Paper, 2008-01-0306, 2008.
[6] Shefali Rangananthan. Hybrid Buses Cost and Benefits. EESI. [Online]
http://www.eesi.org/files/eesi_hybrid_bus_032007.pdf
[7] BAE Systems. Hybridrive 2013. [Online].
http://www.hybridrive.com/flash/busdemo.asp
[8] Barnett, R. In-Use Performance Comparison of Hybrid Electric, CNG, and Diesel
Buses at New York City Transit. SAE Paper, 2008-01-1556, 2008.
43
[9] Serrao, Lorenzo. A Comparative Analysis of Energy Management Strategies for
Hybrid Electric Vehicles. Ph.D. Dissertation. The Ohio State University. 2009.
[10] Manhattan Bus Cycle. DieselNet. 2003. [Online].
http://www.dieselnet.com/standards/cycles/manhattan.php
[11] Synchronous Motors. All About Circuits. 2012. [Online].
http://www.allaboutcircuits.com/vol_2/chpt_13/2.html
[12] Karim Nice. How Car Steering Works. How stuff works. 2001. [Online].
http://auto.howstuffworks.com/steering4.htm
[13] Refrigeration Compressors and Air Conditioning Compressors Information. HIS
GlobalSpec. 2014. [Online].
http://www.globalspec.com/learnmore/building_construction/hvac/ventilation/
refrigeration_compressors_air_conditioning_compressors
[14] Zhang, Q. Canova, M. Lumped-Parameter Modeling of an Automotive Air
Conditioning System for Energy Optimization and Management. The Ohio State
University, Center for Automotive Research
[15] Jackson, M. EMP’s Mini-Hybrid Thermal System. EMP. [Online].
http://www.slideshare.net/marcusjolaine/mh8-minihybrid-gen2-overview
[16] How Does a DC to AC Power Converter Work? eHow. [Online].
http://www.ehow.com/how-does_5202726_dc-ac-power-converter-work_.html
[17] Source Resistance: The Efficiency Killer in DC-DC Converter Circuits. Maxim
Intergrated. [Online]. 2004. http://www.maximintegrated.com/app-
notes/index.mvp/id/3166

44
[18] How Much of your DC Power Comes Out as AC Power. Solar-facts. [Online].
http://www.solar-facts.com/inverters/inverter-efficiency.php
[19] Guezennec, Y. Driving Cycles. ME-7384 Class Lectures. The Ohio State
University. 2013.