power measurement application online help
TRANSCRIPT

A
Power Measurement Application
Online Help

Notices© Agilent Technologies, Inc. 2007-2008
No part of this manual may be reproduced in any form or by any means (including electronic storage and retrieval or transla-tion into a foreign language) without prior agreement and written consent from Agi-lent Technologies, Inc. as governed by United States and international copyright laws.
Manual Part Number
Version 01.10.0001
Edition
March 21, 2008
Available in electronic format only
Agilent Technologies, Inc.1900 Garden of the Gods Road Colorado Springs, CO 80907 USA
Warranty
The material contained in this docu-ment is provided “as is,” and is sub-ject to being changed, without notice, in future editions. Further, to the max-imum extent permitted by applicable law, Agilent disclaims all warranties, either express or implied, with regard to this manual and any information contained herein, including but not limited to the implied warranties of merchantability and fitness for a par-ticular purpose. Agilent shall not be liable for errors or for incidental or consequential damages in connection with the furnishing, use, or perfor-mance of this document or of any information contained herein. Should Agilent and the user have a separate written agreement with warranty terms covering the material in this document that conflict with these terms, the warranty terms in the sep-arate agreement shall control.
Technology Licenses
The hardware and/or software described in this document are furnished under a license and may be used or copied only in accordance with the terms of such license.
Restricted Rights Legend
If software is for use in the performance of a U.S. Government prime contract or sub-contract, Software is delivered and licensed as “Commercial computer soft-ware” as defined in DFAR 252.227-7014 (June 1995), or as a “commercial item” as defined in FAR 2.101(a) or as “Restricted computer software” as defined in FAR 52.227-19 (June 1987) or any equivalent
agency regulation or contract clause. Use, duplication or disclosure of Software is subject to Agilent Technologies’ standard commercial license terms, and non-DOD Departments and Agencies of the U.S. Gov-ernment will receive no greater than Restricted Rights as defined in FAR 52.227-19(c)(1-2) (June 1987). U.S. Govern-ment users will receive no greater than Limited Rights as defined in FAR 52.227-14 (June 1987) or DFAR 252.227-7015 (b)(2) (November 1995), as applicable in any technical data.
Safety Notices
CAUTION
A CAUTION notice denotes a haz-ard. It calls attention to an operat-ing procedure, practice, or the like that, if not correctly performed or adhered to, could result in damage to the product or loss of important data. Do not proceed beyond a CAUTION notice until the indicated conditions are fully understood and met.
WARNING
A WARNING notice denotes a hazard. It calls attention to an operating procedure, practice, or the like that, if not correctly per-formed or adhered to, could result in personal injury or death. Do not proceed beyond a WARNING notice until the indicated condi-tions are fully understood and met.
Trademarks
Microsoft®, MS-DOS®, Windows®, Win-dows 2000®, and Windows XP® are U.S. registered trademarks of Microsoft Corpo-ration.
Adobe®, Acrobat®, and the Acrobat Logo® are trademarks of Adobe Systems Incorporated.

Power Measurement Application Online Help 3
Power Measurement Application—At a Glance
The Agilent U1881A or U1882A Power Measurement and Analysis Software, along with a 6000/7000 Series or 8000 Series oscilloscope, lets you quickly and easily analyze switching power supply efficiency and reliability.
With the Power Measurement Application, you can:
• Measure switching loss at the switching device and power loss at the magnetic component (to help improve efficiency).
• Analyze Safe Operating Area (SOA), dI/dT, and dV/dT (for reliable operation).
• Automate oscilloscope set up for ripple measurements (to eliminate tedious manual oscilloscope set up).
• Perform pre- compliance testing to IEC 61000- 3- 2 or RTCA DO- 160E standards (to reduce compliance testing time).
• Analyze line power with total harmonic distortion, true power, apparent power, power factor, and crest factor tests (to quickly provide power quality information)
• Measure output noise.
Figure 1 Switch-Mode Power Supply (SMPS) Block Diagram and Types of Measurements

4 Power Measurement Application Online Help
• Analyze modulation using the on- time and off- time information of a Pulse Width Modulation (PWM) signal (to help characterize the active power factor).
The power measurement and analysis software, oscilloscope, high- voltage differential probe, current probe, probe deskew fixture, and passive probe, form a complete power measurement system for power supply design and testing.
This software can run on an external PC connected to a 6000/7000 Series or 8000 Series oscilloscope via GPIB, LAN, or USB, or it can run on 8000 Series oscilloscopes (which have the Windows XP Professional operating system).
This online help describes:
• "Prerequisites" on page 9
• "Getting Started" on page 19
• "Performing Other Tasks" on page 39
• "About the Measurements" on page 55
• "Reference" on page 99
For a printable version of this help file, see: "Power Measurement Application Online Help".

Power Measurement Application Online Help 5
ContentsPower Measurement Application—At a Glance 3
1 Prerequisites
Safety 10
Oscilloscope Requirements 11
Bandwidth Requirements 11Memory Requirements 11Software Version Requirements 12
Probe Requirements 13
Voltage Probe 13Current Probe 14De-Skewing the Voltage and Current Probes 14
Installing Agilent IO Libraries Suite 15
Installing and Licensing the Power Measurement Application Software 16
Installing the Power Measurement Application 16Licensing the Power Measurement Application 16
2 Getting Started
Step 1: Add the instrument using Agilent Connection Expert 20
Step 2: Start the Power Measurement Application 24
Step 3: Connect to the oscilloscope 25
If there are problems connecting to the oscilloscope 26
Step 4: Perform channel deskew 27
Step 5: Select the tests to run 31
Step 6: Make connections to the device under test 32
Step 7: Change the test parameters (if desired) 33
Step 8: Run the tests 34
Step 9: View the test results 35
3 Performing Other Tasks
Viewing Multiple Waveform Graphs 40

6 Power Measurement Application Online Help
Zooming in on Waveforms 41
Scaling Waveforms 43
Making Gated Measurements 45
Showing Cursors 46
Saving and Opening Projects 48
To save a project 48To open a project 48
Performing Tests Offline with Saved Waveforms 50
To export waveforms 50To select waveforms in the Test Configuration 51
Building Safe Operating Area Masks 53
4 About the Measurements
Global Test Configuration Parameters 56
Scope Settings 56Online Mode vs. Offline Mode 56Device Under Test (DUT) Details 57Global Voltage Settings 57Global Current Settings 57
Input Line Analysis Tests 58
Current Harmonics 60Power Quality 62
Inrush Current Analysis Tests 65
Inrush Current 66
Modulation Analysis Tests 68
Frequency 69Period 71Duty Cycle 72Positive Pulse Width 73
Power Device Analysis Tests 75
Switching Loss 76Safe Operating Area 79dV/dT 81dI/dT 83Dynamic On Resistance, Rds 85
Output Analysis Tests 87
Output Voltage Ripple 87

Power Measurement Application Online Help 7
Turn On/Off Analysis Tests 91
Turn On Time 92Turn Off Time 93
Transient Analysis Tests 95
Load Transient Response 96
5 Reference
Menus 100
File Menu 100View Menu 101Help Menu 102
Dialogs 104
Safe Operating Area Mask Editor Dialog 104
6 Glossary
Index

8 Power Measurement Application Online Help

A 9
Power Measurement Application Online Help
1Prerequisites
Safety 10
Oscilloscope Requirements 11
Probe Requirements 13
Installing Agilent IO Libraries Suite 15
Installing and Licensing the Power Measurement Application Software 16
This chapter describes safety considerations and the necessary requirements in order to use the Power Measurement Application.

10 Power Measurement Application Online Help
1 Prerequisites
Safety
WARNING When connecting to a circuit with hazardous voltages, see the warnings for the individual products, and verify that the probes and other components are used within their ratings.

Prerequisites 1
Power Measurement Application Online Help 11
Oscilloscope Requirements
The Power Measurement Application works with 6000, 7000, and 8000 Series digital storage oscilloscopes (DSO).
• The 6000 Series oscilloscopes come in 100 MHz, 300 MHz, 500 MHz, and 1 GHz bandwidth models, with 2 Mpts or 8 Mpts of memory.
• The 7000 Series oscilloscopes come in 350 MHz, 500 MHz, and 1 GHz bandwidth models, with 8 Mpts of memory.
• The 8000 series oscilloscopes come in 600 MHz and 1 GHz bandwidth models, with 8, 16, 32, 64, or 128 Mpts of memory.
Characteristics of the power supply under test determine the oscilloscope bandwidth and memory required.
• “Bandwidth Requirements" on page 11
• “Memory Requirements" on page 11
• “Software Version Requirements" on page 12
Bandwidth Requirements
The bandwidth requirements of the oscilloscope and probe are driven by the slew rate (rise/fall times) of the switching device.
For oscilloscopes with Gaussian response (typical for 1 GHz and lower bandwidth oscilloscopes), the oscilloscope's rise time is commonly related to the oscilloscope's bandwidth using the formula: rise time = 0.35/bandwidth. To measure an input signal's rise time with ±5% error, the oscillosope's rise time must be 1/3 of the input signal's rise time. Therefore, the oscilloscope bandwidth required is:
BW = [ 0.35 / (input signal rise time / 3) ]
For example, a switching device whose rise time is 10 ns requires oscilloscope (and probe) bandwidth of 105 MHz.
Memory Requirements
The memory requirements of the oscilloscope depend on the time range and the types of signals to capture:
memory depth = time range * sample rate
• For switching device signals: If you need to capture the switching signals for the duration of half the mains cycle (60 Hz), with a slew rate of 50 ns (using a sampling rate that is four times the required bandwidth), memory depth = 8.333 ms * 21 MHz * 4 = 699972 points.

12 Power Measurement Application Online Help
1 Prerequisites
With 6000 and 7000 Series oscilloscopes, the sampling rate is determined by time range setting. In the above case, the sample rate in High Resolution mode for the time range of 8.333 ms is 100 MSa/s; therefore, the memory depth needed is 833300 points.
• For input AC line signals: You need to capture a few cycles in order to plot the FFT. Resolution of the FFT plot = sampling rate / data size. The expected harmonics are in multiples of 50/60 Hz.
Because the input signals have low frequency components, a high sampling rate is unnecessary. The RTCA- DO- 160E specification states that a sampling rate of 100 kSa/s and higher should be sufficient. For a 60 Hz signal, to capture 10 cycles you need to capture a duration of 83.33 ms.
The 6000 and 7000 Series oscilloscopes set the sampling rate to be 1 MSa/s for the above time range. The memory depth required is 83330 points with an FFT resolution of 12 Hz.
• For safe operating area (SOA) measurements, you may want to capture many switching cycles (you can select up to 20000) to see any variation of Vds versus Id over a long time.
Software Version Requirements
Table 1 Oscilloscope Software Version Required
Oscilloscope Family Software Version Required
6000 Series 4.10 or later
7000 Series 5.00 or later
8000 Series 5.30 or later

Prerequisites 1
Power Measurement Application Online Help 13
Probe Requirements
• “Voltage Probe" on page 13
• “Current Probe" on page 14
• “De- Skewing the Voltage and Current Probes" on page 14
Voltage Probe
You can use the following voltage probes:
• Agilent N2772A high- voltage differential probe, 20 MHz bandwidth, 1.2 kV dynamic range.
• Agilent 1153A differential probe, 200 MHz bandwidth, 400 V dynamic range.
• Agilent 1141A differential probe, 200 MHz bandwidth, 400 V dynamic range.
• Sapphire SI- 9110 high- voltage differential probe, 100 MHz bandwidth, 1.4 kV dynamic range.
• Tektronix P5205 high- voltage differential probe, 100 MHz bandwidth, 1.3 kV dynamic range.
• Agilent 10076A high- voltage passive probe, 250 MHz bandwidth, 4 kV max. input.
• Agilent 10074A/B/C passive probe, 150 MHz bandwidth, 400 V max. input.
• Agilent 10073A/B/C passive probe, 500 MHz bandwidth, 400 V max. input.
• Agilent 10070A/B/C passive probe, 20 MHz bandwidth, 400 V max. input.
• Agilent N2862A passive probe, 150 MHz bandwidth, 300 V max. input.
• Agilent N2863A passive probe, 300 MHz bandwidth, 300 V max. input.
• Agilent 1160A passive probe, 500 MHz bandwidth, 300 V max. input.
• Agilent 1161A passive probe, 500 MHz bandwidth, 300 V max. input.
• Agilent 1162A passive probe, 25 MHz bandwidth, 300 V max. input.
• Agilent 1165A passive probe, 600 MHz bandwidth, 300 V max. input.
For voltage probe bandwidth requirements, see “Bandwidth Requirements" on page 11.

14 Power Measurement Application Online Help
1 Prerequisites
The probe's voltage range required depends on the input signals to measure. An AC- DC switch mode power supply needs a high voltage range probe because the switching signals and input line signals can go up to 700 Vpp. For a DC- DC switch mode power supply, a smaller probe voltage range is sufficient because the signal amplitudes are much smaller.
A passive probe is typically used to measure DC output and transient response.
Current Probe
You can use the following Agilent current probes:
• 1147A 50 MHz bandwidth, 15A peak.
• N2774A 50 MHz bandwidth, 15A peak.
• N2780A 2 MHz bandwidth, 500A peak.
• N2781A 10 MHz bandwidth, 150A peak.
• N2782A 50 MHz bandwidth, 30A peak.
• N2783A 100 MHz bandwidth, 30A peak.
For current probe bandwidth requirements, see “Bandwidth Requirements" on page 11.
De-Skewing the Voltage and Current Probes
To ensure accurate power loss measurements, use the U1880A deskew fixture to adjust the skew for any time delay differences between the current probe and voltage probe signal paths.
The procedure on de- skewing probes is described in “Getting Started" on page 19.
Table 2 U1880A Deskew Fixture Environmental Characteristics
Temperature Operating: –10 °C to +55 °CNon-operating: –20 °C to +60 °C
Humidity Operating: 95% RH at 40 °C for 24 hrNon-operating: 90% RH at 65 °C for 24 hr
Altitude Operating: to 4,570 m (15,000 ft)Non-operating: to 15,244 m (50,000 ft)
Indoor use Rated for indoor use only

Prerequisites 1
Power Measurement Application Online Help 15
Installing Agilent IO Libraries Suite
The Agilent IO Libraries Suite is already installed on 8000 Series oscilloscopes.
If you are using the Power Measurement Application on a PC, download the Agilent IO Libraries Suite software from the web at:
• "http://www.agilent.com/find/iolib"
16 Power Measurement Application Online Help
1 Prerequisites
Installing and Licensing the Power Measurement Application Software
• “Installing the Power Measurement Application" on page 16
• “Licensing the Power Measurement Application" on page 16
Installing the Power Measurement Application
Install the Power Measurement Application software from one of the download web pages:
• Infiniium 8000 Series: "http://www.agilent.com/find/scope- apps- sw"
• 7000 Series: "http://www.agilent.com/find/7000sw"
• 6000 Series: "http://www.agilent.com/find/6000sw"
Follow the instructions on your entitlement certificate to redeem and install the Power Measurement Application license.
Licensing the Power Measurement Application
The Power Measurement Application uses node- locked licenses (not floating or counted licenses). You can install the Power Measurement Application on any PC or Windows- based oscilloscope; however, the license type determines how the application can be used with oscilloscopes. Two types of licenses are available:
• Oscilloscope- locked license (Option 001) — This enables any Power Measurement Application to connect to and use a licensed oscilloscope. This type of license permits multiple users to share an oscilloscope using a single license.
• PC- locked license (Option 002) — This enables the Power Measurement Application on a licensed PC to connect to and use any Agilent 6000/7000 Series or 8000 Series oscilloscope covered by the license. This type of license permits a single user to access different oscilloscopes using a single license and to perform offline analysis.
To license thePower
MeasurementApplication
1 Follow the instructions on the Entitlement Certificate you received with your software purchase.
• If you purchased an oscilloscope- locked license, you will need the unique identifier for the oscilloscope.
• If you purchased a PC- locked license, you will need the License Host ID (see "To get the License Host ID" below).
2 Your license will be delivered via e- mail.
• If you ordered an oscilloscope- locked license, the e- mail will contain an alphanumeric code. Enter this code directly into your instrument using the oscilloscope's interface (see the oscilloscope documentation for instructions on how to install feature licenses).

Prerequisites 1
Power Measurement Application Online Help 17
• If you ordered a PC- locked license, the e- mail will contain a file attachment. Copy this file to where your Power Measurement Application is installed. For example, the default license file location is:
C:\Program Files\Agilent\Scope\Apps\Power Measurement\License\
To get the LicenseHost ID
1 In the Power Measurement Application's main window, choose Help>Licensing....
2 In the Licensing the Power Measurement Application dialog, the License Host ID is highlighted at the bottom.

18 Power Measurement Application Online Help
1 Prerequisites

A 19
Power Measurement Application Online Help
2Getting Started
Step 1: Add the instrument using Agilent Connection Expert 20
Step 2: Start the Power Measurement Application 24
Step 3: Connect to the oscilloscope 25
Step 4: Perform channel deskew 27
Step 5: Select the tests to run 31
Step 6: Make connections to the device under test 32
Step 7: Change the test parameters (if desired) 33
Step 8: Run the tests 34
Step 9: View the test results 35
This chapter gives an overview of the steps you must take when first performing power measurements.
20 Power Measurement Application Online Help
2 Getting Started
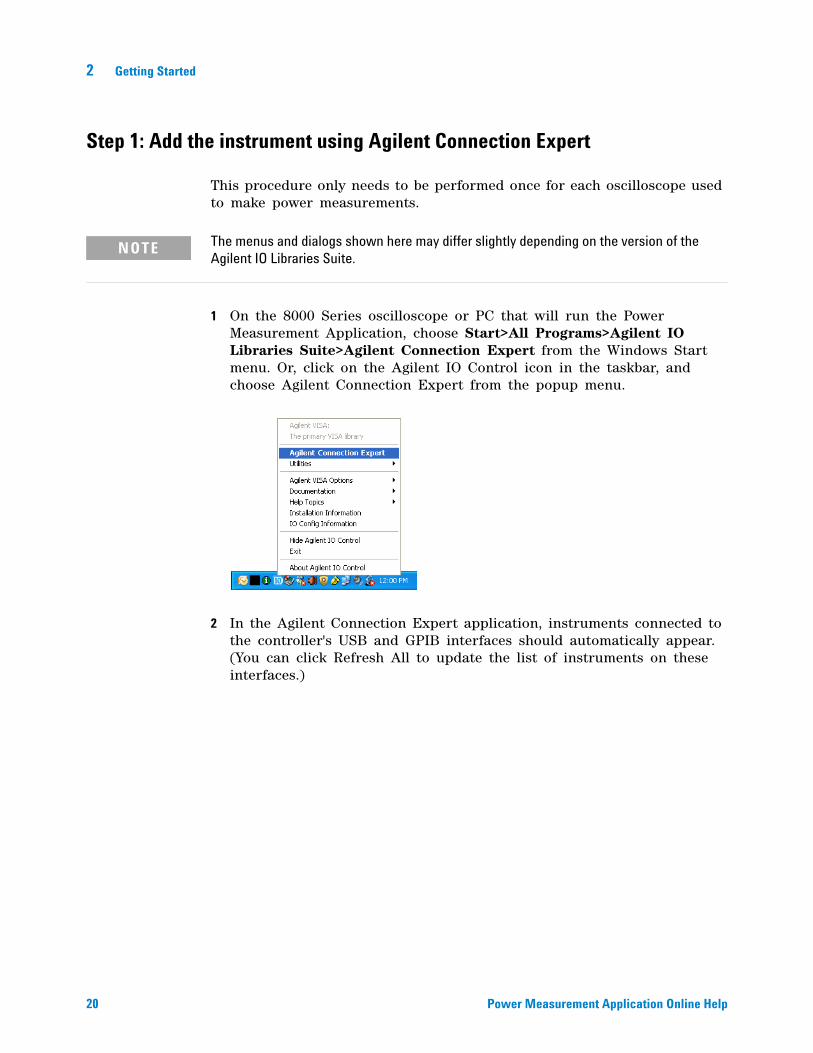
Step 1: Add the instrument using Agilent Connection Expert
This procedure only needs to be performed once for each oscilloscope used to make power measurements.
1 On the 8000 Series oscilloscope or PC that will run the Power Measurement Application, choose Start>All Programs>Agilent IO Libraries Suite>Agilent Connection Expert from the Windows Start menu. Or, click on the Agilent IO Control icon in the taskbar, and choose Agilent Connection Expert from the popup menu.
2 In the Agilent Connection Expert application, instruments connected to the controller's USB and GPIB interfaces should automatically appear. (You can click Refresh All to update the list of instruments on these interfaces.)
NOTE The menus and dialogs shown here may differ slightly depending on the version of the Agilent IO Libraries Suite.

Getting Started 2
Power Measurement Application Online Help 21
You must manually add instruments on LAN interfaces:
a Right- click on the LAN interface, choose Add Instrument from the popup menu, and click OK in the resulting dialog (because the desired interface is already selected).
b If the oscilloscope is on the same subnet, select it and click OK.

22 Power Measurement Application Online Help
2 Getting Started
Otherwise, click Add Address (or if you have a version of the IO Libraries that doesn't have Auto Find, select the LAN interface and click OK).
c In the next dialog, select either Hostname or IP address, and enter the oscilloscope's hostname or IP address.
d Click Test Connection.

Getting Started 2
Power Measurement Application Online Help 23
e If the instrument is successfully opened, click OK to close the dialog. If the instrument is not opened successfully, go back and verify the LAN connections and the oscilloscope setup.
3 In the Agilent Connection Expert application, choose File>Exit from the menu to exit the application.
Next • "Step 2: Start the Power Measurement Application" on page 24

24 Power Measurement Application Online Help
2 Getting Started
Step 2: Start the Power Measurement Application
Start the Power Measurement Application in one of these ways:
• By double- clicking the Power Measurement Application icon on the Windows Desktop.
• By choosing Start>All Programs>Agilent Scope Applications>Power Measurement>Power Measurement Application from the Windows Start menu.
• From within the Infiniium Oscilloscope application on an 8000 Series oscilloscope, choose Analyze>Automated Test Apps>Power Measurement.
Next • "Step 3: Connect to the oscilloscope" on page 25

Getting Started 2
Power Measurement Application Online Help 25
Step 3: Connect to the oscilloscope
1 In the Power Measurement Application, choose File>Connect To Oscilloscope.
2 In the Instrument Connection dialog, select the oscilloscope you want to connect to; then, click Connect.
If the connection is successful, "Connected" will appear at the bottom of the dialog.
If the connection is not successful, see "If there are problems connecting to the oscilloscope" on page 26.
3 Click Close the Instrument Connection dialog.
The status bar at the bottom of the Power Measurement Application also displays the connection status.
The Power Measurement Application remembers your oscilloscope connection, and will attempt to make the same connection the next time you start the application.

26 Power Measurement Application Online Help
2 Getting Started
Next • "Step 4: Perform channel deskew" on page 27
If there are problems connecting to the oscilloscope
The oscilloscope list in the Instrument Connection dialog is synchronized from Agilent Connection Expert. If the Agilent Connection Expert is unable to detect the oscilloscope, the Power Measurement Application is also unable to detect the oscilloscope. There are two reasons this could happen:
• The oscilloscope is being used by others when the Power Measurement Application is trying to query it for information. If the application is unable to query the oscilloscope, it will not display in the list.
• The oscilloscope LAN connection is not stable. The oscilloscope LAN interface might disconnect for a small time interval before connecting back to the network.

Getting Started 2
Power Measurement Application Online Help 27
Step 4: Perform channel deskew
To make accurate power loss measurements, you must perform current and voltage channel deskew using the U1880A deskew fixture. The channel deskew procedure calibrates the time delay between current and voltage probes.
You need to perform the deskew procedure once initially, and you should re- run the procedure when any part of the hardware setup changes (for example, a different probe, different oscilloscope channel, etc.) or when the abmient temperature changes.
The first time you run a measurement in each Power Measurement Application session, you are asked whether you want to perform the deskew procedure. There is an option in the Scope Settings configuration to turn this question off or on.
To perform the channel deskew:
1 First, demagnetize and zero- adjust the current probe. Refer to the current probe's documentation for instructions on how to do this.
2 Make connections to the U1880A deskew fixture:
a Connect D+ and D- of the high- voltage differential probe to the deskew fixture.
b Connect the current probe to the current loop with the direction of the arrow pointing towards the current flow.
Small Loop Large Loop
For current probes: • 1147A (50 MHz, 15A)• N2774A (50 MHz, 15A)• N2782A (50 MHz, 30A)• N2783A (100 MHz, 30A)
• N2780A (2 MHz, 500A)• N2781A (10 MHz, 150A)
Connect high-voltage differential probe to either:
• J5 (2.54 mm connector)• J6 and J7 (alligator type)
• J2 (2.54 mm connector)• J3 and J4 (alligator type)

28 Power Measurement Application Online Help
2 Getting Started
c Make sure the switch on the deskew fixture is set to the appropriate side of the fixture (either "small loop" or "large loop").
d Connect the deskew fixture to a USB port on your oscilloscope or a PC using a USB cable. The USB port supplies power to the deskew fixture.
3 In the Power Measurement Application's Test Selection area, select Deskew.
4 Select the Channel Deskew check box.

Getting Started 2
Power Measurement Application Online Help 29
5 Make sure Fully Automated is selected for the Oscilloscope Set Up parameter.
For more information on test parameter settings, see "Global Test Configuration Parameters" on page 56.
6 Click Run Tests.
7 If you are asked whether you would like to use previous deskew values, click No.
8 In the Channel Deskew dialog, select the voltage and current channels and attenuation factors; then, click Perform Deskew.

30 Power Measurement Application Online Help
2 Getting Started
When the deskew process completes, you see a message at the bottom of the dialog indicating whether the deskew was successful.
9 Click Done to close the Channel Deskew dialog.
The deskew values are saved.
The next time you launch the Power Measurement Application, you can use the saved deskew values or perform the deskew again.
Generally, you need to perform the deskew again when part of the test setup changes (for example, a different probe, different oscilloscope channel, etc.) or when the ambient temperature has changed.
See Also • "U1880A Deskew Fixture User's Guide".
Next • "Step 5: Select the tests to run" on page 31

Getting Started 2
Power Measurement Application Online Help 31
Step 5: Select the tests to run
1 In the Power Measurement Application's Test Selection area, select the test group.
The following test groups are available:
• Input Line Analysis
• Inrush Current Analysis
• Modulation Analysis
• Power Device Analysis
• Output Analysis
• Turn On/Off Analysis
• Transient Analysis
2 To select individual tests within a test group, select their check boxes.
Next • "Step 6: Make connections to the device under test" on page 32

32 Power Measurement Application Online Help
2 Getting Started
Step 6: Make connections to the device under test
1 Connect the oscilloscope probes to the device under test. See the Connection Diagram tab.
The same connection is used for all the tests within a group.
Next • "Step 7: Change the test parameters (if desired)" on page 33

Getting Started 2
Power Measurement Application Online Help 33
Step 7: Change the test parameters (if desired)
1 If you want to change any test parameters, go to the Test Configuration tab, and enter the new parameter values.
Each test group can have unique configuration parameters. Other configuration parameters are used for all measurements.
For more information on test parameter settings, see "Global Test Configuration Parameters" on page 56.
Next • "Step 8: Run the tests" on page 34

34 Power Measurement Application Online Help
2 Getting Started
Step 8: Run the tests
1 Click Run Tests.
Next • "Step 9: View the test results" on page 35

Getting Started 2
Power Measurement Application Online Help 35
Step 9: View the test results
Once the test is completed, you can view the results in the following ways:
• By viewing waveforms (see page 35).
• By looking at the calculated results (see page 35).
• By viewing the test report (see page 36).
You can click the View Results tab to view the waveforms and the calculated results.
ViewingWaveforms
You can view waveforms in the waveform display area.
In the waveform area, you can also:
• View multiple waveform graphs (see page 40).
• Use cursors (see page 46).
• Zoom in on waveforms (see page 41).
• Scale waveforms (see page 43).
• Re- run measurements on portions of the captured waveforms (cursor measurements) (see page 45).
Looking at theCalculated
Results
Below the waveforms are the test result values.

36 Power Measurement Application Online Help
2 Getting Started
When results have time stamps, clicking those rows will place markers in the waveform view.
To learn more about the tests, their results, and how the results are calculated, see "About the Measurements" on page 55.
Viewing the TestReport
You can:
• View the test report by clicking the Test Report tab.
• Print the test report by choosing File>Print.
• Export the test report by choosing File>Export Report.
See Also • "Performing Other Tasks" on page 39

Getting Started 2
Power Measurement Application Online Help 37
• "About the Measurements" on page 55
• "Reference" on page 99

38 Power Measurement Application Online Help
2 Getting Started

A 39
Power Measurement Application Online Help
3Performing Other Tasks
Viewing Multiple Waveform Graphs 40
Showing Cursors 46
Zooming in on Waveforms 41
Scaling Waveforms 43
Making Gated Measurements 45
Saving and Opening Projects 48
Performing Tests Offline with Saved Waveforms 50
Building Safe Operating Area Masks 53
This chapter shows you how to use additional Power Measurement Application features.

40 Power Measurement Application Online Help
3 Performing Other Tasks
Viewing Multiple Waveform Graphs
When viewing waveforms, you can split the waveform view into two or four panels.
1 Click one of the following icons or choose one of the following commands:
2 Use the check boxes to select the waveforms you want to view in each graph.
Click the icon: Or choose the command:
View>Two Graphs
View>Four Quadrant Graphs
View>Four Grid Graphs

Performing Other Tasks 3
Power Measurement Application Online Help 41
Zooming in on Waveforms
When viewing waveforms, you can zoom in on them.
1 In a waveform graph, hold down the mouse button and drag over the area you want to zoom in on; release the mouse button, and click Waveform Zoom in the popup menu.
The resulting waveform graph displays the area you highlighted.
2 You can continue to highlight and zoom in on areas of the waveform.
3 To undo or redo zoom, click Undo or Redo in the Zoom dialog, click the undo zoom or redo zoom buttons in the toolbar, or choose View>Undo Zoom or View>Redo Zoom from the menu.

42 Power Measurement Application Online Help
3 Performing Other Tasks
4 To return to the original view, click the autoscale button in the toolbar or choose View>Autoscale from the menu.

Performing Other Tasks 3
Power Measurement Application Online Help 43
Scaling Waveforms
In addition to zooming in on waveforms and undoing waveform zoom, you can scale waveforms by clicking buttons or entering scale values.
To change awaveform's time
scale
To change awaveform's
vertical scale
To enter scalevalues
1 Click a scale value.
2 In the Enter Scale dialog, either click buttons or type in a value.
Click the button: To:
Increase the time scale per division.
Decrease the time scale per division.
Offset the time scale to the left.
Zero the time scale offset.
Offset the time scale to the right.
Click the button: To:
Increase the vertical scale for the waveform.
Decrease the vertical scale for the waveform.

44 Power Measurement Application Online Help
3 Performing Other Tasks
3 Click OK.
To return to theoriginal view
Click the autoscale button in the toolbar or choose View>Autoscale from the menu.

Performing Other Tasks 3
Power Measurement Application Online Help 45
Making Gated Measurements
With the Power Device Analysis and the Modulation Analysis tests, you can make gated measurements. These measurements let you re- run tests on portions of the captured waveforms.
To make gated measurements:
1 Run a normal Power Device Analysis or Modulation Analysis test to capture waveforms.
2 Check the box to enable Acquisition Gating.
3 Drag the red vertical bars in the waveform display to select the portion of the captured waveforms on which you want to re- run the tests.
4 Click Update Tests.
If results are displayed for the test, they are re- calculated for the selected portion of the waveforms.

46 Power Measurement Application Online Help
3 Performing Other Tasks
Showing Cursors
You can enable and view cursors on a selected waveform.
1 Click Show Waveform Cursors.
2 In the Show Waveform Cursors dialog, check Enable Waveform Cursors, and click Close.
3 Click one of the waveforms in the vertical scal area to highlight it .
4 Then, click on the waveform to place the cursor.
The cursor values are displayed in a tool tip popup.

Performing Other Tasks 3
Power Measurement Application Online Help 47
When waveforms are displayed for calculated results, you can show a cursor to display waveform values.
1 Check the Show Cursor check box.
2 Click on the waveform to place the cursor.
The waveform values at the cursor are displayed in a tool tip popup.
48 Power Measurement Application Online Help
3 Performing Other Tasks
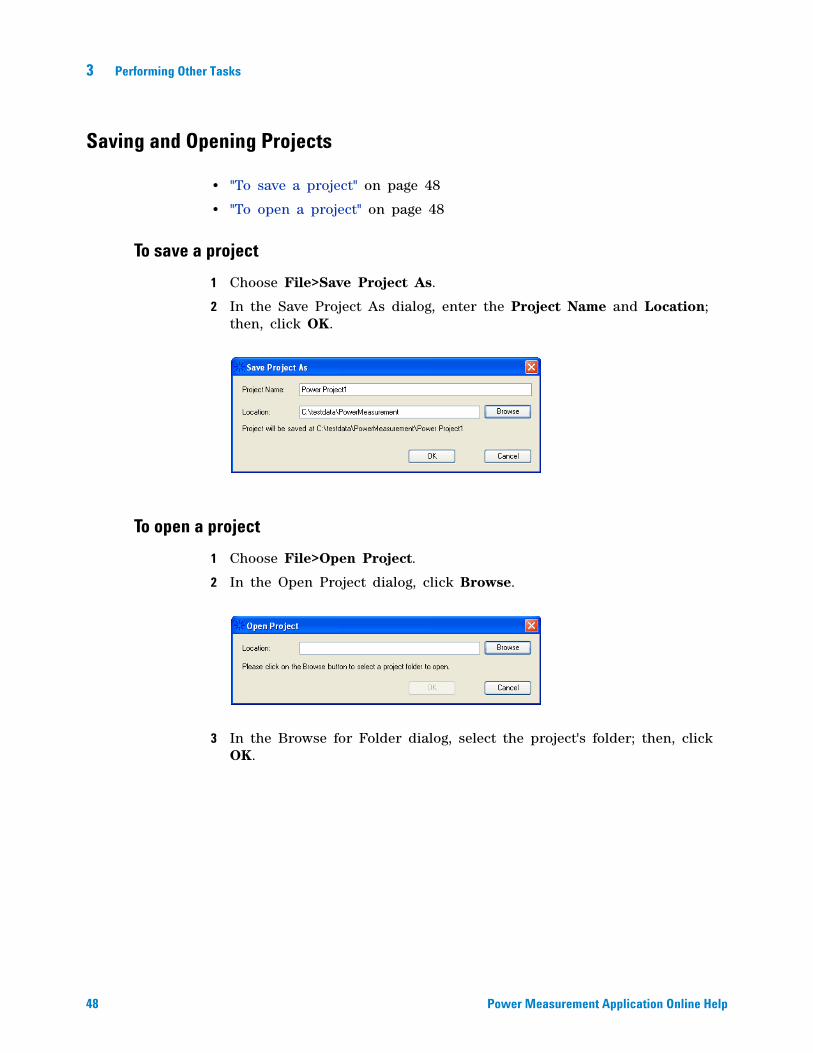
Saving and Opening Projects
• "To save a project" on page 48
• "To open a project" on page 48
To save a project
1 Choose File>Save Project As.
2 In the Save Project As dialog, enter the Project Name and Location; then, click OK.
To open a project
1 Choose File>Open Project.
2 In the Open Project dialog, click Browse.
3 In the Browse for Folder dialog, select the project's folder; then, click OK.

Performing Other Tasks 3
Power Measurement Application Online Help 49
4 Back in the Open Project dialog, click OK.

50 Power Measurement Application Online Help
3 Performing Other Tasks
Performing Tests Offline with Saved Waveforms
When the Power Measurement Application has a PC- locked license, you can re- run tests on saved waveforms when offline, that is, when no oscilloscope is connected.
Before you can perform offline analysis of waveforms, they must first be saved from the Power Measurement Application.
Then, to perform analysis on saved waveforms, select Offline Mode in the Test Configuration tab and select the waveforms as the Voltage Channel and Current Channel parameters.
• "To export waveforms" on page 50
• "To select waveforms in the Test Configuration" on page 51
Because of its interactive nature, the Load Transient Response test cannot be performed when offline.
To export waveforms
1 Choose File>Export Waveform.
2 In the Export Waveform dialog, select the test and waveform; then, click Save.
3 In the Save Waveform dialog, enter the name of the .wfm file; then, click Save.

Performing Other Tasks 3
Power Measurement Application Online Help 51
4 Click Cancel to close the Export Waveform dialog.
To select waveforms in the Test Configuration
To perform offline analysis of waveforms:
1 Set up the test as you would normally, but skip the step of making connections to the device under test.
2 In the Test Configuration tab, select Offline Mode.
3 For the Voltage Channel and Current Channel parameters, browse for the saved waveform file to open; then, click Open.

52 Power Measurement Application Online Help
3 Performing Other Tasks
4 Click Run Tests to perform analysis on the saved waveforms.

Performing Other Tasks 3
Power Measurement Application Online Help 53
Building Safe Operating Area Masks
You can define your own masks using the Safe Operating Area Mask Editor.
To start the Safe Operating Area Mask Editor:
• In the Test Configuration tab for the Power Device Analysis tests, select the Safe Operating Area Mask parameter and click Edit to edit the selected mask.
You can specify the minimum and maximum values for the current and voltage axes by clicking in the fields and entering new values.
When drawing the mask area:
• To add points to the mask polygon, click Add Point; then, move the mouse pointer to the desired location and click to add the point.
• To remove points from the mask polygon, click Delete Point; then, click the point you want to delete.
• You can drag points or enter their voltage and current values in fields on the right- hand side of the display.
• You can Undo and Redo actions.

54 Power Measurement Application Online Help
3 Performing Other Tasks
You can export masks to save them, and you can import masks to edit previously saved masks.
When you are done editing a mask, click OK.
You can select saved masks in the Test Configuration tab for the Power Device Analysis tests.

A 55
Power Measurement Application Online Help
4About the Measurements
Global Test Configuration Parameters 56
Input Line Analysis Tests 58
Inrush Current Analysis Tests 65
Modulation Analysis Tests 68
Power Device Analysis Tests 75
Output Analysis Tests 87
Turn On/Off Analysis Tests 91
Transient Analysis Tests 95
This chapter describes the tests you can perform with the Power Measurement Application, their configuration parameters, and their results.

56 Power Measurement Application Online Help
4 About the Measurements
Global Test Configuration Parameters
The following test configuration settings apply to all measurements.
• "Scope Settings" on page 56
• "Online Mode vs. Offline Mode" on page 56
• "Device Under Test (DUT) Details" on page 57
• "Global Voltage Settings" on page 57
• "Global Current Settings" on page 57
Scope Settings
The "Scope Settings" test configuration category contains these parameters:
Online Mode vs. Offline Mode
In offline mode, the Voltage Channel and Current Channel parameters use previously saved waveforms instead of specified oscilloscope channels (see "To select waveforms in the Test Configuration" on page 51).
Table 3 Scope Settings
Parameter Description
Oscilloscope Set Up Select "Fully Automated" if you wish to automatically set up the oscilloscope and capture waveforms. Select "Manual" if you wish to manually set the oscilloscope to capture the waveform for analysis.
Force Deskew Select "Yes" if you wish the application to run the channel deskew at the start of every session. Select "No" if you wish to skip channel deskew.

About the Measurements 4
Power Measurement Application Online Help 57
To perform measurements in offline mode, see "Performing Tests Offline with Saved Waveforms" on page 50.
Device Under Test (DUT) Details
Global Voltage Settings
Global Current Settings
Table 4 DUT Details
Parameter Description
DUT Name Enter the name of the device under test. If entered, the name is copied to the test report.
DUT Description Enter a description of the device under test. If entered, the description is copied to the test report.
Table 5 Voltage Settings
Parameter Description
Voltage Channel Select the channel number for the voltage.
Voltage Probe Attenuation Factor
Select the attenuation factor used for the high-voltage probe.The attenuation factor multiplied by the probe's maximum output voltage gives the maximum input signal. For example, the N2772A probe's maximum output voltage is ±6.5V, so a 200:1 attenuation ratio gives a maximum input signal of ±1,300V.
Table 6 Current Settings
Parameter Description
Current Channel Select the channel number for current.
Current Probe Attenuation Factor
Select the attenuation factor used for the current probe.

58 Power Measurement Application Online Help
4 About the Measurements
Input Line Analysis Tests
Perform measurement analysis on the input line signals.
• "Current Harmonics" on page 60
• "Power Quality" on page 62
Connection forInput Line
Analysis Tests
1 Connect D+ of the voltage probe to the live wire of the AC input. Connect D- of the voltage probe to the neutral wire of the AC input. Select the appropriate attenuation ratio of the probe.
2 Connect the current probe to the live wire of the AC input with the direction of the arrow pointing towards the current flow.
3 Connect the voltage probe to the oscilloscope channel defined by the user in the Test Configuration tab. Do the same for the current probe.
ConfigurationParameters for
Input LineAnalysis Tests
The input line analysis tests have the following configuration parameters in addition to the global test configuration parameters (see page 56).
Figure 2 Typical Configuration for Input Line Analysis Tests
Table 7 Time Scale Settings
Parameter Description
Number of Cycles Enter the number of cycles to capture in one acquisition.

About the Measurements 4
Power Measurement Application Online Help 59
Table 8 Analysis Settings
Parameter Description
Line Frequency Enter the line frequency.
Harmonics Unit Select the unit in which to display the current harmonics.• RMS — FFT(RMS) = FFT magnitude * 0.7071• dBuA — dBuA = 20 log (Irms/1uA)• dBm — measures signal power with reference power = 1mW.
dB = 10 log (power/reference_power)dBm = 10 log (Pin/1mW)With a fixed load:P = (V * V) / RP1/P2 = [(V1 * V1) / R] / [(V2 * V2) / R]10 log (P1/P2) = 10 log [(V1 * V1)] / [(V2 * V2)] = 20 log (V1/V2)So:dBm = 20 log (Vin/Vref)Assuming a standard 50 ohm load:Vref = Vpeak = Vrms/0.7071 = sqrt(P * R)/0.7071 = sqrt(1mW * 50 ohms)/0.7071Vref = Vpeak = 0.316228VFinally:dBm = 20 log (Vin/0.316228V)
Current Harmonics Standard
Select the standard to perform compliance testing on the current harmonics.• IEC 61000-3-2 Class A — for balanced three-phase equipment,
household appliances (except equipment identified as Class D), tools excluding portable tools, dimmers for incandescent lamps, and audio equipment.
• IEC 61000-3-2 Class B — for portable tools.• IEC 61000-3-2 Class C — for lighting equipment.• IEC 61000-3-2 Class D — for equipment having a specified power
according less than or equal to 600W, of the following types: personal computers and personal computer monitors, television receivers.
• RTCA DO-160E Single Phase Electrical Equipment — for airborne equipment.
• RTCA DO-160E Single Phase Electrical Equipment With Distorted Input Voltage Waveform — for airborne equipment.
• RTCA DO-160E Balanced 3-Phase Phase Electrical Equipment — for airborne equipment.

60 Power Measurement Application Online Help
4 About the Measurements
Current Harmonics
This measurement analyzes the current harmonics of the input line current. The measurement presents up to 40 harmonics.
Current Harmonics Plot
Select whether to display harmonics plot in bar graph format or FFT plot.
Window Select window to use for the FFT analysis.• Blackman-Harris — for minimal spectral leakage. This is typically
used for current harmonics measurements.• Hanning — for better frequency resolution and low spectral leakage.• Hamming — for better frequency resolution and moderate spectral
leakage.
Table 8 Analysis Settings (continued)
Parameter Description

About the Measurements 4
Power Measurement Application Online Help 61
CurrentHarmonics Test
Results
Table 9 Current Harmonics Test Result Waveforms
FFT Shows the frequency components in the input current. The FFT is calculated using the selected Window parameter and plotted according to the selected Current Harmonics Plot parameter. The unit for plot magnitude is selected with the Harmonics Unit parameter.You can drag over an area to zoom and enable a cursor as in the main waveform displays.

62 Power Measurement Application Online Help
4 About the Measurements
Power Quality
This measurement analyzes the power quality of the AC input line current.
Table 10 Current Harmonics Test Result Values
VRMS
IRMS
Real (Actual) Power
Apparent Power IRMS * VRMS
Reactive Power
Measured in VAR (Volts-Amps-Reactive)
Power Factor Real Power / Apparent Power
V Crest Factor Vpeak / VRMS
I Crest Factor Ipeak / IRMS
THD (Total Harmonic Distortion)
Where:• Xn = voltage or current of each harmonic• X1 = fundamental voltage or current value
Harmonic, Actual Value (RMS), Limit (RMS), Margin, Pass/Fail
For the first 40 harmonics, these values are displayed:• Actual Value (RMS) — the measured value in the units
specified by the Harmonics Unit parameter.• Limit (RMS) — the limit specified by the selected Current
Harmonics Standard parameter.• Margin — the margin specified by the selected Current
Harmonics Standard parameter.• Pass/Fail — whether the value passes or fails according to
the selected Current Harmonics Standard. Rows in the table are color-coded according to pass/fail values.

About the Measurements 4
Power Measurement Application Online Help 63
Some AC current may flow back into and back out of the load without delivering energy. This current, called reactive or harmonic current, gives rise to an "apparent" power which is larger than the actual power consumed. Power quality is gauged by the following:
• Apparent Power — The portion of power flow due to stored energy, which returns to the source in each cycle.
• Real (Actual) Power — The portion of power flow that, averaged over a complete cycle of the AC waveform, results in net transfer of energy in one direction.
• Power Factor — Ratio of the actual power to the apparent power.
• Crest Factor — Crest factor is the ratio between the instantaneous peak current/voltage required by the load and the RMS current/voltage (RMS stands for Root Mean Square, which is a type of average).
The measurement gives the power factor, apparent power, true power, and crest current/voltages of the AC line.
Power QualityTest Results

64 Power Measurement Application Online Help
4 About the Measurements
Power quality measurements are calculated using the captured voltage and current waveforms over the number of cycles specified.
Table 11 Power Quality Test Result Values
VRMS
IRMS
Real (Actual) Power
Apparent Power IRMS * VRMS
Reactive Power
Measured in VAR (Volts-Amps-Reactive)
Power Factor Real Power / Apparent Power
V Crest Factor Vpeak / VRMS
I Crest Factor Ipeak / IRMS

About the Measurements 4
Power Measurement Application Online Help 65
Inrush Current Analysis Tests
Perform inrush current measurement analysis.
• "Inrush Current" on page 66
Connection forInrush CurrentAnalysis Tests
1 Connect D+ of the voltage probe to the live wire of the AC input. Connect D- of the voltage probe to the neutral wire of the AC input. Select the appropriate attenuation ratio of the probe.
2 Connect the current probe to the live wire of the AC input with the direction of the arrow pointing towards the current flow.
3 Connect the voltage probe to the oscilloscope channel defined by the user in the Test Configuration tab. Do the same for the current probe.
ConfigurationParameters forInrush CurrentAnalysis Tests
The inrush current analysis tests have the following configuration parameters in addition to the global test configuration parameters (see page 56).
Figure 3 Typical Configuration for Inrush Current Analysis Tests
Table 12 Time Scale Settings
Parameter Description
Duration Enter the duration of time to capture signal. This parameter will set the time scale of the oscilloscope.

66 Power Measurement Application Online Help
4 About the Measurements
Inrush Current
This measurement analyzes the inrush current of the power supply when the power supply is first turned on.
Inrush CurrentTest Results
Table 13 Vertical Scale Settings
Parameter Description
Expected Inrush Current
Enter the expected inrush current amplitude. This value will be used to adjust the vertical scale of the oscilloscope.
Table 14 Inrush Current Test Result Waveform
Instantaneous Power Pn = Vinn * Iinn, where n is each sample.
Accumulative Energy = ∑ (Vinn * Iinn) * sample size, where n is each sample.

About the Measurements 4
Power Measurement Application Online Help 67
Table 15 Inrush Current Test Result Values
Peak Current The Peak Current can be a positive or negative value, so the result is the larger of the measured maximum or minimum.
Total Energy The total energy for the acquired waveform in Joules.
Average Power The average power for the acquired waveform in Watts.

68 Power Measurement Application Online Help
4 About the Measurements
Modulation Analysis Tests
Perform data trending on the switching variation of the acquired waveform.
• "Frequency" on page 69
• "Period" on page 71
• "Duty Cycle" on page 72
• "Positive Pulse Width" on page 73
Connection forModulation
Analysis Tests
1 Connect D+ of the voltage probe to the source of the MOSFET. Connect D- of the voltage probe to the drain of the MOSFET. Select the appropriate attenuation ratio of the probe.
2 Connect the voltage probe to the oscilloscope channel defined by the user in the Test Configuration tab.
ConfigurationParameters for
ModulationAnalysis Tests
The modulation analysis tests have the following configuration parameters in addition to the global test configuration parameters (see page 56).
Figure 4 Continuous Mode Connection for Modulation Analysis Tests
Table 16 Time Scale Settings
Parameter Description
Duration Enter the duration of time to capture the signal. This parameter will set the time scale of the oscilloscope.

About the Measurements 4
Power Measurement Application Online Help 69
Frequency
Trends and plots the frequency variation of the acquired waveform.
Table 17 Analysis Settings
Parameter Description
Reference Level Enter the edge reference level. This reference level will be used as the cross-over level for frequency, duty cycle, period, and pulse width calculation.
Slope Specify the start of each cycle as the rising edge or the falling edge.When RISING is selected:
When FALLING is selected:

70 Power Measurement Application Online Help
4 About the Measurements
Frequency TestResults
Table 18 Frequency Test Result Waveform
Frequency Using the Reference Level parameter value to determine the signal cross-over point, this waveform shows the measured frequency for each cycle.fn = 1 / (tn+1 - tn)
Table 19 Frequency Test Result Values
Maximum Frequency The highest frequency measured.
Minimum Frequency The lowest frequency measured.
Mean Frequency The average of measured frequencies.
Modulation Frequency Shows the rate of change of the signal frequency across the waveform.

About the Measurements 4
Power Measurement Application Online Help 71
Period
Trends and plots the period variation of the acquired waveform.
Period TestResults
Table 20 Period Test Result Waveform
Period Using the Reference Level parameter value to determine the signal cross-over point, this waveform shows the measured period for each cycle.Tn = tn - tn-1
Table 21 Period Test Result Values
Maximum Period The longest period measured.
Minimum Period The shortest period measured.
Mean Period The average of measured periods.

72 Power Measurement Application Online Help
4 About the Measurements
Duty Cycle
Trends and plots the duty cycle variation of the acquired waveform.
Duty Cycle TestResults
Table 22 Duty Cycle Test Result Waveform
Duty Cycle Using the Reference Level parameter value to determine the signal cross-over point, this waveform shows the measured duty cycle for each cycle.DCn = 100 * [(tm - tn) / (tn+1 - tn)]
Table 23 Frequency Test Result Values
Maximum Duty Cycle The largest duty cycle measured.
Minimum Duty Cycle The smallest duty cycle measured.
Mean Duty Cycle The average of measured duty cycles.

About the Measurements 4
Power Measurement Application Online Help 73
Positive Pulse Width
Trends and plots the positive pulse width variation of the acquired waveform.
Positive PulseWidth Test
Results
Table 24 Positive Pulse Width Test Result Waveform
Positive Pulse Width Using the Reference Level parameter value to determine the signal cross-over point, this waveform shows the positive pulse width for each cycle.Pn = tm - tn

74 Power Measurement Application Online Help
4 About the Measurements
Table 25 Positive Pulse Width Test Result Values
Maximum Pulse Width The widest pulse width measured.
Minimum Pulse Width The most narrow pulse width measured.
Mean Pulse Width The average of measured pulse widths.

About the Measurements 4
Power Measurement Application Online Help 75
Power Device Analysis Tests
Perform measurement analysis on the power device signals.
• "Switching Loss" on page 76
• "Safe Operating Area" on page 79
• "dV/dT" on page 81
• "dI/dT" on page 83
• "Dynamic On Resistance, Rds" on page 85
Connection forPower DeviceAnalysis Tests
1 Connect D+ of the voltage probe to the source of the MOSFET. Connect D- of the voltage probe to the drain of the MOSFET. Select the appropriate attenuation ratio of the probe.
2 Connect the current probe to the drain of the MOSFET with the direction of the arrow pointing towards the current flow.
3 Connect the voltage probe to the oscilloscope channel defined by the user in the Test Configuration tab. Do the same for the current probe.
ConfigurationParameters forPower DeviceAnalysis Tests
The power device analysis tests have the following configuration parameters in addition to the global test configuration parameters (see page 56).
Figure 5 Typical Configuration for Power Device Analysis Tests

76 Power Measurement Application Online Help
4 About the Measurements
Switching Loss
This measurement analyzes the power dissipated in the switching cycles across the switching device. Typical power losses include:
• Switching losses that occur during switching of Vds and Id.
• Conduction losses that occur when the switching device (MOSFET) is ON.
Table 26 Voltage Settings
Parameter Description
Voltage Switching Level
Enter the switching level for the switching edges. The value is in percentage of the maximum switch voltage.You can adjust this value to ignore noise floors.This value specifies the threshold that is used to determine the switching edges.
Table 27 Current Settings
Parameter Description
Current Switching Level
Enter the switching level for the start of switching edges. The value is in percentage of the maximum switch current.You can adjust this value to ignore noise floors or null offset that is difficult to eliminate in current probes.This value specifies the threshold that is used to determine the switching edges.
Table 28 Time Scale Settings
Parameter Description
Number of Cycles Enter the number of cycles to capture in one acquisition.
Switching Frequency Enter the frequency of the switching device.
Table 29 Mask Settings
Parameter Description
Safe Operating Area Mask
The Select drop-down field lets you select the mask file that will be used for the Safe Operating Area measurement.The New button lets you edit a new mask.The Edit button lets you edit the selected mask. See "Building Safe Operating Area Masks" on page 53.

About the Measurements 4
Power Measurement Application Online Help 77
Figure 6 Loss Occurrence in the Power Device

78 Power Measurement Application Online Help
4 About the Measurements
Switching LossTest Results
Table 30 Switching Loss Test Result Waveforms
Instantaneous Power Pn = Vdsn * Idn, where n is each sample.
Accumulative Energy = ∑ (Vdsn * Idn) * sample size, where n is each sample.
Table 31 Switching Loss Test Result Values
Maximum Switching Power Loss
Maximum switching period power loss.
Minimum Switching Power Loss
Minimum switching period power loss.
Average Switching Power Loss
Average switching period power loss.

About the Measurements 4
Power Measurement Application Online Help 79
Safe Operating Area
This measurement performs a Safe Operating Area (SOA) test of the power device by plotting an I- V curve and comparing it against mask limits you define (according to the power device's specifications).
Maximum Switching Energy Loss
Maximum switching period energy loss.
Minimum Switching Energy Loss
Minimum switching period energy loss.
Average Switching Energy Loss
Average switching period energy loss.
Maximum Total Power Loss Maximum cycle power loss (switching loss + conduction loss).
Minimum Total Power Loss Minimum cycle power loss (switching loss + conduction loss).
Average Total Power Loss Average cycle power loss (switching loss + conduction loss).
Maximum Total Energy Loss Maximum cycle energy loss (switching loss + conduction loss).
Minimum Total Energy Loss Minimum cycle energy loss (switching loss + conduction loss).
Average Total Energy Loss Average cycle energy loss (switching loss + conduction loss).
Switching Pwr Loss, Edge #N Power loss for each switching period.
Switching Eng Loss, Edge #N Energy loss for each switching period.
Total Pwr Loss, Cycle #N Power loss for each cycle (switching loss + conduction loss).
Total Eng Loss, Cycle #N Energy loss for each cycle (switching loss + conduction loss).
Maximum Frequency Maximum switching frequency.
Minimum Frequency Minimum switching frequency.
Mean Frequency Average switching frequency.
Table 31 Switching Loss Test Result Values (continued)

80 Power Measurement Application Online Help
4 About the Measurements
Figure 7 Safe Operating Area (SOA)

About the Measurements 4
Power Measurement Application Online Help 81
Safe OperatingArea Test Results
Given the Safe Operating Area Mask you supply (see "Building Safe Operating Area Masks" on page 53), the violating points are displayed on the mask and in the current waveform in red, and the total number of violating points are listed.
dV/dT
This measurement measures the slew rate of Vds of the power device (MOSFET).

82 Power Measurement Application Online Help
4 About the Measurements
dV/dT TestResults
Table 32 dV/dT Test Result Waveforms
dV/dT [ y(n) - y(n-1) ] / [ x(n) - x(n-1) ]
Table 33 dV/dT Test Result Values
Maximum Rising Slew Rate The largest of the measured rising edge slew rates.
Minimum Rising Slew Rate The smallest of the measured rising edge slew rates.
Average Rising Slew Rate The average of the measured rising edge slew rates.
Maximum Falling Slew Rate The largest of the measured falling edge slew rates.
Minimum Falling Slew Rate The smallest of the measured falling edge slew rates.
Average Falling Slew Rate The average of the measured falling edge slew rates.

About the Measurements 4
Power Measurement Application Online Help 83
dI/dT
This measurement measures the slew rate of Id of the power device (MOSFET).
Vds_Rising Slew Rate, Edge #N
Slew rate calculation for a rising edge depends on the topology:• For boost/buck/flyback topologies, rising edge slew rate is
calculated from 20% to 80%.• For push-pull topologies, rising edge slew rate is calculated
from 20% to 40% and 60% to 80%.See "Slew Rate Calculation for Various Topologies" on page 83.
Vds_Falling Slew Rate, Edge #N
Slew rate calculation for a falling edge depends on the topology:• For boost/buck topologies with continuous mode, falling
edge slew rate is calculated from 20% to 80%.• For flyback topologies with continuous mode, falling edge
slew rate is calculated from 20% to 40%.• For boost/buck/flyback topologies with discontinuous mode,
falling edge slew rate is calculated from 20% to 40% and 60% to 80%.
• For push-pull topologies, falling edge slew rate is calculated from 20% to 40% and 60% to 80%.
See "Slew Rate Calculation for Various Topologies" on page 83.
Figure 8 Slew Rate Calculation for Various Topologies
Table 33 dV/dT Test Result Values (continued)

84 Power Measurement Application Online Help
4 About the Measurements
dI/dT TestResults
Table 34 dI/dT Test Result Waveforms
dI/dT [ y(n) - y(n-1) ] / [ x(n) - x(n-1) ]
Table 35 dI/dT Test Result Values
Maximum Rising Slew Rate The largest of the measured rising edge slew rates.
Minimum Rising Slew Rate The smallest of the measured rising edge slew rates.
Average Rising Slew Rate The average of the measured rising edge slew rates.
Maximum Falling Slew Rate The largest of the measured falling edge slew rates.
Minimum Falling Slew Rate The smallest of the measured falling edge slew rates.
Average Falling Slew Rate The average of the measured falling edge slew rates.

About the Measurements 4
Power Measurement Application Online Help 85
Dynamic On Resistance, Rds
The dynamic ON resistance (Rds) is the resistance of the power (switching) device (MOSFET) in its ON state. This resistance contributes to conduction losses due to the ON state forward voltage drop.
Dynamic OnResistance, Rds
Test Results
Id_Rising Slew Rate, Edge #N Peak dI/dT value for each rising edge.The measurement looks at groups of dI/dT peaks that are >30% of the maximum dV/dT and reports the maximum within each group.
Id_Falling Slew Rate, Edge #N Peak dI/dT value for each falling edge.The measurement looks at groups of dI/dT peaks that are <30% of the minimum dV/dT and reports the minimum within each group.
Table 35 dI/dT Test Result Values (continued)

86 Power Measurement Application Online Help
4 About the Measurements
Rds and Conduction Loss are measured between 25% and 75% of each ON pulse.
Table 36 Dynamic ON Resistance, Rds Test Result Waveforms
Rds Rds = Vds/Id
Conduction Loss Conduction Loss = Vds * Id
Figure 9 Rds and Conduction Loss Measurements
Table 37 Dynamic ON Resistance, Rds Test Result Values
Maximum Rds Maximum dynamic ON resistance.
Minimum Rds Minimum dynamic ON resistance.
Average Rds Average dynamic ON resistance.

About the Measurements 4
Power Measurement Application Online Help 87
Output Analysis Tests
Test the power output voltage ripple.
• "Output Voltage Ripple" on page 87
ConfigurationParameters for
Output AnalysisTests
The output analysis tests have the following configuration parameters in addition to the global test configuration parameters (see page 56).
Output Voltage Ripple
This measurement analyzes the output voltage ripple and presents the peak- to- peak value as well as the frequency response of the captured signal.
Connection forthe Output
Voltage RippleTest
1 Connect the voltage probe (passive or differential) to the DC output of the power supply.
2 Connect the voltage probe to the oscilloscope channel defined by the user in the Test Configuration tab.
Table 38 Output Voltage Settings
Parameter Description
Output Voltage Channel
Select the channel number for the output voltage.
Passive Probe Attenuation Factor
Select the attenuation factor used for the passive probe.
Table 39 Time Scale Settings
Parameter Description
Duration Enter the duration of time to capture signal. This parameter will set the time scale of the oscilloscope.
Table 40 Analysis Settings
Parameter Description
Low Pass Filter Enter the cut off frequency for the low pass filter.
High Pass Filter Enter the cut off frequency for the high pass filter.

88 Power Measurement Application Online Help
4 About the Measurements
Figure 10 Typical Configuration for Output Voltage Ripple Test

About the Measurements 4
Power Measurement Application Online Help 89
Output VoltageRipple Test
Results
Table 41 Output Voltage Ripple Test Result Waveforms
VOut Filtered Shows the output voltage with the applied filters specified by the Low Pass Filter and High Pass Filter test configuration parameters.If the High Pass Filter cut off frequency is less than the Low Pass Filter cut off frequency, the High Pass Filter is applied first.Fourth-order Butterworth filters are used.
FFT (VRMS) Shows the frequency components in the output voltage ripple. The FFT is calculated using the Blackman-Harris Window (because of its minimal spectral leakage) and plotted as a FFT plot using VRMS units for magnitude.You can drag over an area to zoom and enable a cursor as in the main waveform displays.

90 Power Measurement Application Online Help
4 About the Measurements
Table 42 Output Voltage Ripple Test Result Values
Peak-to-peak Ripple VMax - VMin
VMax The maximum measured output voltage.
VMin The minimum measured output voltage.
Frequency

About the Measurements 4
Power Measurement Application Online Help 91
Turn On/Off Analysis Tests
Test the power output turn on time.
• "Turn On Time" on page 92
• "Turn Off Time" on page 93
Connection forthe Turn On/Off
Analysis Tests
1 Connect D+ of the voltage probe to the live wire of the AC input. Connect D- of the voltage probe to the neutral wire of the AC input. Select the appropriate attenuation ratio of the probe.
2 Connect the voltage probe (passive or differential) to the DC output of the power supply.
3 Connect the voltage probe to the oscilloscope channel you have selected in the Test Configuration tab. Do the same for the voltage probe connected to the DC output.
ConfigurationParameters for
Turn On/OffAnalysis Tests
The turn on/off analysis tests have the following configuration parameters in addition to the global test configuration parameters (see page 56).
Figure 11 Typical Configuration for Turn On/Off Analysis Tests
Table 43 Output Voltage Settings
Parameter Description
Output Voltage Channel
Select the channel number for the output voltage.
Passive Probe Attenuation Factor
Select the attenuation factor used for the passive probe.

92 Power Measurement Application Online Help
4 About the Measurements
Turn On Time
This measures the time taken to get the output voltage of the power supply after the input voltage is applied.
Table 44 Time Scale Settings
Parameter Description
Duration Enter the duration of time to capture signal. This parameter will set the time scale of the oscilloscope.
Table 45 Vertical Scale Settings
Parameter Description
Maximum source voltage
Enter the maximum (peak-to-peak) source voltage amplitude. The source voltage will be used to trigger the oscilloscope in "Turn On Time" test.
Steady state DC output voltage
Enter the expected output voltage amplitude. This value will be used to adjust the vertical scale of the oscilloscope.

About the Measurements 4
Power Measurement Application Online Help 93
Turn On Time TestResults
Turn Off Time
This measures the time taken for the output voltage of the power supply to turn off after the input voltage is removed.
Table 46 Turn On Time Test Result Values
Turn On Time t2 -t1Where:• t1 = AC input voltage rises to 10% of its maximum amplitude
(Start Time).• t2 = DC output voltage rises to 90% of its maximum
amplitude (End Time).

94 Power Measurement Application Online Help
4 About the Measurements
Turn Off Time TestResults
Table 47 Turn Off Time Test Result Values
Turn Off Time t2 -t1Where:• t1 = AC input voltage goes below 20% of its positive peak (or
negative peak which ever occurs first) (Start Time).• t2 = DC output voltage drops to 20% of its steady state value
(End Time).

About the Measurements 4
Power Measurement Application Online Help 95
Transient Analysis Tests
Test the load transient response of the power supply's DC output.
• "Load Transient Response" on page 96
Connection forTransient
Analysis Tests
1 Connect the voltage probe (passive or differential) to the DC output of the power supply.
2 Connect the voltage probe to the oscilloscope channel defined by the user in the Test Configuration tab.
3 Connect the current probe to the output load of the power supply. The change in the load current will be used to trigger the oscilloscope to capture the transients.
4 Connect the current probe to the oscilloscope channel defined by the user in the Test Configuration tab.
ConfigurationParameters for
TransientAnalysis Tests
The transient analysis tests have the following configuration parameters in addition to the global test configuration parameters (see page 56).
Figure 12 Typical Configuration for Input Line Analysis Tests
Table 48 Output Voltage Settings
Parameter Description
Output Voltage Channel
Select the channel number for the output voltage.
Passive Probe Attenuation Factor
Select the attenuation factor used for the passive probe.

96 Power Measurement Application Online Help
4 About the Measurements
Load Transient Response
This measurement measures the load transient response of the DC output, namely the time taken for the DC output to stabilize during a load change.
Table 49 Trigger Settings
Parameter Description
Initial Load Current This parameter is used to measure the transient load response of the DC output. The load current will be used as a reference and to trigger the oscilloscope. Enter the initial load current value.
New Load Current This parameter is used to measure the transient load response of the DC output. The load current will be used as a reference and to trigger the oscilloscope. Enter the new load current value.
Load Change For programmable loads, please select "Do not prompt to change load". The software will assume the load is increasing/decreasing constantly. The oscilloscope will trigger in the load change automatically, and you will not be prompted to increase/decrease the load between the test.If the load change is done manually please select "Prompt to change load". You will be prompted to increase/decrease the load to trigger the oscilloscope.
Table 50 Time Scale Settings
Parameter Description
Duration of Load Change
This parameter is used to measure the transient load response of the DC output. Enter the duration for current change. This parameter will set the time scale of the oscilloscope.
Table 51 Vertical Scale Settings
Parameter Description
% Overshoot Enter the % of overshoot of the output voltage. This value will be used to adjust the vertical scale of the oscilloscope.
Steady State DC Output Voltage
Enter the expected output voltage amplitude. This value will be used to adjust the vertical scale of the oscilloscope.

About the Measurements 4
Power Measurement Application Online Help 97
Load TransientResponse Test
Results
If the load current increases and decreases in one acquisition, you should see both a negative and positive peak. The transient response is measured from the time VOut overshoots above 20% of its positive/negative peak to the time VOut settles within 20% of its positive/negative peak. There are start and end time stamps that mark the measured area.
Table 52 Load Transient Response Test Result Values
Overshoot Recovery Time Positive transient time.
Overshoot Voltage Positive transient peak voltage.
Undershoot Recovery Time Negative transient time.
Undershoot Voltage Negative transient peak voltage.
Frequency of Load Change When there is a programmable load, this shows how often there is a load change.

98 Power Measurement Application Online Help
4 About the Measurements
A 99
Power Measurement Application Online Help
5Reference
Menus 100
Dialogs 104
This chapter describes the menus and dialogs in the Power Measurement Application.

100 Power Measurement Application Online Help
5 Reference
Menus
• "File Menu" on page 100
• "View Menu" on page 101
• "Help Menu" on page 102
File Menu
Connect To Oscilloscope
Lets you identify the oscilloscope used to perform the power measurements.
New Project
Creates a new project.
Open Project
Opens a previously saved project.
Save Project
Saves the current project to a file.
Save Project As
Saves the project to a new file.
Export Report
Saves the test report to a single file.
Export Waveform

Reference 5
Power Measurement Application Online Help 101
Saves waveforms for later offline analysis.
Export Results
Saves measurement results to a .csv (comma- separated value) file.
Page Setup
Sets up the page for printing.
Prints the application's test report.
Print Preview
Previews the application's test report print out.
Exit
Exits the Power Measurement Application.
See Also • "Saving and Opening Projects" on page 48
• "Performing Tests Offline with Saved Waveforms" on page 50
View Menu
Undo Zoom
Undoes the most recent zoom in the waveform graphs.
Redo Zoom
Repeats the most recent undone zoom in the waveform graphs.
AutoScale
Returns the waveform graphs to the original view (that is, with no zoom).

102 Power Measurement Application Online Help
5 Reference
One Graph
Displays one waveform graph.
Two Graphs
Displays two waveform graphs, splitting the waveform display horizontally.
Four Quadrant Graphs
Displays four waveform graphs, splitting the waveform display in quadrants.
Four Grid Graphs
Displays four waveform graphs, splitting the waveform display horizontally.
Show Connection Diagram
Specifies whether the connection diagram dialog is displayed when running a test that requires a different connection than the previous test.
See Also • "Step 9: View the test results" on page 35
Help Menu
Contents
Opens the online help with the Contents tab selected for browsing topics by their hirearchy.
View Help in PDF
Opens the PDF version of this online help for printing.
Licensing...
Opens the Licensing dialog that describes the types of licenses available, how to get them, and how to install them.
About...

Reference 5
Power Measurement Application Online Help 103
Opens the About the Power Measurement Application dialog that displays version information.
See Also • "Licensing the Power Measurement Application" on page 16

104 Power Measurement Application Online Help
5 Reference
Dialogs
• "Safe Operating Area Mask Editor Dialog" on page 104
Safe Operating Area Mask Editor Dialog
The Safe Operating Area Mask Editor dialog lets you edit the mask used with the SOA measurement.
See Also • "Building Safe Operating Area Masks" on page 53

A 105
Power Measurement Application Online Help
Glossary
A
apparent power The portion of AC line power flow due to stored energy, which returns to the source in each cycle.
C
crest factor Crest factor is the ratio between the instantaneous peak AC line current/voltage required by the load and the RMS current/voltage.
D
DUT Device Under Test.
I
ID Drain current.
P
power factor Ratio of the actual AC line power to the apparent power.
PWM Pulse Width Modulation.
R
RDSON Resistance when transistor is on.
real (actual) power The portion of power flow that, averaged over a complete cycle of the AC waveform, results in net transfer of energy in one direction.
RMS Root Mean Square, a type of average.
S
SOA Safe Operating Area.

106 Power Measurement Application Online Help
6 Glossary
V
VDS Drain- to- source voltage.

Power Measurement Application Online Help 107
Index
Symbols
% overshoot parameter, 96
Numerics
10070A/B/C passive probe, 1310073A/B/C passive probe, 1310074A/B/C passive probe, 1310076A passive probe, 131141A differential probe, 131147A current probe, 141153A differential probe, 131160A passive probe, 131161A passive probe, 131162A passive probe, 131165A passive probe, 136000 Series oscilloscopes, 127000 Series oscilloscopes, 128000 Series oscilloscopes, 12
A
accumulative energy waveform, 66, 78Agilent Connection Expert, 20Agilent IO Libraries Suite, 15airborne equipment, 59apparent power, 3, 62, 63, 64, 105at a glance, 3attributes, test result, 35autoscale, 44, 101average falling slew rate, 82, 84average Rds (dynamic ON resistance), 86average rising slew rate, 82, 84average switching energy loss, 79average switching power loss, 78average total energy loss, 79average total power loss, 79
B
bandwidth (oscilloscope) requirements, 11Blackman-Harris window, 60block diagram, switch-mode power supply, 3building SOA masks, 53
C
calculated results, 35channel deskew, performing, 27conduction loss, 76, 85conduction loss waveform, 86
configuration (test) parameters, 33connect to oscilloscope, 25, 100connection diagram, showing, 102connection to device under test, 32crest factor, 3, 63, 105current channel parameter, 57current harmonics, 60current harmonics plot parameter, 60current harmonics standard parameter, 59current harmonics test results, 61current probe, 14current probe attenuation factor parameter, 57current settings, global, 57current switching level parameter, 76current violation, 81cursors, 46
D
dBm harmonics unit, 59dBuA harmonics unit, 59deskew (channel), performing, 27deskew fixture (U1880A), 14, 27device under test (DUT) description, 57device under test (DUT) details, 57device under test (DUT) name, 57device under test, connection to, 32dI/dT, 3, 83dI/dT test results, 84dI/dT waveform, 84dialogs, 104differential probe, high-voltage, 13dunamic ON resistance (Rds) test results, 85duration of load change parameter, 96duration parameter, 65, 68, 87, 92DUT (device under test), 105DUT (device under test) description, 57DUT (device under test) details, 57DUT (device under test) name, 57duty cycle, 72duty cycle test results, 72duty cycle waveform, 72dV/dT, 3, 81dV/dT test results, 82dV/dT waveform, 82dynamic ON resistance (Rds), 85
E
editor, SOA mask, 53entitlement certificate, 16expected inrush current parameter, 66exporting the test report, 36
exporting waveforms, 50
F
FFT waveform (plot), 61FFT(VRMS) waveform, 89File menu, 100force deskew parameter, 56four grid graphs, 40, 102four quadrant graphs, 40, 102frequency, 69frequency of load change, 97frequency test results, 70frequency waveform, 70Frequency, output voltage ripple, 90fully automated oscilloscope set up, 56
G
gated measurements, 45getting started, 19global test configuration parameters, 56glossary, 105grid graphs, 40, 102
H
Hamming window, 60Hanning window, 60harmonic, 62harmonics unit parameter, 59Help menu, 102high pass filter parameter, 87high-voltage differential probe, 13
I
I crest factor, 62, 64Id falling slew rate, 85Id rising slew rate, 85IEC 61000-3-2, 59IEC 61000-3-2 standard, 3initial load current parameter, 96input line analysis, 31, 58input line analysis tests, connection, 58input line analysis, test configuration
parameters, 58inrush current, 66inrush current analysis, 31, 65inrush current analysis tests, connection, 65inrush current analysis, test configuration
parameters, 65

108 Power Measurement Application Online Help
Index
inrush current test results, 66installation, software, 16instantaneous power waveform, 66, 78Instrument connection dialog, 25IO libraries, 15IRMS, 62, 64
L
LAN interface, 21license file location, 17license host ID, 17licensing, 16, 102line frequency parameter, 59load change parameter, 96load transient response, 96load transient response test results, 97low pass filter parameter, 87
M
manual oscilloscope set up, 56markers, 36masks (SOA), building, 53maximum duty cycle, 72maximum falling slew rate, 82, 84maximum frequency, 70, 79maximum period, 71maximum pulse width, 74maximum Rds (dynamic ON resistance), 86maximum rising slew rate, 82, 84maximum source voltage parameter, 92maximum switching energy loss, 79maximum switching power loss, 78maximum total energy loss, 79maximum total power loss, 79mean duty cycle, 72mean frequency, 70, 79mean period, 71mean pulse width, 74memory (oscilloscope) requirements, 11menus, 100minimum duty cycle, 72minimum falling slew rate, 82, 84minimum frequency, 70, 79minimum period, 71minimum pulse width, 74minimum Rds (dynamic ON resistance), 86minimum rising slew rate, 82, 84minimum switching energy loss, 79minimum switching power loss, 78minimum total energy loss, 79minimum total power loss, 79mode, online vs. offline, 56modulation analysis, 4, 31, 68modulation analysis tests, connection, 68modulation analysis, test configuration
parameters, 68modulation frequency, 70multiple waveform graphs, 40
N
N2772A high-voltage differential probe, 13N2774A current probe, 14N2780A current probe, 14N2781A current probe, 14N2782A current probe, 14N2783A current probe, 14N2862A passive probe, 13N2863A passive probe, 13new load current parameter, 96node-locked licenses, 16noise floor, 76notices, 2null offset, 76number of cycles parameter, 58, 76
O
offline analysis on saved waveforms, 50offline mode, 51, 56one graph, 102online mode, 56opening projects, 48oscilloscope bandwidth requirements, 11oscilloscope memory requirements, 11oscilloscope probe requirements, 13oscilloscope requirements, 11oscilloscope set up parameter, 29, 56oscilloscope software version requirements, 12oscilloscope, connect to, 25oscilloscope-locked license, 16output analysis, 31, 87output analysis, test configuration
parameters, 87output noise, 3output voltage channel parameter, 87, 91, 95output voltage ripple, 87output voltage ripple test results, 89output voltage ripple test, connection, 87overshoot recovery time, 97overshoot voltage, 97overview, 3
P
parameters, test configuration, 33passive probe, 14passive probe attenuation factor, 95passive probe attenuation parameter, 87, 91PC-locked license, 16, 50peak current, 67peak-to-peak ripple, 90percent overshoot parameter, 96period, 71period test results, 71period waveform, 71positive pulse width, 73positive pulse width test results, 73positive pulse width waveform, 73power device analysis, 31, 75
power device analysis, connection, 75power device analysis, test configuration
parameters, 75power device specifications, 79power factor, 3, 62, 63, 64, 105power loss, 3power measurements, more about, 55power quality, 3, 62power quality test results, 63pre-compliance testing, 3prerequisites, 9printing the test report, 36probe (oscilloscope) requirements, 13probe (oscilloscope), current, 14probe (oscilloscope), high-voltage
differential, 13probe (oscilloscope), passive, 14project, new, 100project, open, 100project, save, 100projects, saving and opening, 48PWM (pulse width modulation), 105
Q
quadrant graphs, 40, 102
R
Rds (dynamic ON resistance), 85Rds (dynamic ON resistance) waveform, 86reactive power, 62, 64real (actual) power, 62, 63, 64, 105redo zoom, 41, 101reference, 99reference level parameter, 69report (test), viewing, 36report, exporting, 100requirements, current probe, 14requirements, deskew fixture, 14requirements, high-voltage differential
probe, 13requirements, oscilloscope, 11requirements, oscilloscope bandwidth, 11requirements, oscilloscope memory, 11requirements, oscilloscope probe, 13requirements, oscilloscope software version, 12requirements, passive probe, 14results (test), viewing, 35results, calculated, 35results, exporting, 101ripple measurements, 3RMS (root mean square), 105RMS harmonics unit, 59RTCA DO-160E standard, 3, 59running tests, 34
S
safe operating area (SOA), 3, 79Safe Operating Area Mask Editor dialog, 104

Index
Power Measurement Application Online Help 109
safe operating area mask parameter, 76safe operating area test results, 81safety, 10Sapphire SI-9110 high-voltage differential
probe, 13saving projects, 48scale values, entering, 43scaling waveforms, 43scope settings parameters, 56selecting tests, 31show connection diagram, 102slew rate of Id in power device, 83slew rate of Vds in power device, 81slope parameter, 69SOA (safe operating area), 105SOA mask editor, 53software (oscilloscope) version
requirements, 12software version (oscilloscope)
requirements, 12specifications, power device, 79starting Power Measurement Application, 24steady state DC output voltage parameter, 92,
96switching energy loss, 79switching frequency parameter, 76switching loss, 3, 76switching loss test results, 78switching power loss, 79switch-mode power supply block diagram, 3
T
Tektronix P5205 high-voltage differential probe, 13
test configuration, 33test configuration parameters, global, 56test report, viewing, 36test results, viewing, 35test selection, 31tests, running, 34THD (total harmonic distortion), 62time scale, 43time stamps, 36total energy, 67total energy loss, 79total harmonic distortion, 3total power loss, 79total violations, 81trademarks, 2transient analysis, 31, 95transient analysis tests, connection, 95transient analysis, test configuration
parameters, 95true power, 3turn off time, 93, 94turn off time test results, 94turn on time, 92, 93turn on time test results, 93turn on/off analysis, 31, 91turn on/off analysis tests, connection, 91
turn on/off analysis, test configuration parameters, 91
two graphs, 40, 102
U
U1880A deskew fixture, 14, 27undershoot recovery time, 97undershoot voltage, 97undo zoom, 41, 101update tests, 45
V
V crest factor, 62, 64Vds falling slew rate, 83Vds rising slew rate, 83vertical scale, 43View menu, 101viewing test results, 35viewing waveforms, 35VMax output voltage, 90VMin output voltage, 90voltage (high) differential probe, 13voltage channel parameter, 57voltage probe attenuation factor parameter, 57voltage settings, global, 57voltage switching level parameter, 76voltage violation, 81VOut filtered waveform, 89VRMS, 62, 64
W
waveform cursors, 46waveform graphs, viewing multiple, 40waveform zoom, 41waveforms, exporting, 50, 100waveforms, scaling, 43waveforms, selecting in test configuration, 51waveforms, viewing, 35window parameter (FFT analysis), 60
Z
zoom, waveform, 41

110 Power Measurement Application Online Help
Index