power of equityvikalpafinvest.com/downloads/power of equity.pdf · power of equity mutual fund ......
TRANSCRIPT
Power of Equity
Mutual Fund Investments are subject to market risks , read all scheme related documents carefully.

Agenda
1. Beneficiaries of Your Spending
2. What drives Stock Market
3. Common method of Valuation
4. Power of Compounding

Which line appears longer
�What is so obvious need not be right answer
The above mentioned graph is for illustration only

Rising Inflation- Value of Rs 1 Lac over 5 Year Period ( 1997-2002 , 2002 -2007 , 2007-2012)
82,645 81,301
62,112
40000
60000
80000
100000
Value of 1 Lac Value Erosion
-17,355 -18,699
-37,888
-60000
-40000
-20000
0
20000
1997-2002 2002-2007 2007 - 2012
� Rising Inflation in recent times ( 2007 – 2012 )
Source : RBI Website
The above mentioned graph is for illustration only

Beneficiaries of Your Spending
Housing Finance Company
Paint IndustryPaint Industry
Tyre Industry
Battery Industry
For illustrative Purpose only. The views mentioned above are for information purpose only and should not be construed as an
offer or solicitation of an offer for purchase of any securities/ instruments or any of the Schemes of L&T Mutual Fund.
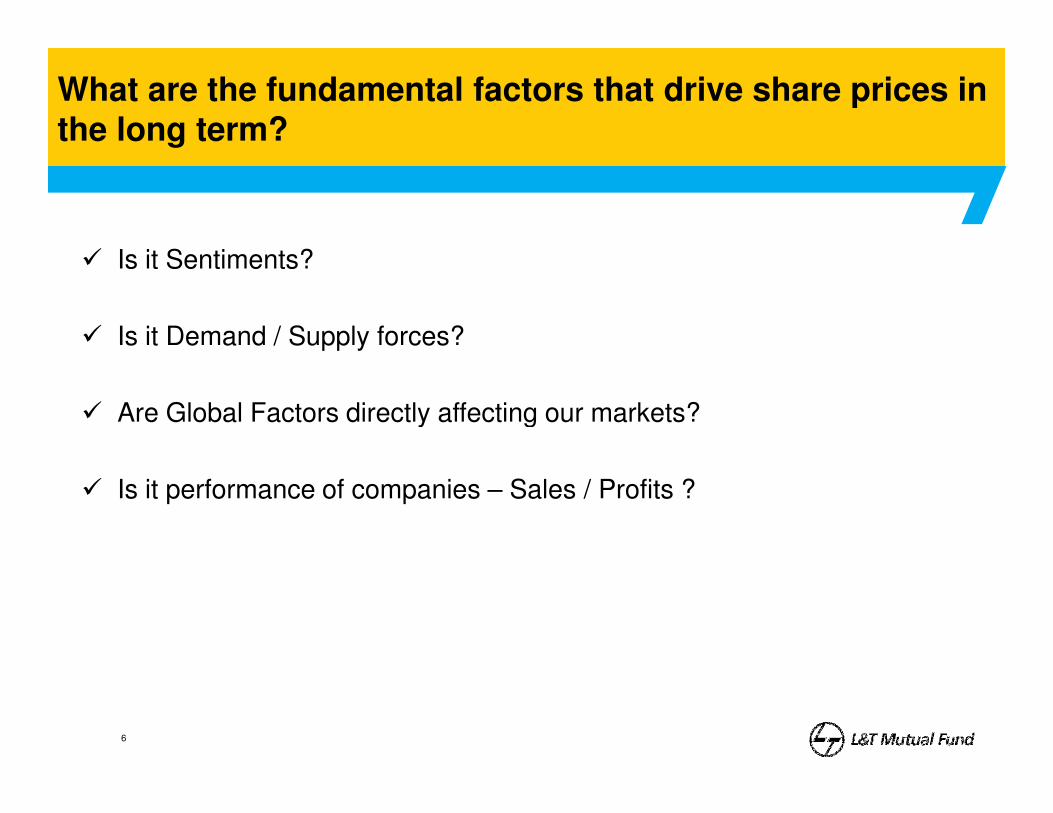
What are the fundamental factors that drive share prices in the long term?
� Is it Sentiments?
� Is it Demand / Supply forces?
� Are Global Factors directly affecting our markets?
6
� Are Global Factors directly affecting our markets?
� Is it performance of companies – Sales / Profits ?

Source : HDFC Annual Report 2012

Beneficiary of India domestic story by investing in Equity
Young Population Rising Income Higher
Spending
Fast Food Industry Automobile Industry
Watch Industry Telecom Industry
For illustrative Purpose only. The views mentioned above are for information purpose only and should
not be construed as an offer or solicitation of an offer for purchase of any securities/ instruments or any of the
Schemes of L&T Mutual Fund.
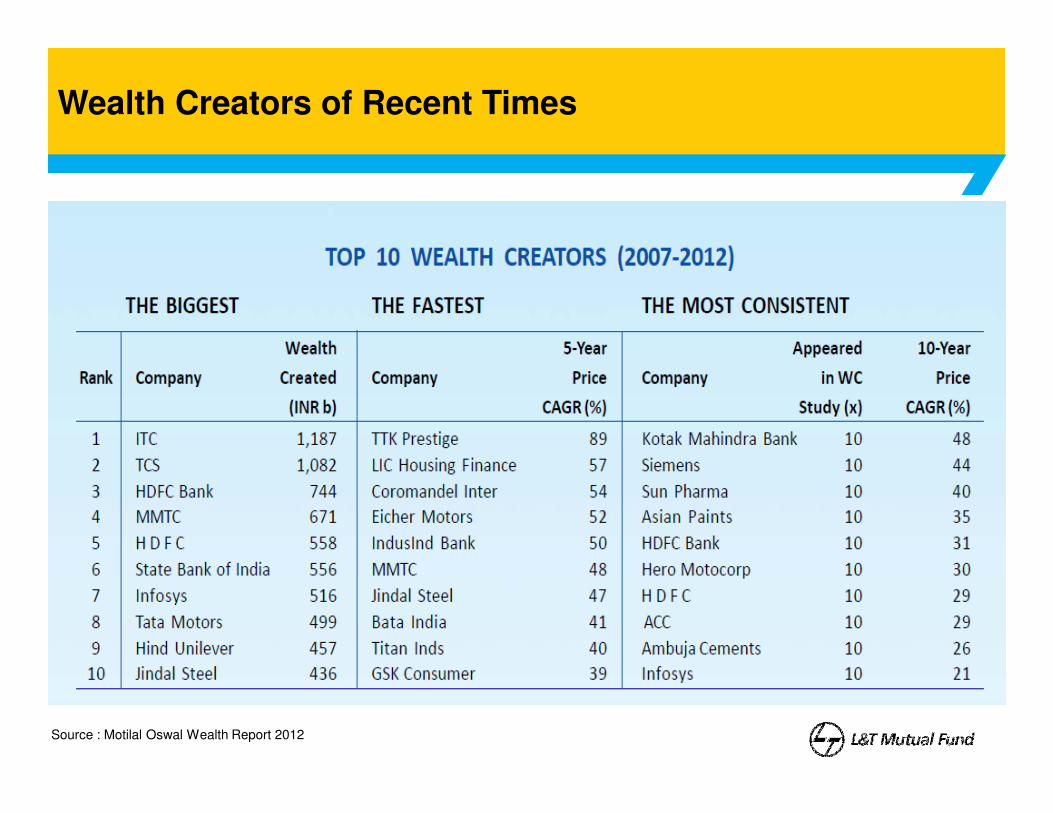
Wealth Creators of Recent Times
Source : Motilal Oswal Wealth Report 2012

15000
20000
25000
Sensex Return for 1991 - 2012 : 14.5 % (CAGR )
Global Financial Crisis
0
5000
10000
1
10
5
20
9
31
3
41
7
52
1
62
5
72
9
83
3
93
7
10
41
11
45
12
49
13
53
14
57
15
61
16
65
17
69
18
73
19
77
20
81
21
85
22
89
23
93
24
97
26
01
27
05
28
09
29
13
30
17
31
21
32
25
33
29
34
33
35
37
36
41
37
45
38
49
39
53
40
57
41
61
42
65
43
69
44
73
45
77
46
81
47
85
48
89
49
93
50
97
52
01
Balance of
Payment Crisis Dot com Bust
Source : BSE India

What has driven Indian Stock Market
11

Huge Gains had come from 9% of Trading Days.
Category No of Days Sum of Gains /
Loss
Percentage of
Gain Days
Percentage of
Gains
Percentage of
Total Traded
Days
Gains > 2% 411 1272% 16% 44% 9%Gains > 2% 411 1272% 16% 44% 9%
Gains >0% and < 2% 2124 1623% 84% 56% 44%
Loss < 2% 1895 -1465%
Loss More than 2% 380 -1196%
Source : BSE India

Common Method of Valuation
1. PE Ratio
2. P/ BV Ratio
13
3. DCF ( Discounted Cash Flow ).
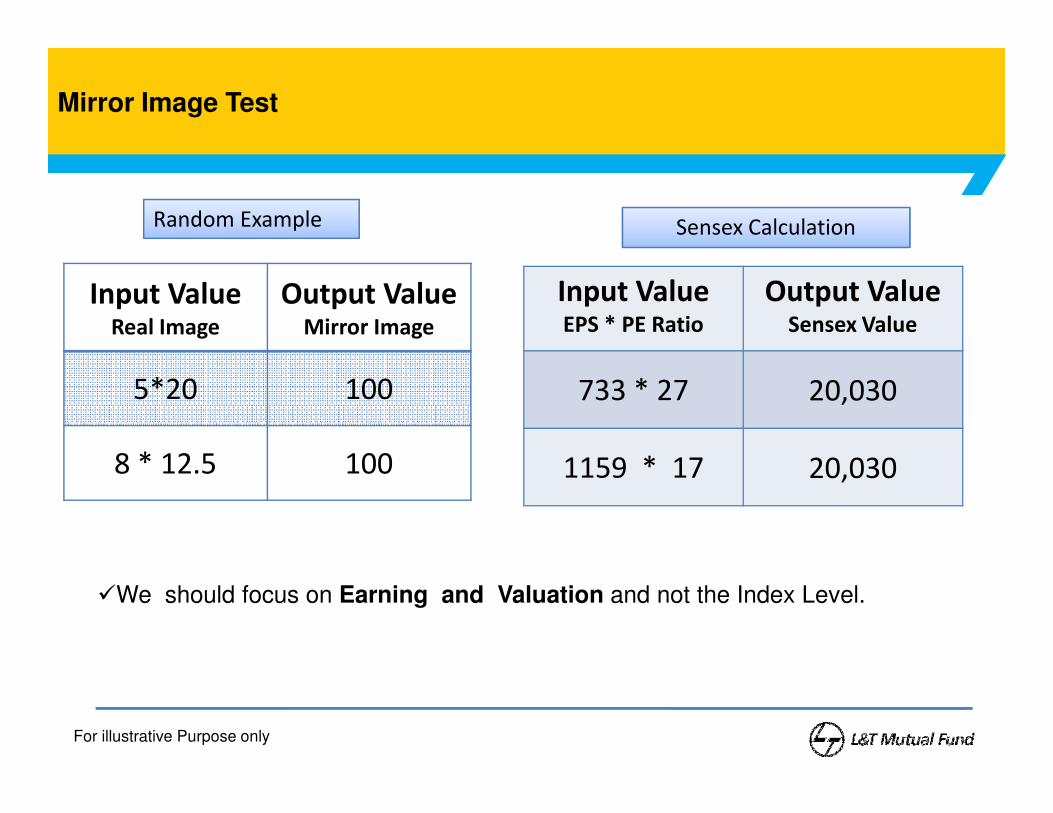
Mirror Image Test
Random Example Sensex Calculation
Input ValueReal Image
Output ValueMirror Image
5*20 100
Input ValueEPS * PE Ratio
Output ValueSensex Value
733 * 27 20,0305*20 100
8 * 12.5 100
733 * 27 20,030
1159 * 17 20,030
�We should focus on Earning and Valuation and not the Index Level.
For illustrative Purpose only
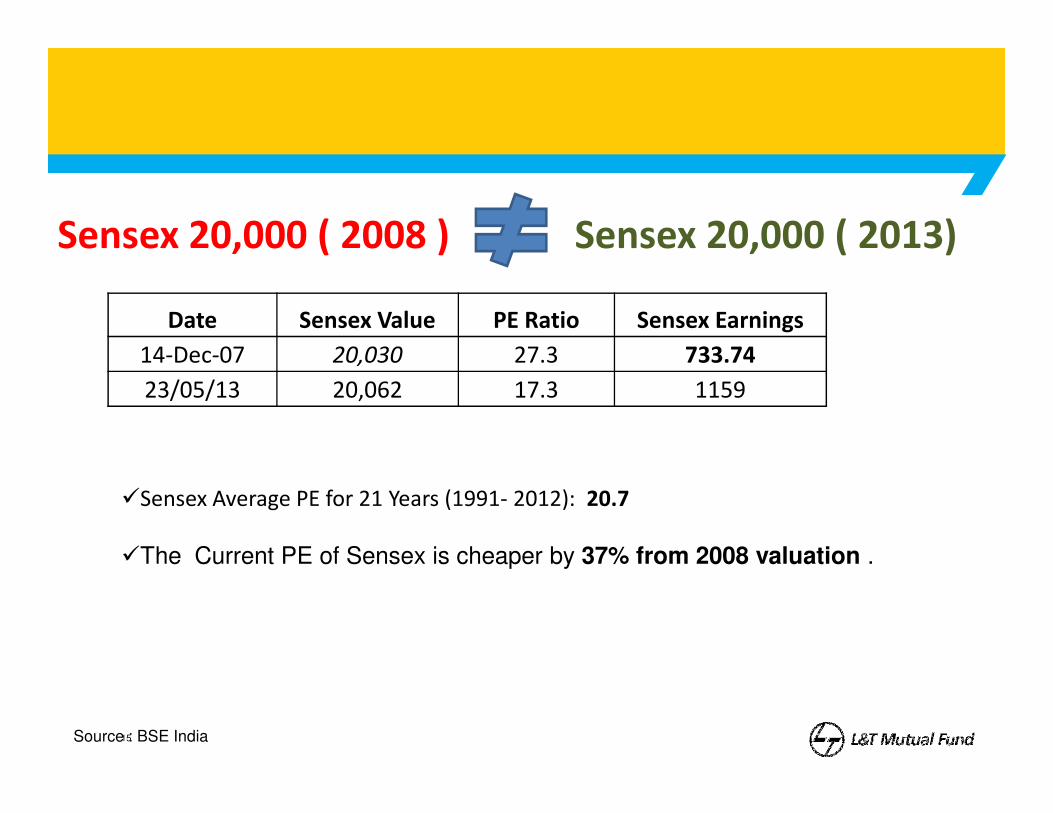
Sensex 20,000 ( 2008 ) Sensex 20,000 ( 2013)
Date Sensex Value PE Ratio Sensex Earnings
14-Dec-07 20,030 27.3 733.74
23/05/13 20,062 17.3 1159
15
�Sensex Average PE for 21 Years (1991- 2012): 20.7
�The Current PE of Sensex is cheaper by 37% from 2008 valuation .
Source : BSE India

6
7
8
9
10
Price/Bookvalue Average
0
1
2
3
4
5
Jan
-91
Au
g-9
1
Ma
r-9
2
Oct
-92
Ma
y-9
3
De
c-9
3
Jul-
94
Fe
b-9
5
Se
p-9
5
Ap
r-9
6
No
v-9
6
Jun
-97
Jan
-98
Au
g-9
8
Ma
r-9
9
Oct
-99
Ma
y-0
0
De
c-0
0
Jul-
01
Fe
b-0
2
Se
p-0
2
Ap
r-0
3
No
v-0
3
Jun
-04
Jan
-05
Au
g-0
5
Ma
r-0
6
Oct
-06
Ma
y-0
7
De
c-0
7
Jul-
08
Fe
b-0
9
Se
p-0
9
Ap
r-1
0
No
v-1
0
Jun
-11
Jan
-12
Au
g-1
2
Average PBV : 3.72
Source : BSE India

Is it Worth enough to take Risk to earn the Extra Return
1 lakh Lump sum Investment
Return / Years 5 10 15 20 25
8% 1.46 2.15 3.17 4.66 6.84
17
8% 1.46 2.15 3.17 4.66 6.84
12% 1.76 3.10 5.47 9.64 17
�1 Lac invested for 25 Years , First 8 % has generated 5.84 Lacs profit and Next 4% generated 10.16 Lac Profits .
�That’s the power of Compounding
For illustrative Purpose only
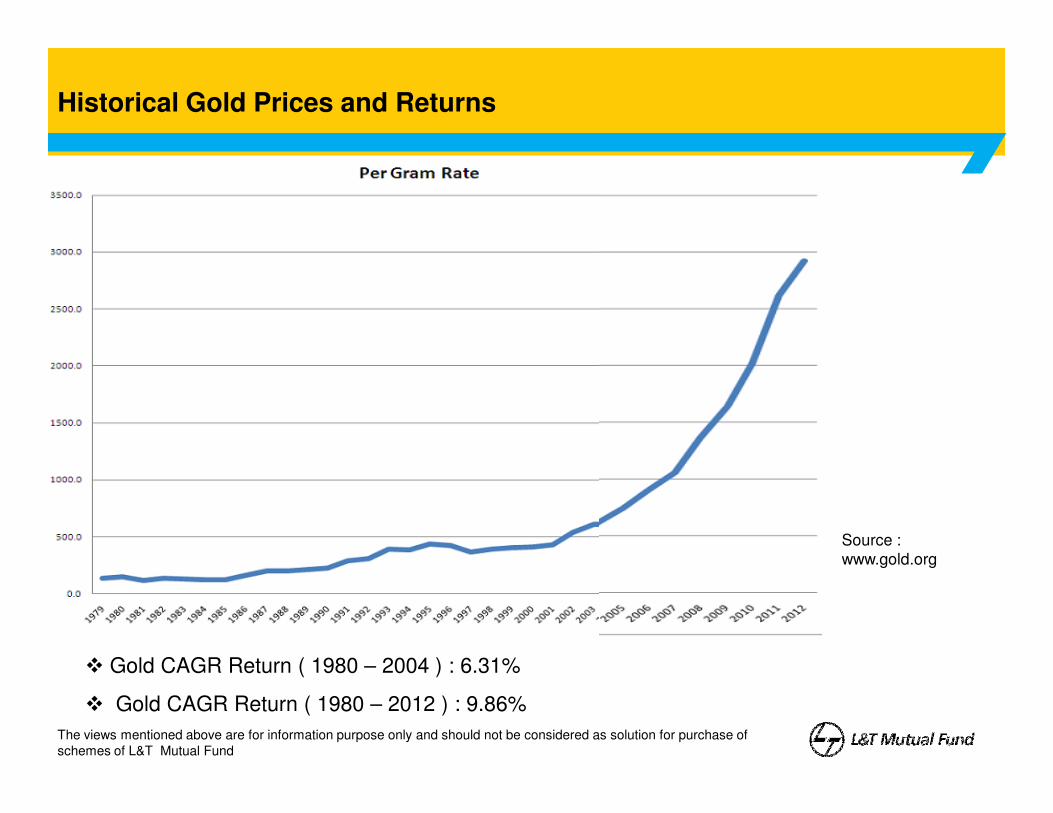
Historical Gold Prices and Returns
� Gold CAGR Return ( 1980 – 2004 ) : 6.31%
� Gold CAGR Return ( 1980 – 2012 ) : 9.86%
The views mentioned above are for information purpose only and should not be considered as solution for purchase of
schemes of L&T Mutual Fund
Source :
www.gold.org

Characteristics of Good Business
1. Excellent Management
2. Zero Debt
3. Highly Profitable
19
3. Highly Profitable
4. Product with Rising Demand
5. Great Balance Sheet
6. Tons of Cash
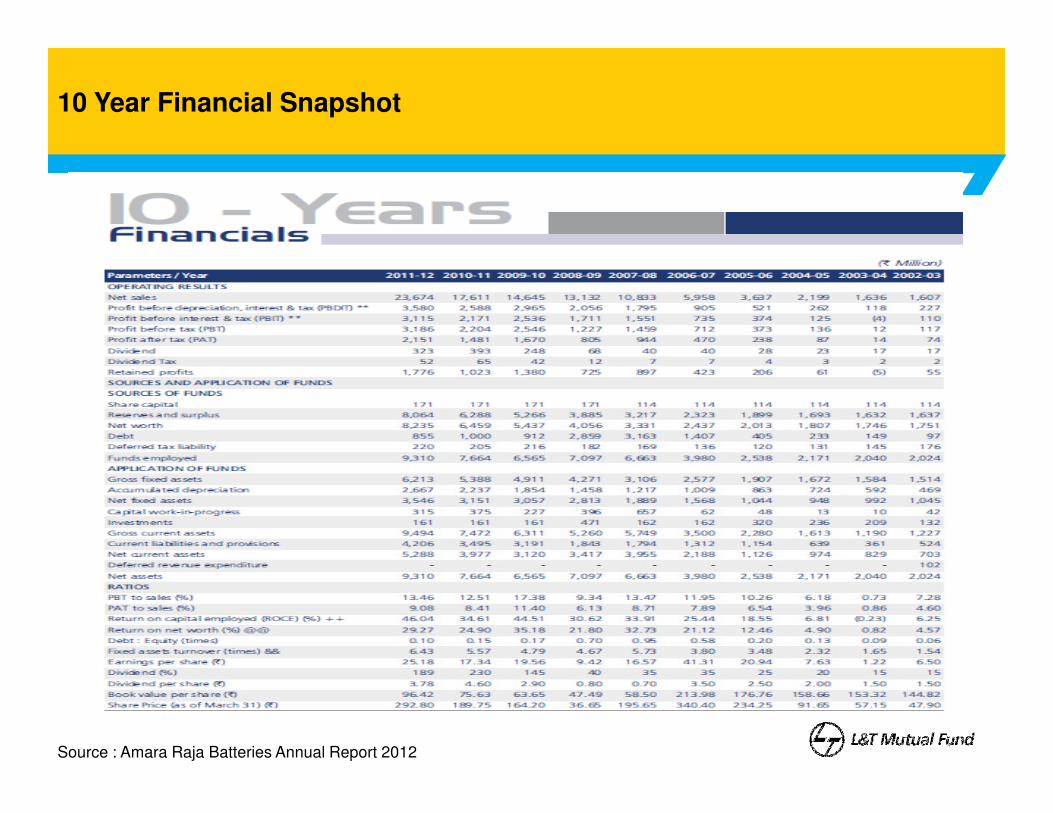
10 Year Financial Snapshot
Source : Amara Raja Batteries Annual Report 2012

Example Stock Price Movement
Source : Chartink.com - Stock performance of Amara Raja Batteries

Famous Stock Picker
• Warren Buffet and Charlie Munger
• Peter Lynch
22
• Seth Klarman
• John Templeton
Summary
� Need to Focus on Valuation and not market level.
� Equities may be the preferred asset class for long term investments
� India Growth story seems to continue for many more years.
23
� Mutual Funds could be one of the ways to participate in our country’s Growth

Mutual Fund investments are subject to market risks, read all scheme related documents carefully.This presentation is for general information only and does not have regard to specific investmentobjectives, financial situation and the particular needs of any specific person who may receive thisinformation. Investments in mutual funds and secondary markets inherently involve risks andrecipient should consult their legal, tax and financial advisors before investing. Recipient of thisdocument should understand that statements made herein regarding future prospects may not berealized. He/ She should also understand that any reference to the securities/ sectors / indices inthe document is only for illustration purpose. Neither this document nor the units of L&T Mutualthe document is only for illustration purpose. Neither this document nor the units of L&T MutualFund have been registered in any jurisdiction. The distribution of this presentation in certainjurisdictions may be restricted or totally prohibited and accordingly, persons who come intopossession of this document are required to inform themselves about, and to observe, any suchrestrictions.
Compliance number assigned is CL00263

Thank You