power plant options report for thompson island
TRANSCRIPT

Power Plant Options Report for Thompson Island
A report prepared by the
Renewable Energy Research Laboratory Center for Energy Efficiency and Renewable Energy Department of Mechanical and Industrial Engineering
University of Massachusetts at Amherst Amherst, MA 01003
Anthony L. Rogers, Ph.D. James F. Manwell, Ph.D.
Anthony F. Ellis, M.S. Utama Abdulwahid, M.Sc.
November 1999

NOTICE
This report was prepared as an account of work sponsored by an agency of the Commonwealth of Massachusetts. Neither the Commonwealth of Massachusetts nor any agency thereof, nor any of its employees, makes any warranty, express or implied, or assumes any legal liability or responsibility for the accuracy, completeness, or usefulness of any information, apparatus, product, or process disclosed, or represents that its use would not infringe privately owned rights. Reference herein to any specific commercial product, process, or service by trade name, trademark, manufacturer, or otherwise does not necessarily constitute or imply its endorsement, recommendation, or favoring by the Commonwealth of Massachusetts or any agency thereof. The opinions and recommendations of authors expressed herein do not necessarily state or reflect those of the Commonwealth of Massachusetts or any agency thereof. The authors would like to thank the Massachusetts Division of Energy Resources for their support of this research.

Table of Contents
1. Introduction.............................................................................................................. 1 2. Thompson Island..................................................................................................... 2
2.1. Description of Thompson Island ....................................................................... 2 2.2. Thompson Island electric load .......................................................................... 4 2.3. Thompson Island heating load.......................................................................... 5 2.4. Thompson Island wind resource....................................................................... 6 2.5. Thompson Island solar resource....................................................................... 7
3. Grid-connected and Autonomous Renewable Power Systems ................................ 9 3.1. Renewable Power Sources .............................................................................. 9 3.2. Grid-connected renewable plants ..................................................................... 9 3.3. Autonomous power plants .............................................................................. 10
4. Modeling Renewable Power Systems.................................................................... 11 4.1. Hybrid2 – A Renewable Power System Model................................................ 11 4.2. Economic Comparison of Power System Options........................................... 12 4.3. Modeling the Existing Grid Connected System............................................... 13 4.4. Modeling Systems for the Reduction of Purchased Energy ............................ 14 4.5. Modeling Large Systems with Significant Energy Sales.................................. 15 4.6. Modeling Autonomous Renewable Power Systems........................................ 15
5. Overview of Power Plant Options .......................................................................... 17 5.1. Summary of power plant options .................................................................... 17 5.2. Systems for Reduction of Purchased Energy ................................................. 17 5.3. Large Systems with Significant Energy Sales................................................. 17 5.4. Autonomous Renewable Power Systems....................................................... 18
6. Power Plant Options – Performance and Economics............................................. 19 6.1. Systems for Reduction of Purchased Energy ................................................. 19 6.2. Systems for Energy Sales .............................................................................. 20 6.3. Autonomous Systems..................................................................................... 21
7. Summary and Recommendations.......................................................................... 22 8. References............................................................................................................ 23

1
1. Introduction
Thompson Island Outward Bound asked the Massachusetts Division of Energy Resources (DOER) to evaluate renewable energy options for Thompson Island, in Boston harbor. DOER has subsequently authorized the Renewable Energy Research Laboratory (RERL) at the University of Massachusetts to investigate the possibility of adding wind and/or solar generators to the island. The island’s Outward Bound program is active and therefore has a significant electrical load. An underwater power cable that needs to be upgraded presently services that load. Thompson Island also has a significant renewable power resource that can be used to generate power. This includes wind and solar power.
RERL has evaluated the performance and cost evaluation of a number of possible power systems for the island that use the wind and solar resource. The systems include ones primarily intended to reduce the power purchased from the mainland, systems that are large enough to involve a significant sale of power, and autonomous power systems that could be used to power the island independent of the cable connection to the mainland. The University of Massachusetts has collected more than a year of data on the wind and solar resource on the island and on the island electrical load. A year of that data, from May 1998 through April 1999, has been used in the analysis.
This report provides an overview of the island energy use and the renewable resource. This is followed by a review of issues related to renewable power systems and modeling the performance and economics of such systems. Finally, there is a description of the power systems that have been considered, and a review of the performance and costs of those systems. This study is intended to be the precursor of a more detailed study of the costs and issues involved in installing the most cost effective of these systems on the island.
All of these systems are compared on the basis of net present value of the renewable power system. The analyses assume that the price for electricity reflects the costs for a new cable to the mainland. In this manner, the cost effectiveness of these systems is compared with that of replacing the power cable from the mainland.
Four renewable power systems that are designed for the reduction of purchased energy from the grid were investigated. They included systems with 50 kW and 100 kW of wind power and two systems also included up to 10 kW of photovoltaic (PV) panels. The systems with only wind power were barely cost effective. The inclusion of PV panels was not cost effective. A sensitivity analysis showed that the economics of these systems are very sensitive to the average wind power and loan interest rates.
Three systems for significant sales of power to green power marketers were considered. All of these systems were cost effective, resulting in significant positive net present values. The larger the wind system, the greater the net present value.
Four autonomous power systems were considered. The economics of these systems were considered both with the inclusion of the cost for the new cable and without that cost. If Thompson Island decides to forego the cable upgrade, the autonomous systems are very cost effective. If Thompson Island goes ahead with the cable upgrade, then the costs incurred make the autonomous systems uneconomic.

2
2. Thompson Island
2.1. Description of Thompson Island
Thompson Island is located in Boston’s harbor area, approximately two and a half miles south-southeast of Logan airport, and one mile due east of UMass Boston (see figure 1). The island is a little over one mile long and approximately 500-1500 feet wide (see map, Figure 2). The island is currently used by the Outward Bound Education Center. A building complex is concentrated on the hill on the northern third of the island, with the remainder being open land and salt marsh.
Outward Bound runs programs for school children during the week. Thus, between Monday and Friday, there are often quite a few people on the island. Usually only a small staff remains on the island at other times.
Figure 1. Map of Boston Harbor and Thompson Island
Electric power comes to the island from the mainland via an underwater cable. The electric system on the island is a three phase 208 V system with 120 V between the phases. There is emergency stand-by diesel generator on the island that is rated at 80 kW. The electric loads on the island consist mostly of lighting and refrigeration equipment.

3
N
Figure 2. Topographic Map of Thompson Island

4
Wind, solar and electric load data have been collected on the island as part of an ongoing project of the Massachusetts Division of Energy Resources and the University of Massachusetts. As part of this project, a meteorological tower is sited on the open grassland, approximately one third of a mile southwest of the buildings. Wind speed, wind direction, temperature, and solar insolation have been measured and logged there. Electric power to the island has also been monitored at the main building where the electric system is connected to the cable. A year of data beginning May 1, 1998 and ending April 30, 1999 is used as the basis for the analysis in this report.
2.2. Thompson Island Electric Load
The electric power consumption on the island varies significantly over the day, but also varies on a weekly and annual basis. Figure 3 shows the average hourly electric load on the island during the month of March 1999. During this month, the average load was 44.6 kW and the peak instantaneous power was 92.9 kW. The daily load swings can be seen in Figure 3, as well as the lower power consumption on the weekends, when the island has fewer occupants.
March 99 - Electric Load
0
10
20
30
40
50
60
70
80
3/1 3/3 3/5 3/7 3/9 3/11 3/13 3/15 3/17 3/19 3/21 3/23 3/25 3/27 3/29 3/31Date
kW
Figure 3. Hourly electric load, March 1999.
The hourly averaged diurnal electric load, based on 10 min averages, is presented in Figure 4. It can be seen that the average load peaks around 11 AM and remains high until about 9 PM.
Annually, the electric load on the island averages about 36.8 kW, with the maximum power consumption in any month averaging between 70 and 90 kW. Table 1 includes the monthly average power consumption, and the monthly maximum and minimum instantaneous power consumption for the months of May 1998 to April 1999. Variations in the mean load can be seen in the data. The average load and the maximum and minimum instantaneous loads all increase during the winter months when there are fewer hours of daylight and decrease in the summer when there is more sunlight and there are fewer people on the island. The minimum load is never below 12 kW.

5
March 99 - Diurnal Electric Load
0
10
20
30
40
50
60
0 1 2 3 4 5 6 7 8 9 10 11 12 13 14 15 16 17 18 19 20 21 22 23Hour of Day
kW
Figure 4. Hourly averaged diurnal electric load, March 1999.
5/98 6/98 7/98 8/98 9/98 10/98 11/98 12/98 1/99 2/99 3/99 4/99 Avg. Load kW 32.1 30.5 30.3 32.8 33.0 35.5 38.2 41.3 46.5 43.5 44.6 32.8 Max. Load kW 87.4 66.7 68.1 66.8 72.8 71.9 89.0 83.0 91.0 88.8 92.9 72.0 Min. Load kW 12.2 13.6 12.4 16.0 15.5 16.4 17.1 19.9 19.4 21.5 21.7 16.7
Table 1. Monthly Thompson Island Power Consumption, May 1998 to April 1999.
Outward Bound uses about 321 MWh of electricity per year. They pay an average of 6.07 c/kWh for energy in addition to a demand charge of $5.41/ peak monthly power usage (demand). The average cost of power, including the demand charge, is 7.68 c/kWh. For the G-2 rate that Outward Bound is paying, the demand charge is the greatest of:
1. The largest 15 minute peak power usage within a month, measured in kilowatts
2. A value equal to 90% of the largest 15 minute peak usage within a month, measured in kilovolt-amperes, if the kilowatt demand exceeds than 75 kilowatts.
The cable to the mainland has proven inadequate for the present power consumption on the island. An alternative is needed to ensure reliable power. Outward Bound is, at the moment, considering options for replacing the cable with one with significantly greater capacity or installing an autonomous power system.
2.3. Thompson Island Heating Load
Some of the power systems considered here include the possibility of using electricity for space heating. Presently the energy for heat is provided by fuel oil. Based on fuel oil deliveries, it is estimated that the island uses about 35,000 gallons of fuel oil per year. At 140,000 BTU/gallon and an assumed annual average heating system efficiency of 70%, this represents an annual energy need of approximately 1,005,000 kWh for heating. Thus, the energy needed for space heating on the island is about 313% of the annual electrical energy needs. This represents an annual average load of 115 kW, but the heating load occurs only during half of the year and the majority of the energy is needed during only a quarter of the year. Thus the system capacity is assumed to be at least four times the average load and therefore, 450 kW.

6
Fuel oil for the heating system comes in a barge. Fuel oil costs, including delivery to the island, are about $0.62 /gallon or, equivalently, 2.16 c/kWh for the delivered heating energy.
2.4. Thompson Island Wind Resource
The winds on Thompson Island vary significantly over periods of days, as well as over the year. For example, a graph of the wind speed 40 meters above the ground during March 1999 is shown in Figure 5. This was a particularly windy month. The variations of wind speed over periods of days can be seen as fronts move through the area.
March 99 - 40 m Wind Speed
0
5
10
15
20
25
30
35
40
45
3/1 3/3 3/5 3/7 3/9 3/11 3/13 3/15 3/17 3/19 3/21 3/23 3/25 3/27 3/29 3/31Date
Mph
Figure 5. Wind speeds during March 1999.
The average diurnal wind speed is illustrated in Figure 6. In spite of the very variable wind resource, on an average basis, the winds peak in the afternoon and are lowest in the early morning.
March 99 - 40 m Diurnal Wind Speed
0
5
10
15
20
25
0 1 2 3 4 5 6 7 8 9 10 11 12 13 14 15 16 17 18 19 20 21 22 23
Hour of Day
Mph
Figure 6. Average diurnal wind speeds, March 1999.
Over the year when the data was taken, the winds on Thompson Island average 12.4 mph with increased winds in the fall and winter and lower winds in the summer. The

7
average monthly wind speeds for the period of May 1998 to April 1999 are tabulated in Table 2.
Month 5/98 6/98 7/98 8/98 9/98 10/98 11/98 12/98 1/99 2/99 3/99 4/99 Wind mph 12.4 9.9 9.8 8.3 11.0 14.3 12.6 13.0 14.1 13.3 17.4 13.1 Solar W/m2 172.9 156.5 190.3 164.3 145.6 100.2 73.6 48.5 52.6 80.1 125.0 169.6
Table 2. Monthly Wind and Solar Resource, May 1998 to April 1999.
Winds also fluctuate over larger time scales of years. One year may be windier than another may be. Based on a preliminary survey of weather data at nearby sites, including Logan airport and offshore buoys, the long term mean wind is on the order of 8% greater than that for the period of measurement. Thus, for this study, the wind data has been scaled by a scale factor of 1.078 to account for the lower than average winds between May, 1998 and April 1999. This factor was derived from a comparison of Logan airport data from May 1998 until April 1999 with the previous nine years of Logan airport data. Using this factor, the long term annual average wind speed is estimated to be 13.4 mph at an elevation of 40 m above the ground.
2.5. Thompson Island Solar Resource
The solar resource is usually characterized by the solar radiation that lands on a horizontal surface. This radiation includes both direct beam radiation and diffuse radiation from sunlight scattered across the sky. The solar resource is a function of the height of the sun in the sky and the cloudiness of the sight. The solar resource on Thompson Island varies over the year, with the greatest resource in the summer, when the sun is higher in the sky and the days are longer.
Over the day, the solar resource depends on the elevation of the sun and on clouds that pass by. Figure 7 illustrates measured hourly averages of solar radiation on a horizontal surface for March 1999. In general, the solar resource is zero during the night and increases and decreases with the sun’s elevation. Superimposed on that pattern are periods of cloudiness. Thus the solar resource varies significantly over the day, and from day to day.
March 99 - Solar Insolation
0
100
200
300
400
500
600
700
3/1 3/3 3/5 3/7 3/9 3/11 3/13 3/15 3/17 3/19 3/21 3/23 3/25 3/27 3/29 3/31
Date
Wat
ts/m
*m
Figure 7. Measured solar radiation on a horizontal surface, March 1999.

8
The length of daylight hours varies significantly over the year, with a minimum on December 21 and a maximum on June 21. Accordingly, the solar resource is most plentiful in the summer months. This can be seen in the monthly average solar resource that is tabulated in Table 2. Over the year the average solar resource is about 123 W/m2.

9
3. Grid-connected and Autonomous Renewable Power Systems
This study evaluates the performance and economics of a variety of renewable power systems for Thompson Island. These systems are, in many ways, unlike conventional power systems. Most notably, the power production of a renewable power system fluctuates with changes in the resource. This determines numerous design aspects of these systems. The characteristics of renewable power systems and the implications for the operation of these systems are described below.
3.1. Renewable Power Sources
The power produced by renewable generators such as photovoltaic (PV) panels and wind turbines is variable. The instantaneous power from renewable generators depends on their maximum rated capacity and on the instantaneous resource. If there is enough power in the renewable resource, then the renewable generator produces the rated power. If there is a surplus of power in the renewable resource, then the renewable generator limits the power to the rated power. At lower levels of the renewable resource, the renewable generator will produce less than rated power.
Rated power is a function of size and design. Generally, larger systems are required for greater rated power. To generate more power on a sunny day, a PV system needs to have more surface area. The power from PV panels is a function of the panel area, but is limited by the energy coming from the sun. Similarly, to capture more power from a given wind resource, a wind turbine needs to be larger. The power from wind turbines is a function of the swept area of the rotor and the wind speed, but there is no limit to possible wind speeds. It is the control systems on wind turbines that limit the delivered power. Very high winds can be destructive and in high winds, wind turbines are shut down for protection.
The variability of renewable energy resources has a significant impact on the design of renewable energy based power systems. The power from conventional fossil or nuclear-fueled generators can be controlled. Normally it is set to be equal to the power consumption on the grid. In this manner, the grid voltage and frequency remain stable. Renewable power sources are transient and variable. For maximum use, they must be utilized when present. If there is more power available than can be used, a sink for the extra energy must be provided. During periods of low resources, there may be no energy to convert to electricity and supplemental power sources may be needed to provide power.
3.2. Grid Connected Renewable Plants
In grid connected systems, both the source for supplementary power and the sink for extra power is the grid system. If the instantaneous power from renewable generators on Thompson Island were greater than the power use on the island, then the extra power would flow through the cable into the grid. If the renewable generator qualified for net metering, then the outgoing power would, in effect, turn the electric meter backwards. If the renewable power were less than the power use on the island, then only the additional power that is needed would flow through the cable from the mainland grid. This would also reduce the electric utility bills of the island.

10
The extent of energy flows in both directions through the underwater cable will depend on the renewable system size and on the temporal match of the load and the renewable power. A renewable system that is rated at 10 kW, that is, less than the minimum occurring load, would never produce more power than was needed on the island. It would only reduce the need for power from the mainland. The power from a larger renewable system would all be used on the island if the resource were such that the power produced was always equal or less than the island load. In general this would not be the case. A 40 kW system would sometimes produce 40 kW when the load was less than 40 kW, resulting in some power flowing to the mainland. Renewable power systems in Massachusetts up to 60 kW qualify for net metering. Thus any power flows into the grid would reduce the total cost of electricity on the island.
The fraction of the power that would be sent to the mainland increases with the size of the renewable system. A 600 kW wind turbine would almost always be providing power to the mainland. Only in periods of low wind and high power usage would the power flow to the island. Systems larger than 60 kW would need to contract to sell the extra power. The economics of these systems then depends on the price at which the power could be sold.
3.3. Autonomous Power Plants
Autonomous renewable power plants operate without a connection to a larger electric grid. Autonomous renewable power plants are more complicated than grid connected power plants because the system control must take over all of the functions of controlling a regular power system and because of the extra equipment needed to provide stable power. As mentioned above, successful operation requires that there be a sink for extra power and a source for a power shortfall from the renewable generators. Autonomous systems typically use a diesel generator for back up power and “dump” loads to dissipate excess power. Dump loads may be resistors that waste the energy or, for example, electric heaters that can be used to decrease fuel oil use for space heating. Often battery energy storage is used both as a source and a sink for power. The use of batteries significantly reduces the wear and tear on a diesel generator, because it reduces the number of times that a diesel needs to be started and stopped as the wind power and load rise and fall.
11
4. Modeling Renewable Power Systems
For this study, the performance and economics of a number of possible grid connected and autonomous power systems have been studied. The performance and economics of such systems are a function of the local load and renewable resource, the temporal match between the two, and the cost and performance of the various system components. A sophisticated model is needed to accurately determine the operation of such a system.
4.1. Hybrid2 – A Renewable Power System Model
Hybrid2 has been used for modeling the renewable power systems examined in this study. Hybrid2 is a detailed computer code used for modeling hybrid power systems, systems that include renewable and conventional power generators. It was developed at the University of Massachusetts in Amherst and is supported by the National Renewable Energy Laboratory (see Manwell e. al. [1997]). The model uses a number of inputs, primarily cost and performance information for the system components and information on the system site and renewable resource. The model provides, as output, summaries of system performance and operation, an economic analysis of the long term system costs and cost of energy, and a detailed time series of power flows and component status that are used for the summary analysis.
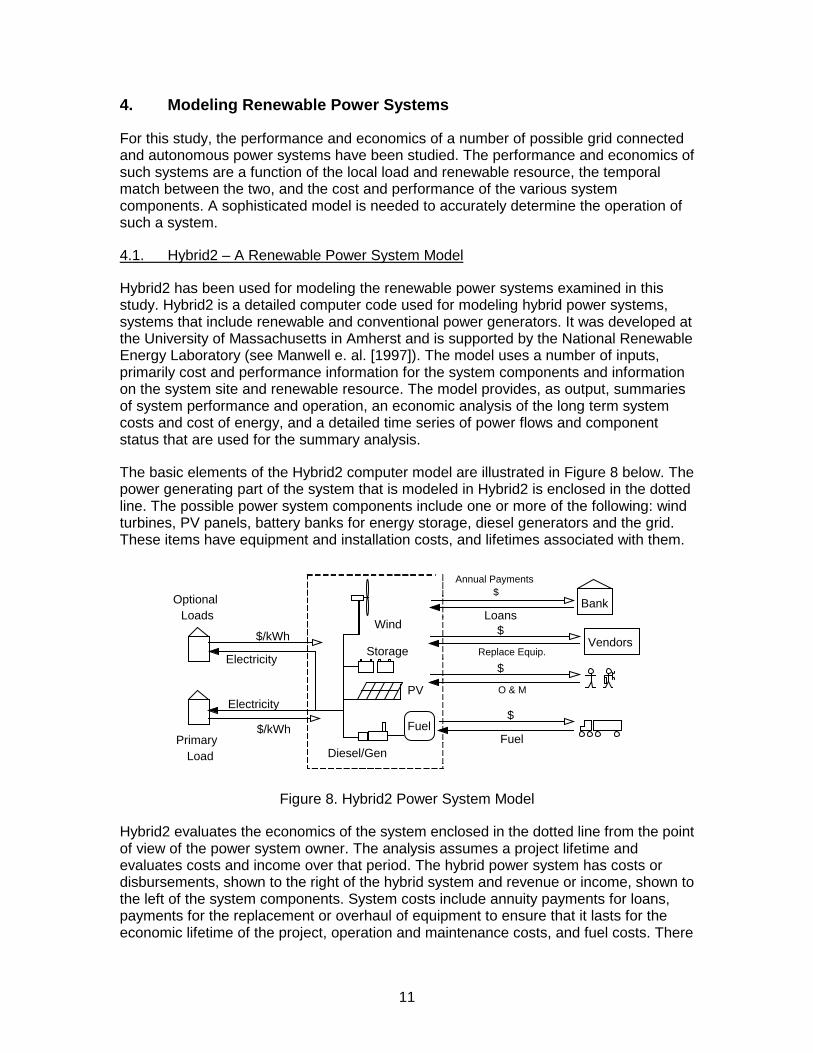
The basic elements of the Hybrid2 computer model are illustrated in Figure 8 below. The power generating part of the system that is modeled in Hybrid2 is enclosed in the dotted line. The possible power system components include one or more of the following: wind turbines, PV panels, battery banks for energy storage, diesel generators and the grid. These items have equipment and installation costs, and lifetimes associated with them.
Wind
PV
Diesel/Gen
FuelPrimary
Load
Optional Loads
$/kWh
$
Electricity
Electricity
Fuel
BankLoans
Annual Payments $
$/kWh
StorageVendors
Replace Equip.
$
O & M
$
Figure 8. Hybrid2 Power System Model
Hybrid2 evaluates the economics of the system enclosed in the dotted line from the point of view of the power system owner. The analysis assumes a project lifetime and evaluates costs and income over that period. The hybrid power system has costs or disbursements, shown to the right of the hybrid system and revenue or income, shown to the left of the system components. System costs include annuity payments for loans, payments for the replacement or overhaul of equipment to ensure that it lasts for the economic lifetime of the project, operation and maintenance costs, and fuel costs. There

12
may also be a one-time cost for the down payment for the system which is not included in the figure. The income for the power system owner includes revenue for power sold to “primary loads” and to one or more “optional loads.” Primary loads are electrical loads that are always connected to the system and must always be provided with electricity. On Thompson Island, the primary loads are lights and appliances. Optional loads are electrical loads that may be supplied with power from the hybrid power system or some other system. Optional loads on Thompson Island might include space and water heating in buildings in which the heating systems allowed for either electrical resistance heating elements or heat from fuel oil. As will be discussed below, an optional load concept may also be used to model the effect of selling excess power when the system is connected to the electric gird. A one-time revenue source, the salvage value of the equipment, occurs at the end of the economic analysis period and is also not included in the figure.
Hybrid2 calculates a number of economic parameters. Some of these are:
Gross Revenue = Revenue from all primary and optional loads System Costs = Costs (disbursements) for fuel, O & M, annuities, and equipment
replacement. Net Revenue = System revenue - system expense + salvage cost at end of
economic life of project (when appropriate). Profit = Net revenue – taxes
These parameters are calculated for each year of the project. In order to compare the economics of systems in which disbursements and revenue are spread out over the years of the project, the value of each of these expenses or revenues are discounted back to the present. In this manner, the net present worth of each of the items above is calculated. Once the net present worth of a cost has been determined, the levelized annual cost is determined. That is the annuity one would pay out yearly given a constant discount rate that would have the same net present worth. Other parameters calculated by the program and used in this report include:
Net Present Value of System Costs = Sum of present value of system costs + present value of down payment – present value of salvage price
Net Present Value = Net present value of gross revenue – net present value of system costs
For the economic analyses presented here, the discount rate is assumed to be 6%, the general inflation and fuel inflation rates are assumed to be 5% and the loan interest rate is assumed to be 7%. All systems are assumed to have a 20-year life.
4.2. Economic Comparison of Power System Options
The net present value of the power systems is used in this study for comparison of the many power system options. The economic analysis in Hybrid2 assumes the point of view of the power system operator. In the case of Thompson Island, the system operator is also the consumer of the primary and heating loads. In this circumstance, it is most appropriate to fix the price for the primary electrical power at the effective rate that Outward Bound pays and to compare the net present value of the various power system options.

13
Because the undersea cable to the mainland is not capable of providing reliable power to the island, the choices available to Outward Bound are:
1. Replacing the undersea cable only 2. Replacing the undersea cable and adding a renewable power system 3. Not replacing the undersea cable and adding an autonomous power system
Replacing the underground cable will increase the total cost of electricity to the island, but this is the only choice if no renewable power system is installed. Therefore, the economic comparisons between power systems in this study assume that the price of primary power includes the price of the cable.
The power plants that were considered in this study have been grouped into three categories: 1) systems for the reduction of purchased energy, 2) large systems with significant energy sales to the mainland, and 3) autonomous systems. While Hybrid2 was originally designed for autonomous power systems, each of these systems (including the existing grid connected system) can be analyzed using Hybrid2 by changing a few input parameters. The details of modeling these systems using Hybrid2 follows.
4.3. Modeling the Existing Grid Connected System
The existing grid connected system can be modeled using Hybrid2, as shown in Figure 9. In the figure, the system whose performance and economics is evaluated by Hybrid2 is inside the dotted line. Everything on the island is inside the solid line. Costs to the system operator are on the right of the system and revenue coming into the system is on the left of the system.
The costs for electricity in the grid-connected system include 1) payments to the utility for electricity and 2) any costs for a new underwater cable. In the existing system, the mainland grid generators can be modeled as a diesel generator (“pseudo diesel”) connected to the island load. The system costs shown in the figure include “fuel” costs for the pseudo diesel. If the parameters for the no load fuel cost and the slope of the fuel vs. power curve are chosen correctly, the fuel cost correctly reflects the demand charge and the per kilowatt-hour charge for electricity from the grid. The economic analysis of the power systems considered here also includes the cost of the new cable to the mainland. This cost includes the down payment on the estimated cost of $360,000 and the loan payments to finance the balance.
The effective price paid by the island for energy represents the total effective cost of electricity. When the cable costs and demand charge are included in the analysis, the effective price of electricity is 14.28 c/kWh. For all of the analyses considered here, the primary power on the island is assumed to be priced at 14.28 c/kWh. This allows all of the systems to be compared to the alternative of simply replacing the troublesome cable and paying a high price for electricity.

14
Primary Electrical
Load
Electricity
$/kWh Utility Gen
Fuel$
Fuel
Thompson Island
BankLoans
Annual Payments $
Figure 9. Existing Grid Connected System
4.4. Modeling Systems for the Reduction of Purchased Energy
The systems for the reduction of power from the grid include renewable systems whose annual energy production is approximately equal to the annual electrical energy needs of the island. The modeling of these systems is illustrated in Figure 10. As before, systems on the island are enclosed within the solid lines and power system components that are modeled by Hybrid2 are inside the dotted line. Costs to the system operator are on the right of the system and revenue coming into the system is on the left of the system.
In these grid-connected renewable power systems, the grid connection, including the cable cost, is modeled as in the existing power system. In addition to the utility generator, there are wind and PV generators. When the renewable sources produce power, less electricity is purchased from the grid. This is reflected in the model as a reduction in pseudo diesel fuel use and lower payments to the grid. There is also an optional load (“net metering”) that is used to model power flows into the grid. For systems eligible for net metering (those with a rated power of less than 60 kW), the user only pays for the net monthly energy consumption. This can be modeled by including income from power flowing to the grid at the island’s avoided cost, 6.07 c/kWh. For larger systems, the island pays for electricity from the utility and any power sent to the mainland can be sold to a marketer of green power. This is also modeled using the optional load, but with the price of the optional load power set to the price paid by the green marketer.
The green market sales price depends on the power markets. In the past one could only expect the utilities to pay their avoided cost of about 3 c/kWh. With the advent of green power markets and renewable portfolio standards, the price may well climb much higher. In these analyses, the green power price for renewable energy from Thompson Island is assumed to be 7 c/kWh. This estimate is based on conversations with Mike Tennis at AllEnergy, a green power marketer. Given the infancy of green power markets, the price could be expected to vary significantly depending on the marketer’s power portfolio and customer demand. Over time a firmer price should be established.
In these grid-connected systems and the power systems designed for significant energy sales, the demand charge is assumed to remain constant at the average monthly demand charge. In these systems there might indeed be a reduction in demand in windy months, but any reduction in demand would depend on the temporal coincidence of the highest daily consumption and available wind power. The daily load fluctuates about the same each day. Thus, to significantly reduce peak measured demand in any month, there would have to be available wind power every day of the month at the peak demand

15
period. This is unlikely. Thus, the assumption that the demand charge remains constant should not introduce significant errors.
Wind
PV
Primary Electrical
Load
Electricity
$/kWh
Utility Gen
Fuel
Thompson Island
Optional Grid Load
$/kWh
Net Metering $
Fuel
BankLoans
Annual Payments $
VendorsReplace Equip.
$
O & M
$
Figure 10. System for the Reduction of Energy from the Grid
4.5. Modeling Large Systems with Significant Energy Sales
The application of Hybrid2 to large renewable power systems with significant energy sales to the grid can be modeled as shown in Figure 11. These systems are similar to the smaller systems described above. The only difference is that in these larger systems, the price for electricity sold to the grid is always the green power price (see above).
Wind
PV
Primary Electrical
Load
Electricity
$/kWh
Utility Gen
Fuel
Thompson Island
Optional Grid Load
$/kWh
Green Power $
Fuel
BankLoans
Annual Payments $
VendorsReplace Equip.
$
O & M
$
Figure 11. System for the Sales of Energy
4.6. Modeling Autonomous Renewable Power Systems
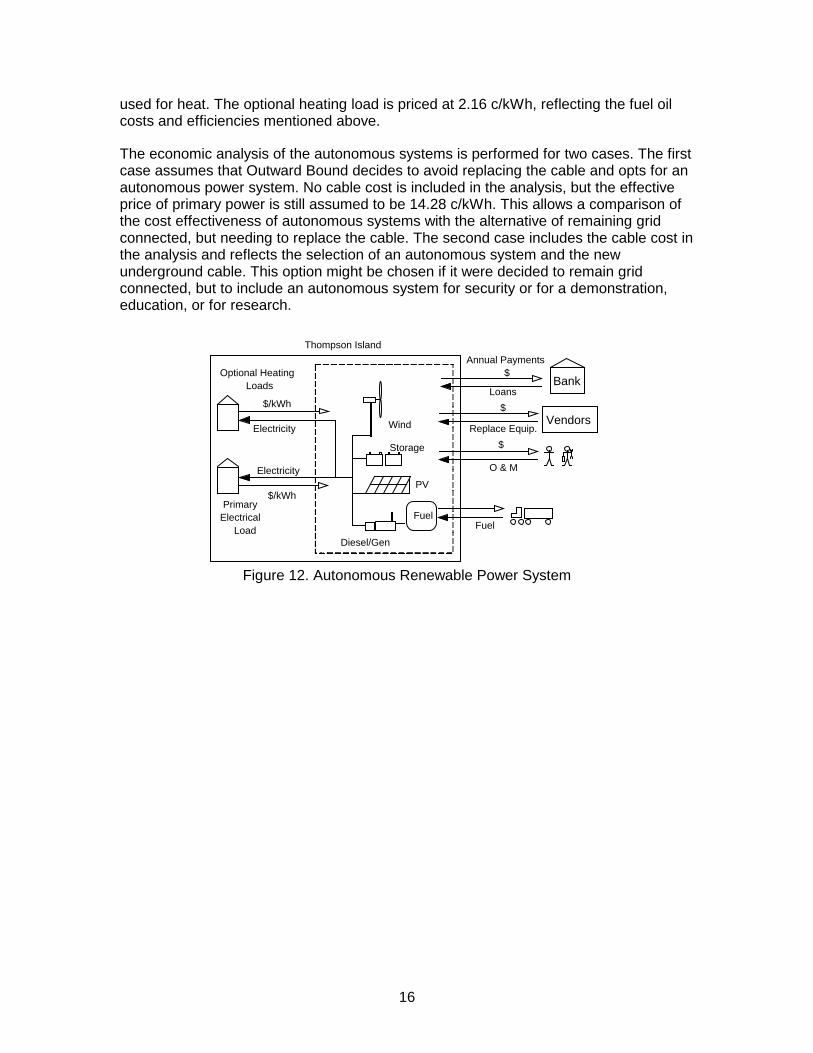
The autonomous systems that are modeled need no connection to the mainland (see Figure 12). The power system may include wind and PV generators, battery energy storage and one or more diesel generators. All loads are on the island. They include the primary load and an additional space and water heating load that is modeled as an optional load. It is assumed that a redundant electrical heating system in included in the buildings in which presently use fuel oil for heat or water. This electrical system is then used to absorb surplus power and to displace fuel oil that would otherwise have to be
16
used for heat. The optional heating load is priced at 2.16 c/kWh, reflecting the fuel oil costs and efficiencies mentioned above.
The economic analysis of the autonomous systems is performed for two cases. The first case assumes that Outward Bound decides to avoid replacing the cable and opts for an autonomous power system. No cable cost is included in the analysis, but the effective price of primary power is still assumed to be 14.28 c/kWh. This allows a comparison of the cost effectiveness of autonomous systems with the alternative of remaining grid connected, but needing to replace the cable. The second case includes the cable cost in the analysis and reflects the selection of an autonomous system and the new underground cable. This option might be chosen if it were decided to remain grid connected, but to include an autonomous system for security or for a demonstration, education, or for research.
Wind
PV
Diesel/Gen
FuelPrimary
Electrical Load
Optional Heating Loads
$/kWh
Electricity
Electricity
$/kWh
Storage
Thompson Island
Fuel
BankLoans
Annual Payments $
VendorsReplace Equip.
$
O & M
$
Figure 12. Autonomous Renewable Power System

17
5. Overview of Power Plant Options
5.1. Summary of Power Plant Options
As previously discussed, the power plants that were considered in this study have been grouped into three categories: 1) systems for the reduction of purchased energy, 2) large systems with significant energy sales to the mainland, and 3) autonomous systems. Within these categories there are a variety of systems, ranging in capacity and choice of components. The details of all of these systems are described in the sections below.
5.2. Systems for Reduction of Purchased Energy
Four systems for the reduction of purchased energy have been analyzed. These include two systems with one and two 50 kW Atlantic Orient Corp. (AOC) wind turbines, respectively and two similar systems that include, in addition to the wind turbines, PV panels. These systems would provide a significant fraction of the electrical needs of the island, without sending much power to the mainland.
System Wind Power kW
PV Power kW
Power Sales c/kWh
Installed System Cost $
Cable Cost $
1.1 50 -- 6.07 103,173 360,000 1.2 100 -- 7 206,346 360,000 1.3 50 5 6.07 152,443 360,000 1.4 100 10 7 300,126 360,000
Table 3. Overview of systems for the reduction of purchased power.
5.3. Large Systems with Significant Energy Sales
Three large renewable power systems with a significant sale of energy to the mainland have also been evaluated. The three systems use different renewable power systems, all of which involve wind turbines. The three systems that are considered include either a Nordex N29 250 kW wind turbine, a DeWind D48 600 kW wind turbine, or a Vestas V47 660 kW wind turbine. In all of these systems, the reduced power consumption is valued at the avoided retail cost for power (6.07 c/kWh) and any sales of excess power are valued at the green power rate of 7 c/kWh. Equipment and installation costs are based on manufacturer’s quotes, where available. None were available from DeWind. Thus, the DeWind costs are based on the manufacturer's list prices and might be different if they were based on a bid process. The systems for the reduction of purchased energy and sale of a significant amount of energy to the grid are characterized in Table 4. None of these systems included PV panels. Photovoltaics are not included die to their much higher cost of energy. A wire frame illustration of a large wind turbine on Thompson Island is shown in Figure 13.
System Wind Power kW
Power Sales c/kWh
Installed System Cost
$
Cable Cost $
2.1 250 7 793,808 360,000 2.2 600 7 327,168 360,000 2.3 660 7 811,548 360,000
Table 4. Overview of systems for the sale of power.

18
Figure 13. Wire frame of large wind turbine as seen from Boston.
5.4. Autonomous Renewable Power Systems
Four autonomous power systems have also been considered. These systems would be totally independent of the grid. All systems include two diesel generators rated at 50 kW and a supplementary electric space heating system to use excess power and to reduce fuel oil consumption. The diesel generators may be turned off when there is enough surplus power from other sources, but must maintain at least 20% of rated load when operating to ensure a long diesel life. The details of the other components of these hybrid systems differ between the systems. The first system includes one AOC 50 kW wind turbine. The second system includes, in addition to the components of the first system, about one hour of battery energy storage at peak load (74 kWh) and an inverter to handle power fluctuations. This reduces the diesel run time and diesel fuel consumption. The third and fourth systems are similar to the first two, but both include two AOC wind turbines. The third system includes no storage and the fourth has one hour of storage. The autonomous systems are characterized in Table 5. None of these systems included PV panels.
System Wind Power kW
Storage hrs
Installed System Cost
$
Cable Cost (When Included)
$ 3.1 50 -- 163,173 360,000 3.2 50 1 209,465 360,000 3.3 100 -- 266,346 360,000 3.4 100 1 312,638 360,000
Table 5. Overview of autonomous systems

19
6. Power Plant Options – Performance and Economics
6.1. Systems for Reduction of Purchased Energy
The performance of the first category of systems, systems designed for the reduction of purchased energy is summarized in Table 6. In the systems analyzed, the increase of additional wind turbines increased the total energy from the wind and reduced the net energy purchases from the grid. The addition of the PV systems did not increase the total renewable energy significantly. This table and subsequent tables include, for reference, output file names that are included in the addendum to this report.
System Wind Power
kW
PV Power
kW
Wind Energy Production
% load
PV Energy Production
% load
Net Energy from Grid % load
System Performance Data File
1.1 50 -- 36.1 63.9 Case1d01.SUM 1.2 100 -- 72.3 27.7 Case1e01.SUM 1.3 50 5 36.1 1.6 62.3 Case1a01.SUM 1.4 100 10 72.3 3.3 24.4 Case1b01.SUM
Table 6. Performance of systems for reduction of purchased energy
The economic results are tabulated in Table 7. The system with one AOC turbine and net metering resulted in a slight negative net present value, indicating that it would be wiser to invest the money for the system at the discount rate. The system with two AOC turbines had a slight positive net present value, indicating that there was merit in considering it. This difference in performance is because of the greater reduction of purchases from the grid with the larger system and because the green power price for energy is slightly higher than the per kilowatt-hour cost of power on the island. That is, the modeling of the two-turbine system assumes that power flowing to the grid nets 7 c/kWh, while power from the smaller system that flows to the grid is only valued at 6.07 c/kWh. It can be seen that the addition of even small amounts of PV decreased the net present value considerably.
System Wind Power
kW
PV Power
kW
Net Present Value
$
System Economic Analysis Data File
1.1 50 -- -5,076 Case1d01.ECS 1.2 100 -- 4,032 Case1e01.ECS 1.3 50 5 -51,136 Case1a01.ECS 1.4 100 10 -82,492 Case1b01.ECS
Table 7. Net present value of systems for reduction of purchased energy
An analysis was performed to determine the sensitivity of the results to changes in three parameters. loan interest rate, wind speed, and the price of green power. The two-wind turbine system without PV was chosen for the analysis. A summary of the cases that were considered is presented in Table 8.

20
System Average Relative
Wind Speed
Loan Interest
%
Green Power Price cents
System Performance
Data File
System Economic Analysis
Data File Base Case 1.08 7 7 Case1e01.SUM Case1e01.ECS
Decreased Wind 0.8 7 7 Case1e03.SUM Case1e03.ECS Increased Wind 1.3 7 7 Case1e04.SUM Case1e04.ECS
Lower Interest Rate 1.08 4 7 Case1e01.SUM Case1e05.ECS Lower Interest Rate 1.08 6 7 Case1e01.SUM Case1e06.ECS
Greater Interest Rate 1.08 8 7 Case1e01.SUM Case1e07.ECS Greater Interest Rate 1.08 10 7 Case1e01.SUM Case1e08.ECS Lower Power Price 1.08 7 4 Case1e01.SUM Case1e09.ECS Lower Power Price 1.08 7 6 Case1e01.SUM Case1e10.ECS
Greater Power Price 1.08 7 8 Case1e01.SUM Case1e11.ECS Greater Power Price 1.08 7 10 Case1e01.SUM Case1e12.ECS
Table 8. Summary of cases evaluated for the sensitivity analysis.
The results of the sensitivity analysis are presented in Figure 14. The net present value is presented as a function of the fractional change of the three parameters. It can be seen that the net present value of the system is very sensitive to the average wind speed and the loan interest rate and less sensitive to changes in the price of green power. For example, if the average wind speed is 10% greater than assumed in the analysis, then the net present value of the project increases to about $60,000.
160
120
80
40
0
-40
-80
-120
Net
Pre
sent
Val
ue, $
/100
0
1.51.41.31.21.11.00.90.80.70.60.5Economic Parameter
Average Wind Speed Interest Rate Green Power Price
System Net Worth vs. Normalized Economic Parameters
Figure 14. Summary of cases evaluated for the sensitivity analysis.
6.2. Systems for Energy Sales
The systems designed for energy sales had a greater net present value than the smaller systems considered above. In all cases, the systems were cost effective. In general, the larger the wind system, the more energy was sold to the grid and the less energy was purchased from the grid (see Table 9). In the specific systems considered, it appears that the power curve of the DeWind 600 kW turbine provides a better match to the wind resource on the island than that of the Vestas 660 kW machine. The DeWind wind turbine produced more energy from the available winds than the larger one and resulted in lower energy purchases and higher sales

21
System Wind Turbine Mfgr.
Wind Power
kW
Power Sales c/kWh
Energy Purchases
% elec. load
Energy Sales % elec. load
Wind Energy
% elec. load
System Performance Data File
2.1 Nordex 250 7 34.4 100.1 165.7 Case2b01.SUM 2.2 DeWind 600 7 22.6 422.5 499.8 Case2a01.SUM 2.3 Vestas 660 7 24.8 403.8 479.1 Case2c01.SUM
Table 9. Performance of systems for sale of energy
These large systems have net present values that make them very profitable options (see Table 10). The most cost-effective system has a net present value greater than 1 million dollars.
System Wind Power
kW
Power Sales c/kWh
Net present Value
$
System Performance Data File
2.1 250 7 240,299 Case2b01.ECS 2.2 600 7 1,073,921 Case2a01.ECS 2.3 660 7 969,890 Case2c01.ECS
Table 10. Net present value of systems for sale of energy
6.3. Autonomous Systems
The performance results for the autonomous systems are presented in Table 11. In general, the larger the wind component in the system, the more wind energy is produced and the more energy is provided to the space heating system. The addition of storage allows the diesel to be shut down more often, reducing energy from the diesel and excess energy that goes to the space heating.
System Wind Power
kW
Storage hrs
Diesel Power
%elec. load
Wind Power
%elec. load
Heating %elec. load
System Performance Data File
3.1 50 -- 72.7 36.1 8.9 Case3a01.SUM 3.2 50 1 69.7 36.1 5.0 Case3b01.SUM 3.3 100 -- 64.8 72.3 37.1 Case3c01.SUM 3.4 100 1 55.6 72.3 26.7 Case3d01.SUM
Table 11. Performance and payback of autonomous systems
The autonomous systems provide net present values comparable to the Nordex N29 system described above when no cable costs are incurred. The two wind turbine systems (100 kW total wind power) are less cost effective because the installed cost is proportionally greater than the reduction in diesel fuel costs.
System Wind Power
kW
Storage hrs
Net Present Value, $ No cable
Net Present Value, $ Cable
System Economic Analysis Data File
3.1 50 -- 248,680 Case3a02.ECS 3.2 50 1 214,249 Case3b02.ECS 3.3 100 -- 156,024 Case3c02.ECS 3.4 100 1 155,344 Case3d02.ECS 3.1 50 -- -135,132 Case3a01.ECS 3.2 50 1 -169,562 Case3b01.ECS 3.3 100 -- -227,787 Case3c01.ECS 3.4 100 1 -228,467 Case3d01.ECS
Table 12. Performance and payback of autonomous systems

22
7. Summary and Recommendations
Based on the performance results and economic analysis, the following conclusions can be drawn:
1. If Thompson Island were willing to forego a cable, the hybrid system with wind power is a very viable and cost effective option.
2. If Thompson Island puts in a cable, the addition of wind power would, in general, be economic.
3. The smaller wind systems that have been considered are approximately neutral in terms of economic benefits.
4. In general, the larger the wind system, the more economic it is. 5. The inclusion of PV in grid connected systems decreases net present value
considerably. In addition to these conclusions, a few observations about the conclusions are in order:
1. Confirmation of the green power price is required 2. These results are conservative as no consideration has been given to the
details of savings due to a tax credit. 3. No credit is given to possible demand reduction and, furthermore, a different
hybrid system control could be devised which could limit demand.

23
8. References
Bundesverband WindEnergie e.V., WindEnergie 1999, Bundesverband WindEnergie e.V., Osnabrueck, Germany, 1999.
Manwell, J. F., Rogers, A., Hayman, G., Avelar, C. T., McGowan, J. G., HYBRID2 - A Hybrid System Simulation Model, Theory Summary, National Renewable Energy Laboratory, Subcontract No. XL-1-11126-1-1, December, 1997.
Manwell, J. F., Rogers, A. L., Ellis, A F., Monthly Data Reports for May 1998 – April 1999, Thompson Island Power Plant Options Study, Report prepared for Division of Energy Resources, Boston MA.