power quality analysis in electric traction system with ... · pdf filepower quality analysis...
TRANSCRIPT
Power Quality Analysis in Electric Traction System with Three-phase Induction Motors
B. Milešević, I. Uglešić, B. Filipović-Grčić
Abstract—Three-phase induction motors are widely used in
electric traction systems. Impacts of the traction vehicle equipped
by three-phase induction motors on power quality are much
different from the impacts of vehicles with DC traction motors. In
this paper, the effects of the traction vehicle operation with three-
phase induction motors on power quality in 110 kV transmission
network are investigated.
The electric traction system 25 kV, 50 Hz and the traction
vehicle with 3f induction motors were modeled including AC/DC
rectifier and DC/AC inverter based on IGBT technology. The
parameters of those power electronic elements directly determine
the current and voltage waveforms and power quality
parameters.
Modeling, measurements and analysis of power quality
parameters were presented. Three operation modes of traction
vehicle were considered including acceleration, constant drive
and regenerative breaking. During the test drives, the values of
total harmonic distortion, unbalance, flicker and power factor
were obtained.
Keywords: electric railway, power quality, induction motors.
I. INTRODUCTION
LECTRIC railway system is essential for the transport of
people and goods. Numerous advantages of electric
railway have been proven in comparison with other forms of
transport, from reliability and safety to the speed and comfort
1. The development of societies and economics entails the
improvement of railways. The most important railway
transportation routes are electrified which makes this system
more competitive and environmentally more acceptable 2.
Electric railway is a single phase consumer 3. Operation
of traction vehicle may cause significant effects on power
quality parameters in the power system4. One of the most
widely used railway electrification systems is 25 kV, 50 Hz.
This system is powered from the electric power transmission
system and it supplies traction vehicles through contact
network. Voltage and current waveforms in the railway system
directly depend on the type of traction vehicle, its
characteristics and electrical properties 5. Electric traction
This work has been supported in part by the Croatian Science Foundation
under the project “Development of advanced high voltage systems by
application of new information and communication technologies”
(DAHVAT).
B. Milešević, I. Uglešić and B. Filipović-Grčić are with the University of
Zagreb, Faculty of Electrical Engineering and Computing, Unska 3, Zagreb,
Croatia (e-mail of corresponding author: [email protected]).
Paper submitted to the International Conference on Power Systems
Transients (IPST2015) in Cavtat, Croatia June 15-18, 2015
vehicles are commonly equipped by DC motors or 3f AC
motors.6. The advantages of 3f induction motors are
manifested in possibilities of energy recovery during braking
or operating on downhill and simplest maintenance. Electric
railway system have an influence on systems that ensure
reliability of the system (communication subsystem), but also
on the systems in the vicinity which are sensitive to
disturbances 5, 7, 8. Different traction vehicle supply
current and voltage effect with different disturbances.
Power transformer at traction vehicle is connected to
AC/DC rectifier which is connected to DC link (Fig. 1 and Fig.
2). DC voltage is converted by DC/AC inverter to 3f AC
voltage and supply 3f AC induction motor. Power electronics
elements, rectifier and inverter, are performed by thyristors or
IGBT 9.
All measurements were performed during acceleration,
constant drive and regenerative braking of electric traction
vehicle. Waveforms of electric parameters in different
operation modes are compared and deviations from nominal
values are found according to the applicable standards 10,
11. The measurement and analysis of power quality
parameters in traction substation during the operation of
locomotive equipped with 3f induction motors were presented.
II. OPERATION OF TRACTION VEHICLES WITH 3f INDUCTION
MOTORS IN ELECTRIC RAILWAY SYSTEM 25 kV, 50 HZ
The operation of the single phase 25 kV (50 Hz) electric
traction system is significantly different from the electric
power system which supplies it 3.
The electric traction system is supplied from electric power
system through power transformers located at traction
substation. These transformers are connected to two phases of
the power transmission system. Traction power supply network
is separated by neutral section to the independent sections
which are supplied from different traction substations. Fig. 1
shows a principle connection scheme of the 25 kV, 50 Hz
electric traction system to 110 kV transmission network.
25 kV, 50 Hz
110 kV, 50 Hz
Power transmission
system
Traction
power system
Traction
substation
Traction
substation
Neutral section
Fig. 1. Electric traction system
E

Electric traction vehicles are powered from contact network
via pantograph and power transformer that adjust the 25 kV
voltage to suitable value for induction traction motors (Fig. 2).
AC/DC DC/AC
Control
Fig. 2. Electric traction vehicle with induction motor
In this paper, multi-system traction vehicle supplied by 25
kV, 50 Hz system was used. The nominal drive power of one
unit is 6.4 MW and heating power is 900 kVA 12, 13. In
Fig. 3 the measured effective values of current and
active/reactive power on 25 kV side are shown. The values of
current and power change stepwise and depend on the
operation mode. The measured supply current exceeded 300
A, while at the same moment the maximum measured active
and reactive powers were 7.5 MW and 950 kvar, respectively.
The measured reactive power had a permanent positive sign,
whereas active power changed both positive and negative sign,
depending on power flow direction. In the periods when the
value of active power is positive, energy flows from power
substation to a traction vehicle while a negative sign indicates
the opposite flow of energy. Maximum active power during
recuperation braking (energy recovery) was 5.5 MW and has
been reached at the moment when the current was 215 A and
reactive power was 440 kvar. As expected, the maximum
power that can be recovered was less than the maximum power
that the vehicle used for the acceleration.
Timeplot - Phase A
Voltage RMS value, Current RMS value, Active pow er, P (W), Reactive power Q, at fund. freq. (VAR),Voltage THD, unnormalized Root-Sum-Square,Current THD, unnormalized Root-Sum-Square
17:25
09.06.2014
Monday
17:26 17:27 17:28 17:29 17:30 17:31 17:32 17:33 17:34 17:35
25250
25500
25750
26000
Vo
lts
A Vrms
0
50
100
150
200
250
300
Am
ps
A Irms
-5000
-2500
0
2500
5000
7500
kW
A P(kW)
0
250
500
750
1000
kV
AR
A QFnd(kVAR)
500
1000
1500
2000
2500
Vo
lts
A VTHDRs s
2.5
5.0
7.5
10.0
12.5
15.0
Am
ps
A IT HDRss
C re ate d wi th D ran V ie w 6.6 .3
Timeplot - Phase A
Voltage RMS value, Current RMS value, Active pow er, P (W), Reactive power Q, at fund. freq. (VAR),Voltage THD, unnormalized Root-Sum-Square,Current THD, unnormalized Root-Sum-Square
17:25
09.06.2014
Monday
17:26 17:27 17:28 17:29 17:30 17:31 17:32 17:33 17:34 17:35
25250
25500
25750
26000
Volts
A Vrms
0
50
100
150
200
250
300
Am
ps
A Irms
-5000
-2500
0
2500
5000
7500
kW
A P(kW)
0
250
500
750
1000
kV
AR
A QFnd(kVAR)
500
1000
1500
2000
2500
Volts
A VTHDRs s
2.5
5.0
7.5
10.0
12.5
15.0
Am
ps
A IT HDRss
C re ate d wi th D ran V ie w 6.6 .3
Timeplot - Phase A
Voltage RMS value, Current RMS value, Active pow er, P (W), Reactive power Q, at fund. freq. (VAR),Voltage THD, unnormalized Root-Sum-Square,Current THD, unnormalized Root-Sum-Square
11:05
09.06.2014
Monday
11:06 11:07 11:08 11:09 11:10 11:11 11:12 11:13 11:14 11:15
25882.54200
25882.54225
25882.54250
25882.54275
Volts
A Vrms
3.22000
3.22025
3.22050
3.22075
Am
ps
A Irms
23.86750
23.86775
23.86800
23.86825
23.86850
kW
A P(kW)
2.41325
2.41350
2.41375
2.41400
kV
AR
A QFnd(kVAR)
500
1000
1500
2000
2500
3000
Volts
A VTHDRs s
2
4
6
8
Am
ps
A IT HDRss
C re ate d wi th D ran V ie w 6.6 .3
Time
Fig. 3. Current, active and reactive power of electric traction vehicle with induction motors
III. MODEL OF TRACTION VEHICLE WITH INDUCTION MOTORS
The model of electric multiple unit of 2 MW continuous
power was developed in ATP software and it includes power
transformer at substation and on vehicle, IGBT converters, DC
link and induction motor with rated power 525 kW.
The impedance of 110/25 kV power transformer referred to
110 kV side is R=0.5 Ω and L=4 mH (7.5 MW, uk%=10%).
Contact network impedance is 0.181+j0.447 Ω/km. DC link
was modeled by capacitance (C=36 mF) and inductance
(L=0.007 mH). Electrical scheme and model for calculation
are shown in Fig. 4 and Fig. 5.
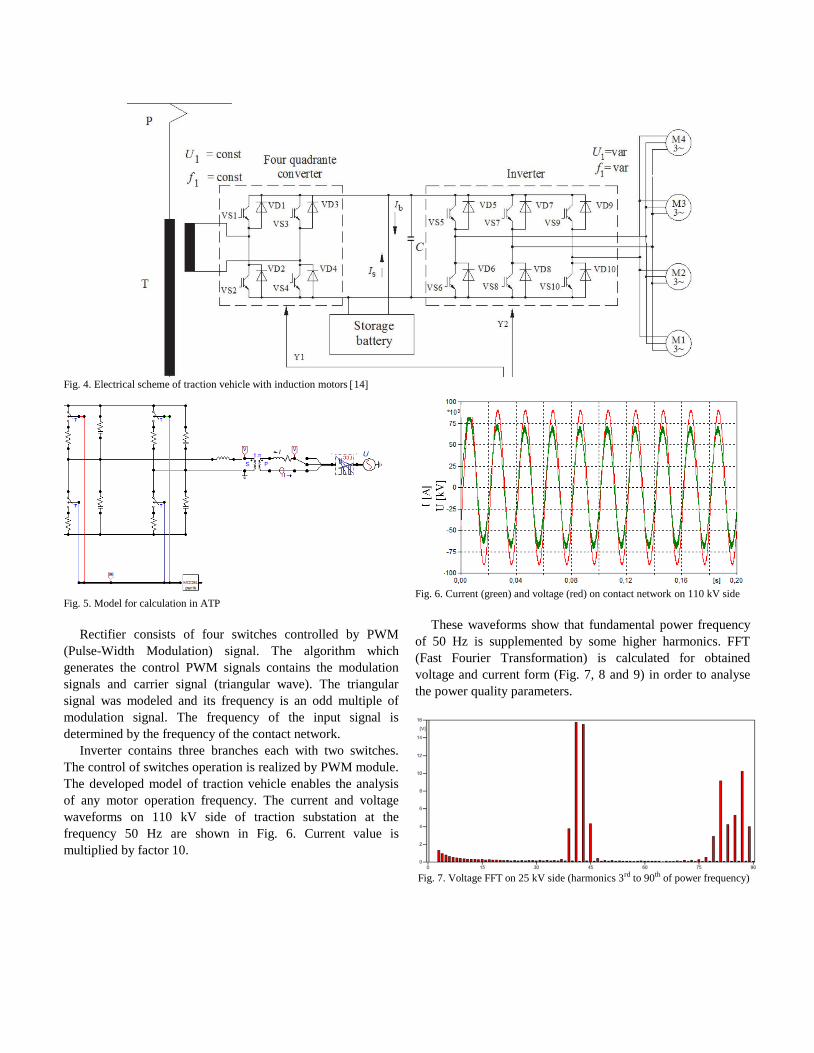
Fig. 4. Electrical scheme of traction vehicle with induction motors 14
Fig. 5. Model for calculation in ATP
Rectifier consists of four switches controlled by PWM
(Pulse-Width Modulation) signal. The algorithm which
generates the control PWM signals contains the modulation
signals and carrier signal (triangular wave). The triangular
signal was modeled and its frequency is an odd multiple of
modulation signal. The frequency of the input signal is
determined by the frequency of the contact network.
Inverter contains three branches each with two switches.
The control of switches operation is realized by PWM module.
The developed model of traction vehicle enables the analysis
of any motor operation frequency. The current and voltage
waveforms on 110 kV side of traction substation at the
frequency 50 Hz are shown in Fig. 6. Current value is
multiplied by factor 10.
Fig. 6. Current (green) and voltage (red) on contact network on 110 kV side
These waveforms show that fundamental power frequency
of 50 Hz is supplemented by some higher harmonics. FFT
(Fast Fourier Transformation) is calculated for obtained
voltage and current form (Fig. 7, 8 and 9) in order to analyse
the power quality parameters.
Fig. 7. Voltage FFT on 25 kV side (harmonics 3rd to 90th of power frequency)
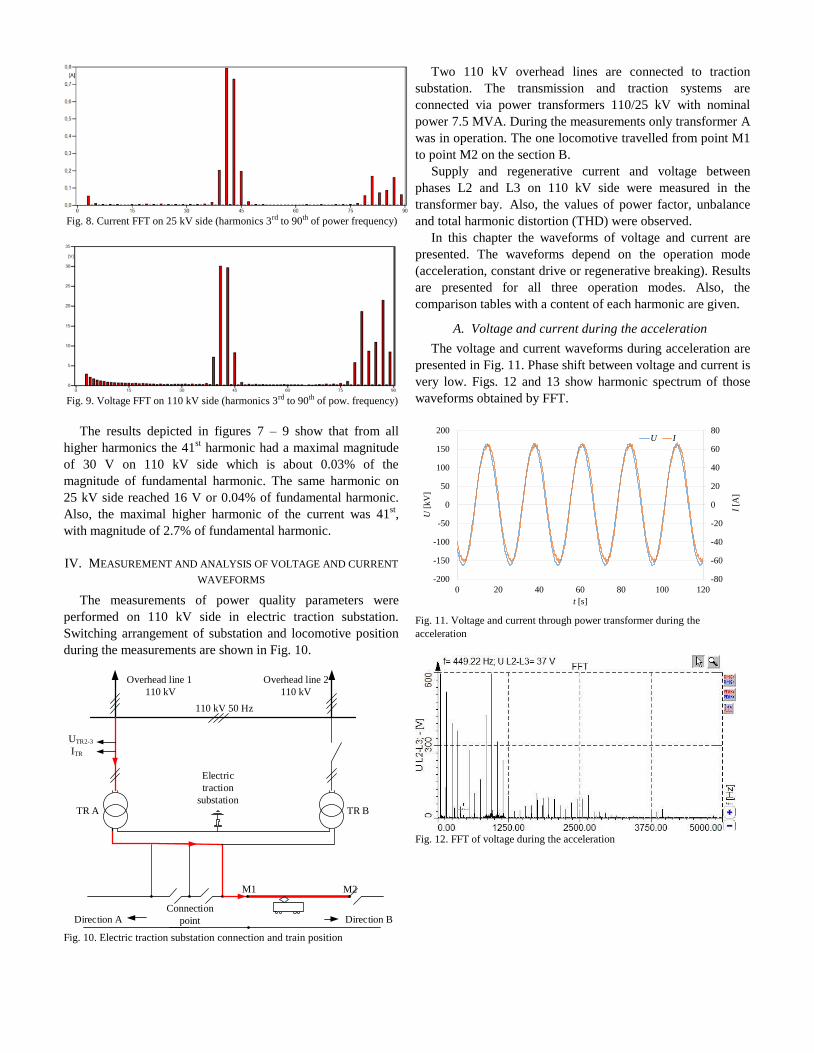
Fig. 8. Current FFT on 25 kV side (harmonics 3rd to 90th of power frequency)
Fig. 9. Voltage FFT on 110 kV side (harmonics 3rd to 90th of pow. frequency)
The results depicted in figures 7 – 9 show that from all
higher harmonics the 41st harmonic had a maximal magnitude
of 30 V on 110 kV side which is about 0.03% of the
magnitude of fundamental harmonic. The same harmonic on
25 kV side reached 16 V or 0.04% of fundamental harmonic.
Also, the maximal higher harmonic of the current was 41st,
with magnitude of 2.7% of fundamental harmonic.
IV. MEASUREMENT AND ANALYSIS OF VOLTAGE AND CURRENT
WAVEFORMS
The measurements of power quality parameters were
performed on 110 kV side in electric traction substation.
Switching arrangement of substation and locomotive position
during the measurements are shown in Fig. 10.
110 kV 50 Hz
Direction A Direction B
M2M1
TR A TR B
UTR2-3
ITR
Electric
traction
substation
Connection
point
Overhead line 2
110 kV
Overhead line 1
110 kV
Fig. 10. Electric traction substation connection and train position
Two 110 kV overhead lines are connected to traction
substation. The transmission and traction systems are
connected via power transformers 110/25 kV with nominal
power 7.5 MVA. During the measurements only transformer A
was in operation. The one locomotive travelled from point M1
to point M2 on the section B.
Supply and regenerative current and voltage between
phases L2 and L3 on 110 kV side were measured in the
transformer bay. Also, the values of power factor, unbalance
and total harmonic distortion (THD) were observed.
In this chapter the waveforms of voltage and current are
presented. The waveforms depend on the operation mode
(acceleration, constant drive or regenerative breaking). Results
are presented for all three operation modes. Also, the
comparison tables with a content of each harmonic are given.
A. Voltage and current during the acceleration
The voltage and current waveforms during acceleration are
presented in Fig. 11. Phase shift between voltage and current is
very low. Figs. 12 and 13 show harmonic spectrum of those
waveforms obtained by FFT.
-80
-60
-40
-20
0
20
40
60
80
-200
-150
-100
-50
0
50
100
150
200
0 20 40 60 80 100 120
U[k
V]
t [s]
U I
I[A
]
Fig. 11. Voltage and current through power transformer during the
acceleration
Fig. 12. FFT of voltage during the acceleration
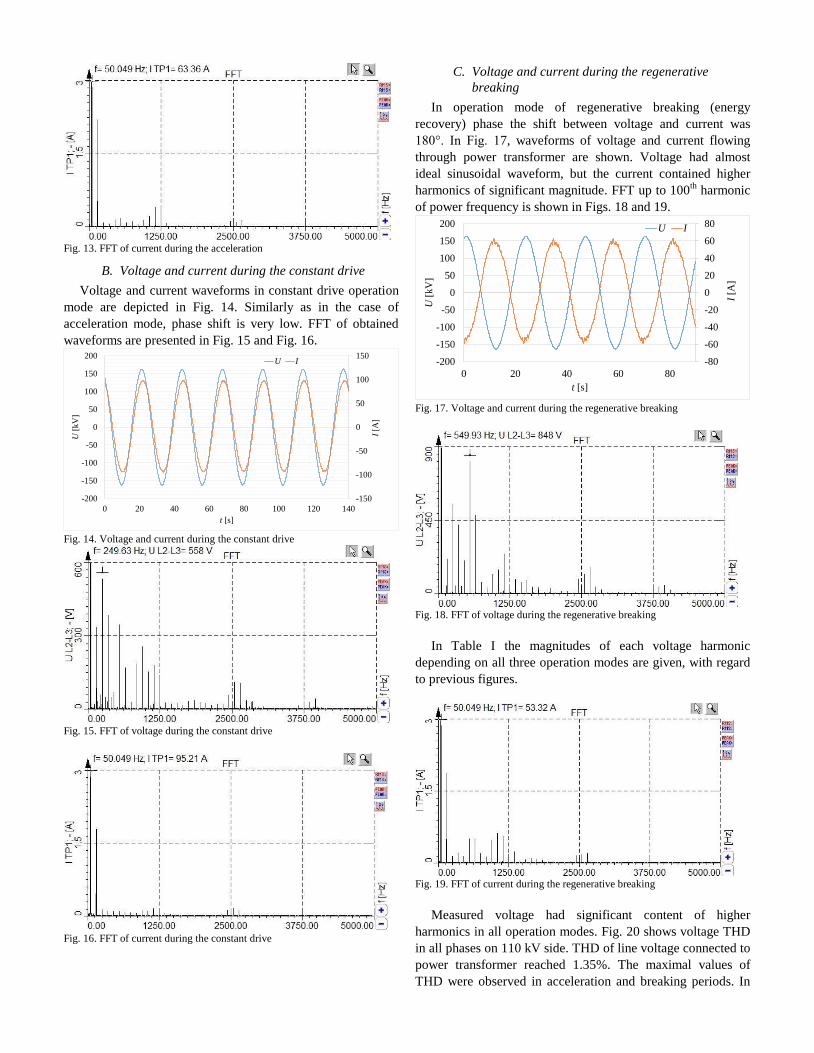
Fig. 13. FFT of current during the acceleration
B. Voltage and current during the constant drive
Voltage and current waveforms in constant drive operation
mode are depicted in Fig. 14. Similarly as in the case of
acceleration mode, phase shift is very low. FFT of obtained
waveforms are presented in Fig. 15 and Fig. 16.
-150
-100
-50
0
50
100
150
-200
-150
-100
-50
0
50
100
150
200
0 20 40 60 80 100 120 140
U[k
V]
t [s]
U I
I[A
]
Fig. 14. Voltage and current during the constant drive
Fig. 15. FFT of voltage during the constant drive
Fig. 16. FFT of current during the constant drive
C. Voltage and current during the regenerative
breaking
In operation mode of regenerative breaking (energy
recovery) phase the shift between voltage and current was
180°. In Fig. 17, waveforms of voltage and current flowing
through power transformer are shown. Voltage had almost
ideal sinusoidal waveform, but the current contained higher
harmonics of significant magnitude. FFT up to 100th
harmonic
of power frequency is shown in Figs. 18 and 19.
-80
-60
-40
-20
0
20
40
60
80
-200
-150
-100
-50
0
50
100
150
200
0 20 40 60 80
U[k
V]
t [s]
U I
I[A
]
Fig. 17. Voltage and current during the regenerative breaking
Fig. 18. FFT of voltage during the regenerative breaking
In Table I the magnitudes of each voltage harmonic
depending on all three operation modes are given, with regard
to previous figures.
Fig. 19. FFT of current during the regenerative breaking
Measured voltage had significant content of higher
harmonics in all operation modes. Fig. 20 shows voltage THD
in all phases on 110 kV side. THD of line voltage connected to
power transformer reached 1.35%. The maximal values of
THD were observed in acceleration and breaking periods. In

phase L1, which is not connected to railway system, THD had
almost constant value of 0.7%. This fact shows that electric
railway vehicles equipped by 3f induction motors have an
important effect on voltage waveform. However, the results
presented in this paper were much lower than the values
allowable in standards. TABLE I
MAGNITUDE OF VOLTAGE HARMONICS DEPENDING ON OPERATION MODE
harmonic
order
ν
Operation mode
magnitude [%]
acceleration constant
drive recuperation
1 100.00 100.00 100.00
3 0.31 0.20 0.13
5 0.26 0.37 0.34
7 0.25 0.22 0.28
9 0.12 0.02 0.13
11 0.28 0.19 0.53
13 0.03 0.13 0.30
15 0.12 0.01 0.05
17 0.29 0.05 0.02
19 0.26 0.03 0.08
21 0.10 0.02 0.09
23 0.11 0.10 0.16
25 0.05 0.05 0.04
27 0.03 <0.02 0.06
29 0.02 <0.02 0.04
35 0.03 <0.02 0.05
39 0.48 <0.02 <0.02 41 0.05 <0.02 <0.02 43 0.03 <0.02 <0.02 45 0.03 <0.02 <0.02 47 0.05 <0.02 <0.02
49 0.05 0.04 0.06
51 0.05 0.07 0.08
53 0.07 0.06 0.10
0,4
0,5
0,6
0,7
0,8
0,9
1
1,1
1,2
1,3
1,4
11:06:03 11:07:03 11:08:03 11:09:03 11:10:03 11:11:03 11:12:03 11:13:03
THD
U(%
)
Vrijeme (sat:minuta:sekunda)
THD UL1 (%)
THD UL2 (%)
THD UL3 (%)
Fig. 20. Voltage total harmonic distortion on 110 kV side
In Table II, the magnitudes of each current harmonic in all
three operation modes are given according the values depicted
in the before.
TABLE II
MAGNITUDE OF CURRENT HARMONICS DEPENDING ON OPERATION MODE
harmonic
order
ν
Operation mode
magnitude [%]
acceleration constant
drive recuperation
1 100.00 100.00 100.00
3 3.71 1.88 3.54
5 0.15 0.14 0.28
7 0.10 0.12 0.43
9 0.26 0.13 0.30
11 0.22 0.11 0.98
13 0.22 0.09 1.00
15 0.17 0.09 0.41
17 0.20 0.04 0.24
19 0.36 0.06 0.92
21 0.15 0.09 1.20
23 <0.10 0.39 1.09
25 0.61 0.19 0.34
27 0.24 0.07 0.45
29 0.10 <0.10 <0.10
35 <0.10 <0.10 <0.10
39 <0.10 <0.10 <0.10
41 <0.10 <0.10 <0.10
43 <0.10 <0.10 <0.10
45 <0.10 <0.10 <0.10
47 <0.10 <0.10 <0.10
49 0.22 0.03
0.30
0,08
0,10
51 0.22 0.19 0.38
53 0.26 0.12 0.40
The measured current had significant content of higher
harmonics in all operation modes. The value of current THD
in all three phases on 110 kV side is presented in Fig. 21. THD
of current flowing though power transformer reached 2.7%.
Maximal values of THD were observed during acceleration
and breaking periods.
0,5
1
1,5
2
2,5
3
11:06:03 11:07:03 11:08:03 11:09:03 11:10:03 11:11:03 11:12:03 11:13:03
THD
I(%
)
Vrijeme (sat:minuta:sekunda)
THD IL1 (%)
THD IL2 (%)
THD IL3 (%)
Fig. 21. Current total harmonic distortion on 110 kV side
D. Measurement of unbalance and flicker
Unbalance and flicker were measured on 110 kV level. The
measurements were performed during two drives, each lasting
7 minutes. The drives were regulated according to the
measuring requirements with frequent acceleration and
breaking periods.

For the period depicted in Fig. 3, the values of voltage (Fig.
22) and current unbalance (Fig. 23) were obtained at
connection point of overhead line 2. Unbalance is determined
as the percentage ratio of negative sequence voltage to positive
sequence voltage. Also, the values of short time flicker are
presented in Table IV.
0
0,5
1
1,5
2
2,5
3
3,5
4
11:06:03 11:07:03 11:08:03 11:09:03 11:10:03 11:11:03 11:12:03 11:13:03
u2
(%
)
Vrijeme (sat:minuta:sekunda)
Fig. 22. Voltage unbalance on 110 kV side
0
2
4
6
8
10
12
14
16
18
20
11:06:03 11:07:03 11:08:03 11:09:03 11:10:03 11:11:03 11:12:03 11:13:03
i2 (
%)
Vrijeme (sat:minuta:sekunda)
Fig. 23. Current unbalance on 110 kV side
Voltage and current unbalance at connection point of
electric railway to transmission network were lower than 3.8 %
and 19 % respectively. In order to determine the influence of
traction vehicle on unbalance in 110 kV network,
measurements should be performed during the one week
according to 15. 95 % of the ten minute mean r.m.s. values
of the negative phase sequences should be under 2%.
Short time flicker values per phases are given in Table III.
Considering the maximal permitted values defined in
standards, measured values of short time flicker were below
limits 16. TABLE III
SHORT TIME FLICKER VALUES ON 110 KV SIDE
Phase Pst
L1 0.1090
L2 0.1046
L3 0.1042
V. CONCLUSIONS
In this paper, the monitoring of power quality parameters at
the point of electric railway system connection to transmission
system was described. The operation of the electric traction
system 25 kV, 50 Hz supplied from traction substation 110/25
kV was presented. Impact of 3f traction motors on
transmission network by the measurements of power quality
parameters (THD, unbalance, flicker) was investigated.
Railway system with traction vehicle equipped with 3f
induction motor was developed in ATP. Waveforms of voltage
and supply current were analyzed. In the calculations the 41st
and 42nd
harmonics of power frequency was identified with the
highest magnitude while in the measurements 3rd
, 21st, and 53
rd
harmonic were significant. That mostly depends on the
converters characteristics.
Voltage and current waveforms were analyzed during three
operation modes of electric traction vehicle: acceleration,
constant drive and regenerative breaking. It is clear that 3f
traction induction motors have an impact on power quality
parameters especially during acceleration and breaking.
However, operation in energy recovery mode results with the
most significant impact.
The values of THD, unbalance and flicker obtained by
measurements were below limits prescribed in standards. From
the standpoint of power quality and energy consumption
efficiency, 3f induction motors in electric traction system have
many advantages and their use is increasing.
VI. ACKNOWLEDGMENT
The authors gratefully acknowledge the contributions of the
Croatian Transmission System Operator Ltd. and HŽ
Infrastruktura Ltd. for enabling the measurements.
VII. REFERENCES
1 S. Frey, "Railway electrification Systems & Engineering" White World
Publications, Delhi, 2012
2 I. Uglešić, M. Mandić, “Napajanje električne vuče”, Graphis, Zagreb,
2014.
3 Y. Osura, Y. Mochinaga, H. Nagasawa, “Railway Electric Power
Feeding Systems”, Japan Railway & Transport Review, Vol. 16, June
1998
4 R. C. Dugan, M. F. McGranaghan, S. Santoso, H. Wayne Beaty,
“Electric Power Systems Quality”, McGrow-Hill, Third edition, 2012
5 B. Milesevic, “Electromagnetic influence of electric railway system on
metallic structures”, Ph.D. dissertation, University of Zagreb, 2014
6 T. Achour, M. Pietrzak-David, M. Grandpierre, “Service Community of
an Induction Machine Railway Traction System”, XIX Int. conference
on Electric Machines - ICEM, Rome, 2010
7 International Telecommunication Union, “Directives concerning the
protection of telecommunication lines against harmful effects from
electric power and electrified railway lines” Vol. IV, Geneva, 1989
8 A. Zupan, A. Tomasovic Teklic, B. Filipovic-Grcic, “Modeling of 25 kV
Electric Railway System for Power Quality Studies”, EuroCon 2013,
Zagreb, 2013
9 W. Buchberger, Die neue schnellfahrende Mahrsystem –
Hochleistungslok 1216 der OBB, September 2004,
http://www.br146.de/SiemensPdf/Rh1216-oebb.pdf, January 2014
10 IEEE Standard Association, IEEE Recommendation Practice and
Requirements for Harmonic Control in Electric Power Systems, IEEE
Std 519TM-2014, New Yourk, 2014
11 N. Cho, “Allocation of Individual Harmonic Emission Limits in
Accordance with the Principles of IEC/TR 61000-3-6”, Ph.D.
dissertation, Georgia Institute of Technology, 2013
12 FAG Wheelset Bearings in the High-Power Locomotive “TAURUS”,
Examples of Application Engineering Publ. No. WL 07 510 EA,
http://www.schaeffler.com/remotemedien/media/_shared_media/08_me
dia_library/01_publications/schaeffler_2/publication/downloads_18/wl_
07510_de_en.pdf, January 2015
13 Siemens AG Transportation Systems, Electric locomotives,
https://www.swe.siemens.com/italy/web/IC/RL/Locomotive/Documents/
CP-Trasporti/PSS/ElectricLoco_en.pdf, January 2014
14 L. Liudvinavicius, L. P. Lingaitis, Energy Management Systems –
Management of Locomotive Tractive Energy Resources, InTech,

August, 2011
15 EN 50160:2010, Voltage characteristics of electricity supplied by public
electricity networks
16 M. H. Albadi, A. S. Hinai, A. H. Al-Badi, M. S. Al Riyami, S. M. Hinai,
R. S. Al Abri, “Measurements and Evaluation of Flicker in High
Voltage Networks”, Int. Conference on Renewable Energies and Power
Quality, Cordoba, Spain, April 2014