power quality analysis of hybrid renewable energy system · power quality analysis of hybrid...
TRANSCRIPT

Mosobi et al., Cogent Engineering (2015), 2: 1005000http://dx.doi.org/10.1080/23311916.2015.1005000
ELECTRICAL & ELECTRONIC ENGINEERING | RESEARCH ARTICLE
Power quality analysis of hybrid renewable energy systemRinchin W. Mosobi1*, Toko Chichi1 and Sarsing Gao1
Abstract: An hybrid renewable energy sources consisting of solar photovoltaic, wind energy system, and a microhydro system is proposed in this paper. This system is suitable for supplying electricity to isolated locations or remote villages far from the grid supply. The solar photovoltaic system is modeled with two power converters, the first one being a DC-DC converter along with an maximum power point tracking to achieve a regulated DC output voltage and the second one being a DC-AC converter to obtain AC output. The wind energy system is modeled with a wind-turbine prime mover with varying wind speed and fixed pitch angle to drive an self excited induction generator (SEIG). Owing to inherent drooping characteristics of the SEIG, a closed loop turbine input system is incorporated. The microhydro system is modeled with a constant input power to drive an SEIG. The three different sources are integrated through an AC bus and the proposed hybrid system is supplied to R, R-L, and induction motor loads. A static compensator is proposed to improve the load voltage and current profiles; it also mitigates the harmonic contents of the voltage and current. The static synchronous compensator is realized by means of a three-phase IGBT-based current-controlled voltage source inverter with a self-supporting DC bus. The complete system is modeled and simulated using Matlab/Simulink. The simulation results obtained illustrate the feasibility of the proposed system and are found to be satisfactory.
Subjects: Technology; Engineering & Technology; Electrical & Electronic Engineering; Electrical Engineering Communications
*Corresponding author: Rinchin W. Mosobi, Department of Electrical Engineering, North Eastern Regional Institute of Science and Technology, Nirjuli, Arunachal Pradesh 791 109, IndiaE-mail: [email protected]
Reviewing editor:Duc Pham, University of Birmingham, UK
Additional information is available at the end of the article
ABOUT THE AUTHORSarsing Gao is working as associate professor in the Department of Electrical Engineering at North Eastern Regional Institute of Science and Technology, Nirjuli, Arunachal Pradesh, India. He is a senior member of IEEE. His areas of interest are electrical machines, energy, distributed generation and power quality.
PUBLIC INTEREST STATEMENTThis paper details the possible ways of integrating renewable energy sources which may be called a hybrid renewable energy system (HRES). The recent research in the field of HRES shows the possibility of integrating either photovoltaic (PV)–wind or PV–microhydro or wind–microhydro as a hybrid system. In this paper, the possibility of integrating three renewable energy sources namely, PV–wind–microhydro power generation system is presented. It aims at supplying electricity to remote villages which are far from the grid supply. Since power quality is a major issue in such a system, the same is analyzed. MATLAB/Simulink is used for modeling the system and studying various performance characteristics of the system under different electric loads. A static synchronous compensator (STATCOM) is incorporated to improve the voltage profile at the load end thereby achieving an improved power quality of the supply.
Received: 04 July 2014Accepted: 16 December 2014Published: 30 January 2015
© 2015 The Author(s). This open access article is distributed under a Creative Commons Attribution (CC-BY) 4.0 license.
Page 1 of 15
Sarsing Gao
Page 2 of 15
Mosobi et al., Cogent Engineering (2015), 2: 1005000http://dx.doi.org/10.1080/23311916.2015.1005000
Keywords: Renewable energy system; maximum power point tracking; boost converter; solar photovoltaic; wind energy; self-excited induction generator; STATCOM; total harmonic distortion
1. IntroductionUnlike the conventional energy sources, the non-conventional energy sources are clean, reliable, and abundant in nature. The environmental degradation such as pollution, global warming, and greenhouse gas emissions which are caused by conventional sources of energy and accelerated by ever-growing industrial activities throughout the world is a concern for all. The current researches, therefore, lay emphasis on harnessing renewable energy sources (RES) for generating electricity to supply power especially, to rural consumers where grid connection is not available. For such locations, decentralized power generation using available dispersed RES is a better and workable solution. It is shown that power generation from combined RES such as wind and hydro could make a power system more cost-effective and environmental friendly (Nejad, Radzi, Kadir, & Hizam, 2012). A technological innovation, however, is needed to utilize these energy sources to an optimum level and to obtain greater efficiency. The combined system is likely to improve the generating capacity as well the reliability of the power supply. A feasibility study of solar–wind–diesel hybrid system is carried out in (Lipu, Uddin, & Miah, 2013) with promising results but for the increased cost of diesel oil and associated environmental pollution caused due to operation of diesel engine. Thus, the system considered may not be of much help. As reported, a wind–microhydro hybrid system when operated in grid connected mode using back-to-back connected power converters may improve the power system reliability (Goel, Singh, Murthy, & Kishore, 2011). The reliability and cost-effectiveness of integrated renewable energy system at remote and distant places is evaluated using optimization technique (Bansal, Khatod, & Saini, 2014) with fairly good results. However, it is found that not many works have been done on the power quality analysis of integrated renewable energy system using solar, wind, and microhydro energy sources. This system could be very successful especially in the sub-tropical region where there is sufficient rainfall.
A solar PV arrays with maximum power point tracking (MPPT) can generate electricity on large scale (Gera, Rai, Parvej, & Soni, 2013). With the development of large wind turbine generators and advancement in solid-state devices, wind energy system (WES) has become one of the most viable options of generating energy. However, due to the intermittent nature of wind speed, it calls for tracking of maximum power point of operation (Villalva, Gazoli, & Ruppert, 2009; Villalva, Gazoli, & Filho, 2009). Power generation from mini- or microhydro is a well-proven technology (International Renewable Energy Agency (IRENA), 2012).
In this paper, a HRES comprising photovoltaic (PV) system, wind-turbine generator system, and a microhydro system is proposed. The proposed system is a combination of 15 × 2 PV arrays with variable temperature and irradiance, a variable-speed wind-turbine coupled to self -excited induction generator (SEIG) and a constant power microhydro system coupled to SEIG. The performances of the hybrid system under various loads namely, induction motor (IM) load, resistive (R), and R-L load are presented. The reactive power compensation using static synchronous compensator (STATCOM) is presented. The STATCOM is observed to be working well thereby regulating the terminal voltage and reducing the harmonic contents of the system voltage and current.
2. Solar PV system
2.1. System descriptionA PV cell is basically a semiconductor diode whose p-n junction is exposed to light. When the irradi-ance falls on the surface of the solar cell, it absorbs photons and excites electron-hole pair separa-tion to produce electromotive force.
Page 3 of 15
Mosobi et al., Cogent Engineering (2015), 2: 1005000http://dx.doi.org/10.1080/23311916.2015.1005000
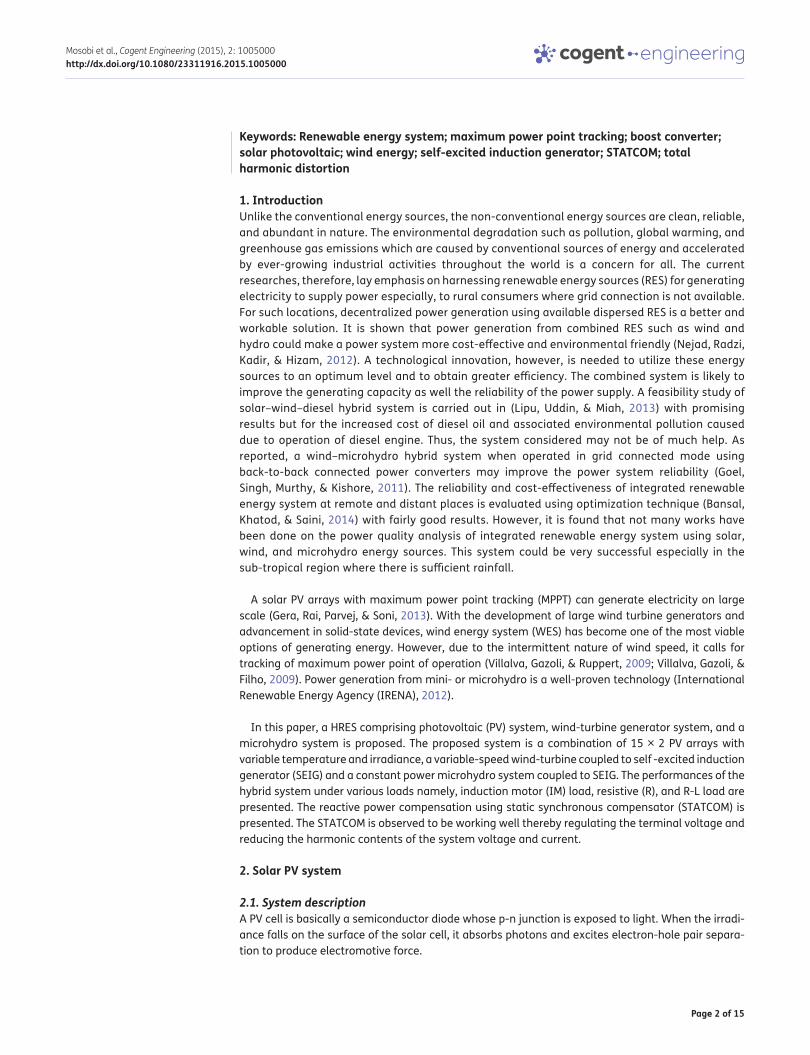
Figure 1 shows the equivalent circuit of the ideal PV cell including series (Rs) and parallel (Rp) resist-ances which actually represents the contact and junction resistances. From the basic equation of semiconductors, the I–V characteristics of the ideal PV cell may be written as
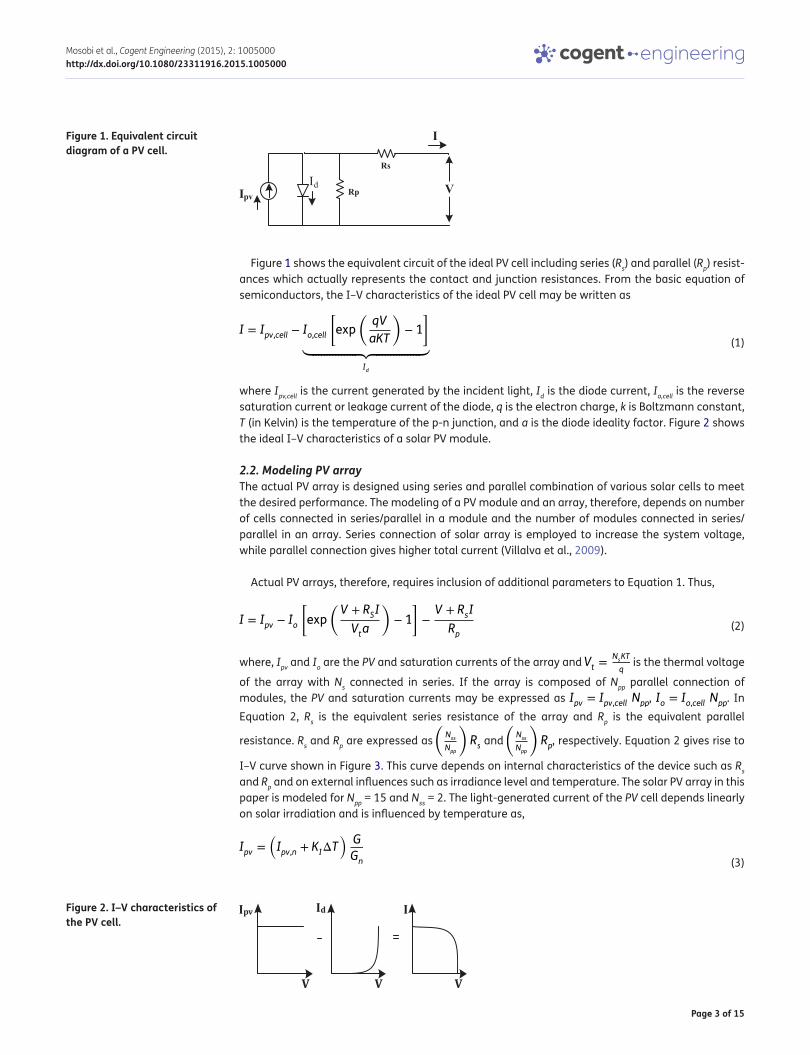
where Ipv,cell is the current generated by the incident light, Id is the diode current, Io,cell is the reverse saturation current or leakage current of the diode, q is the electron charge, k is Boltzmann constant, T (in Kelvin) is the temperature of the p-n junction, and a is the diode ideality factor. Figure 2 shows the ideal I–V characteristics of a solar PV module.
2.2. Modeling PV arrayThe actual PV array is designed using series and parallel combination of various solar cells to meet the desired performance. The modeling of a PV module and an array, therefore, depends on number of cells connected in series/parallel in a module and the number of modules connected in series/parallel in an array. Series connection of solar array is employed to increase the system voltage, while parallel connection gives higher total current (Villalva et al., 2009).
Actual PV arrays, therefore, requires inclusion of additional parameters to Equation 1. Thus,
where, Ipv and Io are the PV and saturation currents of the array and Vt =NsKT
q is the thermal voltage
of the array with Ns connected in series. If the array is composed of Npp parallel connection of modules, the PV and saturation currents may be expressed as Ipv = Ipv,cell Npp, Io = Io,cell Npp. In Equation 2, Rs is the equivalent series resistance of the array and Rp is the equivalent parallel
resistance. Rs and Rp are expressed as (
Nss
Npp
)Rs and
(Nss
Npp
)Rp, respectively. Equation 2 gives rise to
I–V curve shown in Figure 3. This curve depends on internal characteristics of the device such as Rs and Rp and on external influences such as irradiance level and temperature. The solar PV array in this paper is modeled for Npp = 15 and Nss = 2. The light-generated current of the PV cell depends linearly on solar irradiation and is influenced by temperature as,
(1)I = Ipv,cell − Io,cell
[exp
(qV
aKT
)− 1
]
⏟⏞⏞⏞⏞⏞⏞⏞⏞⏞⏞⏞⏞⏞⏞⏞⏟⏞⏞⏞⏞⏞⏞⏞⏞⏞⏞⏞⏞⏞⏞⏞⏟
Id
(2)I = Ipv − Io
[exp
(V + RSI
Vta
)− 1
]−
V + RsI
Rp
(3)Ipv
=
(Ipv,n
+ KIΔT
)G
Gn
Figure 1. Equivalent circuit diagram of a PV cell.
Figure 2. I–V characteristics of the PV cell.

Page 4 of 15
Mosobi et al., Cogent Engineering (2015), 2: 1005000http://dx.doi.org/10.1080/23311916.2015.1005000
where, Ipv,n is the light-generated current at the nominal condition, ∆T = T −Tn, where T and Tn are the actual and nominal temperatures, G (in W/m²) is the irradiance on the device surface and Gn is the nominal irradiance.
The diode saturation current Io and its dependence on the temperature may be expressed as
where, KI is current coefficient, KV is voltage coefficient, Isc,n is short circuit current at nominal condition, Voc,n is open circuit voltage at nominal condition, a is ideality factor, and Vt is thermal voltage.
Figures 4 and 5 show the simulated values of I–V and P–V characteristics of the PV array considered in this work. From Figure 4, it is observed that with decreasing irradiance, there is a negligible change in the maximum output voltage and there is a marginal decrement in output current and a noticeable drop in the maximum power point (MPP).
(4)Io=
Isc,n
+ KIΔT
exp(Voc,n
+KVΔT
aVt
)− 1
Figure 4. (a) I–V and (b) P–V curve of a PV array with variable irradiance.
Figure 3. I–V characteristics of the PV array.

Page 5 of 15
Mosobi et al., Cogent Engineering (2015), 2: 1005000http://dx.doi.org/10.1080/23311916.2015.1005000
Figure 5 shows that for a fixed irradiance value as the cell temperature decreases, a small decrement in the output current occurs with an increment in output voltage and corresponding increase in MPP.
Table 1 shows the parameters of the PV array obtained from datasheet of Kyocera KC200GT at standard test condition (STC) of 25 °C and 1,000 W/m². The KC Series solar modules of Kyocera have multicrystalline silicon solar cell with an efficiency of over 16%. The same PV modules have been considered in this study (Kyocera KC200GT, xxxx).
Figure 5. (a) P–V and (b) I–V curve of a PV array with variable temperature.
Table 1. Parameters of KC200GT array at 25 °C, 1000 W/m2 (Kyocera KC200GT, xxxx)Parameters KC200GTVoc 32.9 V
Isc 8.21 A
KV −0.1230 V/K
KI 0.0032 A/K
Pmax 200.143 W
Rp 415.405 Ω
Rs 0.221 Ω
a 1.3
Ns 54
Page 6 of 15
Mosobi et al., Cogent Engineering (2015), 2: 1005000http://dx.doi.org/10.1080/23311916.2015.1005000
where, Voc = open circuit voltage, Isc = short circuit current, KV = temperature coefficient of Voc, KI = temperature coefficient of Isc, Pmax = maximum power, Rs = series resistance, Rp = parallel resistance, a = ideality factor and Ns = number of cells in series. Combining Equations 3 and 4, a new expression is obtained as
where, Ipv is PV current of the array, Io is diode saturation current, a is ideality factor, Vt is thermal voltage, I is output current and V is output voltage.
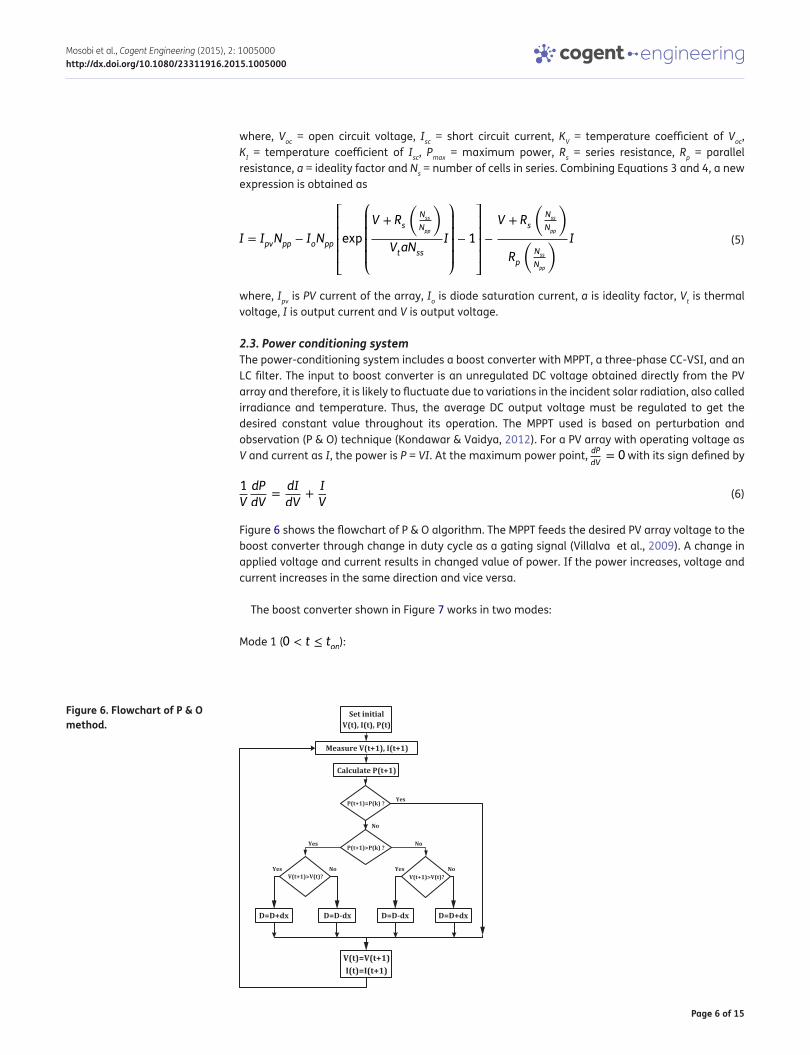
2.3. Power conditioning systemThe power-conditioning system includes a boost converter with MPPT, a three-phase CC-VSI, and an LC filter. The input to boost converter is an unregulated DC voltage obtained directly from the PV array and therefore, it is likely to fluctuate due to variations in the incident solar radiation, also called irradiance and temperature. Thus, the average DC output voltage must be regulated to get the desired constant value throughout its operation. The MPPT used is based on perturbation and observation (P & O) technique (Kondawar & Vaidya, 2012). For a PV array with operating voltage as V and current as I, the power is P = VI. At the maximum power point, dP
dV= 0 with its sign defined by
Figure 6 shows the flowchart of P & O algorithm. The MPPT feeds the desired PV array voltage to the boost converter through change in duty cycle as a gating signal (Villalva et al., 2009). A change in applied voltage and current results in changed value of power. If the power increases, voltage and current increases in the same direction and vice versa.
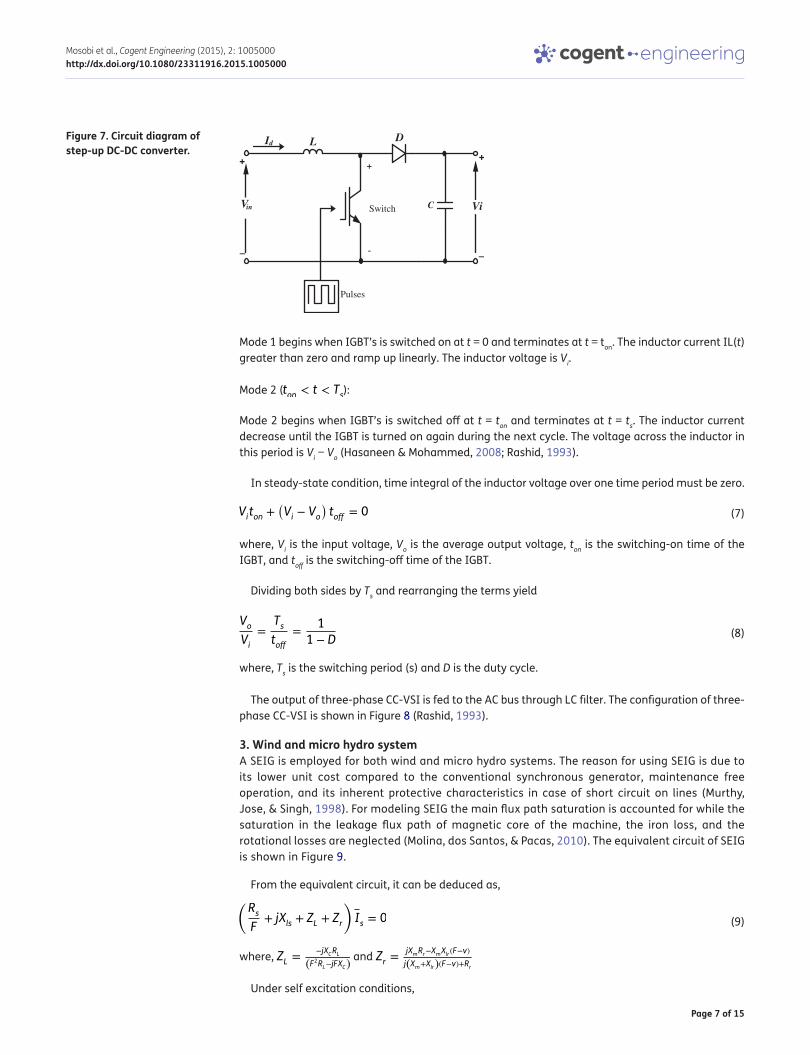
The boost converter shown in Figure 7 works in two modes:
Mode 1 (0 < t ≤ ton
):
(5)I = IpvNpp − IoNpp
⎡⎢⎢⎢⎢⎣exp
⎛⎜⎜⎜⎜⎝
V + Rs
Nss
Npp
VtaNssI
⎞⎟⎟⎟⎟⎠− 1
⎤⎥⎥⎥⎥⎦−
V + Rs
Nss
Npp
Rp
Nss
Npp
I
(6)1
V
dP
dV=
dI
dV+
I
V
Figure 6. Flowchart of P & O method.
Page 7 of 15
Mosobi et al., Cogent Engineering (2015), 2: 1005000http://dx.doi.org/10.1080/23311916.2015.1005000
Mode 1 begins when IGBT’s is switched on at t = 0 and terminates at t = ton. The inductor current IL(t) greater than zero and ramp up linearly. The inductor voltage is Vi.
Mode 2 (ton < t < Ts):
Mode 2 begins when IGBT’s is switched off at t = ton and terminates at t = ts. The inductor current decrease until the IGBT is turned on again during the next cycle. The voltage across the inductor in this period is Vi − Vo (Hasaneen & Mohammed, 2008; Rashid, 1993).
In steady-state condition, time integral of the inductor voltage over one time period must be zero.
where, Vi is the input voltage, Vo is the average output voltage, ton is the switching-on time of the IGBT, and toff is the switching-off time of the IGBT.
Dividing both sides by Ts and rearranging the terms yield
where, Ts is the switching period (s) and D is the duty cycle.
The output of three-phase CC-VSI is fed to the AC bus through LC filter. The configuration of three-phase CC-VSI is shown in Figure 8 (Rashid, 1993).
3. Wind and micro hydro systemA SEIG is employed for both wind and micro hydro systems. The reason for using SEIG is due to its lower unit cost compared to the conventional synchronous generator, maintenance free operation, and its inherent protective characteristics in case of short circuit on lines (Murthy, Jose, & Singh, 1998). For modeling SEIG the main flux path saturation is accounted for while the saturation in the leakage flux path of magnetic core of the machine, the iron loss, and the rotational losses are neglected (Molina, dos Santos, & Pacas, 2010). The equivalent circuit of SEIG is shown in Figure 9.
From the equivalent circuit, it can be deduced as,
where, ZL =−jXCRL
(F2RL−jFXC)
and Zr =jXmRr−XmXlr (F−v)
j(Xm+Xlr)(F−v)+Rr
Under self excitation conditions,
(7)Viton +(Vi − Vo
)toff = 0
(8)VoVi
=
Tstoff
=
1
1 − D
(9)
(RsF
+ jXls + ZL + Zr
)Is = 0
Figure 7. Circuit diagram of step-up DC-DC converter.
+
_
+
-
+
LIdD
Switch CVin Vi
_
Pulses

Page 8 of 15
Mosobi et al., Cogent Engineering (2015), 2: 1005000http://dx.doi.org/10.1080/23311916.2015.1005000
where, Vg is the air-gap voltage, Vph is the phase voltage, v is the speed, and F is the frequency.
For any speed v, Equation 10 may be solved for Xm and F using Newton–Raphson iteration method which is ideal for finding solution of non-linear equations or any other known methods of solving non-linear equations with the starting values being taken as the unsaturated value of Xm, and F equal to v. Using these values of Xm and F, the total performance of the machine can be evaluated in conjunction with the measured variation of Xm with Vg/F for the generator being considered.
In wind energy conversion system, a variable speed variable frequency scheme is proposed due to its ability of efficient energy conversion. The system is operated over a wide range of speed without employing pitch control mechanism for the wind turbine. Voltage build-up is achieved by connecting excitation capacitors across the stator terminals. According to wind speed cube law, the power, P developed by the wind turbine of blade diameter, d at a wind speed, s is given by (Raina & Malik, 1983).
where, ρ is the density of air and Cp is the power coefficient which is the ratio of shaft power to wind power.
The microhydro system is modeled with a hydro turbine driven SEIG. The input to the turbine is from flowing stream with proper civil works in order to maintain constant flow so that the input power to the hydro turbine remains constant. Finally, the AC output from wind and microhydro systems is integrated with the PV system and the combination is brought out to a common AC bus.
4. Static synchronous compensator (STATCOM)The proposed STATCOM is a three-legged IGBT based CC-VSI with a DC link capacitor and an AC filtering inductances (Lf , Rf ). The DC bus capacitor is used to offer self-support to the DC bus of the compensator. The fluctuation in capacitance voltage is due to power consumed by the devices in the VSI and filter resistance. It is essential to find out the real and reactive power requirement of the hybrid system to maintain balanced voltages and current at the load side. First, the fluctuation in
(10)RsF
+ jXls + ZL + Zr = 0
(11)P =
1
8 d2Cp s
3
Figure 9. Equivalent circuit of CAG.
Figure 8. Configuration of three-phase VSI with LC filter.
a
b
c
Q5
Q2
D1 D3 D5
D6 D2
AC Bus
FILTER
Vdc
+
-
Q1 Q3
Q4 Q6
D4
L
L
L
C C C

Page 9 of 15
Mosobi et al., Cogent Engineering (2015), 2: 1005000http://dx.doi.org/10.1080/23311916.2015.1005000
the DC link capacitor voltage is monitored. This is an index of the imbalance in real power or indirectly it is an indication of direct axis component of current, Id. Next, the peak value of the line-to-line voltage from the integrated system is computed. This is compared with the reference or expected value. The difference between these two quantities is an indication of the reactive power required by the system or indirectly this will be the amount of quadrature current, Iq to be supplied by the system.
These two axes reference currents namely Id and Iq are converted into three-phase form by Inverse Park’s transformation. The cos(ωt) and sin(ωt) terms needed for Park’s transformation are derived with the help of a phase locked loop which is fed with unit templates of line voltages from the source. The three-phase reference currents thus obtained are compared with the actual currents from the integrated system in a hysteresis current controller to yield the firing signals for the six devices in the STATCOM. Figure 10 shows the schematic diagram of the CC-VSI unit (Gao, Bhuvaneswari, Murthy, & Kalla, 2014; Goel et al., 2011).
Inverse Park’s transformation (dq0-abc transformation) is represented as
5. Proposed integrated system and simulation resultsThe proposed scheme of integration of solar, wind, and microhydro is modeled and simulated in Matlab/Simulink environment. The three different RES are connected to a common AC bus on to which varying loads are connected (Mohammed, 2006; Sharaf & El-Sayed, 2009). The power quality issues (Anees, 2012) like the system voltage and current regulation and harmonic reductions have been analyzed with the help of a STATCOM.
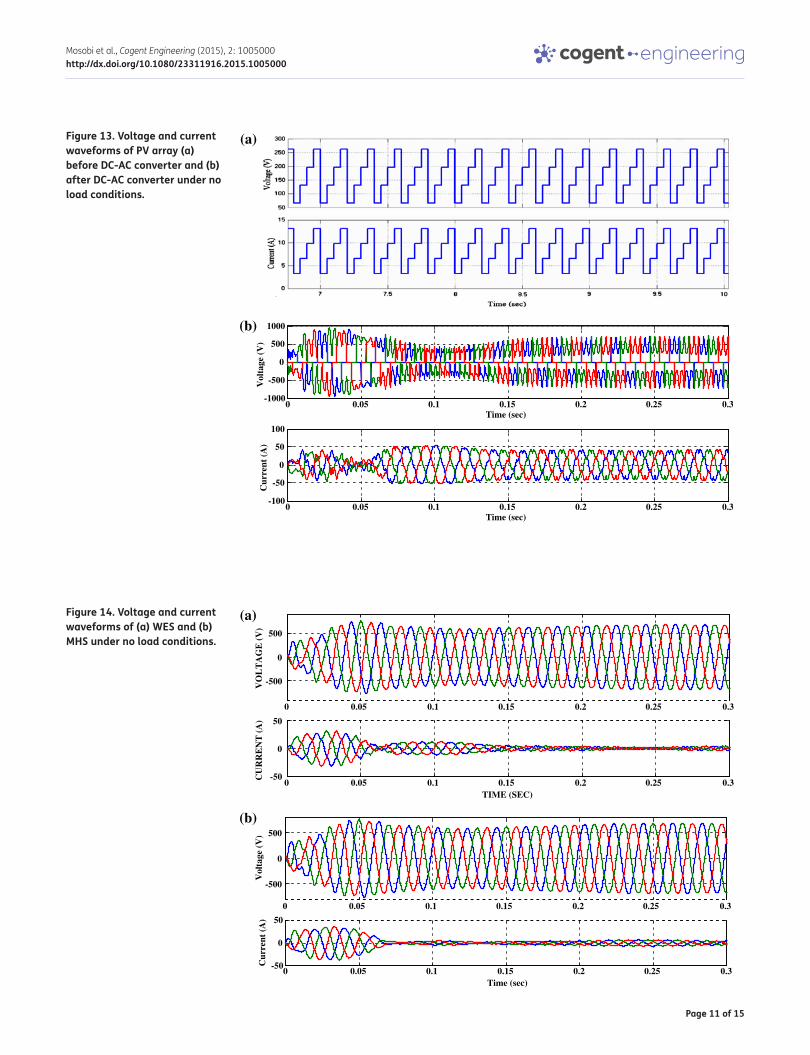
Figure 11 shows the hybrid system proposed in this study. The simulink model of the system is shown in Figure 12. Simulation is carried out initially with the three different sources independently under no load conditions and eventually with the hybrid system through three-phase AC bus connected to three-phase IM, R, and RL loads. The results are presented through Figures 13–16.
(12)Idq0 = TIabc =
2
3
⎡⎢⎢⎢⎢⎣
cos (t) cost − 2
3
cos
t + 2
3
sin (t) sint − 2
3
sin
t + 2
3
√2
2
√2
2
√2
2
⎤⎥⎥⎥⎥⎦
⎡⎢⎢⎣
IaIbIc
⎤⎥⎥⎦
Figure 10. Schematic diagram of current-controlled voltage source inverter (CC-VSI). Unit Voltage
Template Generator
Phase Lock Loop (PLL)
dqo
abc
PI Controller
PI Controller
Vdc
Vdc(ref)
Vt (ref)
VabVbcVca
Iq
Id
Current Regulator
Iabc
Iabc (ref)
Pulses to VSI
Voltage Source Inverter (VSI)
+-
+
-
Vt

Page 10 of 15
Mosobi et al., Cogent Engineering (2015), 2: 1005000http://dx.doi.org/10.1080/23311916.2015.1005000
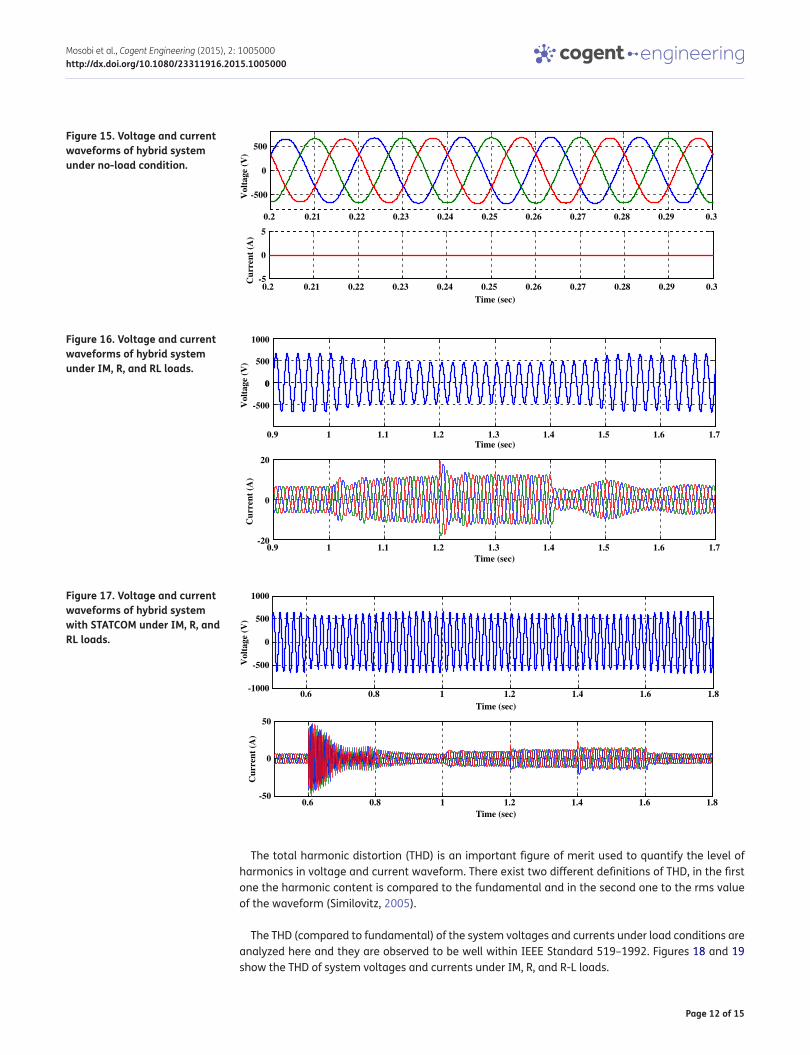
It is clearly observed that the three different RES generates little over rated voltage of 459 V (rms) or 650 V (peak) under no load conditions. The frequency is maintained at 50 Hz. As seen from Figure 16, on connecting loads namely, IM, R, and R-L loads at 1.0, 1.2 and 1.4 s, respectively, there is a voltage drop in the system. The loads are switched out at 1.6 s and the system rated voltage is regained after sometime. A STATCOM is, therefore, connected to the system at 0.6 s and the loads are connected at the same instants. It is observed that the system voltage and frequency is maintained at its rated value; in this case the voltage is 415 V (rms) or 586 V (peak). Figure 17 shows the voltage and current waveforms of the integrated system with STATCOM. It is observed that the AC bus voltage is regulated with the use of STATCOM though a small amount of transient current occurs at the time of switching in the STATCOM. The overall performance of the system is observed to have been improved.
Figure 11. Model of the proposed standalone hybrid solar, wind, and microhydro system feeding three-phase loads.
Boost Converter Inverter
DC-DC DC-AC
Blade
AC BUS
IG
PV Array
Hydro Turbine
River
PHOTOVOLTAIC SYSTEM
MICRO HYDRO SYSTEM
WIND ENERGY CONVERSION SYSTEM
LOAD 1
LOAD 2
LOAD 3
STATCOM
LC Filter
FilterAC-DC-AC Conversion
Filter
Figure 12. Simulink model of hybrid PV, wind, and microhydro system.
Page 11 of 15
Mosobi et al., Cogent Engineering (2015), 2: 1005000http://dx.doi.org/10.1080/23311916.2015.1005000
Figure 13. Voltage and current waveforms of PV array (a) before DC-AC converter and (b) after DC-AC converter under no load conditions.
0 0.05 0.1 0.15 0.2 0.25 0.3-1000
-500
0
500
1000
Time (sec)
Vol
tage
(V
)
0 0.05 0.1 0.15 0.2 0.25 0.3-100
-50
0
50
100
Time (sec)
Cur
rent
(A
)
(a)
(b)
Figure 14. Voltage and current waveforms of (a) WES and (b) MHS under no load conditions.
0 0.05 0.1 0.15 0.2 0.25 0.3
-500
0
500
VO
LT
AG
E (
V)
0 0.05 0.1 0.15 0.2 0.25 0.3-50
0
50
TIME (SEC)
CU
RR
EN
T (
A)
0 0.05 0.1 0.15 0.2 0.25 0.3
-500
0
500
Vol
tage
(V
)
0 0.05 0.1 0.15 0.2 0.25 0.3-50
0
50
Time (sec)
Cur
rent
(A
)
(a)
(b)
Page 12 of 15
Mosobi et al., Cogent Engineering (2015), 2: 1005000http://dx.doi.org/10.1080/23311916.2015.1005000
The total harmonic distortion (THD) is an important figure of merit used to quantify the level of harmonics in voltage and current waveform. There exist two different definitions of THD, in the first one the harmonic content is compared to the fundamental and in the second one to the rms value of the waveform (Similovitz, 2005).
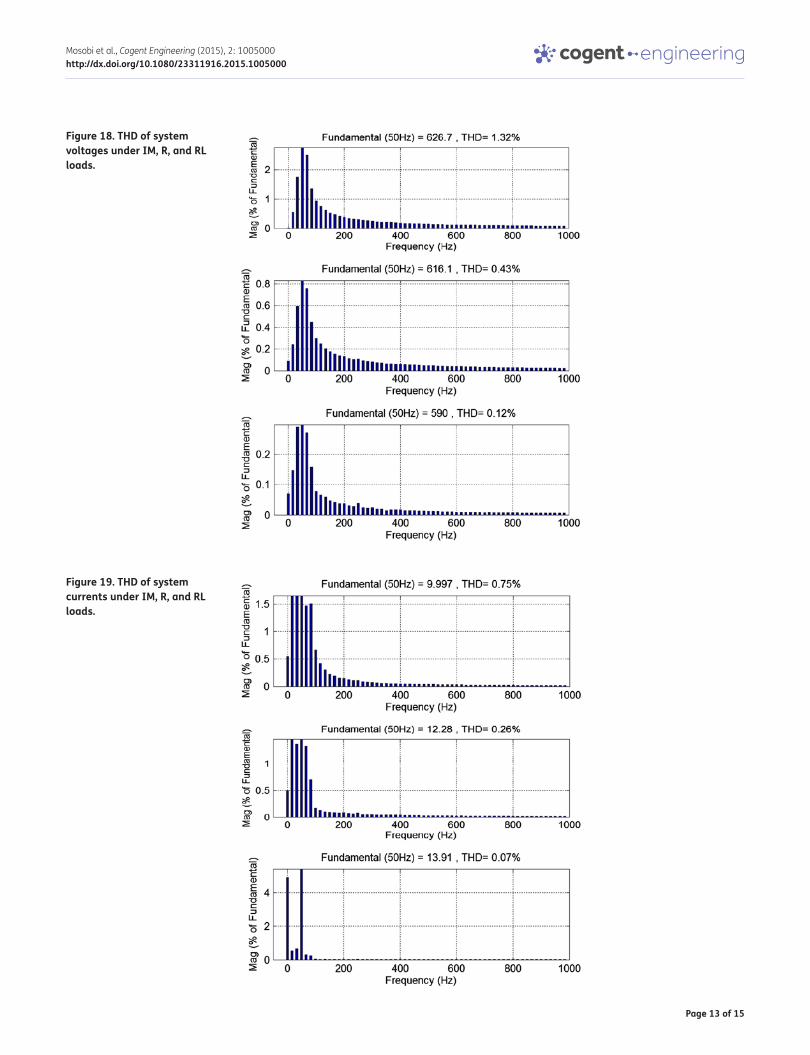
The THD (compared to fundamental) of the system voltages and currents under load conditions are analyzed here and they are observed to be well within IEEE Standard 519–1992. Figures 18 and 19 show the THD of system voltages and currents under IM, R, and R-L loads.
Figure 15. Voltage and current waveforms of hybrid system under no-load condition.
0.2 0.21 0.22 0.23 0.24 0.25 0.26 0.27 0.28 0.29 0.3
-500
0
500
Vol
tage
(V
)
0.2 0.21 0.22 0.23 0.24 0.25 0.26 0.27 0.28 0.29 0.3-5
0
5
Time (sec)
Cur
rent
(A
)
Figure 16. Voltage and current waveforms of hybrid system under IM, R, and RL loads.
0.9 1 1.1 1.2 1.3 1.4 1.5 1.6 1.7
-500
0
500
1000
0
Time (sec)
Vol
tage
(V
)
0.9 1 1.1 1.2 1.3 1.4 1.5 1.6 1.7-20
0
20
Time (sec)
Cur
rent
(A
)
Figure 17. Voltage and current waveforms of hybrid system with STATCOM under IM, R, and RL loads.
Vol
tage
(V
)
0.6 0.8 1 1.2 1.4 1.6 1.8-1000
-500
0
500
1000
Time (sec)
0.6 0.8 1 1.2 1.4 1.6 1.8-50
0
50
Time (sec)
Cur
rent
(A
)
Page 13 of 15
Mosobi et al., Cogent Engineering (2015), 2: 1005000http://dx.doi.org/10.1080/23311916.2015.1005000
Figure 18. THD of system voltages under IM, R, and RL loads.
Figure 19. THD of system currents under IM, R, and RL loads.

Page 14 of 15
Mosobi et al., Cogent Engineering (2015), 2: 1005000http://dx.doi.org/10.1080/23311916.2015.1005000
6. ConclusionsIn this work, an attempt has been made to investigate in detail the possibility of HRES as one of the most effective ways of decentralized power generation. Besides increasing the generating capacity of the energy sources, the scheme is envisaged to greatly liberate the rural populace of the perennial energy demands. With the energy sources connected together, the reliability of the power system increases. The power quality aspects are studied and with the use of STATCOM the voltage and current regulations improves. The system voltage is well maintained at 415 V (rms) under different load conditions. The harmonic content of the system voltages and currents is greatly reduced when loads are connected. The THD of the voltages and currents are of the order of 0.1–1.3% and 0.07–0.7% for IM, R, and RL loads, respectively. The voltage and frequency has been maintained constant under different dynamic conditions. The integrated system along with the addition of STATCOM can be seen as a viable option for supplying electricity to far flung areas.
FundingThe authors received no direct funding for this research.
Author detailsRinchin W. Mosobi1
E-mail: [email protected] Chichi1
E-mail: [email protected] Gao1
E-mail: [email protected] Department of Electrical Engineering, North Eastern Regional
Institute of Science and Technology, Nirjuli, Arunachal Pradesh 791 109, India.
Citation informationCite this article as: Power quality analysis of hybrid renewable energy system, Rinchin W. Mosobi, Toko Chichi & Sarsing Gao, Cogent Engineering (2015), 2: 1005000.
ReferencesAnees, A. S. (2012). Grid integration of renewable energy
sources: Challenges, issues and possible solutions. In 5th India International Conference on Power Electronics (IICPE) (pp. 1–6). Delhi: IEEE.
Bansal, M., Khatod, D. K., & Saini, R. P. (2014, February). Modeling and optimization of integrated renewable energy system for a rural site. In International Conference on Reliability, Optimization and Information Technology (ICROIT) (pp. 25–28). Faridabad. http://dx.doi.org/10.1109/ICROIT.2014.6798289
Gao, S., Bhuvaneswari, G., Murthy, S. S., & Kalla, U. K. (2014, March). Efficient voltage regulation scheme for three-phase self-excited induction generator feeding single-phase load in remote locations. IET Renewable Power Generation, 8, 100–108. http://dx.doi.org/10.1049/iet-rpg.2012.0204
Gera, R. K., Rai, H. M., Parvej, Y., & Soni, H. (2013, January–June). Renewable energy scenario in India: Opportunities and challenges. Indian Journal of Electrical And Biomedical Engineering, 1, 10–16.
Goel, P. K., Singh, B., Murthy, S. S., & Kishore, N. (2011, April). Isolated wind-hydro hybrid system using cage generator and battery storage. IEEE Transactions on Industrial Electronics, 58, 1141–1153.
Hasaneen, B. M., & Mohammed, A. A. E. (2008, March). Design and simulation of DC/DC boost converter. In IEEE Power System Conference, MEPCON (pp. 335–340). Aswan.
International Renewable Energy Agency (IRENA). (2012, June). Renewable energy technologies: Cost analysis of hydropower, 1(3/5). Retrieved from www.irena.org/
Kondawar, S. S., & Vaidya, U. B. (2012, August). A comparison of two MPPT techniques for pv system in Matlab simulink.
International Journal of Engineering Research and Development, 2, 73–79.
Kyocera KC200GT. (xxxx). Solar photovoltaic power modules datasheet. High efficiency multi crystal photo voltaic module.
Lipu, M. S. H., Uddin, M. S., & Miah, M. A. R. (2013). A feasibility study of solar-wind-diesel hybrid system in rural and remote areas of Bangladesh. International Journal on Renewable Energy Resource, 3, 895–900.
Mohammed, A. A. E. (2006). Study of interconnecting issues of photovoltaic/wind hybrid system with electric utility using artificial intelligence (PhD Thesis). Faculty of Engineering, Electrical Engineering Department, Minia University, Minya.
Molina, M. G., dos Santos, E. C., & Pacas, M. (2010). Improved power conditioning system for grid integration of photovoltaic solar energy conversion systems, In Transmission and Distribution Conference and Exposition in Latin America (pp. 163–170). Sao Paulo. http://dx.doi.org/10.1109/TDC-LA.2010.5762877
Murthy, S. S., Jose, R., & Singh, B. (1998). Experience in the development of microhydel grid independent power generation scheme using induction generators for Indian conditions. In IEEE Conference on Global Connectivity in Energy, Computer, Communication and Control, (Vol. 2, pp. 461–465).
Nejad, M. F., Radzi, M. A. M., Kadir, M. Z. A. A., & Hizam, H. (2012, December). Hybrid renewable energy systems in remote areas of equatorial countries. In IEEE Student Conference on Research & Development (SCOReD) (pp. 11–16). Pulau Pinang.
Raina, G., & Malik, O. P. (1983, December). Wind energy conversion using a self-excited induction generator. IEEE Transactions on Power Apparatus and System, PAS-102, 3933–3936.
Rashid, M. H. (1993). Power electronics: Circuits, devices and applications (2nd ed.). Englewood Cliffs, NJ: Prentice-Hall.
Sharaf, A. M., & El-Sayed, M. A. H. (2009). A novel hybrid integrated wind-pv micro co-generation energy scheme for village electricity. In Electric Machine and Drives Conference IEMDC (pp. 1244–1249).
Similovitz, Doron (2005, January). On the defination of total harmonic distortion and its effect on measurement interpretation. IEEE Transaction on Power Delivery, 20, 526–528.
Villalva, M. G., Gazoli, J. R., & Filho, E. (2009). Comprehensive approach to modeling and simulation of photovoltaic arrays. IEEE Transactions on Power Electronics, 24, 1198–1208. http://dx.doi.org/10.1109/TPEL.2009.2013862
Villalva, M. G., Gazoli, J. R., & Ruppert, E. (2009). Modelling and circuit -based simulation of photovoltaic arrays (pp. 1244–1245). Brazil: Power Electronics Conference.

Page 15 of 15
Mosobi et al., Cogent Engineering (2015), 2: 1005000http://dx.doi.org/10.1080/23311916.2015.1005000
© 2015 The Author(s). This open access article is distributed under a Creative Commons Attribution (CC-BY) 4.0 license.You are free to: Share — copy and redistribute the material in any medium or format Adapt — remix, transform, and build upon the material for any purpose, even commercially.The licensor cannot revoke these freedoms as long as you follow the license terms.
Under the following terms:Attribution — You must give appropriate credit, provide a link to the license, and indicate if changes were made. You may do so in any reasonable manner, but not in any way that suggests the licensor endorses you or your use. No additional restrictions You may not apply legal terms or technological measures that legally restrict others from doing anything the license permits.
Cogent Engineering (ISSN: 2331-1916) is published by Cogent OA, part of Taylor & Francis Group. Publishing with Cogent OA ensures:• Immediate, universal access to your article on publication• High visibility and discoverability via the Cogent OA website as well as Taylor & Francis Online• Download and citation statistics for your article• Rapid online publication• Input from, and dialog with, expert editors and editorial boards• Retention of full copyright of your article• Guaranteed legacy preservation of your article• Discounts and waivers for authors in developing regionsSubmit your manuscript to a Cogent OA journal at www.CogentOA.com
Appendix
PV arrayTemperature (K)Solar irradiance (W/m2)
25 + 273.15, 30 + 273.15, 35 + 273.15, 40 + 273.15200, 400, 600, 800
Boost converter L = 1 mH, C = 50 μF
LC filter L = 10 μH, C = 350 μF
Wind speed (m/s2) Wind turbine
11, 10, 12, 13, 9, 11, 14Pn = 1.5e 6, β = 0°, λ = 8.1, Cp = 0.48, base power = 1.67e 6 VA, base wind speed = 12 m/s
SEIG Pn = 7.5 VA, V(L-L) = 415 V, Rs = 0.9 Ω, Rr′ = 0.66 Ω, Lls = 0.00457 H, Llr
′ = 0.00457 H, J = 0.1384 kgm2, F = 0 Nm, p = 2