power quality & reliability seminar © 2018 electric power research institute, inc. all rights...
TRANSCRIPT
© 2018 Electric Power Research Institute, Inc. All rights reserved.
POWER QUALITY &
RELIABILITY SEMINAR
10:30 a.m. - 11:30 a.m.:
The Electrical Environment: Common Levels
of Power Quality
Noon-1p.m.: Case Studies
Alden Wright, PE, CEM, CP EnMS
EPRI Industrial PQ and EE Group

2© 2018 Electric Power Research Institute, Inc. All rights reserved.
The Electrical Environment: Common Levels of Power
Quality
▪What level of PQ performance is “normal” for various power
systems? How does the power system performance vary by
voltage class?
▪This session will cover:
– Benchmarking studies and look at how to apply the results of
the study to better understand common Power Quality levels
– Relevant power quality standards and the need for cooperation
between the utility and the end user to solve power quality
issues
– Susceptibilities of various commercial and industrial equipment
to voltage sags and various solution approaches will be
presented including embedded, control, machine, process, and
plant level.
– Example Mitigation Solutions

3© 2018 Electric Power Research Institute, Inc. All rights reserved.
Power Quality
(IEEE 1159 Defines)▪Transients
– Impulse
– Oscillatory
– Irregular
▪Short Duration Variations
– Sags/Swells
– Interruptions
▪Long Duration Variations
– Under voltage
– Overvoltage
– Interruptions
▪Unbalance
▪Waveform Distortion
– Harmonics
▪Voltage Fluctuations

4© 2018 Electric Power Research Institute, Inc. All rights reserved.
Typical Duration:
Typical Magnitude:
> 1 Minute
0.0 pu
pu = per unit (1 pu = nominal)
Sustained Interruption (Outage)
HIOKI 3196 Event Data 06/10 15:19:22.802 HIOKI 3196 Event Data 06/10 15:21:25.919
Steady-State/Event

5© 2018 Electric Power Research Institute, Inc. All rights reserved.
Typical Duration:
Typical Magnitude:
0.5 cycles – 3 s (180 cyc.)
< 0.1 puApril 22, 1994 at 09:32:13 PQNode LocalSAMPLE03
Phase C Voltage
RMS Variation
Trigger
0 1 2 3
0
20
40
60
80
100
120
Time (Seconds)
% V
olts
0 25 50 75 100 125 150 175 200
-100-75-50-25
0255075
100
Time (mSeconds)
Duration
5.167 Sec
Min 0.141
Ave 5.273
Max 100.5
Ref Cycle
26553
% V
olts
Momentary Interruption
HIOKI 3196 Event Data, 3 cycle Interruption
Events

6© 2018 Electric Power Research Institute, Inc. All rights reserved.
Typical Duration Typical Magnitude
Instantaneous 0.5 – 30 cycles 0.1 - 0.9 pu
Momentary 30 cycles - 3 s 0.1 - 0.9 pu
Temporary 3 s - 1 min 0.1 - 0.9 pu
Voltage Sag Common Depths and Durations
HIOKI 3196 Event Data
3 cycle, 0.5 pu
HIOKI 3196 Event Data
3 cycle, 0.8 pu
Events

7© 2018 Electric Power Research Institute, Inc. All rights reserved.
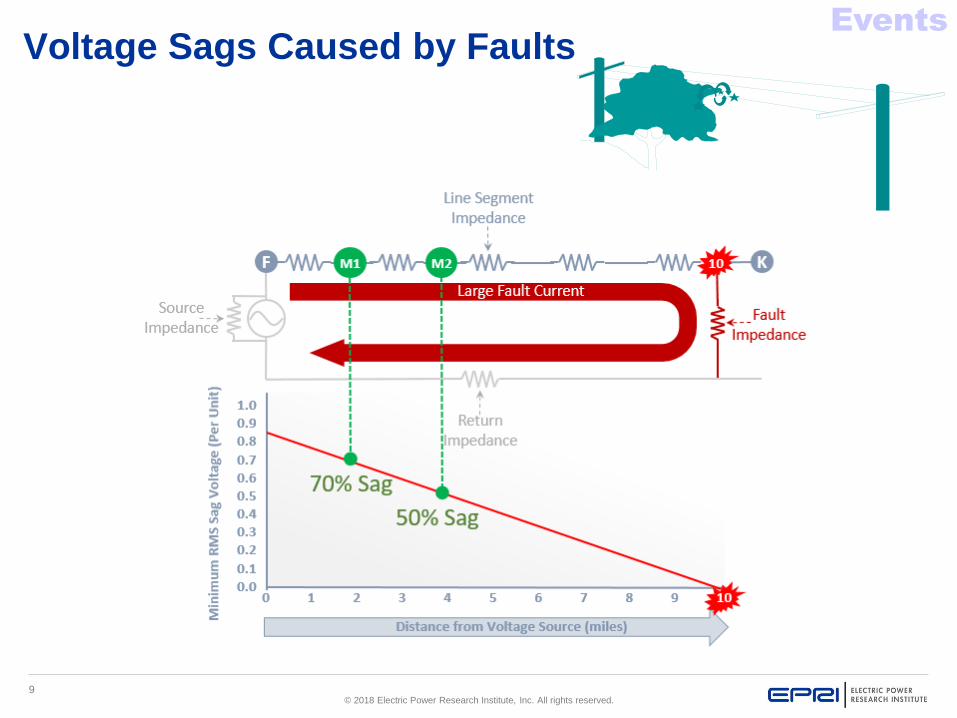
• Line-to-Ground/Line-to-Line Faults Occur on the Utility System due to:
- Weather
- Trees
- Public Interference
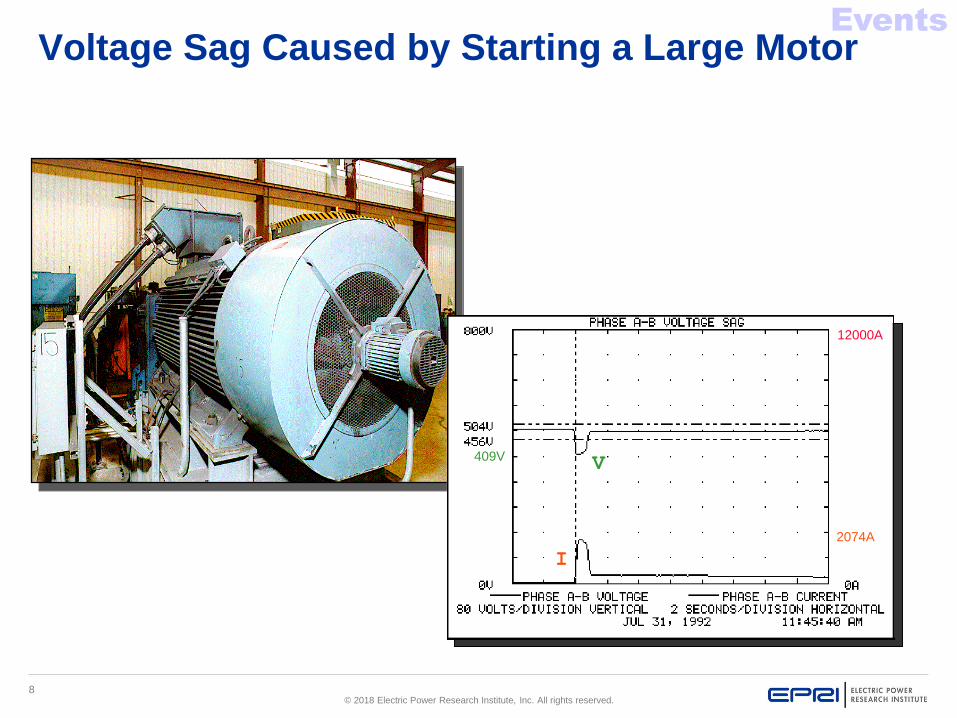
• Internally induced plant events (starting of large high inrush load)
• Although the utility can reduce the number of events (tree trimming, root cause analysis), it is impossible to eliminate all voltage Sags.
Why Voltage Sags Occur...
8© 2018 Electric Power Research Institute, Inc. All rights reserved.
I
V409V
2074A
12000A
Voltage Sag Caused by Starting a Large MotorEvents
9© 2018 Electric Power Research Institute, Inc. All rights reserved.
Voltage Sags Caused by FaultsEvents
10© 2018 Electric Power Research Institute, Inc. All rights reserved.
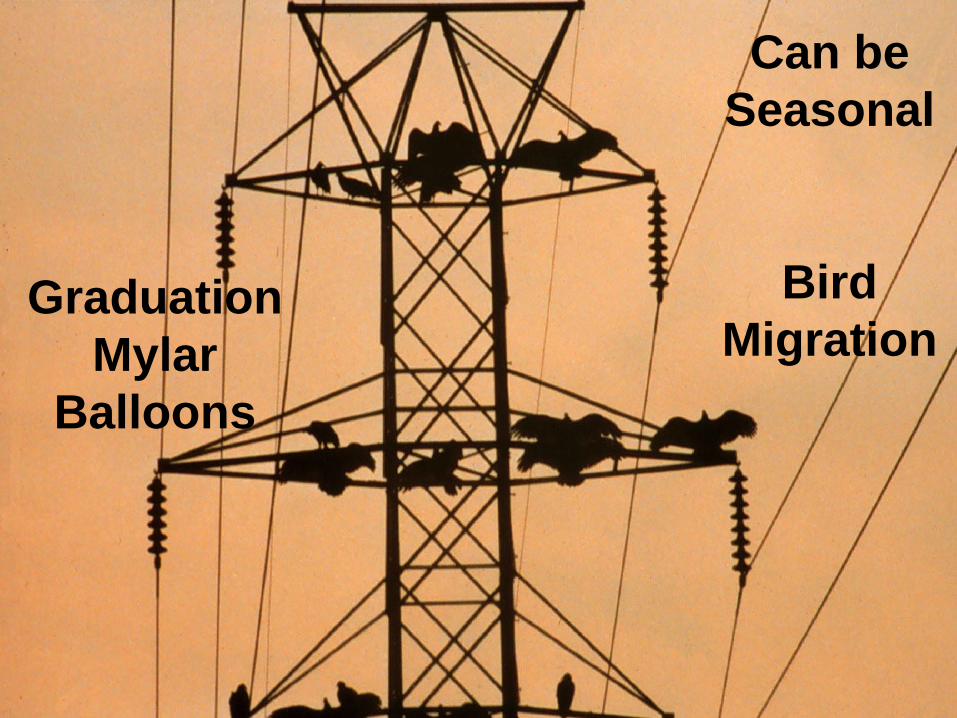
Can be
Seasonal
Bird
MigrationGraduation
Mylar
Balloons
11© 2018 Electric Power Research Institute, Inc. All rights reserved.
12© 2018 Electric Power Research Institute, Inc. All rights reserved.

13© 2018 Electric Power Research Institute, Inc. All rights reserved.
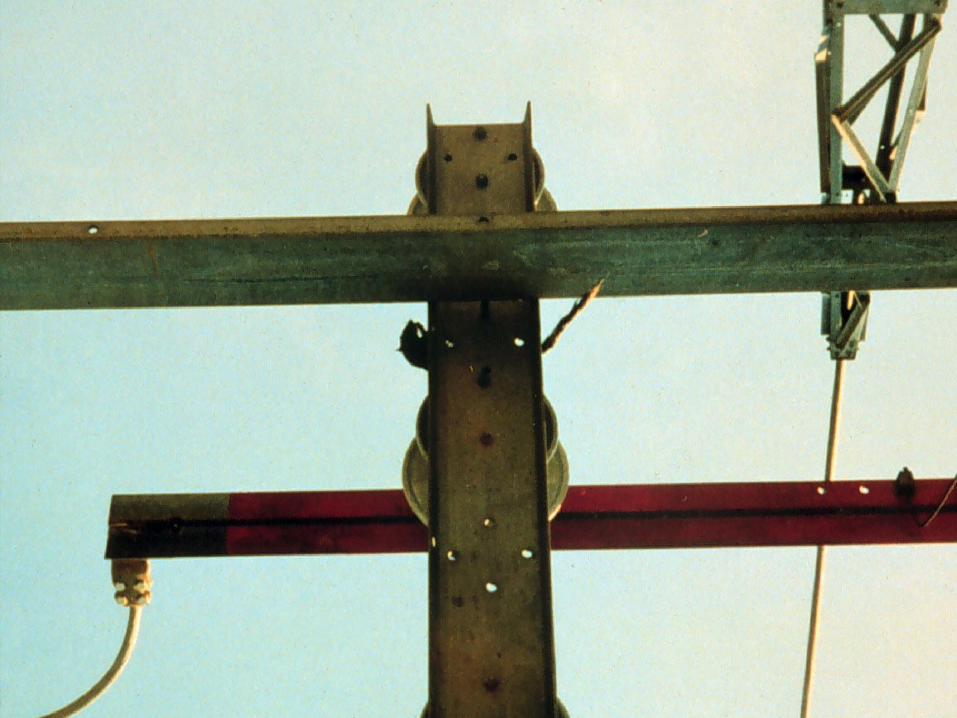
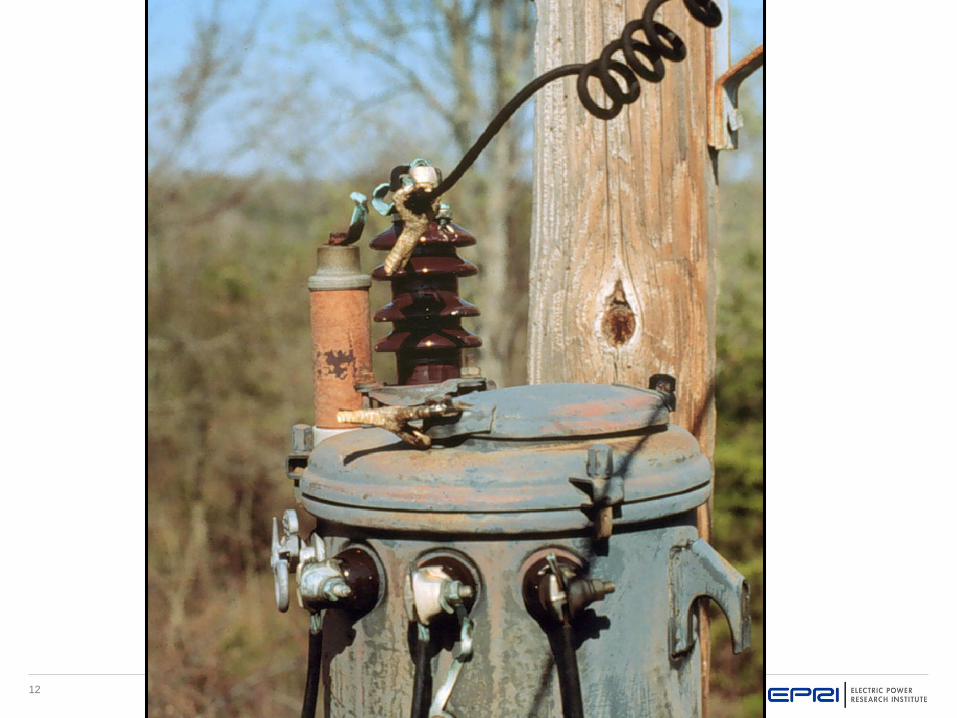
Locations Where Animal Faults OccurData source: EPRI TE-114915

14© 2018 Electric Power Research Institute, Inc. All rights reserved.
RMS Variation Event Rate Duration—System-wide
All Sites, One-minute Temporal Aggregation,
Events per Site per 30 Days

15© 2018 Electric Power Research Institute, Inc. All rights reserved.
RMS Variation Event Rate Magnitude—System-wide
All Sites, One-minute Temporal Aggregation
Events per Site per 30 Days

16© 2018 Electric Power Research Institute, Inc. All rights reserved.
Sag and Interruption Rates per 365 Days
Sag to Interruption Ratio
17© 2018 Electric Power Research Institute, Inc. All rights reserved.
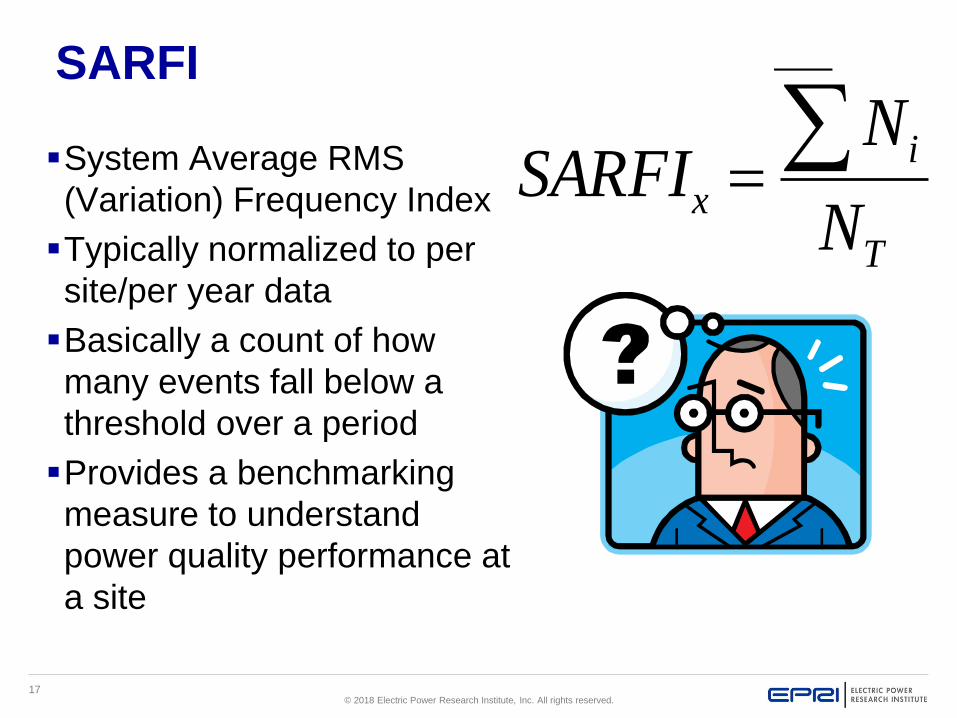
SARFI
▪System Average RMS
(Variation) Frequency Index
▪Typically normalized to per
site/per year data
▪Basically a count of how
many events fall below a
threshold over a period
▪Provides a benchmarking
measure to understand
power quality performance at
a site
T
i
xN
NSARFI
T
i
xN
NSARFI
18© 2018 Electric Power Research Institute, Inc. All rights reserved.
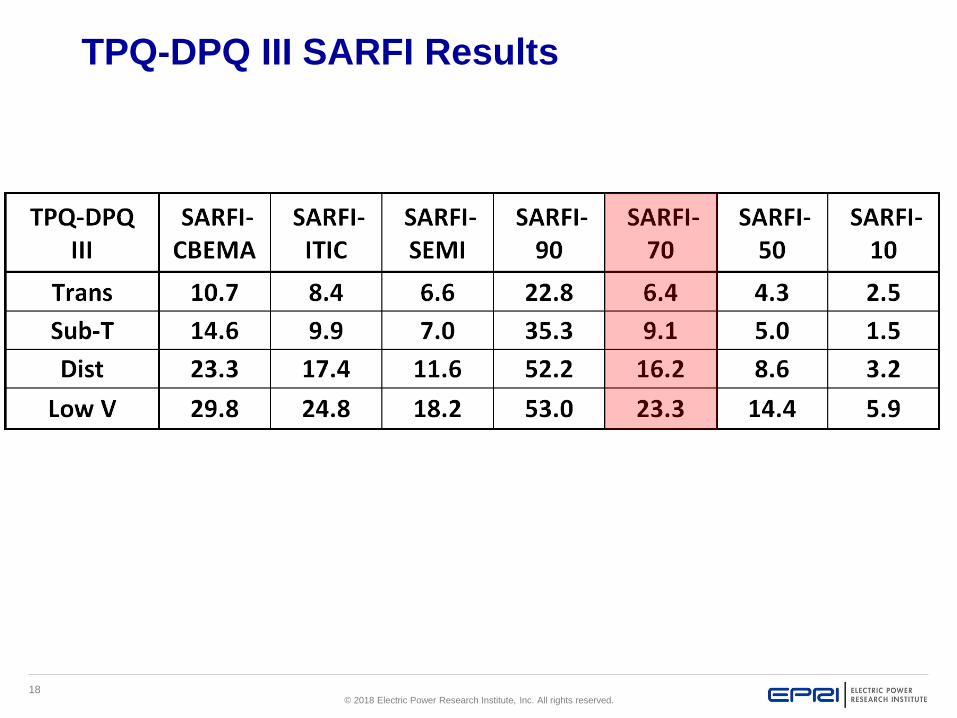
TPQ-DPQ III SARFI Results

19© 2018 Electric Power Research Institute, Inc. All rights reserved.
How Common are Sags and Interruptions?
• The ratio of sags to interruptions found
in the DPQ III study based upon circuit
type :
• Transmission: 8 to 1 (high – due to Bad
Weather in 2009-2012 time frame)
• Sub-Transmission: 20 to 1
• Distribution: 15 to 1
• Low Voltage: 8 to 1
• Average distribution fed customer site is
15 times more likely to experience a
voltage sag than a sustained interruption
or momentary interruption.
Key Results of EPRI TPQ-DPQ III Study
20© 2018 Electric Power Research Institute, Inc. All rights reserved.
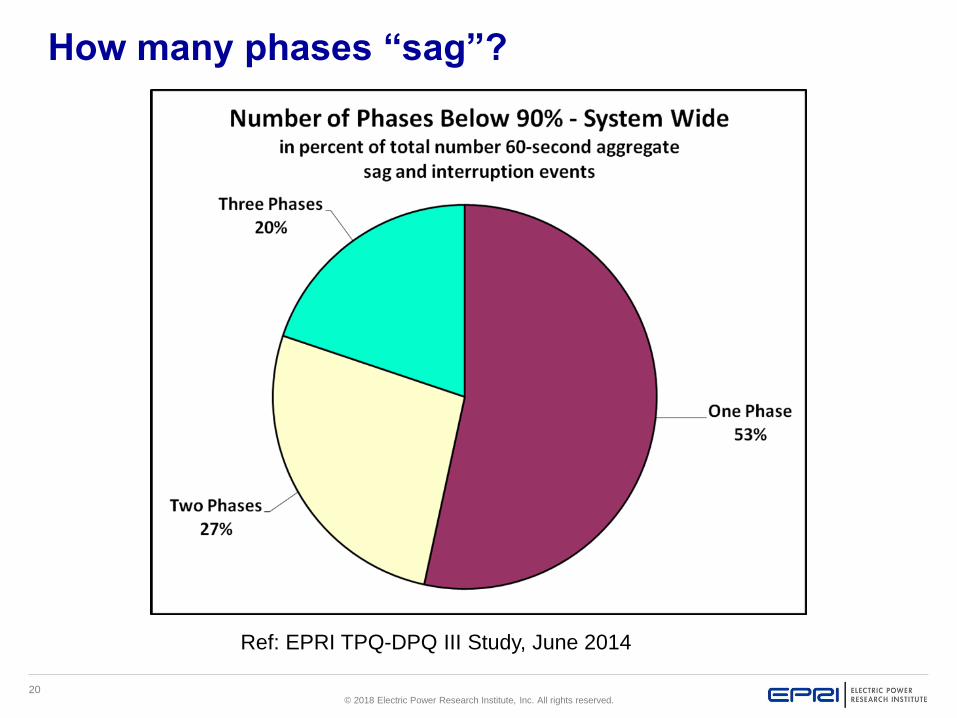
How many phases “sag”?
Ref: EPRI TPQ-DPQ III Study, June 2014

21© 2018 Electric Power Research Institute, Inc. All rights reserved.
Effects of Voltage Sags
▪ Lights may or may not flicker
▪ Equipment shutdown or malfunction
▪ Can result in production downtime an/or
product loss
-1
-0.5
0
0.5
1
0 1 2 3 4 5 6 7 8
Duration (4 Cycle)
Magnitude (50% of nominal)
(MagDur)
For every 1 momentary interruption a customer will see 8 to 20
voltage sags (EPRI TPQ-DPQ III Study)

22© 2018 Electric Power Research Institute, Inc. All rights reserved.
Who’s “Fault” is it?

23© 2018 Electric Power Research Institute, Inc. All rights reserved.
Why is PQ Important - Impacts
▪ What happens to a manufacturing process when a power
quality problem occurs?
▪ Who is to blame?
▪ How do we work together to fix the problems?

24© 2018 Electric Power Research Institute, Inc. All rights reserved.
Example Reported Per Event Cost of PQ Disturbance
No. Process Reported
Cost Service Voltage Load
1 Semiconductor $1,500,000 69 kV 25 MW
2 Semiconductor $1,400,000 161 kV 30 MW
3 Semiconductor $ 700,000 12.5 kV 10 MW
4 Metal Casting $ 200,000 13.8 kV 16 MW
5 Chemical Plant $ 160,000 12.5 kV 5 MW
6 Pulp and Paper Mill $ 110,000 161kV 100 MW
7 Aerospace Engine Machining $ 100,000 13.8kV 10 MW
8 Food and Beverage $ 87,000 12.5 kV 5 MW
9 Chemical Plant $ 75,000 66kV 3 MW
10 Chemical Plant $ 75,000 66kV 5 MW
11 Electronic Components $ 75,000 12.5 kV 5 MW
12 Crystal Growth $ 60,000 12.5 kV 1 MW
13 Chemical Plant $ 46,175 66kV 30 MW
14 Wiring Manufacturing $ 34,000 12.5 kV 2 MW
15 Chemical Plant $ 18,000 12.5 kV 2 MW
16 Fibers Plant $ 15,000 12.5 kV 1 MW
17 Paper and Packaging $ 10,000 12.5 kV 4 MW
18 Plastic Bag Manufacturing $ 10,000 480V 4 MW
19 Plastics $ 7,500 12.5 kV 4 MW
20 Stainless Steel Manufacturing $ 5,500 12.5 kV 2 MW

25© 2018 Electric Power Research Institute, Inc. All rights reserved.
Important Realization
▪Utilities Share Responsibility
– Tree Trimming, Lighting Arrestors, Grounding, Maintenance,
Provide PQ information to industrials, etc
– Circuit patrols, Reviewing customer complaints and device
operations, line device settings.
▪ Industrials Share Responsibility
– Understanding Equipment Vulnerability, Implementing PQ
Standards in Purchase Specifications, Power Conditioning, Proper
Wiring/Grounding, etc
▪Most effective solutions are reached when both sides
work together to see what can be done

26© 2018 Electric Power Research Institute, Inc. All rights reserved.
PQ Solution: Specify Voltage
Sag Standards in Purchase
Specs
▪Example Specs
– SEMI F47
▪ From Semiconductor
Industry
▪Most control OEMs have
compliant hardware
– IEC 61000-4-11/34
▪Class 3
– IEEE P1668

© 2018 Electric Power Research Institute, Inc. All rights reserved.
IEEE Std. 1668
Recommended Practice for Voltage Sag and Short
Interruption Ride-Through Testing
for End-Use Electrical Equipment Rated Less than
1000 V

28© 2018 Electric Power Research Institute, Inc. All rights reserved.
▪ IEEE Std. 1668 Recommended Practice for Voltage Sag and Short Interruption Ride-Through Testing for End-Use Electrical Equipment Rated Less than 1000 V
▪ Non-industry-specific document
▪ All electrical/electronic equipment may be evaluated
– Response to supply voltage reductions up to 2 seconds
▪ Standard provides/defines
– Clearly defined testing procedures and test equipment requirements for single-phase, two-phase, and three-phase balanced and unbalanced voltage sags
– Certification and test reporting requirements, including voltage-sag ride-through equipment characterization
IEEE Std. 1668 – What is its Purpose?

29© 2018 Electric Power Research Institute, Inc. All rights reserved.
▪ Industrial Process Sensitivity Short-Term Variations!
– IEEE Std 1157
▪ Instantaneous event
▪Momentary event
▪ Temporary Event
IEEE Std. 1668 – Why is it necessary?

30© 2018 Electric Power Research Institute, Inc. All rights reserved.
▪ Industrial Process Sensitivity Short-Term Variations!
– IEEE Std 1668
▪ Instantaneous event
▪Momentary event
▪ Temporary Event
IEEE Std. 1668 – Why is it necessary?
2 Seconds
31© 2018 Electric Power Research Institute, Inc. All rights reserved.
IEEE Std. 1668 – Why is it necessary?
▪Voltage Sags and brief interruptions disrupt industrial
processes
– Production is interrupted
▪ In-process product may become scrap
– Process equipment may be damaged
– Downtime may be measured in hours, entire shifts, or days.
▪Monthly production goals and profitability at risk
▪One estimate put losses at $7,000 per MW

32© 2018 Electric Power Research Institute, Inc. All rights reserved.
▪ Lights blink Power Loss!
▪ 90% to 10% = Voltage Sag
▪ 10% to 0% = Interruption
▪ Voltage sags one-, two-, or all
three-phases
Voltage
Sag
IEEE Std. 1668 – Why is it necessary?

33© 2018 Electric Power Research Institute, Inc. All rights reserved.
▪ Magnitude
– % Vnominal Remaining
▪ Duration
– Cycles, milliseconds,
Seconds
IEEE Std. 1668 – Why is it necessary?
34© 2018 Electric Power Research Institute, Inc. All rights reserved.
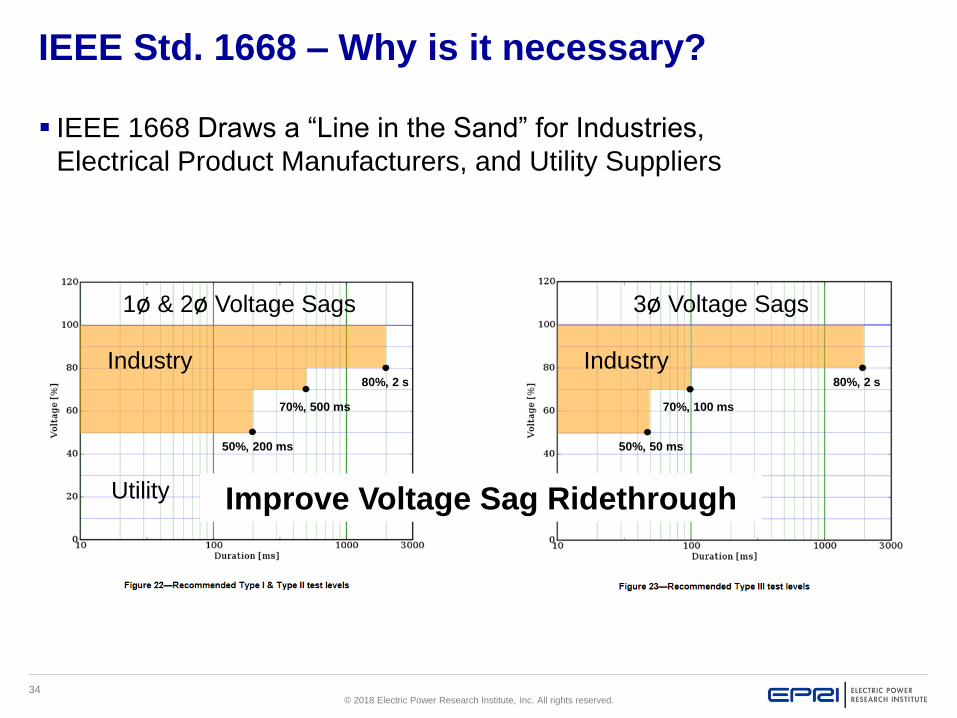
IEEE Std. 1668 – Why is it necessary?
▪ IEEE 1668 Draws a “Line in the Sand” for Industries,
Electrical Product Manufacturers, and Utility Suppliers
Industry
Utility
Industry
Utility
1ø & 2ø Voltage Sags 3ø Voltage Sags
50%, 200 ms
70%, 500 ms
80%, 2 s 80%, 2 s
70%, 100 ms
50%, 50 ms
Improve Voltage Sag Ridethrough
35© 2018 Electric Power Research Institute, Inc. All rights reserved.
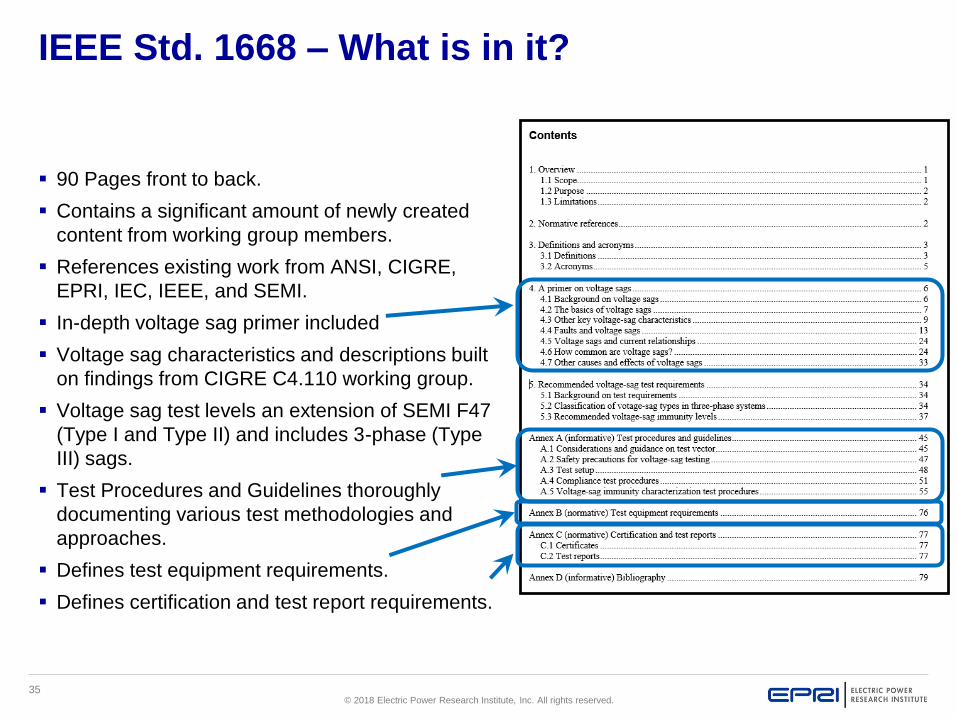
IEEE Std. 1668 – What is in it?
▪ 90 Pages front to back.
▪ Contains a significant amount of newly created
content from working group members.
▪ References existing work from ANSI, CIGRE,
EPRI, IEC, IEEE, and SEMI.
▪ In-depth voltage sag primer included
▪ Voltage sag characteristics and descriptions built
on findings from CIGRE C4.110 working group.
▪ Voltage sag test levels an extension of SEMI F47
(Type I and Type II) and includes 3-phase (Type
III) sags.
▪ Test Procedures and Guidelines thoroughly
documenting various test methodologies and
approaches.
▪ Defines test equipment requirements.
▪ Defines certification and test report requirements.
36© 2018 Electric Power Research Institute, Inc. All rights reserved.
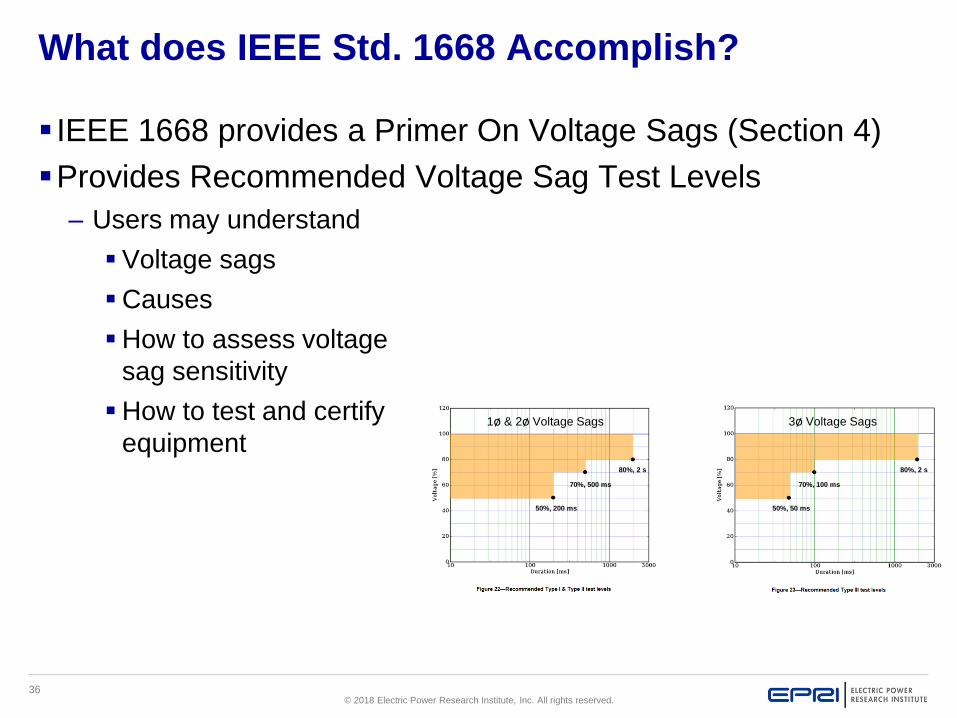
What does IEEE Std. 1668 Accomplish?
▪ IEEE 1668 provides a Primer On Voltage Sags (Section 4)
▪Provides Recommended Voltage Sag Test Levels
– Users may understand
▪Voltage sags
▪Causes
▪How to assess voltage
sag sensitivity
▪How to test and certify
equipment1ø & 2ø Voltage Sags 3ø Voltage Sags
50%, 200 ms
70%, 500 ms
80%, 2 s 80%, 2 s
70%, 100 ms
50%, 50 ms

37© 2018 Electric Power Research Institute, Inc. All rights reserved.
What does IEEE Std. 1668 Accomplish?
▪ IEEE 1668 provides test vectors to be
used in voltage sag testing
– Type I voltage sags
▪ Single phase affected
– Type II voltage sags
▪ Two phases affected
– Type III voltage sags
▪ Three phases affected

38© 2018 Electric Power Research Institute, Inc. All rights reserved.
What does IEEE Std. 1668 Accomplish?
▪Voltage-sag immunity
characterization
– reveals equipment’s ride-through
ability for voltage sags.
▪The “voltage-sag tolerance
curve”
– an important tool to understand
▪ the equipment and the electric
power supply compatibility
Will ride through
Will not ride through
39© 2018 Electric Power Research Institute, Inc. All rights reserved.
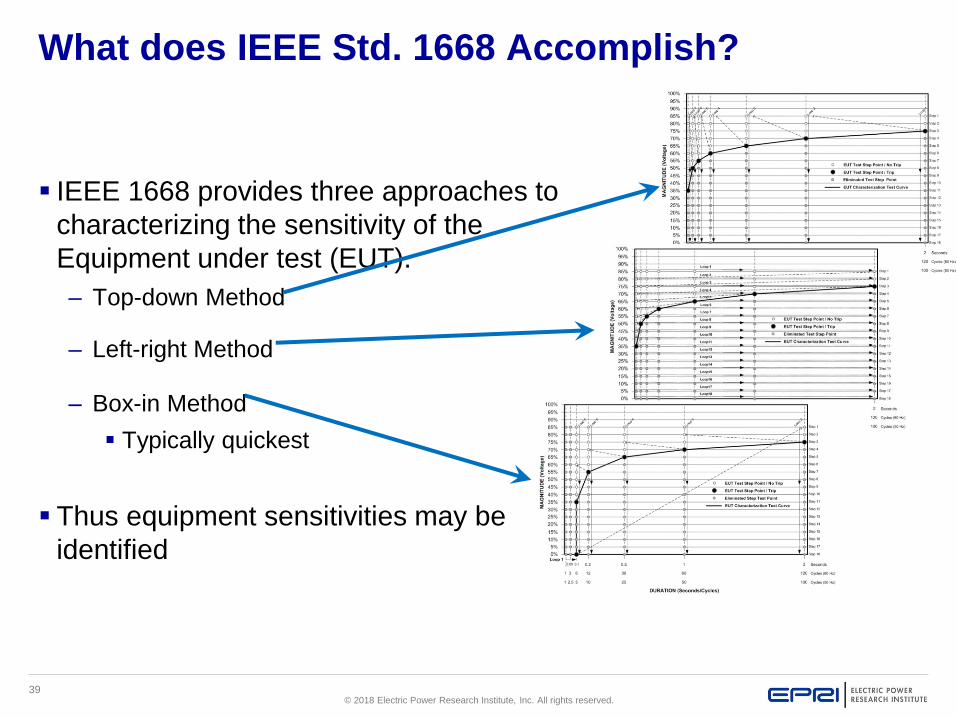
What does IEEE Std. 1668 Accomplish?
▪ IEEE 1668 provides three approaches to
characterizing the sensitivity of the
Equipment under test (EUT).
– Top-down Method
– Left-right Method
– Box-in Method
▪ Typically quickest
▪ Thus equipment sensitivities may be
identified

40© 2018 Electric Power Research Institute, Inc. All rights reserved.
Use IEEE Std. 1668 in Procurement!
▪User may specify the desired equipment
immunity in a purchase requisition
– Specification sheet provided in Table 12 and Table
13 for purchasing three-phase or single-phase
equipment
▪Specify equipment immunity
1ø & 2ø Voltage Sags 3ø Voltage Sags
50%, 200 ms
70%, 500 ms
80%, 2 s 80%, 2 s
70%, 100 ms
50%, 50 ms

41© 2018 Electric Power Research Institute, Inc. All rights reserved.
How may IEEE Std. 1668 be used in Procurement?
▪Equipment buyer can specify to a system
integrator/OEM requirements for voltage-sag
immunity.
▪System integrator/OEM can use this document to
specify voltage-sag immunity requirements to their
subsystem and component suppliers
▪More stringent requirements
may be referenced from
other documents
1ø & 2ø Voltage Sags 3ø Voltage Sags
50%, 200 ms
70%, 500 ms
80%, 2 s 80%, 2 s
70%, 100 ms
50%, 50 ms
42© 2018 Electric Power Research Institute, Inc. All rights reserved.
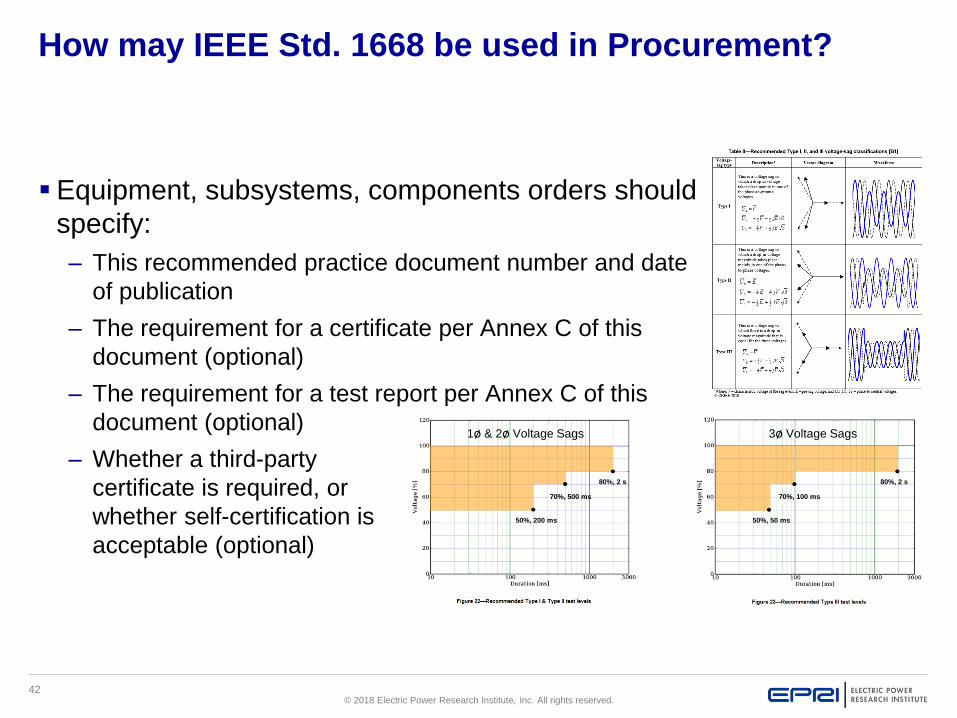
How may IEEE Std. 1668 be used in Procurement?
▪Equipment, subsystems, components orders should
specify:
– This recommended practice document number and date
of publication
– The requirement for a certificate per Annex C of this
document (optional)
– The requirement for a test report per Annex C of this
document (optional)
– Whether a third-party
certificate is required, or
whether self-certification is
acceptable (optional)
1ø & 2ø Voltage Sags 3ø Voltage Sags
50%, 200 ms
70%, 500 ms
80%, 2 s 80%, 2 s
70%, 100 ms
50%, 50 ms

43© 2018 Electric Power Research Institute, Inc. All rights reserved.
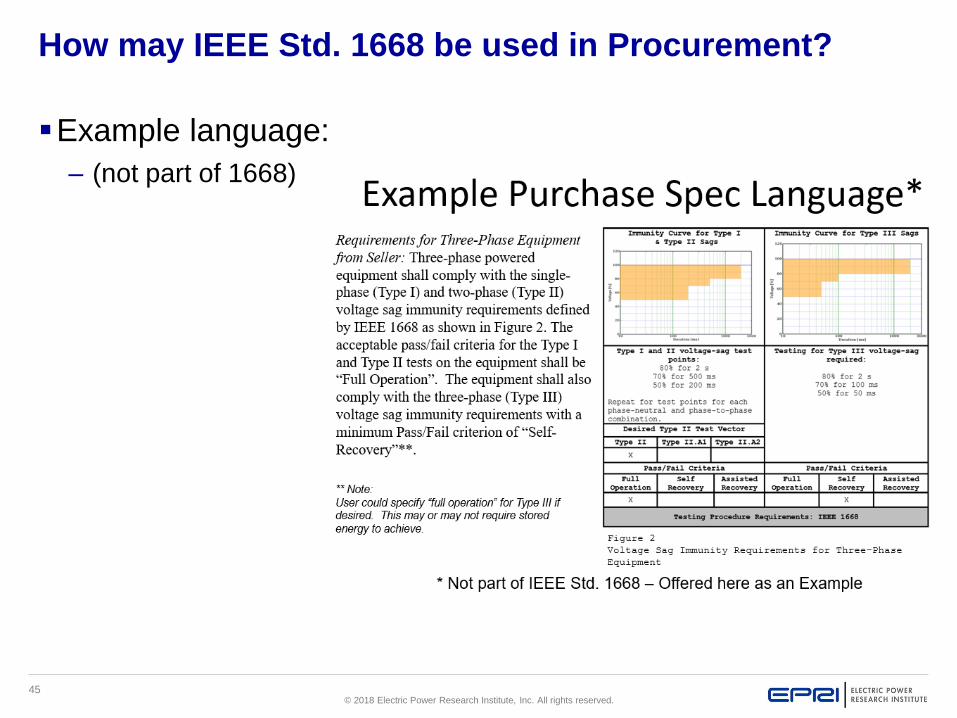
How may IEEE Std. 1668 be used in Procurement?
▪Example language:
– (not part of 1668)

44© 2018 Electric Power Research Institute, Inc. All rights reserved.
How may IEEE Std. 1668 be used in Procurement?
▪Example language:
– (not part of 1668)
45© 2018 Electric Power Research Institute, Inc. All rights reserved.
How may IEEE Std. 1668 be used in Procurement?
▪Example language:
– (not part of 1668)

46© 2018 Electric Power Research Institute, Inc. All rights reserved.
IEEE Std. 1668 Summary
▪ IEEE Std. 1668 Recommended Practice for Voltage Sag and Short Interruption Ride-Through Testing for End-Use Electrical Equipment Rated Less than 1000 V
▪ Non-industry-specific document
▪ All electrical/electronic equipment may be evaluated
– Response to supply voltage reductions to 2 seconds
▪ Standard provides/defines
– Clearly defined testing procedures and test equipment requirements for single-phase, two-phase, and three-phase balanced and unbalanced voltage sags
– Certification and test reporting requirements, including voltage-sag ride-through equipment characterization
1ø & 2ø Voltage Sags
3ø Voltage Sags
50%, 200 ms
70%, 500 ms
80%, 2 s
80%, 2 s
70%, 100 ms
50%, 50 ms
© 2018 Electric Power Research Institute, Inc. All rights reserved.
2.0 Effects of Voltage Sags
on Industrial Equipment,
and Susceptibilities
Alden Wright, PE, CEM, CP EnMS
EPRI Industrial PQ and EE Group
48© 2018 Electric Power Research Institute, Inc. All rights reserved.
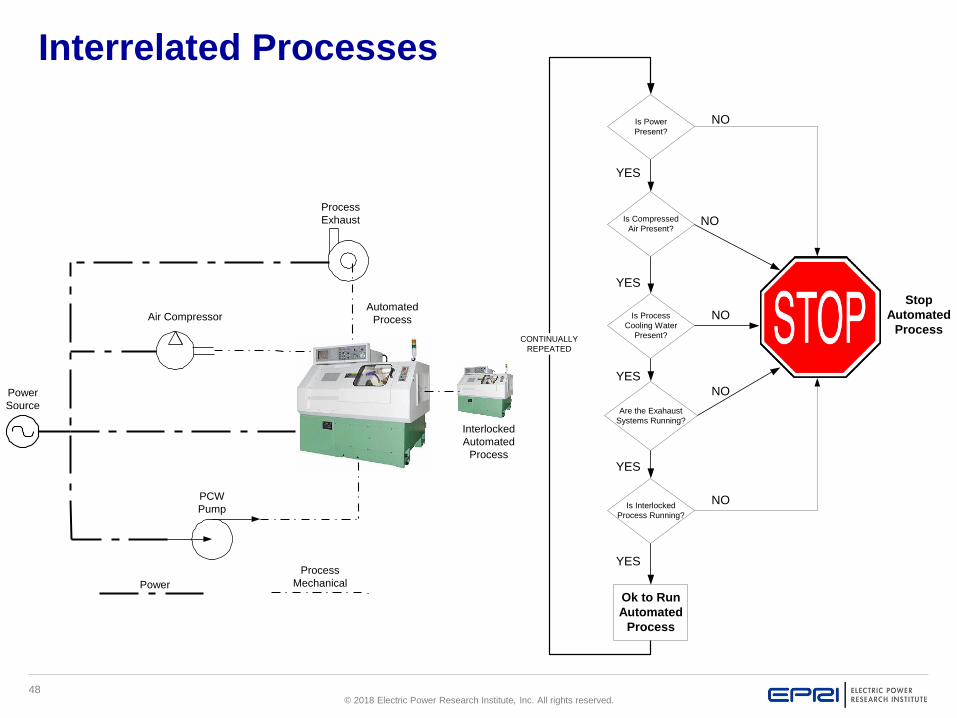
Interrelated Processes
Air Compressor
Power
Source
Process
Exhaust
PCW
Pump
Power
Process
Mechanical
Automated
Process
Interlocked
Automated
Process
Is Compressed
Air Present?
Is Process
Cooling Water
Present?
Are the Exahaust
Systems Running?
Is Power
Present?
Is Interlocked
Process Running?
Ok to Run
Automated
Process
CONTINUALLY
REPEATED
Stop
Automated
Process
NO
YES
NO
NO
NO
NO
YES
YES
YES
YES

49© 2018 Electric Power Research Institute, Inc. All rights reserved.
Goal – Extending the Operating Envelope
“Extending the operating envelope” of equipment means that we have
to reduce the area of equipment malfunctions by enabling the
equipment to ride through deeper and longer voltage sags.

50© 2018 Electric Power Research Institute, Inc. All rights reserved.
Voltage Sag Test Equipment Pioneers: EPRI Porto-Sag
As featured in Plant Engineering Magazine, August 8, 2002

51© 2018 Electric Power Research Institute, Inc. All rights reserved.
Versions of the Porto-Sag EPRI Built
30 Amp Units
Patented Tri-Mode
Model PS200-3P-T-TM
Type I
Type II
Type IIA.1
Type IIA.2
Type III
Sag Types Per IEEE 1668
52© 2018 Electric Power Research Institute, Inc. All rights reserved.
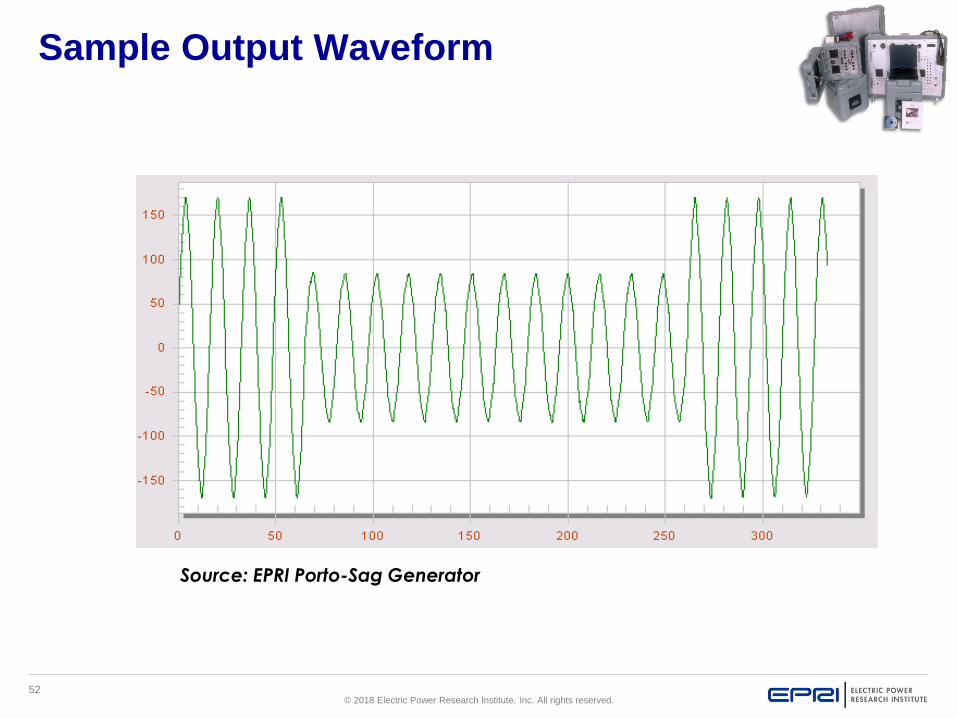
Sample Output Waveform
Source: EPRI Porto-Sag Generator

53© 2018 Electric Power Research Institute, Inc. All rights reserved.
Porto-Sag Software Interface
54© 2018 Electric Power Research Institute, Inc. All rights reserved.
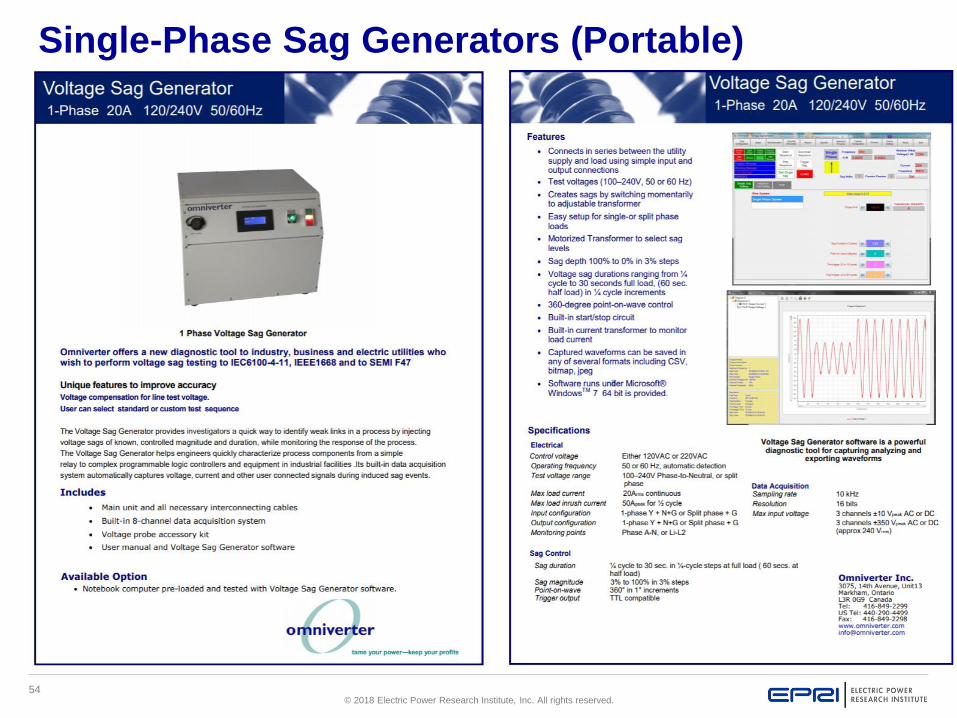
Single-Phase Sag Generators (Portable)

55© 2018 Electric Power Research Institute, Inc. All rights reserved.
Sag Generators – PSL Industrial Power Corrupter
▪ The IPC create sags/dips, swells, interruptions on 100 V – 480 V systems, at up to 480 volts and up to 200 Amps continuous
▪ Portable
▪ Connects to All three Phases
▪ Can create a sag across a selected phase-neutral or phase-to-phase vector – Only one tapped transformer
▪ Measure energy consumption at all stages of a process or cycle
▪ Fully compliant with SEMI F47, IEC 61000-4-34, IEC 61000-4-11
– Can do IEEE Std. 1668 testing for single phase loads.
– Can do one Mode of Type II testing per IEEE Std. 1668 Type IIA.1.
– Not able to do Type III tests per with IEEE Std. 1668-2018 for three-phase loads – can only generate three-phase interruption.
Type I
Type IIA.1
Type III
Interruptions
Only

56© 2018 Electric Power Research Institute, Inc. All rights reserved.
Sag Generator – Omniverter 3-Phase
• Enables:
• IEC 61000-3-11 & 61000-3-34 testing.
• IEEE Std. 1668 (All test Modes)
• SEMI F47 Testing
Type I
Type II
Type IIA.1
Type IIA.2
Type III
57© 2018 Electric Power Research Institute, Inc. All rights reserved.
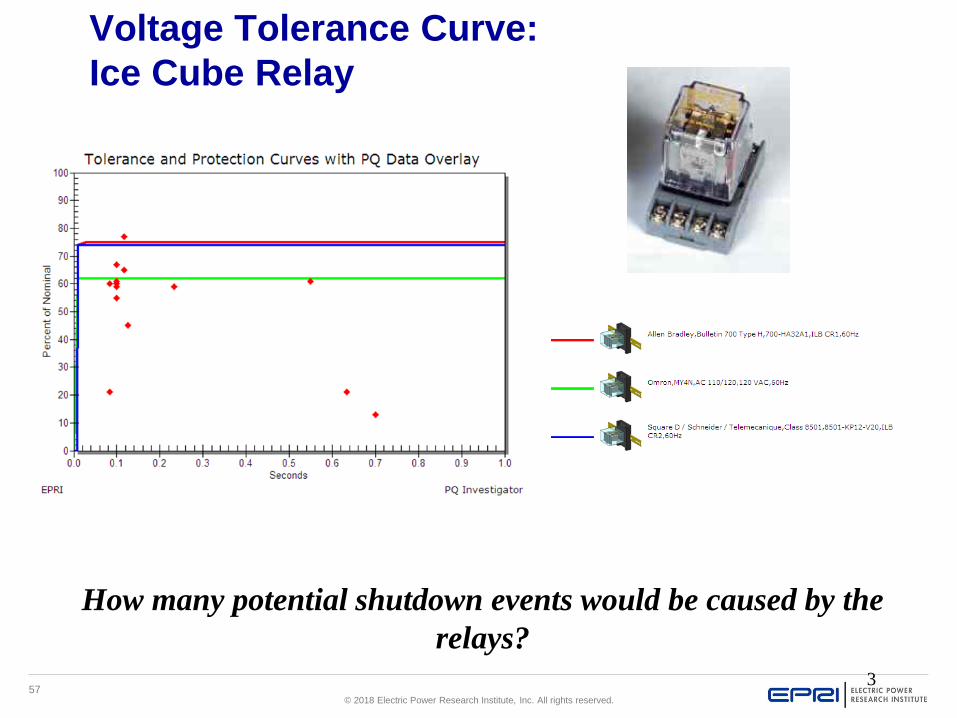
3
Voltage Tolerance Curve:
Ice Cube Relay
How many potential shutdown events would be caused by the
relays?
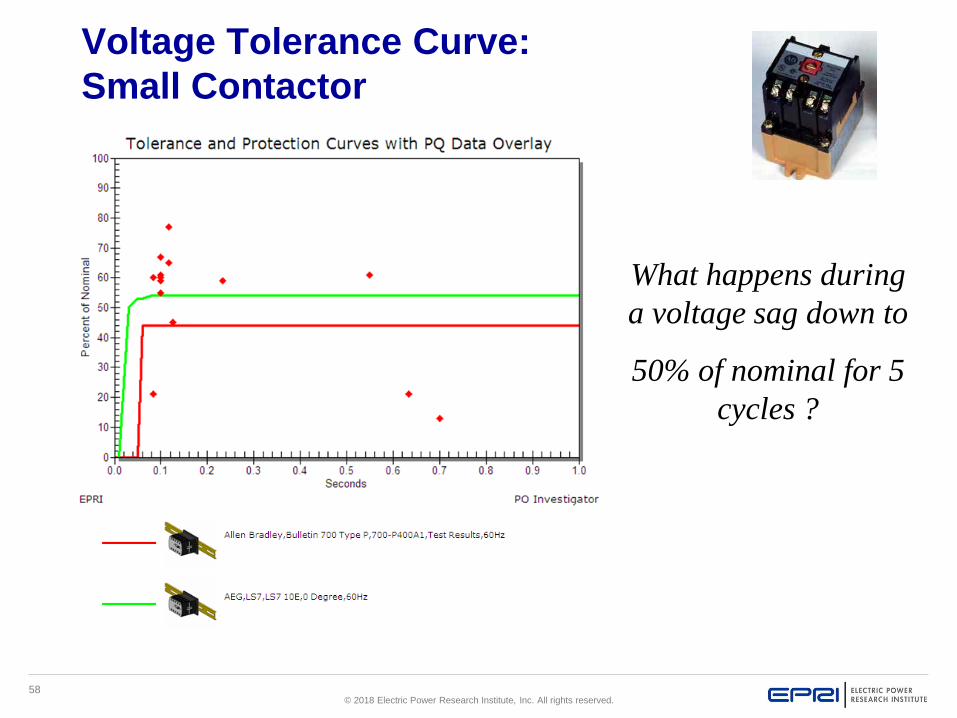
58© 2018 Electric Power Research Institute, Inc. All rights reserved.
Voltage Tolerance Curve:
Small Contactor
What happens during
a voltage sag down to
50% of nominal for 5
cycles ?
59© 2018 Electric Power Research Institute, Inc. All rights reserved.
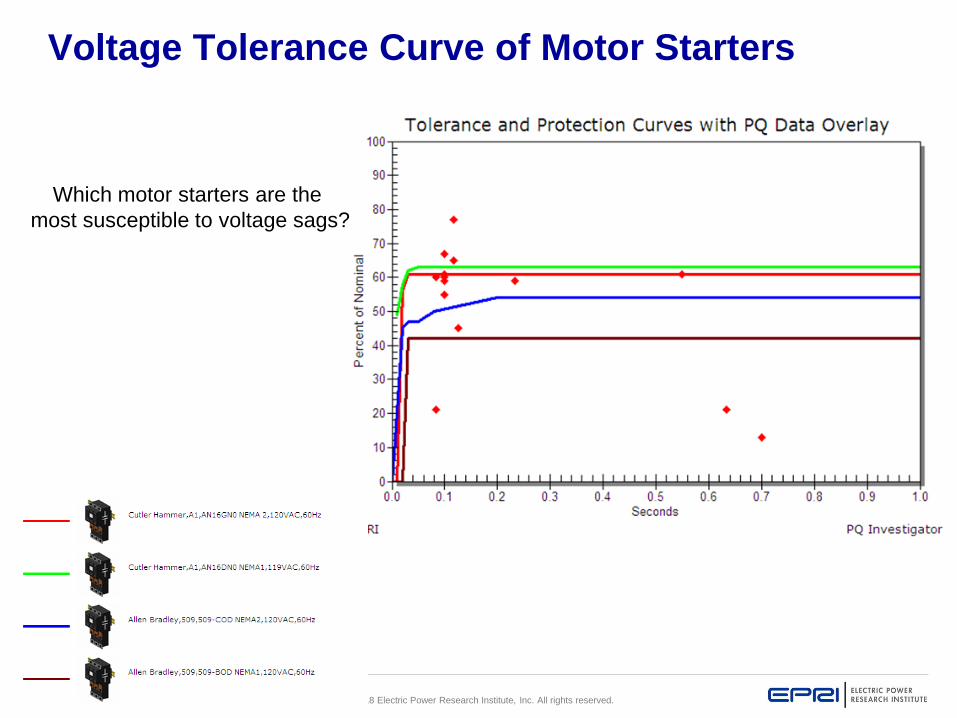
Voltage Tolerance Curve of Motor Starters
Which motor starters are the
most susceptible to voltage sags?
60© 2018 Electric Power Research Institute, Inc. All rights reserved.
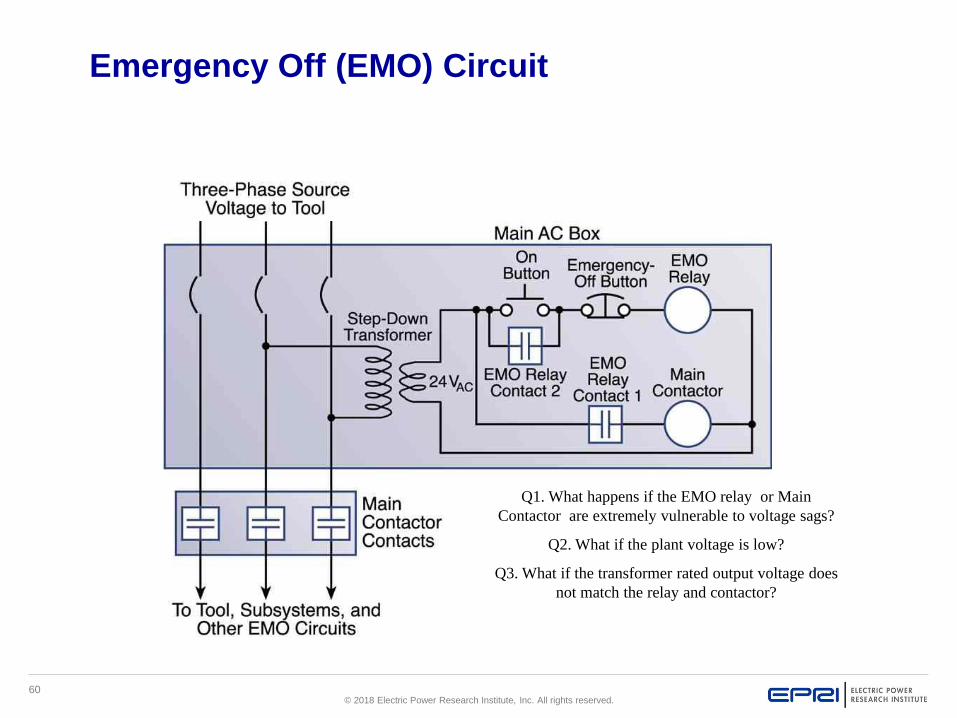
Emergency Off (EMO) Circuit
Q1. What happens if the EMO relay or Main
Contactor are extremely vulnerable to voltage sags?
Q2. What if the plant voltage is low?
Q3. What if the transformer rated output voltage does
not match the relay and contactor?

61© 2018 Electric Power Research Institute, Inc. All rights reserved.
Master Control Relay Example
What happens
when an
operator hits the
E-Stop?
What happens if
1CRM1 is a
sensitive relay?

62© 2018 Electric Power Research Institute, Inc. All rights reserved.
DC Power Supplies
▪ DC Power supplies range from single-phase
linear to switch-mode designs and are used to
power user interface PCs, tool controllers, and
instrument I/O applications.
▪ The voltage sag ride-through of most power
supplies designed for PC, tool controllers, and
instrument I/O applications is directly related to
the amount of stored energy and power and/or
topology.
▪ PQ Performance Varies based on topology and
loading
▪ An example is 120 volts to 24Vdc. The
"secondary" voltage is a lower, control level
voltage.
63© 2018 Electric Power Research Institute, Inc. All rights reserved.
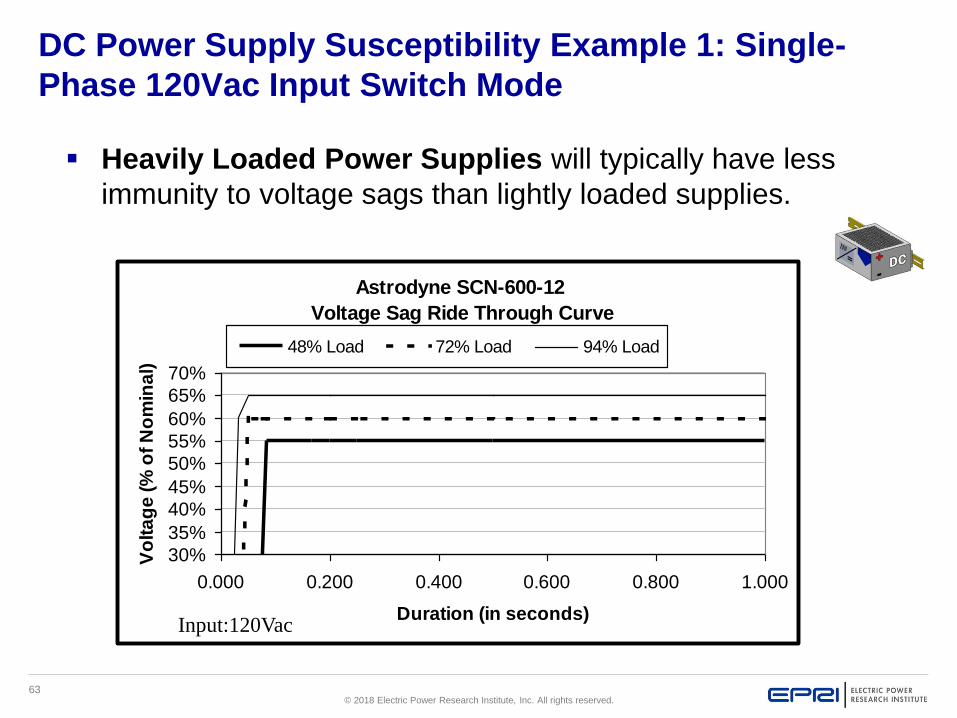
DC Power Supply Susceptibility Example 1: Single-
Phase 120Vac Input Switch Mode
▪ Heavily Loaded Power Supplies will typically have less
immunity to voltage sags than lightly loaded supplies.
Astrodyne SCN-600-12
Voltage Sag Ride Through Curve
30%
35%
40%
45%
50%
55%
60%
65%
70%
0.000 0.200 0.400 0.600 0.800 1.000
Duration (in seconds)
Vo
lta
ge
(%
of
No
min
al)
48% Load 72% Load 94% Load
Input:120Vac

64© 2018 Electric Power Research Institute, Inc. All rights reserved.
DC Power Supply Susceptibility Example 2: Universal
Input Types
Idec PS5R-A12, 7.5W
0
10
20
30
40
0 10 20 30 40 50 60
Cycles
%V
no
min
al
Vin=208Vac
Vin=120Vac
CM50 (208 Volts)
0%
20%
40%
60%
80%
100%
0 0.2 0.4 0.6 0.8 1 1.2
Duration (in seconds)
Vo
lta
ge
(%
of
No
min
al)
100% Load SEMI F47

65© 2018 Electric Power Research Institute, Inc. All rights reserved.
PLC Based
Control Systems

66© 2018 Electric Power Research Institute, Inc. All rights reserved.
PLC POWER SUPPLY:
•CPU
•I/O CARD (LOGIC SIDE)
•ANALOG OUTPUT CARDS (SOME MANUFACTURERS)
EXTERNAL POWER REQUIRED FOR :
•DISCRETE INPUTS (120 Vac, 24 Vdc, etc.)
•DISCRETE OUTPUTS (120 Vac, 24 Vdc, etc.)
•ANALOG INPUTS (FIELD CURRENT/ VOLTAGE SOURCE)
•ANALOG OUTPUTS (SOME MANUFACTURERS)
How PLC I/O Is Typically
Powered?

67© 2018 Electric Power Research Institute, Inc. All rights reserved.
AC Powered PLC Power Supply
From Typical PLC Literature:
What that means to you:
- Oversensitive Power Supply
- Process Shutdown due to voltage Sags
What can be done about this?

68© 2018 Electric Power Research Institute, Inc. All rights reserved.
Suitcase Demo PLC

69© 2018 Electric Power Research Institute, Inc. All rights reserved.
Example Voltage Sag Ride-Through of
AC Powered PLCs

70© 2018 Electric Power Research Institute, Inc. All rights reserved.
Adjustable Speed Drives

71© 2018 Electric Power Research Institute, Inc. All rights reserved.
AC PWM Drive
Rectifier
Diode Bridge
DC Bus
Capacitor
IGBT
Inverter
Source Voltage DC Bus Voltage Motor Input Voltage
MOTOR
ACINPUT
SECTION
ENERGY
STORAGE
SECTION
OUTPUT
SECTION
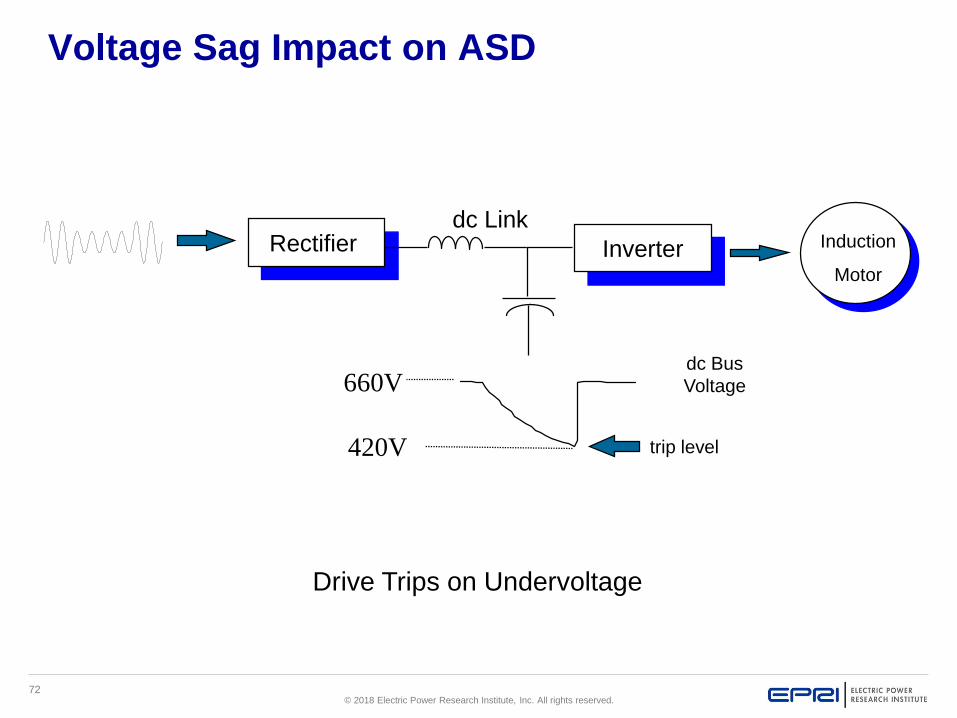
72© 2018 Electric Power Research Institute, Inc. All rights reserved.
Voltage Sag Impact on ASD
Drive Trips on Undervoltage
Induction
Motor
Rectifier Inverter
dc Link
dc Bus
Voltage
trip level
660V
420V

73© 2018 Electric Power Research Institute, Inc. All rights reserved.
Example Drive Response
74© 2018 Electric Power Research Institute, Inc. All rights reserved.
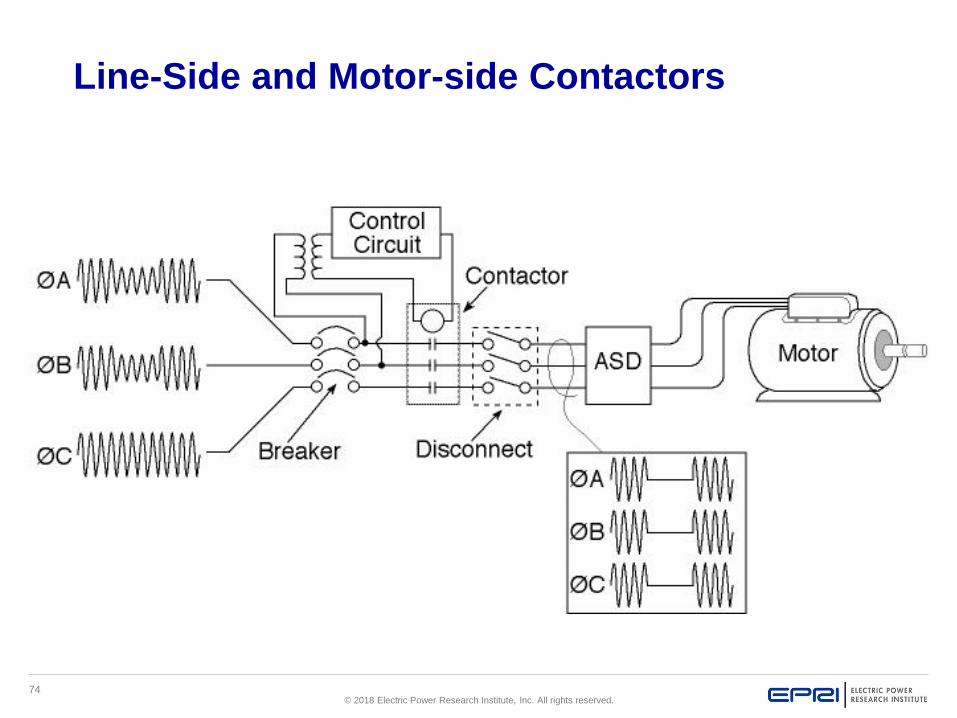
Line-Side and Motor-side Contactors

75© 2018 Electric Power Research Institute, Inc. All rights reserved.
ASD Enable/Run Signal
Contact on
120 V AC relay
Drive
Enable/Run

© 2018 Electric Power Research Institute, Inc. All rights reserved.
Mitigation Solutions

77© 2018 Electric Power Research Institute, Inc. All rights reserved.
PQ Solution – Add Mitigation
Coil-Lock Know TripNICE Cube
CVTVDC
MiniDySC
RTD
Bonitron Adjust Drive
Settings
ProDySC
AVC
3-Phase
480Vac
Power
Conditioner
Xformer
480/208
3-Phase
30kVA
IPP-PC
480Vac
3-Phase
MCC Bus
Where Possible
Avoid
Battery Based
Solutions!

78© 2018 Electric Power Research Institute, Inc. All rights reserved.
Uninterruptible Power Supply (UPS)
Battery Based
UPS
Are Often
“Overkill”
For Control Loads
Small 500Va to
3kVA
UPS Systems are
sometimes Used
“Abandoned in Place” UPS SystemsDouble Conversion

79© 2018 Electric Power Research Institute, Inc. All rights reserved.
Mitigation Levels
Embedded Solutions

80© 2018 Electric Power Research Institute, Inc. All rights reserved.
Example Comparison of Large Scale Technologies for
Plant PQ and Reliability Improvements
Mitigation Approaches
Solution:
Ele
ctri
cal
Effi
cie
ncy
:
Co
mp
reh
en
sive
W
ho
le P
lan
t So
luti
on
:
Pe
tro
leu
m F
ue
l R
eq
uir
em
en
t:
Bat
tery
R
eq
uir
em
en
t:
Ene
rgy
Sto
rage
R
eq
uir
em
en
t:
An
nu
al
Mai
nte
nan
ce C
ost
:
Bat
tery
R
ep
lace
me
nt
Pe
rio
d (
year
s):
Fan
Ass
em
bly
R
ep
lace
me
nt
Pe
rio
d (
year
s):
DC
Bu
s C
ap
Re
pla
cem
en
t P
eri
od
(ye
ars)
:
Be
arin
g R
ep
lace
me
nt
Pe
rio
d:
Bri
dge
-po
we
r D
ura
tio
n (
s):
Cu
rre
nt
Lim
it,
% o
f N
om
inal
:
Dyn
amic
Vo
ltag
e
Re
gula
tio
n:
Lon
g-te
rm
Inte
rru
pti
on
Su
pp
ort
:
Sag RT OmniVerter AVC2 99% No No No No Low None 7 12 None No 200% Yes No
Sag RT + 15sInterruption
OmniVerter AVCRTS - Battery (30s) 99% No No Yes Yes Medium 5 5 12 None 30 200% Yes No
CAT UPS 900Z 98% No No No Yes High None None 10 4 16 200% Yes No
BridgePower + Gen Sets
OmniVerter AVCRTS - Battery (30s)
+ Generator99% No Yes Yes Yes Medium 5 7 12 None
30 s + Gen
200% Yes Yes
CAT UPS + Generator 98% No Yes No Yes High None None 10 416 s + Gen
200% Yes Yes
Bridge Power +
AlternateFeed
OmniVerter AVCRTS - Battery
+ MV Feed99% No No Yes Yes Low 5 7 12 None
30 s + MV
Feeder200% Yes Yes
CAT UPS + MV Feed 98% No No No Yes Med None None 10 416 s +
MV Feeder
200% Yes Yes
Full Load Battery plus
AlternateFeed
8 MW UPS Battery System + MV Standby Feed
98% Yes No Yes Yes LowIncluded in warranty (Typically 10 years)
None15 s +
MV Feeder
110% Yes Yes
Pro Neutral Con
81© 2018 Electric Power Research Institute, Inc. All rights reserved.
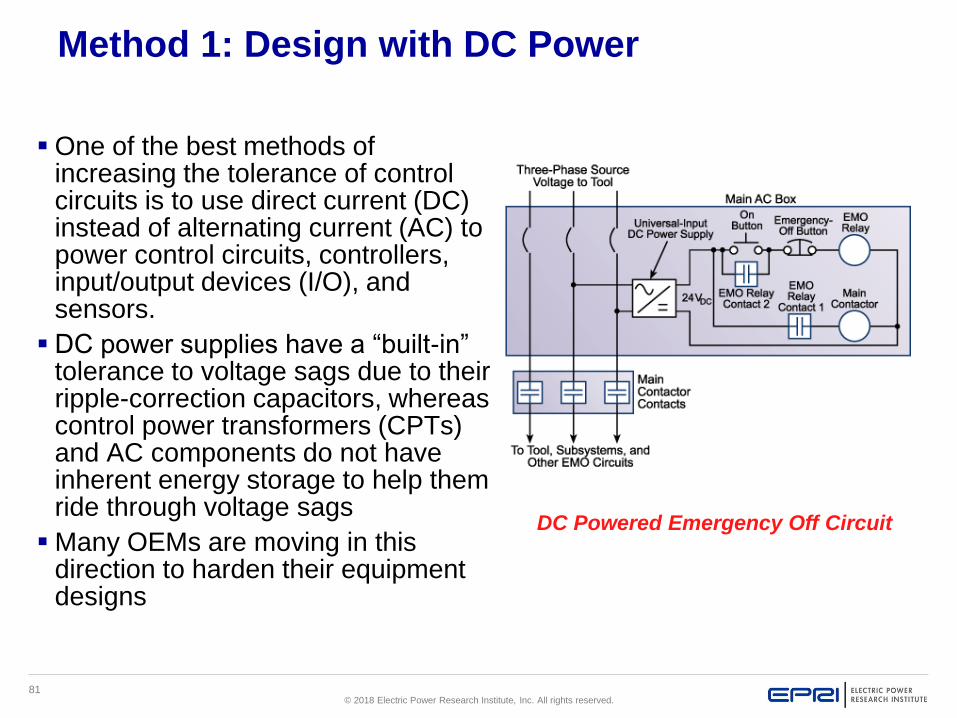
Method 1: Design with DC Power
▪One of the best methods of increasing the tolerance of control circuits is to use direct current (DC) instead of alternating current (AC) to power control circuits, controllers, input/output devices (I/O), and sensors.
▪ DC power supplies have a “built-in” tolerance to voltage sags due to their ripple-correction capacitors, whereas control power transformers (CPTs) and AC components do not have inherent energy storage to help them ride through voltage sags
▪Many OEMs are moving in this direction to harden their equipment designs
DC Powered Emergency Off Circuit

82© 2018 Electric Power Research Institute, Inc. All rights reserved.
Demonstration Time – PLC using DC Power Supply
Rather Than CPT
DC Powered PLC Circuit
▪How Much Better is the
DC solution?
–Depth of Sag
–Duration of Sag
▪What other benefits
does DC have?
▪What are some design
considerations with DC?
PLC DC P/S On, AC P/S OFF
Sequence State Set to “0”Video Link
83© 2018 Electric Power Research Institute, Inc. All rights reserved.
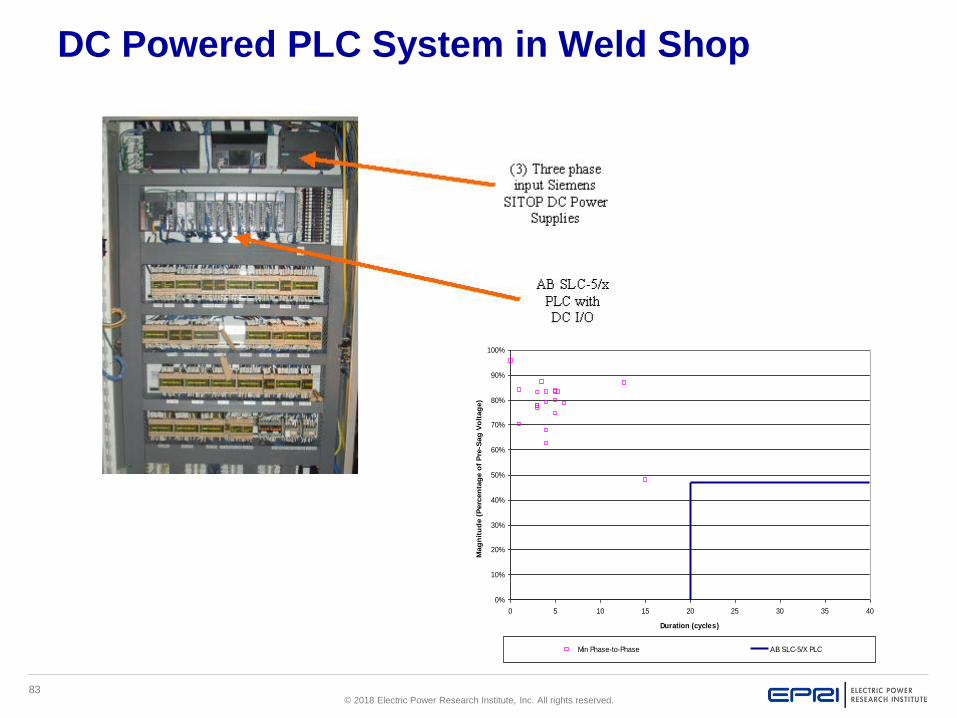
DC Powered PLC System in Weld Shop
0%
10%
20%
30%
40%
50%
60%
70%
80%
90%
100%
0 5 10 15 20 25 30 35 40
Duration (cycles)
Mag
nit
ud
e (
Perc
en
tag
e o
f P
re-S
ag
Vo
ltag
e)
Min Phase-to-Phase AB SLC-5/X PLC

84© 2018 Electric Power Research Institute, Inc. All rights reserved.
Summary of Robust Power Supply
Strategies

85© 2018 Electric Power Research Institute, Inc. All rights reserved.
Summary of Robust Power Supply Strategies:
Relative Power Supply Response at 100%
Loading
Ride-Through for
Single-Phase Voltage
Sags

86© 2018 Electric Power Research Institute, Inc. All rights reserved.
24Vdc Energy Storage Options
▪ The PQI now has two 24Vdc
Energy Storage Options that can
harden 24Vdc Based Controls.

87© 2018 Electric Power Research Institute, Inc. All rights reserved.
PULS DC BUFFER Module
Ref: PULSE Buffer module SLV.20.200 data sheet
DEMO:
Sequence “0”
PLC DC P/S “ON”
Connect Buffer Module to 24VDC
88© 2018 Electric Power Research Institute, Inc. All rights reserved.
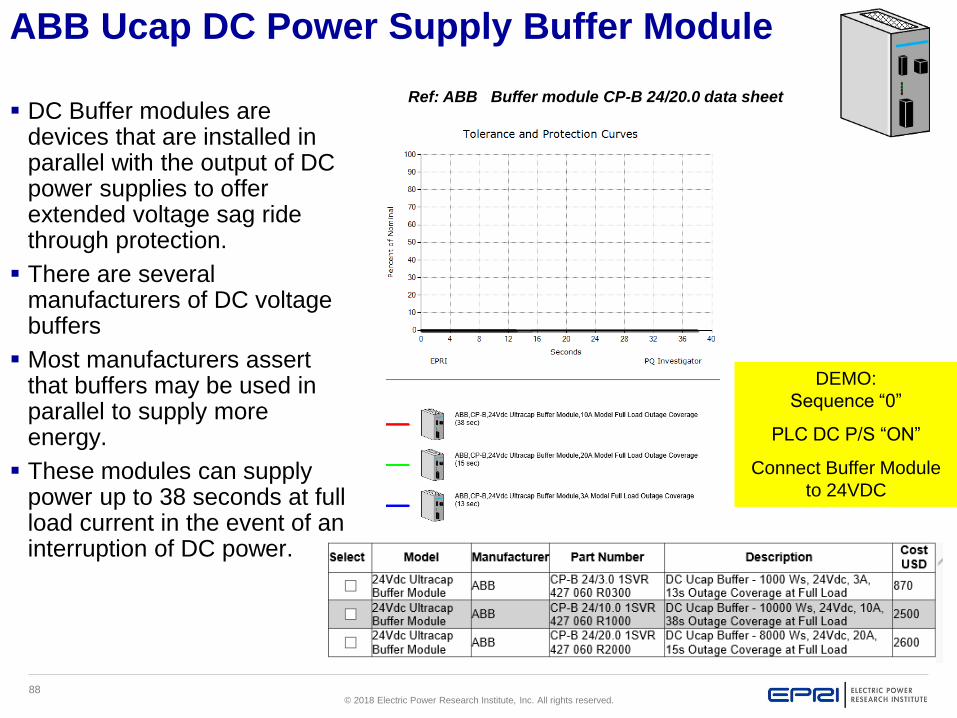
ABB Ucap DC Power Supply Buffer Module
▪ DC Buffer modules are devices that are installed in parallel with the output of DC power supplies to offer extended voltage sag ride through protection.
▪ There are several manufacturers of DC voltage buffers
▪ Most manufacturers assert that buffers may be used in parallel to supply more energy.
▪ These modules can supply power up to 38 seconds at full load current in the event of an interruption of DC power.
Ref: ABB Buffer module CP-B 24/20.0 data sheet
DEMO:
Sequence “0”
PLC DC P/S “ON”
Connect Buffer Module
to 24VDC
89© 2018 Electric Power Research Institute, Inc. All rights reserved.
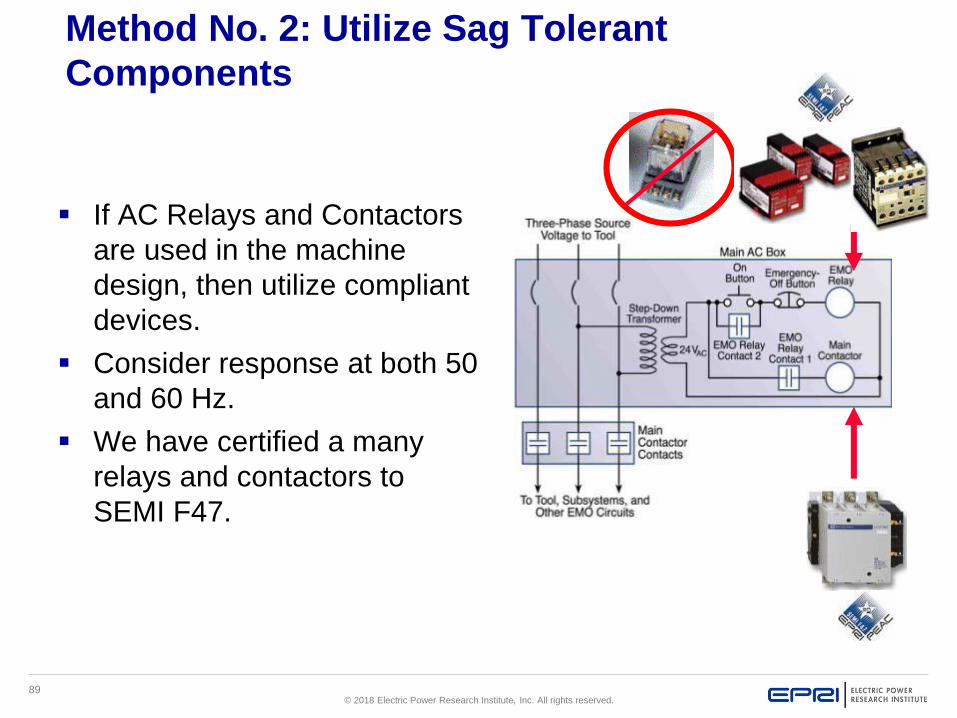
Method No. 2: Utilize Sag Tolerant
Components
▪ If AC Relays and Contactors
are used in the machine
design, then utilize compliant
devices.
▪ Consider response at both 50
and 60 Hz.
▪ We have certified a many
relays and contactors to
SEMI F47.
90© 2018 Electric Power Research Institute, Inc. All rights reserved.
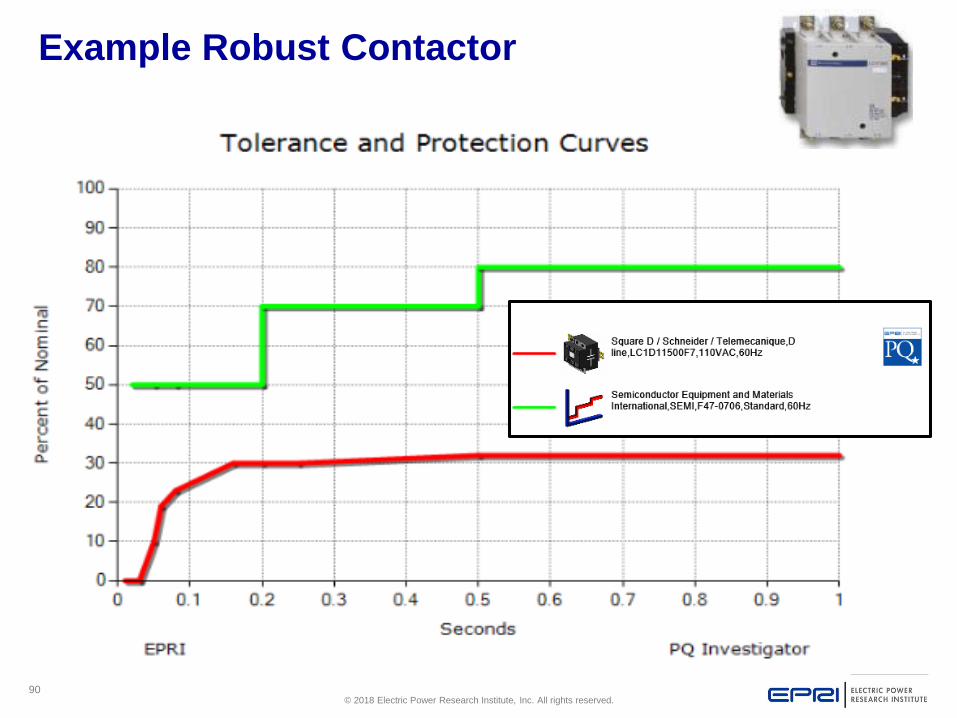
Example Robust Contactor

91© 2018 Electric Power Research Institute, Inc. All rights reserved.
Example Voltage Sag Response of Motor Controls
Based on Robustness of Components

92© 2018 Electric Power Research Institute, Inc. All rights reserved.
New Solution for an Old Problem: “Nice Cube”
Concept
Original “AC Ice Cube”
Drop out ~70% Vnom
Remove “AC Ice Cube” Insert
“Nice Cube” Puck Into Base
Insert “DC Ice Cube”
Drop Out ~ 25-30% Vnom

93© 2018 Electric Power Research Institute, Inc. All rights reserved.
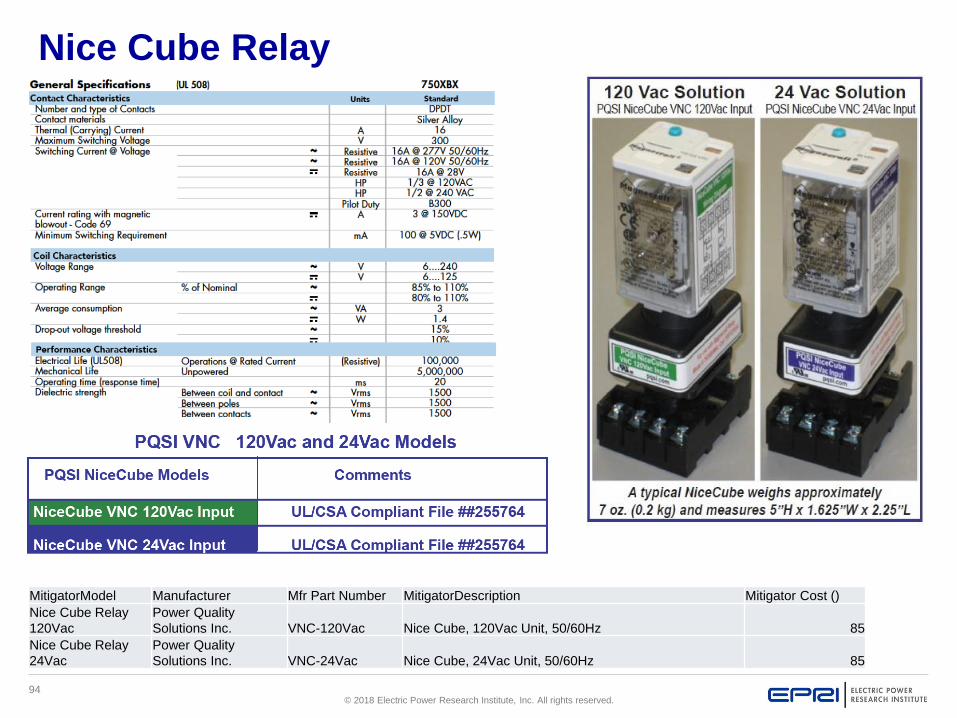
Nice Cube Relay
WATCH VIDEO
94© 2018 Electric Power Research Institute, Inc. All rights reserved.
Nice Cube Relay
MitigatorModel Manufacturer Mfr Part Number MitigatorDescription Mitigator Cost ()
Nice Cube Relay
120Vac
Power Quality
Solutions Inc. VNC-120Vac Nice Cube, 120Vac Unit, 50/60Hz 85
Nice Cube Relay
24Vac
Power Quality
Solutions Inc. VNC-24Vac Nice Cube, 24Vac Unit, 50/60Hz 85

95© 2018 Electric Power Research Institute, Inc. All rights reserved.
Method 3: Apply Custom Programming Techniques –
Delay Filters
▪ Delay filters can verify the presence of power and work as a “de-bounce” mechanism for when components drop out due to a voltage sag. The PLC motor-control circuit shown demonstrates how this method can be applied.
▪ The program is designed to detect whether the auxiliary contact is open for more than 250 milliseconds.
▪ If the contact is open for more than that preset time, then the “Timer On Delay Coil” in Rung 2 will be set and unlatch the previous rung to remove voltage from the motor starter.
96© 2018 Electric Power Research Institute, Inc. All rights reserved.
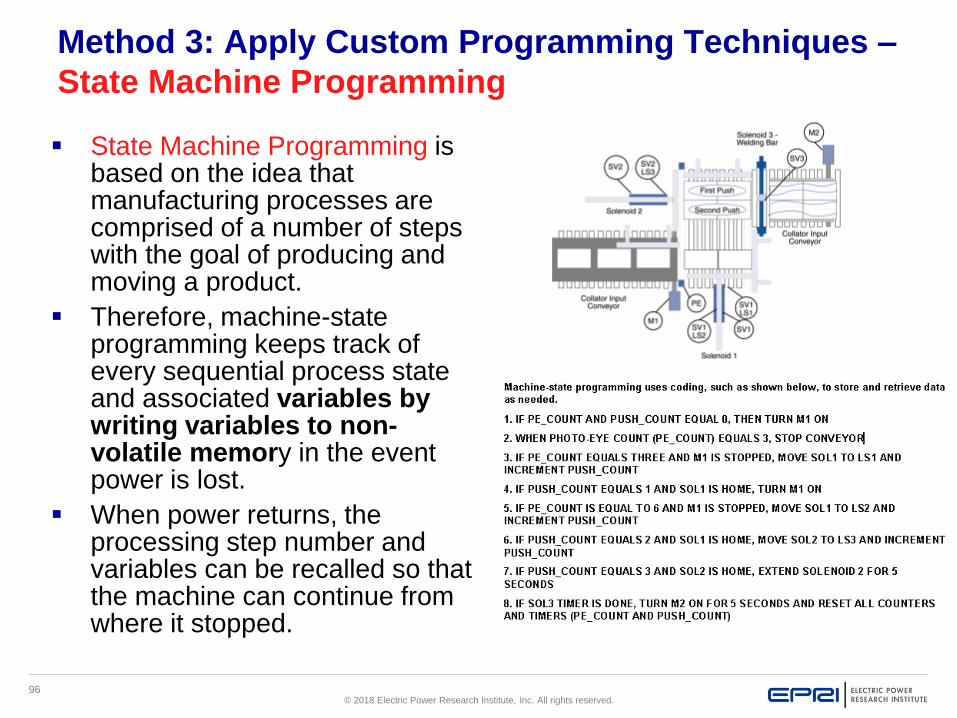
Method 3: Apply Custom Programming Techniques –
State Machine Programming
▪ State Machine Programming is based on the idea that manufacturing processes are comprised of a number of steps with the goal of producing and moving a product.
▪ Therefore, machine-state programming keeps track of every sequential process state and associated variables by writing variables to non-volatile memory in the event power is lost.
▪ When power returns, the processing step number and variables can be recalled so that the machine can continue from where it stopped.
97© 2018 Electric Power Research Institute, Inc. All rights reserved.
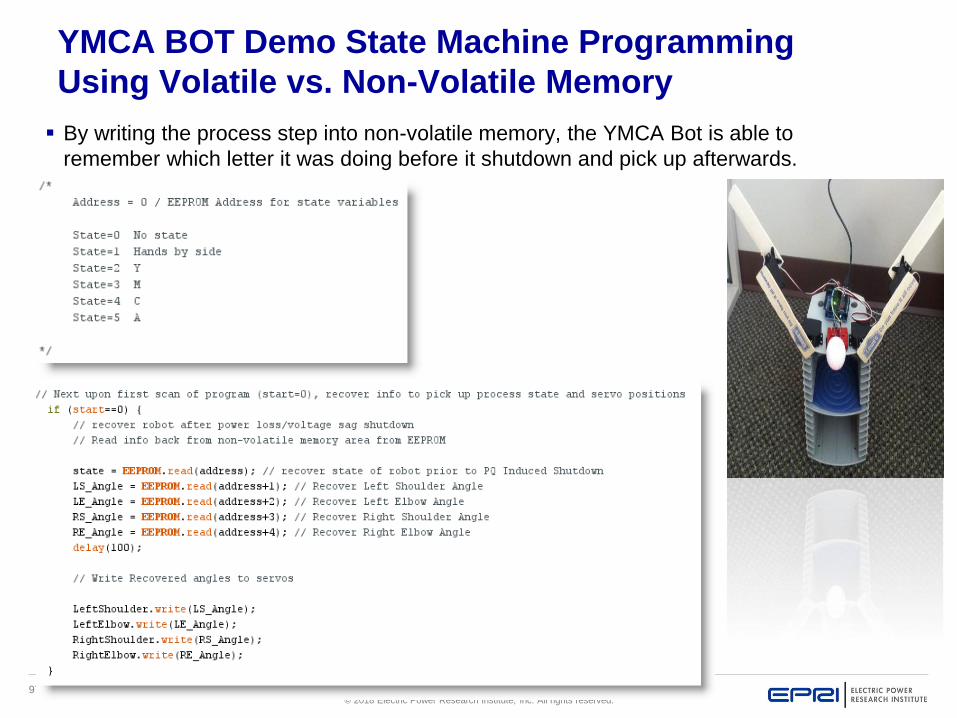
YMCA BOT Demo State Machine Programming
Using Volatile vs. Non-Volatile Memory
▪ By writing the process step into non-volatile memory, the YMCA Bot is able to
remember which letter it was doing before it shutdown and pick up afterwards.
98© 2018 Electric Power Research Institute, Inc. All rights reserved.
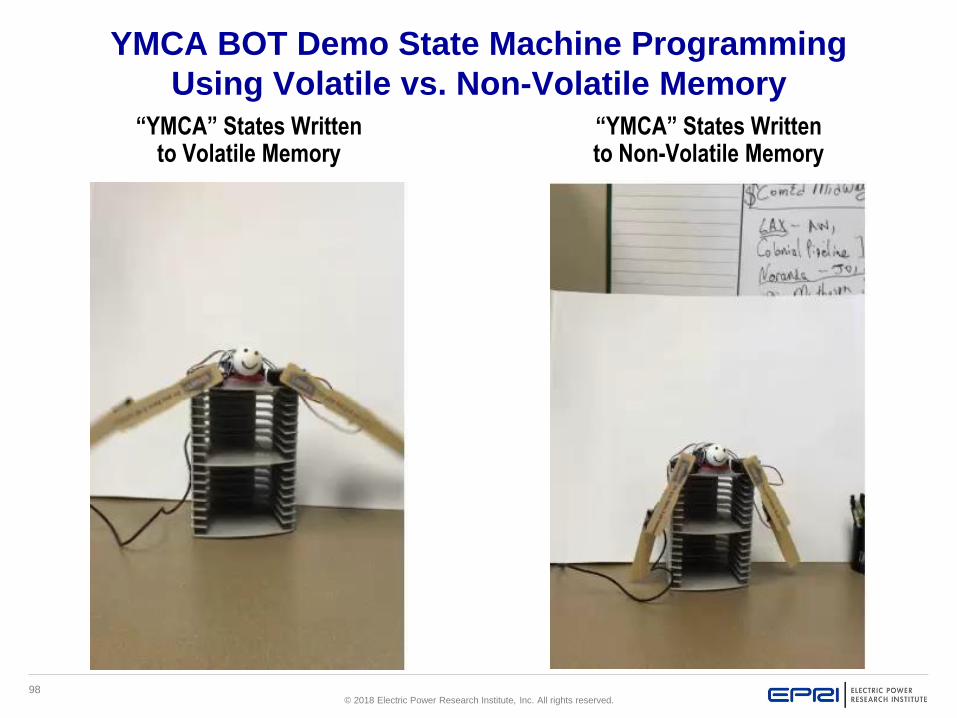
YMCA BOT Demo State Machine Programming
Using Volatile vs. Non-Volatile Memory
“YMCA” States Written to Volatile Memory
“YMCA” States Written to Non-Volatile Memory

99© 2018 Electric Power Research Institute, Inc. All rights reserved.
Method 3: Apply Custom Programming Techniques –
Programming Using Phase/Voltage Sensing Relay
▪A phase monitor or voltage
sensing relay, used in
conjunction with
programming, can also
protect against the effects of
voltage sags.
▪The relay contacts can be
used to run a check on the
system, retrieve past
information stored in
memory, or hold control
parameters constant until
the event is over.
Potential Sensing Devices For Voltage Sags
(Left to Right)
Phase Monitoring Relay
PQ Relay
“Original” PQ Relay (AC Ice Cube)

100© 2018 Electric Power Research Institute, Inc. All rights reserved.
Method 4 – Examine Configuration Settings
▪ A low-cost or perhaps no-cost
method of increasing the
tolerance of AC and DC motor
drives to voltage sags is through
software configuration settings.
▪ This method applies to all types
of drives, including, but not
limited to, AC pulse-width
modulation (PWM), direct-
current, AC-pulse, stepper, and
servo drives.
© 2018 Electric Power Research Institute, Inc. All rights reserved.
Video : Visualizing PQ
Drive Parameters for
Improved Voltage Sag
Ride-Through
Video 1: Visualizing PQ Drive Parameters for Improved Voltage Sag Ride-Through
102© 2018 Electric Power Research Institute, Inc. All rights reserved.
Method 5 – Select Appropriate Trip Curves for
Circuit Breakers
▪ Some equipment, especially equipment with AC-to-DC converters,
may respond to a voltage sag by drawing inrush current when the
voltage supply returns to normal.
▪ During a voltage sag, the AC-to-DC converter capacitors
discharge. At the end of the sag, the sudden presence of full
voltage causes the discharged capacitors to rapidly recharge.
▪ The magnitude of this inrush of current depends on the depth and
duration of the voltage sag. The resulting current transient may be
large enough to trip circuit breakers that have a quick response
time.
▪ Process machines with any type of AC-to-DC converter—such as
DC power supplies, AC or DC variable-speed drives, and servo
drives—can not only cause such transients but may also be
susceptible to breaker trips caused by the transients.

103© 2018 Electric Power Research Institute, Inc. All rights reserved.
Method 6: Control Power Transformer Tap Adjustments
▪ If CPT output voltage is not at rated output:
– Adjust CPT taps up (if available on transformer)
▪ 1) Lower Input Tap (i.e. from 460/480 to 440/460)
▪ 2) Raise Output Tap (i.e. from 110/115 to 115/120)
– Lowers susceptibility of control components to voltage sags by
raising the nominal voltage.
– Check against unloaded condition to insure you do not overvoltage
the control powerA B

104© 2018 Electric Power Research Institute, Inc. All rights reserved.
Method 7: Coordinate Control Power Transformer
Wiring Adjustments
▪Within a process line with multiple control cabinets, the Control Power
Transformers (CPTs) may be derived from various phase-to-phase
combinations and be at various output voltages.
▪ A voltage sag on most any phase combination will cause the line to trip
somewhere.
A-B
A-B
A-B
B-C B-C B-CA-C
105© 2018 Electric Power Research Institute, Inc. All rights reserved.
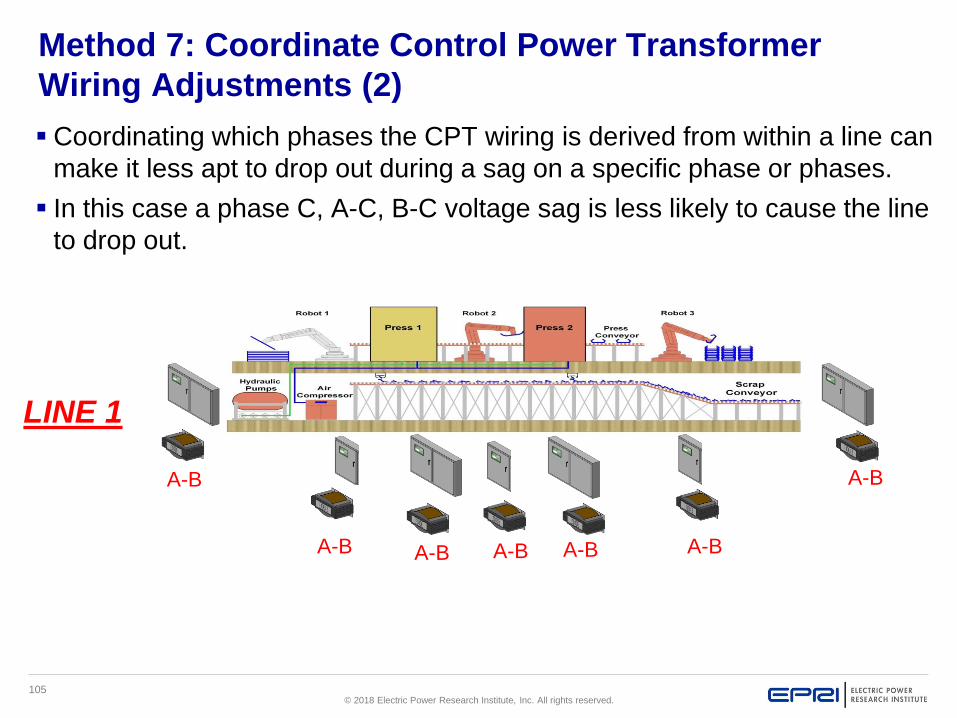
Method 7: Coordinate Control Power Transformer
Wiring Adjustments (2)
▪ Coordinating which phases the CPT wiring is derived from within a line can
make it less apt to drop out during a sag on a specific phase or phases.
▪ In this case a phase C, A-C, B-C voltage sag is less likely to cause the line
to drop out.
A-B
A-B
A-B
A-B A-B A-BA-B
LINE 1
106© 2018 Electric Power Research Institute, Inc. All rights reserved.
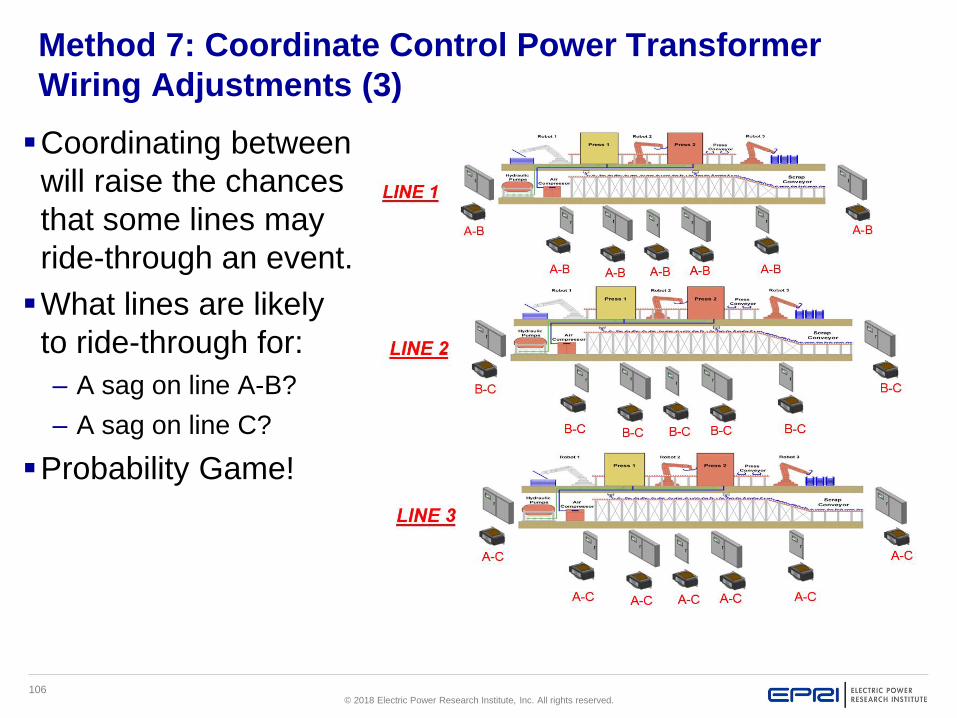
Method 7: Coordinate Control Power Transformer
Wiring Adjustments (3)
▪Coordinating between
will raise the chances
that some lines may
ride-through an event.
▪What lines are likely
to ride-through for:
– A sag on line A-B?
– A sag on line C?
▪Probability Game!
107© 2018 Electric Power Research Institute, Inc. All rights reserved.
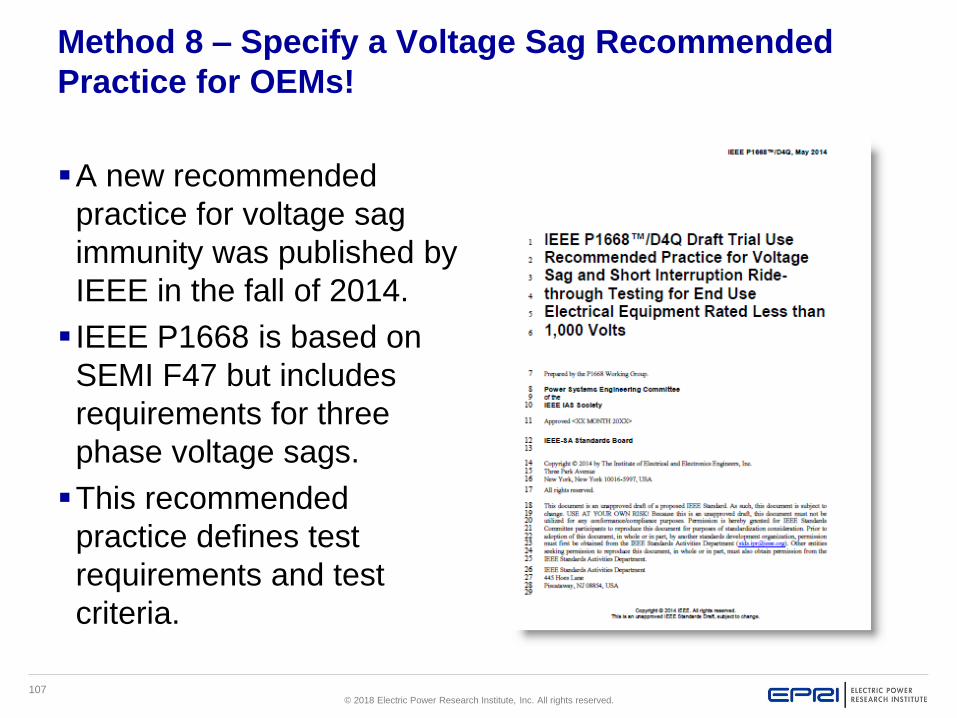
Method 8 – Specify a Voltage Sag Recommended
Practice for OEMs!
▪A new recommended
practice for voltage sag
immunity was published by
IEEE in the fall of 2014.
▪ IEEE P1668 is based on
SEMI F47 but includes
requirements for three
phase voltage sags.
▪This recommended
practice defines test
requirements and test
criteria.

108© 2018 Electric Power Research Institute, Inc. All rights reserved.
IEEE P1668 – User Specs Desired Machine Response
▪ Full (normal) operation – equipment performs as expected or intended and all
of its relevant parameters are within technical specification or within allowed
tolerance limits. Equipment performance should be expressed and measured
against the set of relevant/critical “equipment outputs” (e.g. speed, torque,
voltage level, etc.), which have to be defined as per the process requirements.
▪ Self-recovery – equipment does not perform intended functions, or its outputs
vary outside the technical specification/limits, but equipment is able to
automatically recover after the end of voltage sag event without any
intervention from the user.
▪ Assisted-recovery – equipment does not perform intended functions, or its
outputs vary outside the technical specification/limits, and equipment is not able
to automatically recover after the end of voltage sag event. Assisted-recovery
criteria should be applied only when there are dedicated and/or trained
personnel/staff, who either operate the equipment, or are responsible for
supervising the equipment at all times when equipment is in use. If some
external control circuit is applied for automatic restarting of equipment, this
should be treated as a self-recovery criterion.
© 2018 Electric Power Research Institute, Inc. All rights reserved.
Alden Wright, PE, CEM, CP EnMS
EPRI Industrial PQ and EE Group
4.0 Embedded
Solutions through
targeted power
conditioning
FYI
110© 2018 Electric Power Research Institute, Inc. All rights reserved.
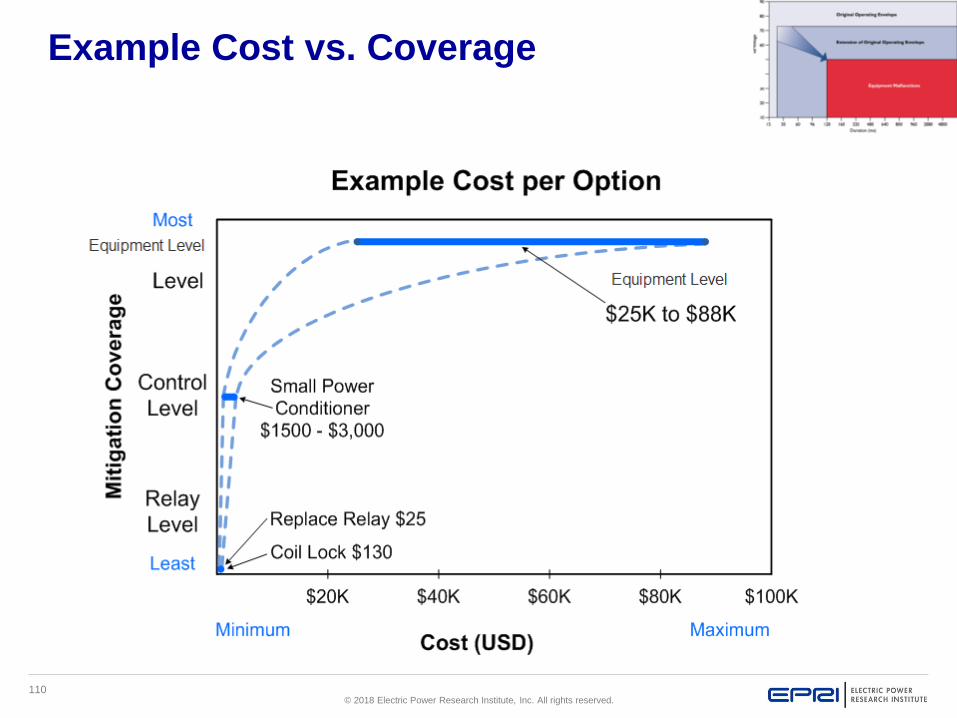
Example Cost vs. Coverage

111© 2018 Electric Power Research Institute, Inc. All rights reserved.
Typical PQ Mitigation Devices
1 f f - f 3 f
3f ProDySC 0% / 2 sec. 30% / 2 sec. 50% / 2 sec. at full load
45% / 30 sec. 45% / 30 sec. 50% / 30 sec.
25% / 30 sec. 25% / 30 sec. 50% / 30 sec.
1f Contrl Ckt PowerRide RTD 0% / 2+ sec.0% A-B, B-C; 70-
80% C-A / 2+ sec.70-80% / 2+ sec. 3-phase Input, 1-phase Output
1f Contrl Ckt MiniDySC0% / 0.05 sec.
50% / 2 sec.n/a n/a
1f Contrl Ckt CVT 40-50% / 2+ sec. n/a n/a
1f Contrl Ckt VDC (6T Model) 37% / 2+ sec. n/a n/a
1f Contrl CktCoil Hold-in (CoilLock
and KnowTrip)25% / 2+ sec. n/a n/a for relays, contactors, motor starters
3fAVC (two rated
models)at full load
Comparison of Power Conditioning Devices
Coverage (Vnom) / DurationApplication Device Notes
3f
3f
1f
1f
1f
1f
1f
1 f f - f 3 f
1-phase Supercapacitor UPS 0% /15 sec.

112© 2018 Electric Power Research Institute, Inc. All rights reserved.
The Premise:
All equipment power users are not ultra-sensitive.
The Plan:
To prop up the single-phase “weak links” only.
The Weak Links:
Small, single-phase 100Vac-230Vac, typically power
supplies, sensors and controls.
The Benefit: Lower Cost than Macro Solutions.
“Selective” Conditioning
113© 2018 Electric Power Research Institute, Inc. All rights reserved.
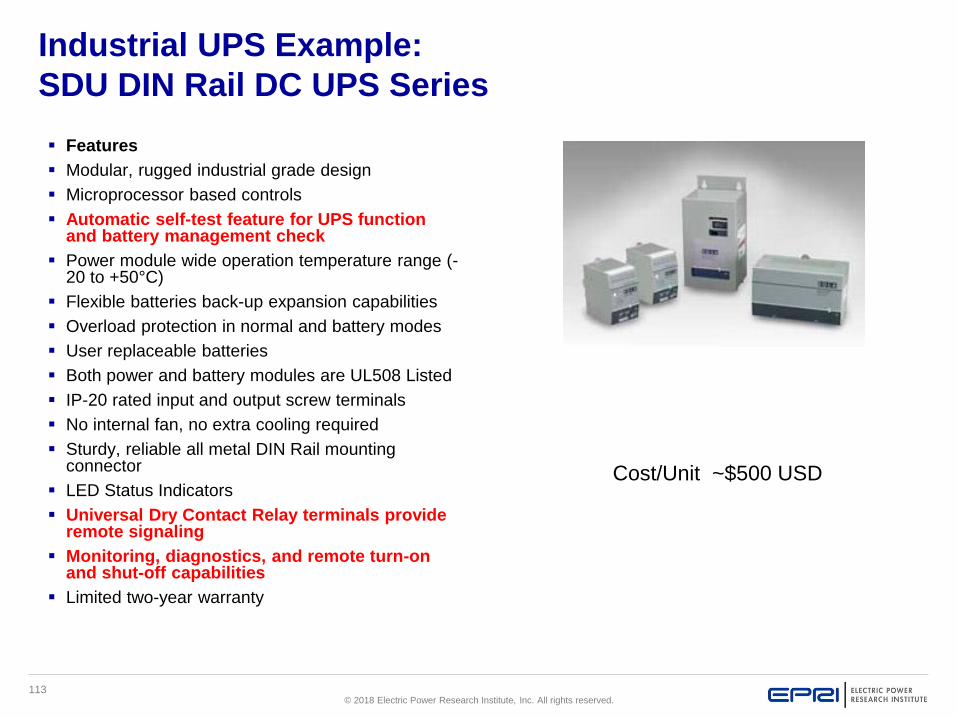
Industrial UPS Example:
SDU DIN Rail DC UPS Series
▪ Features
▪ Modular, rugged industrial grade design
▪ Microprocessor based controls
▪ Automatic self-test feature for UPS function and battery management check
▪ Power module wide operation temperature range (-20 to +50°C)
▪ Flexible batteries back-up expansion capabilities
▪ Overload protection in normal and battery modes
▪ User replaceable batteries
▪ Both power and battery modules are UL508 Listed
▪ IP-20 rated input and output screw terminals
▪ No internal fan, no extra cooling required
▪ Sturdy, reliable all metal DIN Rail mounting connector
▪ LED Status Indicators
▪ Universal Dry Contact Relay terminals provide remote signaling
▪ Monitoring, diagnostics, and remote turn-on and shut-off capabilities
▪ Limited two-year warranty
Cost/Unit ~$500 USD

114© 2018 Electric Power Research Institute, Inc. All rights reserved.
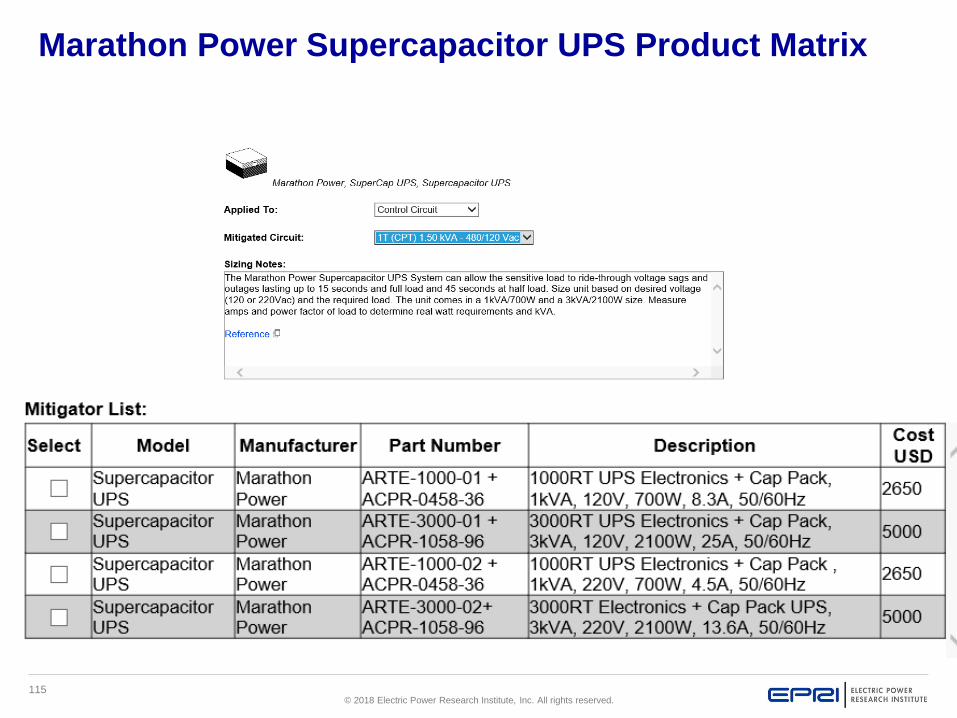
Supercapacitor UPS▪ New Product from Marathon
Power
▪ “Batteryless” UPS
▪ Supercapacitors store energy
▪ 3kVA, 2100 W
▪ 120V, 208V, 230V models
▪ Interruption Coverage:
– 15 seconds at full load
– 45 seconds at ½ load
15 to 45 Seconds @
Full Load
115© 2018 Electric Power Research Institute, Inc. All rights reserved.
Marathon Power Supercapacitor UPS Product Matrix
116© 2018 Electric Power Research Institute, Inc. All rights reserved.
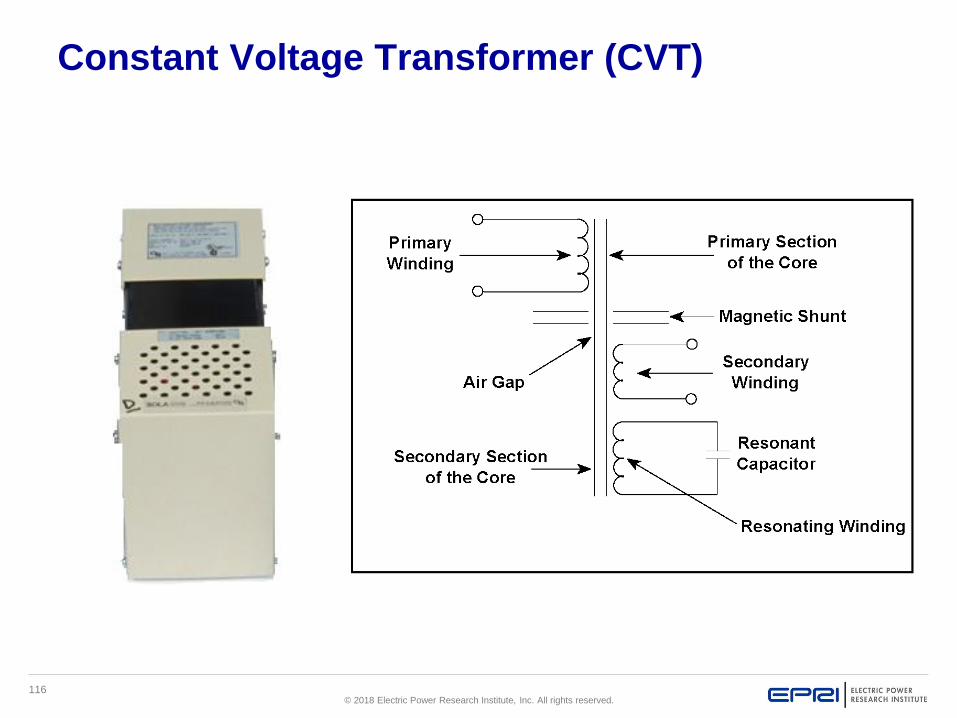
Constant Voltage Transformer (CVT)

117© 2018 Electric Power Research Institute, Inc. All rights reserved.
CVT Application & Features
▪On-line Device. In-Rush Current
of load(s) MUST be considered in
sizing.
▪Output of CVT can collapse when
in-rush current gets close too high
( around 4 x rated size).
▪ Sub-Cycle Response.
▪ Should be oversized to at least 2
times nominal of load to increase
ride-through.
▪ Acts as an isolation transformer
and protects against voltage
sags.In
pu
t V
olt
age
Ou
tpu
t V
olt
age

118© 2018 Electric Power Research Institute, Inc. All rights reserved.
Example Control Level Solution Application
▪The CVT is protecting only
the AC control components
means that the selected
power conditioner will be
more affordable than one
that could protect the entire
machine.
▪The ride though of the AC
drives in this example can
be enhanced by modifying
their programming, thus
eliminating the need for a
large power conditioner.
▪However, “run” signal to
drives must be maintained
119© 2018 Electric Power Research Institute, Inc. All rights reserved.
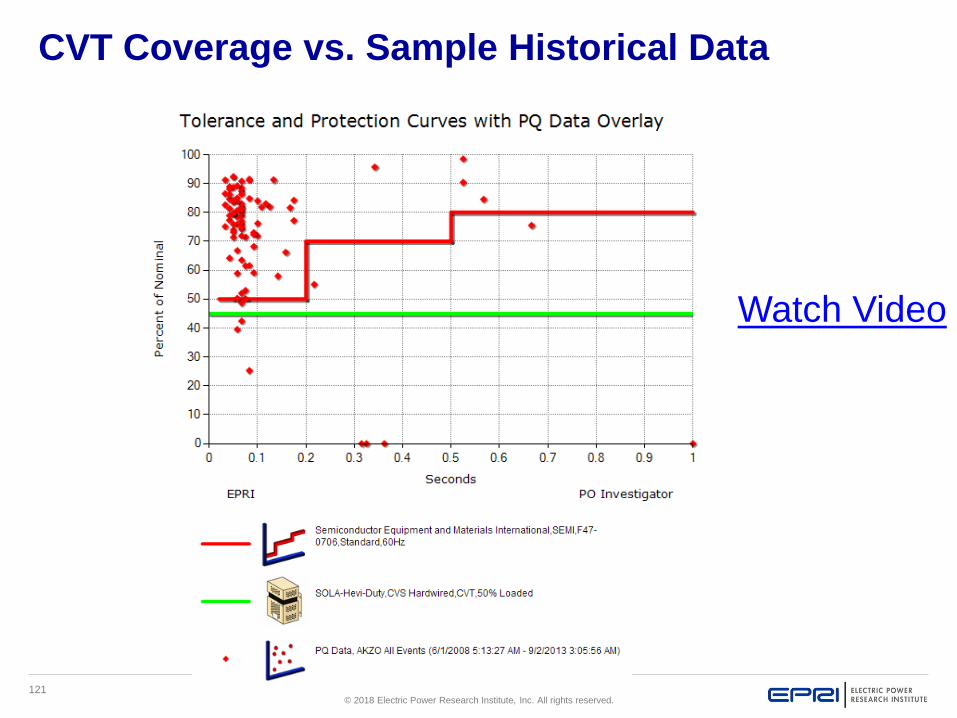
Sizing Notes for CVT
▪ In order to get the best voltage sag ride-through, size a CVT
to 2.5 X Nominal Load VA.
– This does not always mean just doubling the CPT size. If you are
specifying a CVT > 3KVA look at the application closely. These units
get very large and require significant mounting brackets.
▪Also make sure that the load inrush is less than 1/2 Max
Inrush of chosen CVT.
– If it exceeds that value, upsize such that the chosen CVT VA size is at
least 1/2 Max Inrush.
▪Remember since the CVT has multiple taps, if the
application as a Control Power Transformer (CPT), it may be
possible to replace the CPT with the CVT. Otherwise, tap it
in a 1:1 input/output configuration.
120© 2018 Electric Power Research Institute, Inc. All rights reserved.
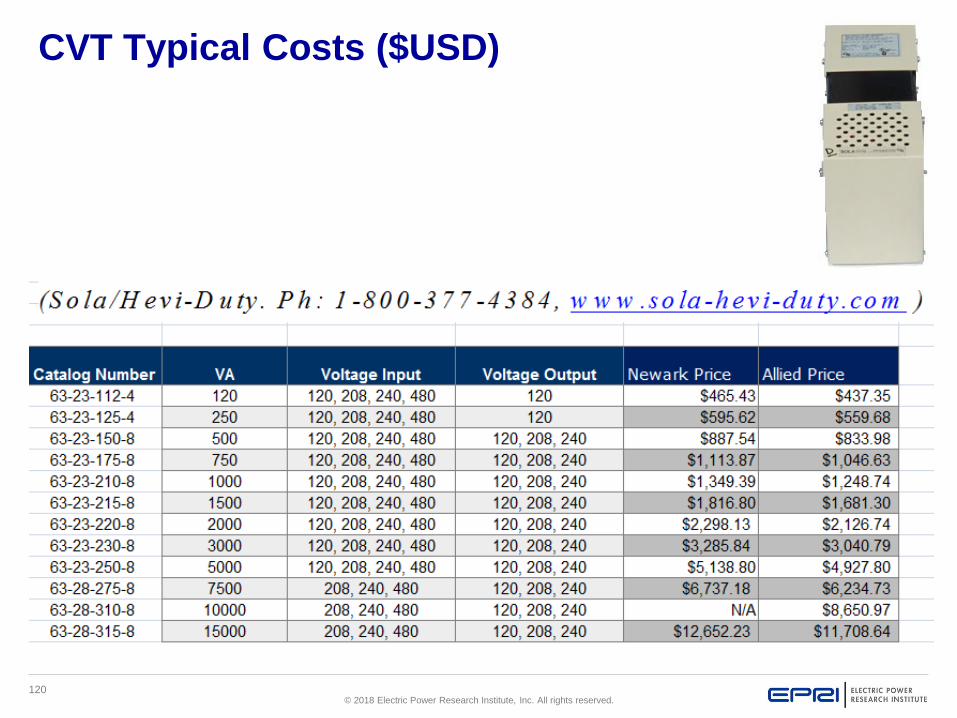
CVT Typical Costs ($USD)
121© 2018 Electric Power Research Institute, Inc. All rights reserved.
CVT Coverage vs. Sample Historical Data
Watch Video

122© 2018 Electric Power Research Institute, Inc. All rights reserved.
Example CVT Application to Avoid: 400VA control power
transformer and a NEMA type 6 starter
<400 <1000
4860
40.5120
120<3.3
2,430
3kVA Closest Size
$3,300 List

123© 2018 Electric Power Research Institute, Inc. All rights reserved.
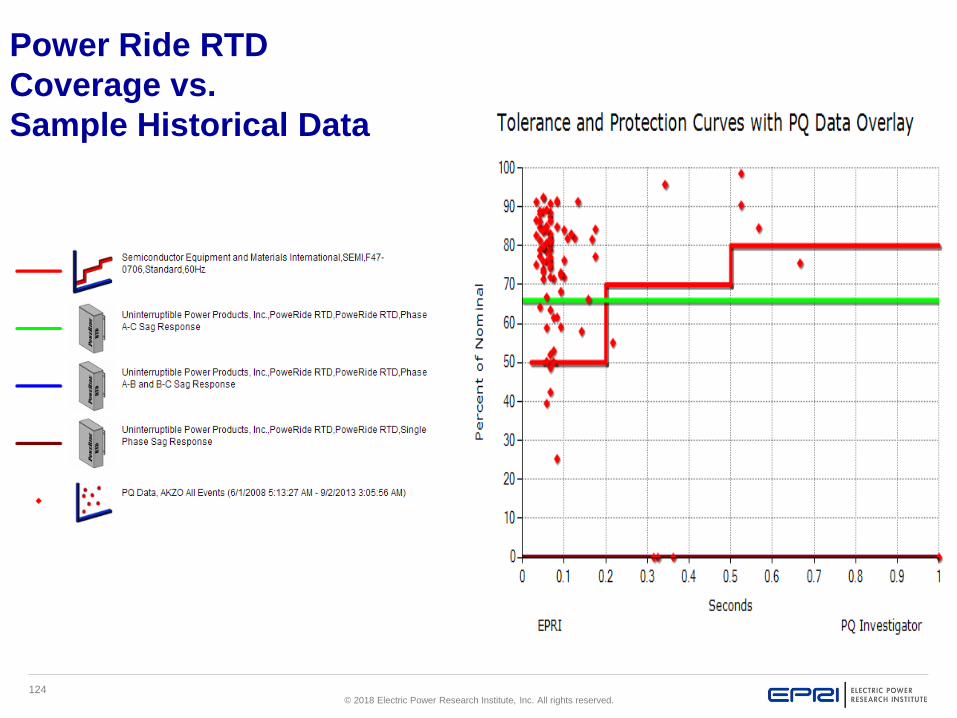
UPPI PowerRide RTD: CVT on STEROIDS
Power Anomaly Result
Loss of Phase A Output remains constant
Loss of Phase B Output remains constant
Loss of Phase C Output remains constant
Loss of Phase A and B -
33% sag on remaining phase
Output remains constant
Loss of Phase B and C -
33% sag on remaining phase
Output remains constant
Loss of Phase A and C Output goes to 0
Loss of A and 33% Sag on C Output remains constant
Loss of C and 33% Sag on A Output remains constant
37% Sag on A and C Output remains constant
No need to oversize by factor of 2.5
Apply same Inrush caution as with Standard CVT.
124© 2018 Electric Power Research Institute, Inc. All rights reserved.
Power Ride RTD
Coverage vs.
Sample Historical Data
125© 2018 Electric Power Research Institute, Inc. All rights reserved.
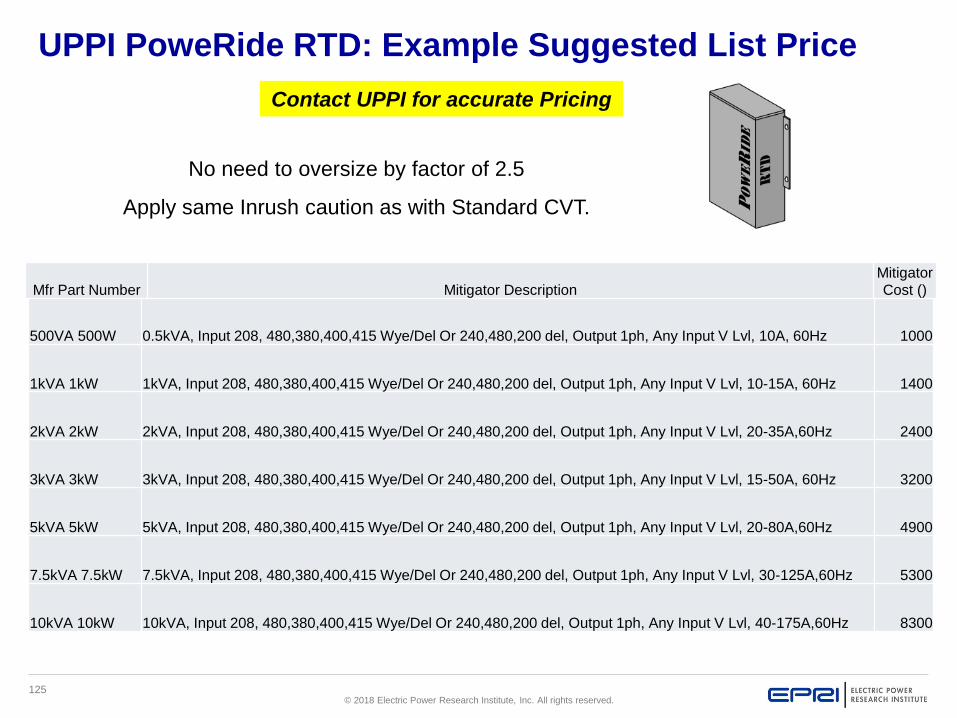
UPPI PoweRide RTD: Example Suggested List Price
http://www.uppi-ups.com
Contact UPPI for accurate Pricing
500VA 500W 0.5kVA, Input 208, 480,380,400,415 Wye/Del Or 240,480,200 del, Output 1ph, Any Input V Lvl, 10A, 60Hz 1000
1kVA 1kW 1kVA, Input 208, 480,380,400,415 Wye/Del Or 240,480,200 del, Output 1ph, Any Input V Lvl, 10-15A, 60Hz 1400
2kVA 2kW 2kVA, Input 208, 480,380,400,415 Wye/Del Or 240,480,200 del, Output 1ph, Any Input V Lvl, 20-35A,60Hz 2400
3kVA 3kW 3kVA, Input 208, 480,380,400,415 Wye/Del Or 240,480,200 del, Output 1ph, Any Input V Lvl, 15-50A, 60Hz 3200
5kVA 5kW 5kVA, Input 208, 480,380,400,415 Wye/Del Or 240,480,200 del, Output 1ph, Any Input V Lvl, 20-80A,60Hz 4900
7.5kVA 7.5kW 7.5kVA, Input 208, 480,380,400,415 Wye/Del Or 240,480,200 del, Output 1ph, Any Input V Lvl, 30-125A,60Hz 5300
10kVA 10kW 10kVA, Input 208, 480,380,400,415 Wye/Del Or 240,480,200 del, Output 1ph, Any Input V Lvl, 40-175A,60Hz 8300
No need to oversize by factor of 2.5
Apply same Inrush caution as with Standard CVT.
Mfr Part Number Mitigator Description
Mitigator
Cost ()

126© 2018 Electric Power Research Institute, Inc. All rights reserved.
Dip Proofing Inverter
▪ Electrolytic Capacitor Based UPS
▪ Square-Wave Output
▪ Sizing:
1. Determine Control Voltage Requirement
2. Determine Overall KVA/Current Requirements of Load
3. Measure Real Power Load Requirements (Watts)
4. Select Matching from of Product Matrix and note “Joules” of energy available
5. Calculate to determine ride-through time in seconds…
Ride-Through Time = Joules Available/Control Load Watts
6. If sufficient, you are done.*
7. If more ride-through desired, select next largest kVA product and redo steps 4-6.
*Note: You can adjust
• Ride-Through Time Down by changing dip switch settings.
• Transfer Level from 50 to 80%, 90% special order

127© 2018 Electric Power Research Institute, Inc. All rights reserved.
DPI Output
Inp
ut V
olt
age
Ou
tpu
t V
olt
age
•1-3 second ride-through based on real power required and sizing.
Square Wave not compatible with some PLC AC Input Cards.

128© 2018 Electric Power Research Institute, Inc. All rights reserved.
DPI Coverage vs. Sample Historical Data
Watch Video

129© 2018 Electric Power Research Institute, Inc. All rights reserved.
DPI Product Matrix
MitigatorModel Manufacturer Mfr Part Number MitigatorDescription Mitigator Cost ()
DPI
Dip Proofing
Technologies DPI53S6.6mF120V2A DPI, 0.25kVA, 120V, 2A, 31J, 50/60Hz 1500
DPI
Dip Proofing
Technologies DPI53S13.2mF120V4A DPI, 0.5kVA, 120V, 4A, 68J, 50/60Hz 1900
DPI
Dip Proofing
Technologies DPI53S19.8mF120V6A DPI, 0.75kVA, 120V, 6A, 103J, 50/60Hz 2400
DPI
Dip Proofing
Technologies DPI53S39.6mF120V8A DPI, 1kVA, 120V, 8A, 217J, 50/60Hz 2800
DPI
Dip Proofing
Technologies DPI54L33mF120V25A DPI, 3kVA, 120V, 25A, 181J, 50/60Hz 3200
DPI
Dip Proofing
Technologies DPI54L66mF120V25A DPI, 3kVA, 120V, 25A, 371J, 50/60Hz 3800
DPI
Dip Proofing
Technologies DPI54L99mF120V25A DPI, 3kVA, 120V, 25A, 556J, 50/60Hz 4200
DPI
Dip Proofing
Technologies DPI53S2.04mF230V2A DPI, 0.46kVA, 208 or 230V, 2A, 910J@230V, 50/60Hz 1500
DPI
Dip Proofing
Technologies DPI53S4.08mF230V4A DPI, 0.92kVA, 208 or 230V, 4A, 1820J@230V, 50/60Hz 1900
DPI
Dip Proofing
Technologies DPI53S6.120mF230V6A DPI, 1.38kVA, 208 or 230V, 6A, 273J@230V, 50/60Hz 2400
DPI
Dip Proofing
Technologies DPI53S12.24mF230V8A DPI, 1.84kVA, 208 or 230V, 8A, 584J@230V, 50/60Hz 2800
DPI
Dip Proofing
Technologies DPI54L15mF230V25A DPI, 5.75kVA, 208 or 230V, 25A, 373J@230V, 50/60Hz 3200
DPI
Dip Proofing
Technologies DPI54L30mF230V25A DPI, 5.75kVA, 208 or 230V, 25A, 746J@230V, 50/60Hz 3800
DPI
Dip Proofing
Technologies DPI54L45mF230V25A DPI, 5.75kVA, 208 or 230V, 25A, 1.2kJ@230V, 50/60Hz 4200
DPI
Dip Proofing
Technologies DPI54L90mF230V25A DPI, 5.75kVA, 208 or 230V, 25A, 2.2kJ@230V, 50/60Hz 5900
130© 2018 Electric Power Research Institute, Inc. All rights reserved.
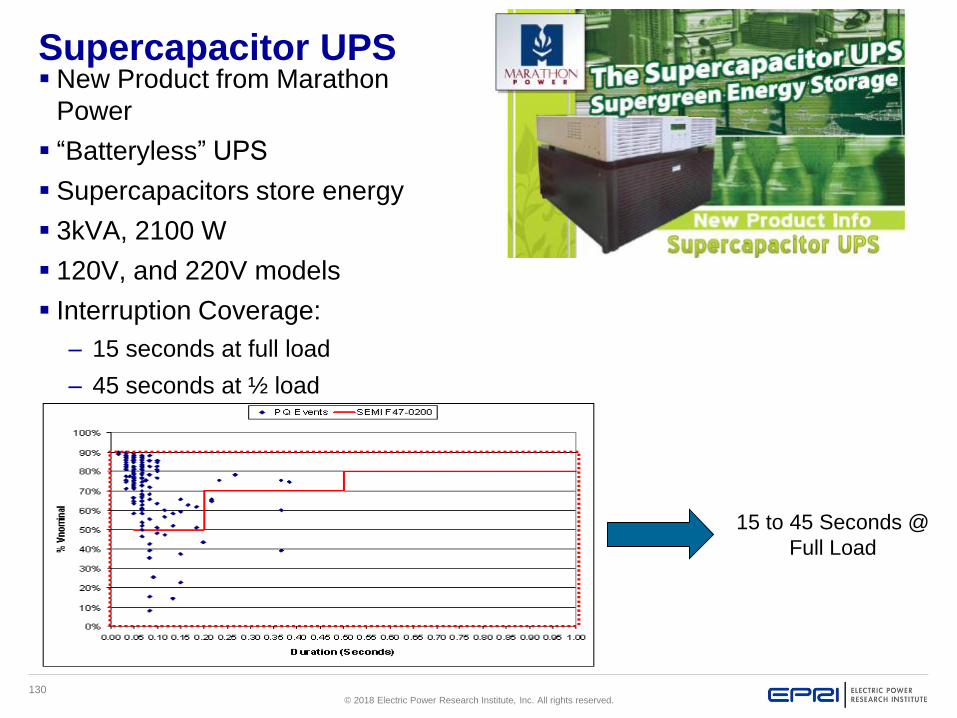
Supercapacitor UPS▪ New Product from Marathon
Power
▪ “Batteryless” UPS
▪ Supercapacitors store energy
▪ 3kVA, 2100 W
▪ 120V, and 220V models
▪ Interruption Coverage:
– 15 seconds at full load
– 45 seconds at ½ load
15 to 45 Seconds @
Full Load

131© 2018 Electric Power Research Institute, Inc. All rights reserved.
Voltage Dip Compensator (Vdc)
▪ No batteries; no maintenance.
▪ Fast compensation.
▪ Able to withstand high inrush currents.
▪ Small footprint, easy to retrofit.
▪ Support exceeds SEMI F47 standard requirements.
▪ Handles inductive and low power factor loads.
▪ 120Vac and 208Vac Models

132© 2018 Electric Power Research Institute, Inc. All rights reserved.
VDC Output
Product by Dip Proofing Technologies
www.dipproof.com
www.measurlogic.com
AC Output is a Sine Wave
instead of a Square Wave

133© 2018 Electric Power Research Institute, Inc. All rights reserved.
VDC Coverage (4T Model) vs. Sample Historical Data
WATCH VIDEO
134© 2018 Electric Power Research Institute, Inc. All rights reserved.
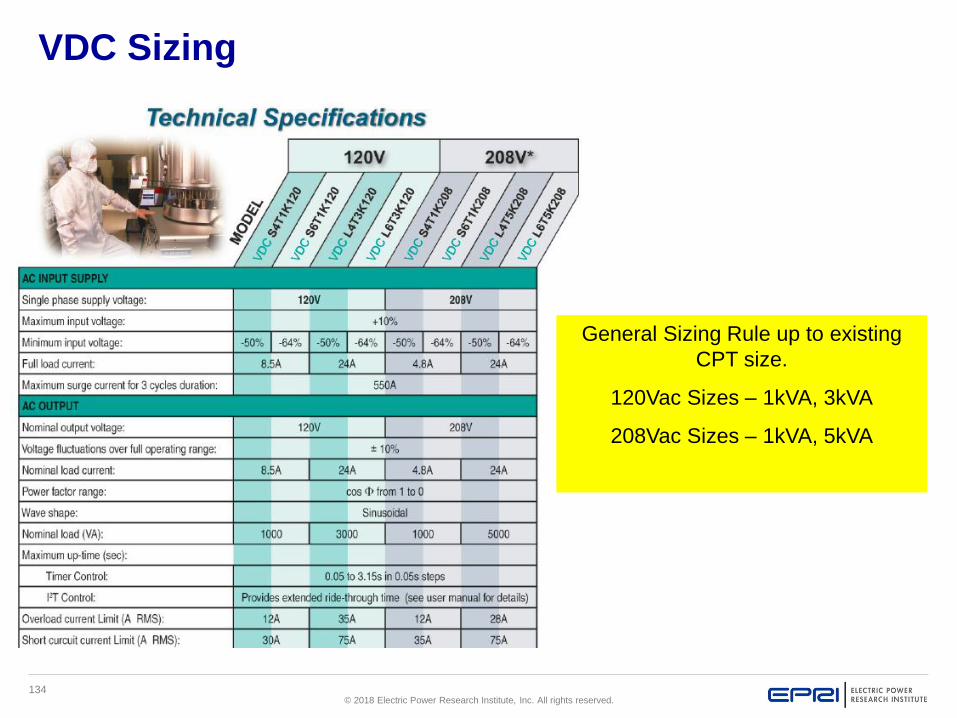
VDC Sizing
General Sizing Rule up to existing
CPT size.
120Vac Sizes – 1kVA, 3kVA
208Vac Sizes – 1kVA, 5kVA
135© 2018 Electric Power Research Institute, Inc. All rights reserved.
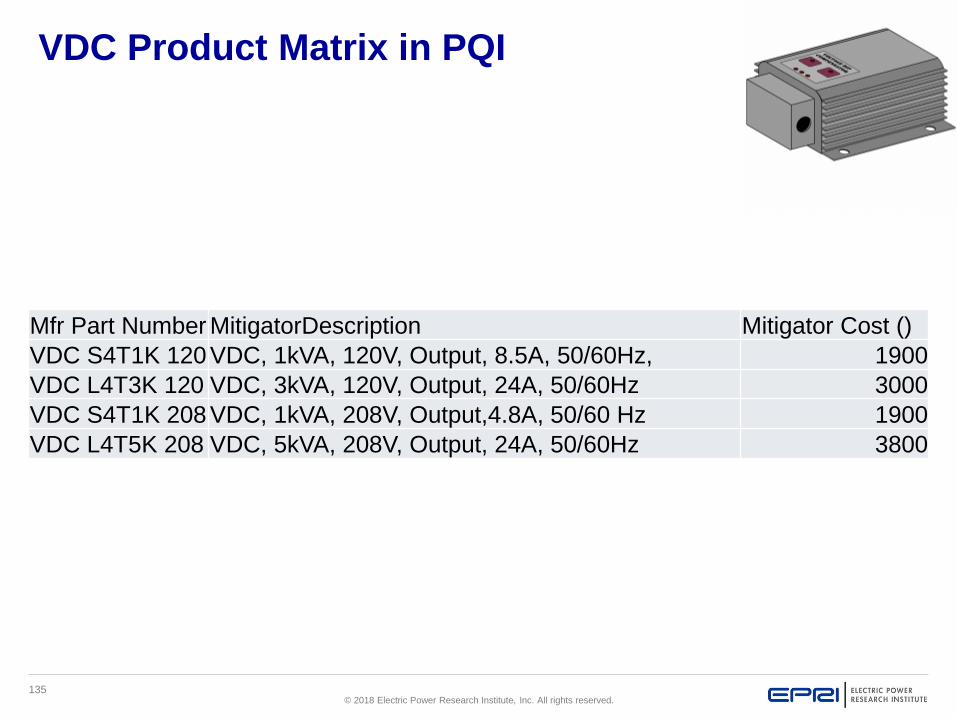
VDC Product Matrix in PQI
Mfr Part Number MitigatorDescription Mitigator Cost ()
VDC S4T1K 120 VDC, 1kVA, 120V, Output, 8.5A, 50/60Hz, 1900
VDC L4T3K 120 VDC, 3kVA, 120V, Output, 24A, 50/60Hz 3000
VDC S4T1K 208 VDC, 1kVA, 208V, Output,4.8A, 50/60 Hz 1900
VDC L4T5K 208 VDC, 5kVA, 208V, Output, 24A, 50/60Hz 3800

136© 2018 Electric Power Research Institute, Inc. All rights reserved.
Dynamic Sag Corrector
▪ Draws power from remaining
sagged voltage down to 50% of
nominal voltage, and injects a
series voltage to regulate a
sinusoidal output voltage
▪ Below 50%, draws power from
internal storage capacitors
▪Mega and Pro DySC have on
board event logging.
MiniDySC
Single-Phase Protection
1-50 Amps
ProDySC
Three-Phase Protection
25-200Amps
MegaDySC
Three-Phase Protection
400-3200Amps

137© 2018 Electric Power Research Institute, Inc. All rights reserved.
Example DySC Output
Input Voltage (Van)
Missing Volts
DySC Output Voltage

138© 2018 Electric Power Research Institute, Inc. All rights reserved.
Single Phase DySC Topology
LOAD
Static Bypass Switch• On under normal conditions• Highly efficient (>99%)
Voltage-doubling Rectifier• Each dc capacitor charged to
peak of AC source voltage• Idle under normal conditions• Supplies power to inverter at
dc bus during sag correction
Half-bridge Inverter• Idle under normal conditions• Sinusoidal 12 kHz PWM switching
during sag correction• Acts as an AC voltage source
between points A and B, supplying only the missing voltage
Notes• The unique DySC circuit utilizes the same
capacitors for two functions: rectifier and inverter• More “ER” dc capacitors can be added for longer run time
when input voltage <50%. • Series connected inverter requires current path through
AC source.
A B

139© 2018 Electric Power Research Institute, Inc. All rights reserved.
DySC Operation
▪Normal Conditions:
– Capacitors remained fully charged, idle, with no ripple current heating
– Output (load) voltage is continuously monitored
– Output voltage phase and frequency are tracked
▪Sag Condition:
– A voltage sag is detected at the output of the DySC
– Inverter IGBTs apply a reverse voltage to the conducting SCR to
quickly force it off (commutate it)
– Inverter regulates the DySC output voltage to produce a sinusoidal
output voltage
– When input line rms voltage is restored to >90% for one cycle, the
SCRs are turned on and the inverter is shut off
– Capacitors recharge to normal condition within a few cycles

140© 2018 Electric Power Research Institute, Inc. All rights reserved.
Example: MiniDySC 60% sag correction
Voltage sag Correction
• DC voltage is sufficient to correct voltage sags if input line voltage remains ≥ 50%.
• Stored Energy in capacitors is not needed unless input drops below 50%.
• Correction for up to 5 seconds or 2 seconds cumulative every minute (design limits).
Example: voltage sag to 60% remaining voltage, at full load
• Power in = Power out = Load power (determined by load)= (voltage) x (current)
• Load voltage remains 100%, load current remains 100%• Input voltage dip to 60% causes input current 167% of load• Load energy comes from the AC source, not capacitors
100%
67%
167%
167%
100%
100%
V = 100%V = 60%
(V = 40%)
LOAD
V = 100%

141© 2018 Electric Power Research Institute, Inc. All rights reserved.
Mini-DySC Ride-Through Capability
100%
.001
50%
0%
.01 101.0.10 5.0
SR ER
50ms 200ms
• Ride-Through Times: (Based
on 100% load, 0.7PF at 60Hz
line frequency)
• Standard Runtime (SR) is 5
seconds for sags from 87% to
50% of nominal voltage every
60 seconds
• 3 cycles for Standard Outage
units from 50%-100% (zero
voltage remaining)
• 12 cycles for Extended Ride-
Through (ER) units from 50%-
100% (zero voltage
remaining)
Nom
inal In
put
Voltage (
%)
Duration/Time (Seconds)
SR

142© 2018 Electric Power Research Institute, Inc. All rights reserved.
MiniDySC Coverage vs.Sample Historical Data
Static Series Compensator with
Stored Energy Supply >
Coverage out to 5 seconds
WATCH VIDEO

143© 2018 Electric Power Research Institute, Inc. All rights reserved.
MiniDySC Product
Matrix
http://ab.rockwellautomation.com/Power-
Supplies/Voltage-Sag-Protector
Size to CPT or if fed from CB
or Fuse:
(Rated Voltage x Fuse/CB
Size) x 0.8.
Pay careful attention to load
inrush for units 6A and Below.
Mfr Part Number MitigatorDescription
Mitigator Cost
()
1608N-002A120V2E MiniDySC - 1Ph , 0.24kVA, 2 A, 120 VAC, L-N, Extended, 50/60Hz 1650
1608N-002A120V2S MiniDySC - 1Ph , 0.24kVA 2 A, 120 VAC, L-N, Standard, 50/60Hz 1200
1608N-006A120V2E MiniDySC - 1Ph ,0.72kVA, 6 A, 120 VAC, L-N, Extended, 50/60Hz 2300
1608N-006A120V2S MiniDySC - 1Ph , 0.72kVA, 6 A, 120 VAC, L-N, Standard, 50/60Hz 1800
1608N-012A120V2S MiniDySC - 1Ph , 1.44kVA, 12 A, 120 VAC, L-N, Standard, 50/60Hz 2500
1608N-012A120V2S-R
MiniDySC - 1Ph , 1.44kVA, 12 A, 120 VAC, L-N, Standard, Rack Mount,
50/60Hz 2700
1608N-025A120V2E MiniDySC - 1Ph , 3kVA, 25 A, 120 VAC, L-N, Extended, 50/60Hz 3600
1608N-025A120V2S MiniDySC - 1Ph , 3kVA, 25 A, 120 VAC, L-N, Standard, 50/60Hz 2700
1608N-050A120V2E MiniDySC - 1Ph , 6kVA, 50 A, 120 VAC, L-N, Extended, 50/60Hz 6800
1608N-050A120V2S MiniDySC - 1Ph , 6kVA, 50 A, 120 VAC, L-N, Standard, 50/60Hz 4400
1608N-002A208V1E MiniDySC - 1Ph , 0.42kVA, 2 A, 208 VAC, L-L, Extended, 50/60Hz 2200
1608N-002A208V1S MiniDySC - 1Ph , 0.42kVA, 2 A, 208 VAC, L-L, Standard, 50/60Hz 1600
1608N-003A208V1E MiniDySC - 1Ph , 0.62kVA, 3 A, 208 VAC, L-L, Extended, 50/60Hz 2400
1608N-003A208V1S MiniDySC - 1Ph , 0.62kVA, 3 A, 208 VAC, L-L, Standard, 50/60Hz 1800
1608N-012A208V1S MiniDySC - 1Ph , 2.5kVA, 12 A, 208 VAC, L-L, Standard, 50/60Hz 3300
1608N-025A208V1E MiniDySC - 1Ph , 5.2kVA, 25 A, 208 VAC, L-L, Extended, 50/60Hz 4800
1608N-025A208V1S MiniDySC - 1Ph ,5.2kVA, 25 A, 208 VAC, L-L, Standard, 50/60Hz 3700
1608N-050A208V1E MiniDySC - 1Ph ,10.4kVA, 50 A, 208 VAC, L-L, Extended, 50/60Hz 9100
1608N-050A208V1S MiniDySC - 1Ph ,10.4kVA, 50 A, 208 VAC, L-L, Standard, 50/60Hz 5900
1608N-012A220V2S MiniDySC - 1Ph ,2.64kVA, 12 A, 220 VAC, L-N, Standard, 50/60Hz 3300
1608N-025A220V2E MiniDySC - 1Ph ,5.5kVA, 25 A, 220 VAC, L-N, Extended, 50/60Hz 4700
1608N-025A220V2S MiniDySC - 1Ph ,5.5kVA, 25 A, 220 VAC, L-N, Standard, 50/60Hz 3600
1608N-050A220V2E MiniDySC - 1Ph ,11kVA, 50 A, 220 VAC, L-N, Extended, 50/60Hz 9100
1608N-050A220V2S MiniDySC - 1Ph ,11kVA, 50 A, 220 VAC, L-N, Standard, 50/60Hz 5900
1608N-003A230V2E MiniDySC - 1Ph ,0.69kVA, 3 A, 230 VAC, L-N, Extended, 50/60Hz 2400
1608N-003A230V2S MiniDySC - 1Ph ,0.69kVA, 3 A, 230 VAC, L-N, Standard, 50/60Hz 1800
1608N-012A230V2S MiniDySC - 1Ph ,2.76kVA, 12 A, 230 VAC, L-N, Standard, 50/60Hz 3300
1608N-025A230V2E MiniDySC - 1Ph ,5.75kVA, 25 A, 230 VAC, L-N, Extended, 50/60Hz 4800
1608N-025A230V2S MiniDySC - 1Ph ,5.75kVA, 25 A, 230 VAC, L-N, Standard, 50/60Hz 3600
1608N-050A230V2E MiniDySC - 1Ph ,11.5kVA, 50 A, 230 VAC, L-N, Extended, 50/60Hz 9100
1608N-050A230V2S MiniDySC - 1Ph ,11.5kVA, 50 A, 230 VAC, L-N, Standard, 50/60Hz 5900
1608N-002A240V1E MiniDySC - 1Ph ,0.48kVA, 2 A, 240 VAC, L-L, Extended, 50/60Hz 2200
1608N-002A240V1S MiniDySC - 1Ph ,0.48kVA, 2 A, 240 VAC, L-L, Standard, 50/60Hz 1600
1608N-002A240V2E MiniDySC - 1Ph , 0.48kVA, 2 A, 240 VAC, L-N, Extended, 50/60Hz 2200
1608N-002A240V2S MiniDySC - 1Ph , 0.48kVA, 2 A, 240 VAC, L-N, Standard, 50/60Hz 1600
1608N-003A240V1E MiniDySC - 1Ph , 0.72kVA, 3 A, 240 VAC, L-L, Extended, 50/60Hz 2400
1608N-003A240V1S MiniDySC - 1Ph , 0.72kVA, 3 A, 240 VAC, L-L, Standard, 50/60Hz 1800
1608N-003A240V2E MiniDySC - 1Ph , 0.72kVA, 3 A, 240 VAC, L-N, Extended, 50/60Hz 2400
1608N-003A240V2S MiniDySC - 1Ph , 0.72kVA, 3 A, 240 VAC, L-N, Standard, 50/60Hz 1800
1608N-012A240V1S MiniDySC - 1Ph , 2.88kVA, 12 A, 240 VAC, L-L, Standard, 50/60Hz 3300
1608N-012A240V2S MiniDySC - 1Ph , 2.88kVA, 12 A, 240 VAC, L-N, Standard, 50/60Hz 3300
1608N-025A240V1E MiniDySC - 1Ph , 6kVA, 25 A, 240 VAC, L-L, Extended, 50/60Hz 4800
1608N-025A240V1S MiniDySC - 1Ph , 6kVA, 25 A, 240 VAC, L-L, Standard, 50/60Hz 3600
1608N-025A240V2E MiniDySC - 1Ph , 6kVA, 25 A, 240 VAC, L-N, Extended, 50/60Hz 4800
1608N-025A240V2S MiniDySC - 1Ph , 6kVA, 25 A, 240 VAC, L-N, Standard, 50/60Hz 3700
1608N-050A240V1E MiniDySC - 1Ph , 12kVA, 50 A, 240 VAC, L-L, Extended, 50/60Hz 9100
1608N-050A240V1S MiniDySC - 1Ph , 12kVA, 50 A, 240 VAC, L-L, Standard, 50/60Hz 5900
1608N-050A240V2E MiniDySC - 1Ph , 12kVA, 50 A, 240 VAC, L-N, Extended, 50/60Hz 9100
1608N-050A240V2S MiniDySC - 1Ph , 12kVA, 50 A, 240 VAC, L-N, Standard, 50/60Hz 5900

144© 2018 Electric Power Research Institute, Inc. All rights reserved.
• Designed to “Prop Up” individual relays and contactors.
Available at 120, 230 and 480Vac.
• Holds in down to 10 to 20% of %Vnominal.
• Ideal for Motor Control Center Applications.
• Size Based on Voltage and Coil Resistance.
• Cost: less than $130 per unit
Coil Hold-in Devices
CoilLock Low Voltage
Ride Through
Module
145© 2018 Electric Power Research Institute, Inc. All rights reserved.
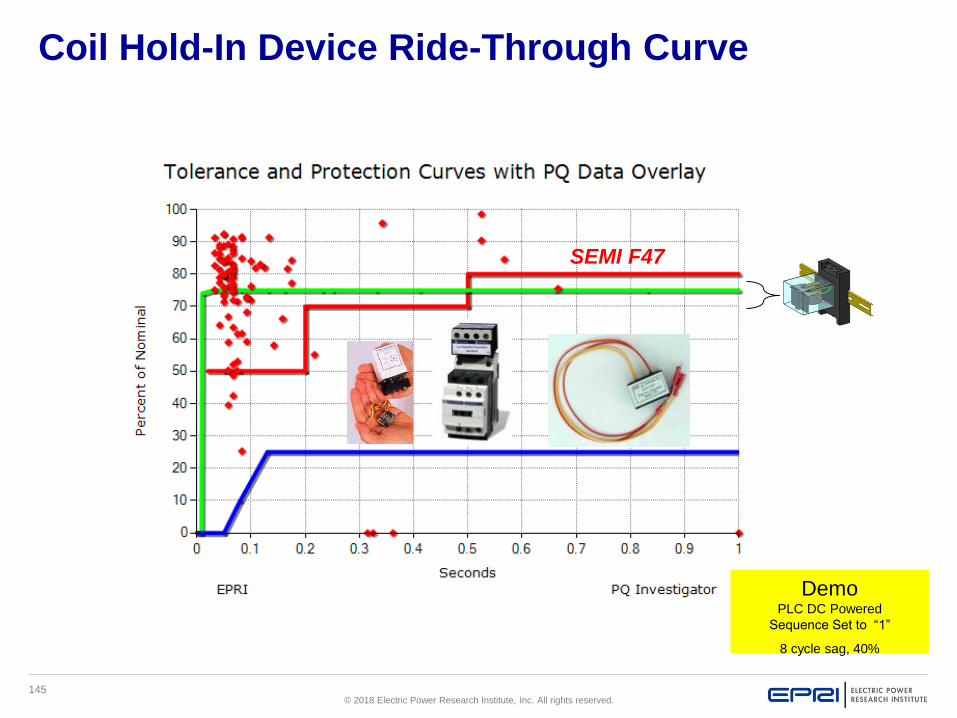
Coil Hold-In Device Ride-Through Curve
SEMI F47
DemoPLC DC Powered
Sequence Set to “1”
8 cycle sag, 40%
146© 2018 Electric Power Research Institute, Inc. All rights reserved.
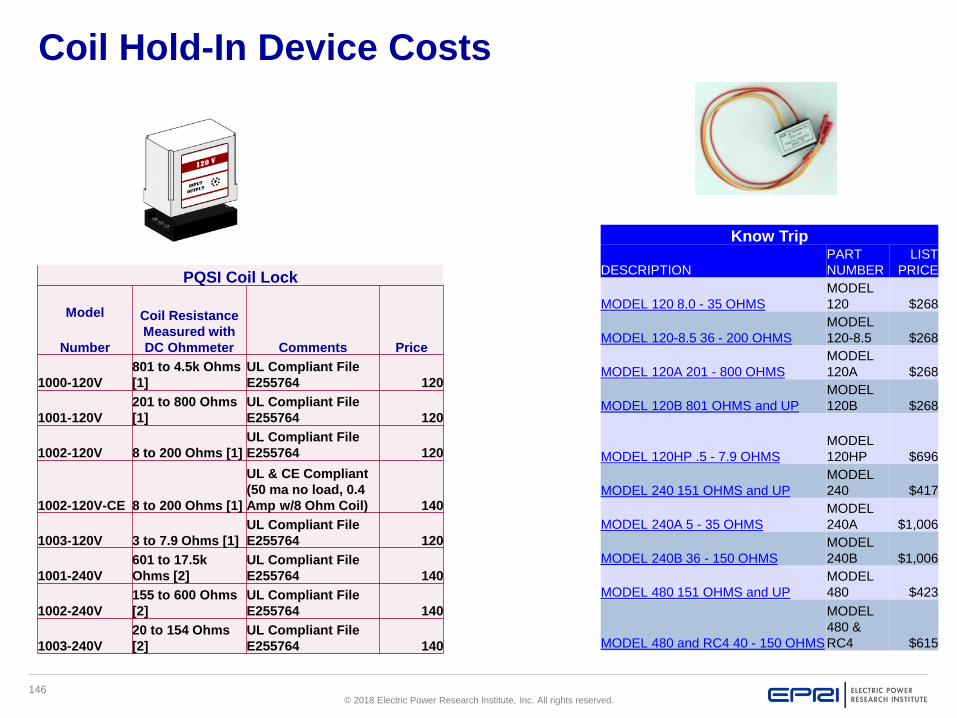
Coil Hold-In Device Costs
PQSI Coil Lock
Model Coil Resistance
Measured with
DC Ohmmeter Comments PriceNumber
1000-120V
801 to 4.5k Ohms
[1]
UL Compliant File
E255764 120
1001-120V
201 to 800 Ohms
[1]
UL Compliant File
E255764 120
1002-120V 8 to 200 Ohms [1]
UL Compliant File
E255764 120
1002-120V-CE 8 to 200 Ohms [1]
UL & CE Compliant
(50 ma no load, 0.4
Amp w/8 Ohm Coil) 140
1003-120V 3 to 7.9 Ohms [1]
UL Compliant File
E255764 120
1001-240V
601 to 17.5k
Ohms [2]
UL Compliant File
E255764 140
1002-240V
155 to 600 Ohms
[2]
UL Compliant File
E255764 140
1003-240V
20 to 154 Ohms
[2]
UL Compliant File
E255764 140
Know Trip
DESCRIPTION
PART
NUMBER
LIST
PRICE
MODEL 120 8.0 - 35 OHMS
MODEL
120 $268
MODEL 120-8.5 36 - 200 OHMS
MODEL
120-8.5 $268
MODEL 120A 201 - 800 OHMS
MODEL
120A $268
MODEL 120B 801 OHMS and UP
MODEL
120B $268
MODEL 120HP .5 - 7.9 OHMS
MODEL
120HP $696
MODEL 240 151 OHMS and UP
MODEL
240 $417
MODEL 240A 5 - 35 OHMS
MODEL
240A $1,006
MODEL 240B 36 - 150 OHMS
MODEL
240B $1,006
MODEL 480 151 OHMS and UP
MODEL
480 $423
MODEL 480 and RC4 40 - 150 OHMS
MODEL
480 &
RC4 $615

147© 2018 Electric Power Research Institute, Inc. All rights reserved.
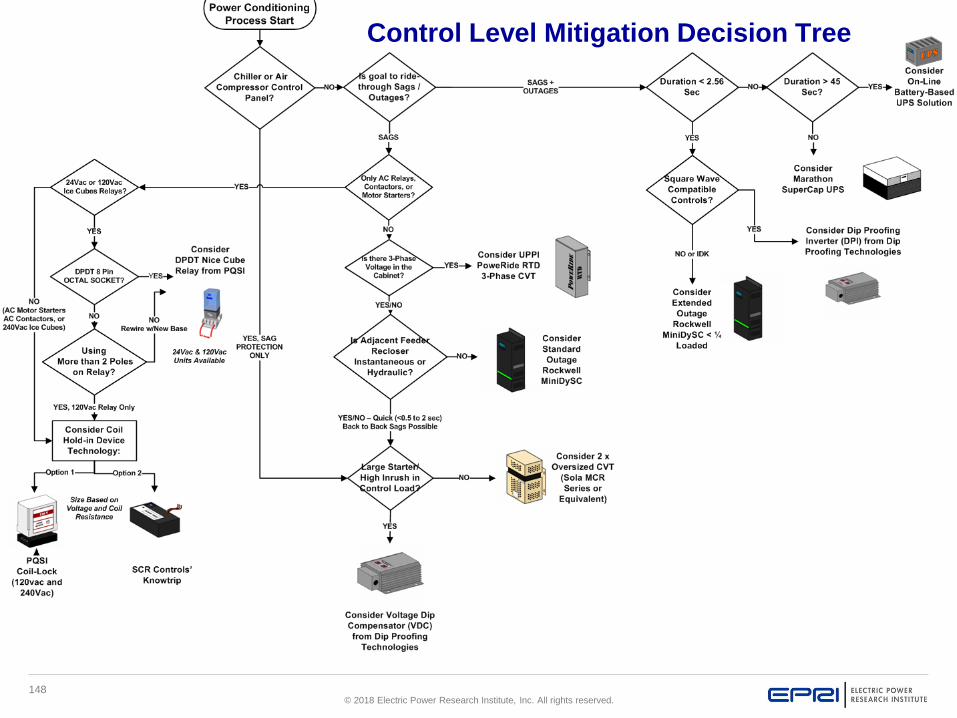
Control Level Mitigation Decision Tree
▪ Some of you have asked “how do I
know what type of mitigation
technique to use?”
▪ EPRI’s team has learned how to do
this because we are constantly
conducing PQ Audits and making
these decisions.
▪ A simplified approach for selecting a
general strategy is presented in this
example to help you determine what
approach makes sense against the
goals o the site, the PQ Data, and
the equipment/components to be
supported.
PQ Data from 5 example Sites..
How do I decide what mitigator
would work best ???
148© 2018 Electric Power Research Institute, Inc. All rights reserved.
Control Level Mitigation Decision Tree
149© 2018 Electric Power Research Institute, Inc. All rights reserved.
Together…Shaping the Future of Electricity