power savings provided by elastic optical networks
TRANSCRIPT

Power savings provided by elastic optical networks considering yearly traffic fluctuations
8th CEF Networks Workshop
Prague, Czech Republic
15th of September 2014
Ioan Turus

2/17
Outline
• Introduction
– Energy efficiency in ICT
– Global traffic forecasts
– Green networking
– Predictable traffic fluctuations
• Proposed traffic model
• Energy reduction strategies
• Control plane implementation
• Implementation and results
• Conclusions
3/17
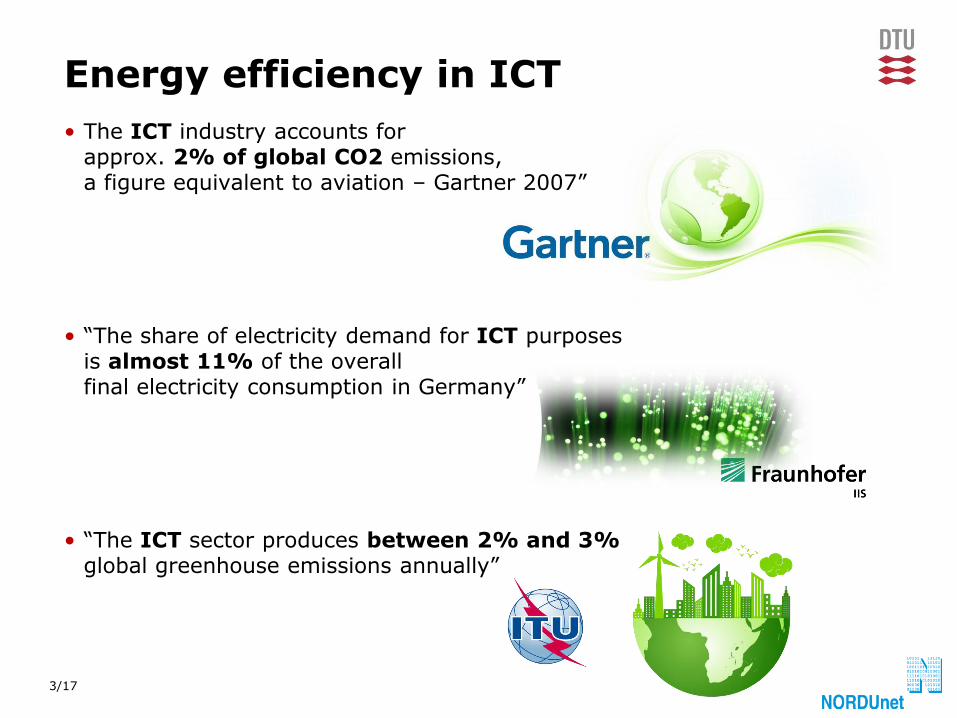
Energy efficiency in ICT
• The ICT industry accounts for approx. 2% of global CO2 emissions, a figure equivalent to aviation – Gartner 2007”
• “The share of electricity demand for ICT purposes is almost 11% of the overall final electricity consumption in Germany”
• “The ICT sector produces between 2% and 3% global greenhouse emissions annually”
• 3x traffic increase between 2013 and 2018
4/17
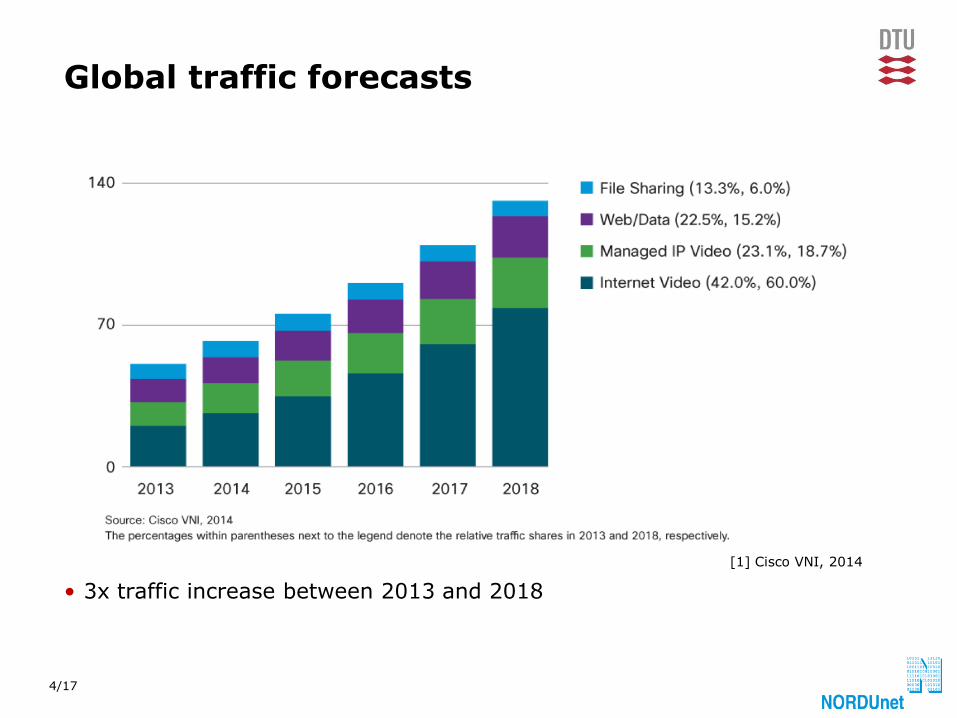
Global traffic forecasts
• 3x traffic increase between 2013 and 2018
[1] Cisco VNI, 2014
5/17
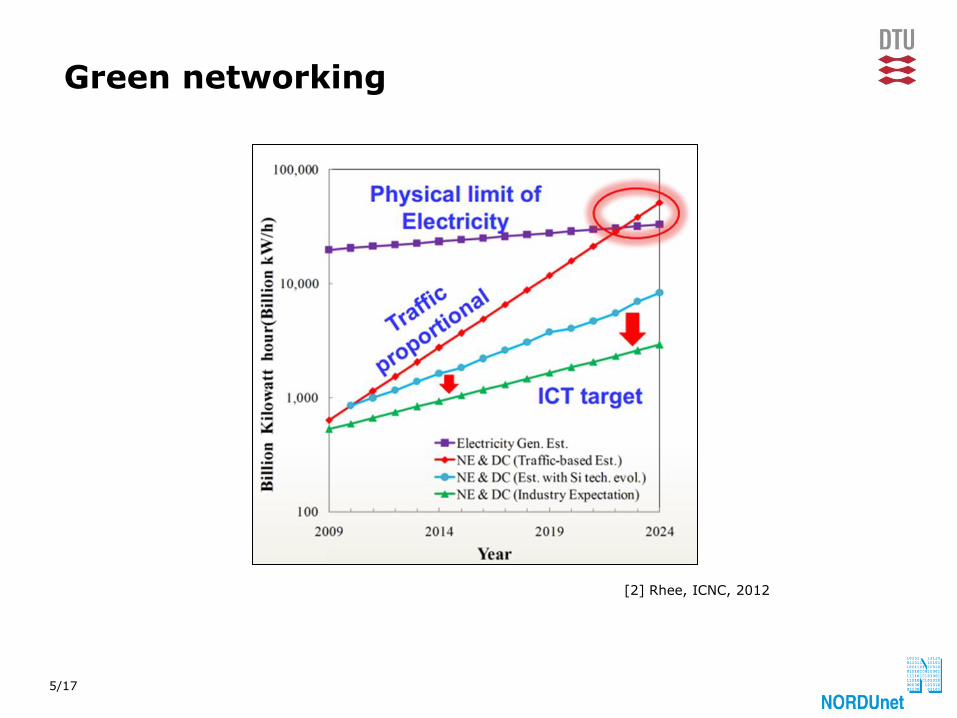
Green networking
[2] Rhee, ICNC, 2012

6/17
Predictable traffic fluctuations and growth
• NORDUnet – The overlay network of Nordic National Research and Education Networks
• NORDUnet traffic with Customers
– Day/night fluctuations
– Weekend drops
– Yearly growth
[3] http://stats.nordu.net
60%
max
avg
min 16%
54%
100%
7/17
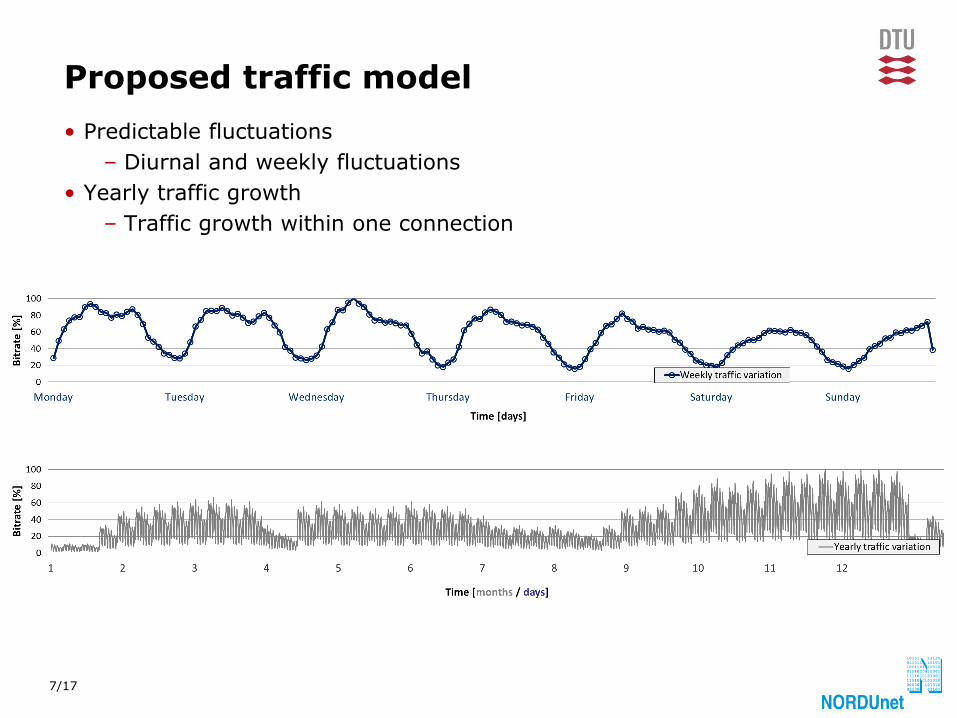
• Predictable fluctuations
– Diurnal and weekly fluctuations
• Yearly traffic growth
– Traffic growth within one connection
Proposed traffic model

8/17
Energy reduction strategies (I)
• On/Off (Sleep mode) of OE devices:
– Transponders (TRX)
– Regenerators (REG) – back-to-back transponder configuration
• 100 G PDM-QPSK
ON IDLE OFF
Power(TRX) 350 W 8 W 0 W
Power(REG) 700 W 16 W 0 W

9/17
Energy reduction strategies (II)
• Data-rate adaptation
• Elastic transponder/regenerator
– 25, 50, 75, 100 Gbps datarate configuration
Payload (Gbps)
SR (GBd)
MF Reach (km)
Power (W)
100 28 PDM-QPSK 1200 350
75 28 21
PS-QPSK PDM-QPSK
1800 1200
350 255
50 28 14
PDM-BPSK PDM-QPSK
2500 1200
350 206
25 28 14 7
SP-BPSK PDM-BPSK PDM-QPSK
3000 2500 1200
350 206 189
TABLE I. Elastic transponder power consumption

10/17
Energy reduction strategies (III)
• Modulation Format (MF) adaptation
• Symbol Rate (SR) adaptation
• Mixed (SR+MF) adaptation
TRX REG TRX
100Gb/s
100G PDM-QPSK 100G PDM-QPSK
100Gb/s 50Gb/s 50Gb/s
50Gb/s PDM-BPSK
zzz…
50Gb/s
50G PDM-QPSK 14 GBd 50G PDM-QPSK 14 GBd
50Gb/s
TRX REG TRX
100Gb/s 100Gb/s
100G PDM-QPSK 28 GBd 100G PDM-QPSK 28 GBd
350W 700W 350W
350W 700W 350W 206W 412W 206W
Ch. Power: 1400W Ch. Power: 700W
Ch. Power: 1400W Ch. Power: 824W
11/17
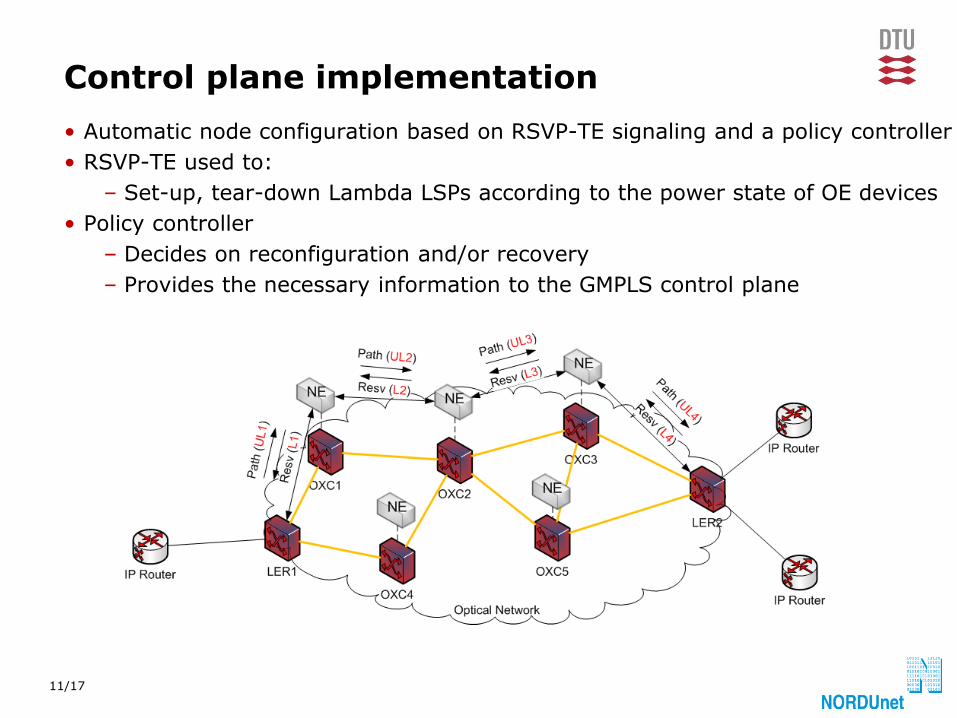
Control plane implementation
• Automatic node configuration based on RSVP-TE signaling and a policy controller
• RSVP-TE used to:
– Set-up, tear-down Lambda LSPs according to the power state of OE devices
• Policy controller
– Decides on reconfiguration and/or recovery
– Provides the necessary information to the GMPLS control plane
12/17
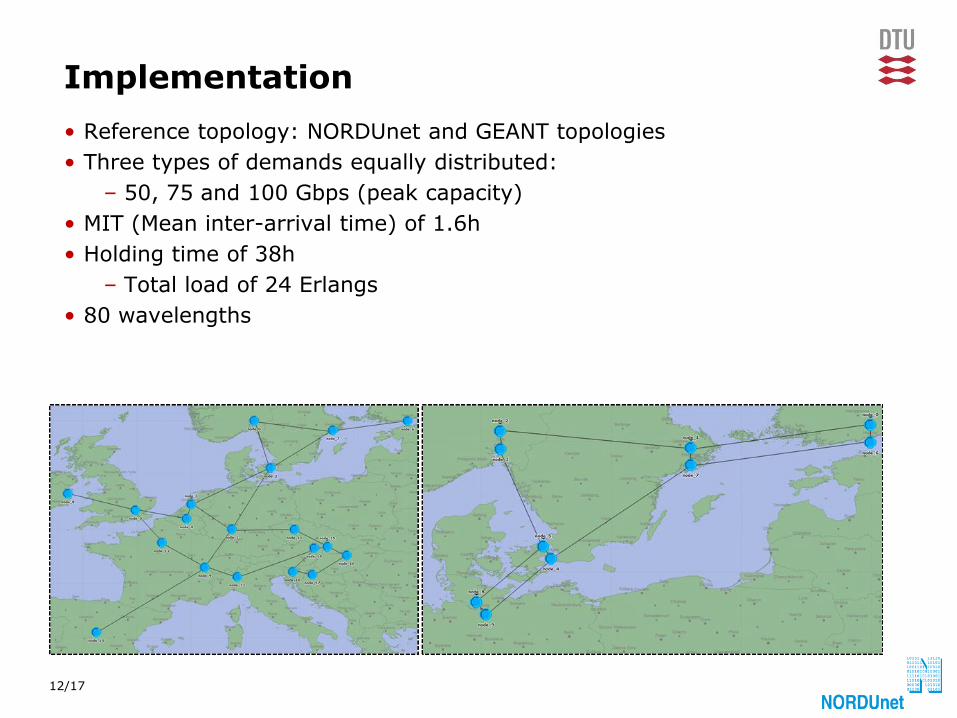
• Reference topology: NORDUnet and GEANT topologies
• Three types of demands equally distributed:
– 50, 75 and 100 Gbps (peak capacity)
• MIT (Mean inter-arrival time) of 1.6h
• Holding time of 38h
– Total load of 24 Erlangs
• 80 wavelengths
Implementation

13/17
Scenario definition
MF SR
Scenario 1 (Fixed)
fixed (100G) fixed (100G)
Scenario 2 (MF)
adapt fixed
Scenario 3 (SR)
fixed adapt
Scenario 4 (Mixed)
adapt adapt
TABLE I. Scenario definition

14/17
Results – Power consumption NORDUnet
• MF lower power (REGs placed in mode OFF)
– Peaks given by diurnal and weekly fluctuations (…from day 150)
• SR even lower power (symbol-rate adaptation)
– Higher peaks given by diurnal and weekly fluctuations
• Mixed - lowest power consumption

15/17
Results – Power consumption GEANT
• MF lower than SR in this case
– Mainly due to long spans and higher need for regeneration
• Mixed - still the lowest power

16/17
Results – Power savings
34,4
42,7
48,9 45,7
42,4
50,9
0,0
10,0
20,0
30,0
40,0
50,0
60,0
MF SR Mixed
Averag
e p
ow
er s
avin
gs
norm
ali
zed
to
baseli
ne
[%
]
Energy reduction strategy
NORDUnet GEANT

17/17
Conclusions
• Traffic increase overprovisioning increased power consumption
• Periodical and predictable traffic variation in core networks
• Energy saving strategies based on:
– Sleep-mode of OE devices
– Data-rate adaptation (MF, SR and mixed)
• 50% energy savings for both networks in Mixed scenario
• MF outperforms SR in large footprint networks (e.g. GEANT)
• SR only is preferred in small networks due to less complex signaling


19/17
Acknowledgements
- Annalisa Morea and Dominique Verchere (Alcatel-Lucent Bell Labs) for guidance and valuable feedback during the external stay at Alcatel-Lucent Bell Labs France.
- Elastic Optical Networks Project (Celtic EO-Net) for valuable data regarding elasticity.
- GreenTouch consortium for valuable input with regards to energy efficiency strategies.