power technologies
DESCRIPTION
Power Technologies Energy Data BookTRANSCRIPT

Power Technologies Energy Data Book
August 2006 • NREL/TP-620-39728
Fourth Edition

Power Technologies Energy Data Book Fourth Edition Compiled by J. Aabakken
Prepared under Task No. WUA3.1000
Technical ReportNREL/TP-620-39728 August 2006
National Renewable Energy Laboratory1617 Cole Boulevard, Golden, Colorado 80401-3393 303-275-3000 • www.nrel.gov
Operated for the U.S. Department of EnergyOffice of Energy Efficiency and Renewable Energyby Midwest Research Institute • Battelle
Contract No. DE-AC36-99-GO10337
NOTICE
This report was prepared as an account of work sponsored by an agency of the United States government. Neither the United States government nor any agency thereof, nor any of their employees, makes any warranty, express or implied, or assumes any legal liability or responsibility for the accuracy, completeness, orusefulness of any information, apparatus, product, or process disclosed, or represents that its use would not infringe privately owned rights. Reference herein to any specific commercial product, process, or service bytrade name, trademark, manufacturer, or otherwise does not necessarily constitute or imply its endorsement,recommendation, or favoring by the United States government or any agency thereof. The views andopinions of authors expressed herein do not necessarily state or reflect those of the United Statesgovernment or any agency thereof.
Available electronically at http://www.osti.gov/bridge
Available for a processing fee to U.S. Department of Energyand its contractors, in paper, from:
U.S. Department of EnergyOffice of Scientific and Technical Information P.O. Box 62 Oak Ridge, TN 37831-0062phone: 865.576.8401 fax: 865.576.5728 email: mailto:[email protected]
Available for sale to the public, in paper, from: U.S. Department of Commerce National Technical Information Service 5285 Port Royal Road Springfield, VA 22161 phone: 800.553.6847 fax: 703.605.6900 email: [email protected] ordering: http://www.ntis.gov/ordering.htm
Printed on paper containing at least 50% wastepaper, including 20% postconsumer waste

Table of Contents
1.0 Introduction..................................................................................................................1
2.0 Technology Profiles Biopower..................................................................................................................3 Geothermal.............................................................................................................10 Concentrating Solar Power ....................................................................................18 Photovoltaics..........................................................................................................23 Wind Energy ..........................................................................................................33 Hydrogen................................................................................................................40 Advanced Hydropower ..........................................................................................44 Building Technologies ...........................................................................................49 Reciprocating Engines ...........................................................................................60 Microturbines.........................................................................................................64 Fuel Cells ...............................................................................................................68 Batteries .................................................................................................................73 Advanced Energy Storage......................................................................................79 Superconducting Power Technology .....................................................................81 Thermally Activated Technologies........................................................................86
3.0 Electricity Restructuring 3.1 States with Competitive Electricity Markets .............................................89 3.2 States with System Benefit Charges (SBC) ...............................................90 3.3 States with Renewable Portfolio Standards (RPS) ....................................93 3.4 States with Net Metering Policies..............................................................99 3.5 States with Environmental Disclosure Policies .......................................108 3.6 Green Power Markets ..............................................................................109 3.7 States with Utility Green Pricing Programs.............................................112 3.8 Competitive Green Power Offerings and Renewable
Energy Certificates...................................................................................127 3.9 Federa Agency Purchases of Green Power..............................................137 3.10 State Incentive Programs .........................................................................138
4.0 Forecasts/Comparisons 4.1 Projections of Renewable Electricity Net Capacity.................................143 4.2 Projections of Renewable Electricity Net Generation .............................144 4.3 Projections of Renewable Electricity Carbon Dioxide
Emissions Savings ...................................................................................145
5.0 Electricity Supply 5.1 U.S. Total and Delivered Energy (Overview) .........................................147 5.2 Electricity Flow Diagram.........................................................................149 5.3 Electricity Overview ................................................................................151 5.4 Consumption of Fossil Fuels by Electric Generators ..............................152 5.5 Electric Power Sector Energy Consumption ...........................................153
iii

5.6 Fossil Fuel Generation by Age of Generating Units................................155 5.7 Nuclear Generation by Age of Generating Units ....................................156 5.8 Operational Renewable Energy Generating Capacity ............................157 5.9 Number of Utilities by Class of Ownership and Nonutilities ..................158 5.10 Top 10 U.S. Investor-Owned Utilities .....................................................159 5.11 Top 10 Independent Power Producers Worldwide (2001) ......................160 5.12 Utility Mergers and Acquisitions.............................................................161 5.13a North American Electric Reliability Council Map for the
United States ............................................................................................162 5.13b Census Regions Map................................................................................163
6.0 Electricity Capability 6.1 Electric Net Summer Capability ..............................................................165 6.2 Electric-Only Plant Net Summer Capability............................................166 6.3 Combined-Heat-and-Power Plant Net Summer Capability .....................167 6.4 Regional Noncoincident Peak Loads and Capacity Margin ....................168 6.5 Electric Generator Cumulative Additions and Retirements.....................169 6.6 Transmission and Distribution Circuit Miles...........................................170
7.0 Electricity Generation 7.1 Electricity Net Generation .......................................................................171 7.2 Net Generation at Electric-Only Plants ...................................................172 7.3 Electricity Generation at Combined-Heat-and-Power Plants ..................173 7.4 Generation and Transmission/Distribution Losses ..................................174 7.5 Electricity Trade.......................................................................................175
8.0 Electricity Demand 8.1 Electricity Sales .......................................................................................177 8.2 Demand-Side Management......................................................................178 8.3 Electric Utility Sales, Revenue, and Consumption by
Census Division and State ......................................................................179
9.0 Prices 9.1 Price of Fuels Delivered to Electric Generators ......................................181 9.2 Electricity Retail Sales.............................................................................182 9.3 Prices of Electricity Sold ........................................................................183 9.4 Revenue from Electric Utility Retail Sales by Sector..............................184 9.5 Revenue from Sales to Ultimate Consumers by Sector, Census
Division, and State ..................................................................................185 9.6 Production, Operation, and Maintenance Expenses for Major U.S.
Investor-Owned and Publicly Owned Utilities ........................................1879.6a Operation and Maintenance Expenses for Major U.S. Investor-Owned
Electric Utilities .......................................................................................188 9.6b Operation and Maintenance Expenses for Major U.S. Publicly Owned
Generator and Nongenerator Electric Utilities ........................................189 9.7 Environmental Compliance Equipment Costs .........................................190
iv

10.0 Economic Indicators 10.1 Price Estimates for Energy Purchases......................................................191 10.2 Economy-Wide Indicators .......................................................................192 10.3 Composite Statements of Income for Major U.S. Publicly Owned
Generator and Investor-Owned Electric Utilities ....................................193
11.0 Environmental Indicators 11.1 Emissions from Electricity Generators ....................................................195 11.2 Installed Nameplate Capacity of Utility Steam-Electric Generators with
Environmental Equipment .......................................................................197 11.3 EPA-Forecasted Nitrogen Oxide, Sulfur Dioxide, and Mercury
Emissions from Electric Generators ........................................................198 11.4 Origin of 2004 Allowable SO2 Emissions Levels....................................199
12.0 Conversion Factors 12.1 Renewable Energy Impacts Calculation ..................................................201 12.2 Number of Home Electricity Needs Met Calculation..............................202 12.3 Coal Displacement Calculation................................................................203 12.4 National SO2 and Heat Input Data ...........................................................204 12.5 SO2, NOx, CO2 Emission Factors for Coal-Fired and Noncoal-Fired
Title IV Affected Units ............................................................................205 12.6a Sulfur Dioxide, Nitrogen Oxide, and Carbon Dioxide Emission Factors,
Electricity Generators ..............................................................................206 12.6b Nitrogen Oxide Uncontrolled Emission Factors,
Electricity Generators ..............................................................................208 12.6c Uncontrolled Carbon Dioxide Emission Factors,
Electricity Generators ..............................................................................210 12.7 Global Warming Potentials (GWP) .........................................................211 12.8 Approximate Heat Content of Selected Fuels for Electric
Power Generation.....................................................................................212 12.9 Approximate Heat Rates for Electricity...................................................213 12.10 Heating Degree Days by Month ..............................................................214 12.11 Cooling Degree Days by Month ..............................................................215
13.0 Geographic Information System (GIS) Maps .....................................................217
v

1.1 - Introduction About the Power Technologies Energy Data Book (PTEDB), Fourth Edition.
In 2002, the Energy Analysis Office of the National Renewable Energy Laboratory(NREL) developed the first version of the Power Technologies Energy Data Book for the Office of Power Technologies of the U.S. Department of Energy (DOE).
The main purpose of the data book is to compile, in one central document, a comprehensive set of data about power technologies from diverse sources. The need for policy makers and analysts to be well-informed about power technologies suggests the need for a publication that includes a diverse, yet focused, set of data about power technologies.
New for this fourth edition of the PTEDB is Chapter 13, which features Geographic Information System (GIS) maps. One set of maps shows the natural resource (biomass, geothermal, solar, and wind) overlaid with the national transmission grid and the majorelectricity load centers. The other set of maps shows the current installed capacity(biomass, geothermal, concentrating solar power, and wind), as well as a bar chart indicating the historic trend of generating capacity for the state.
The PTEDB is organized into 13 chapters:
Chapter 1 - Introduction Chapter 2 – Technology profiles Chapter 3 – Electricity restructuringChapter 4 – Forecasts/comparisons Chapter 5 – Electricity supplyChapter 6 – Electricity capabilityChapter 7 – Electricity generation Chapter 8 – Electricity demand Chapter 9 – Prices Chapter 10 – Economic indicators Chapter 11 – Environmental indicators Chapter 12 – Conversion factors Chapter 13 – Geographic Information System (GIS) maps.
The sources used for the Power Technologies Energy Data Book represent the latest available data.
This edition updates the same type of information provided in the previous edition. Most of the data in this publication is taken directly from the source materials, although it maybe reformatted for presentation. Neither NREL nor DOE endorses the validity of these data.
1

This fourth edition of the Power Technologies Energy Data Book, as well as previous editions, are available on the Internet at http://www.nrel.gov/analysis/power_databook/. The PTEDB may be downloaded as a single PDF file, individual chapters, or table PDFfiles – selected data also is available as Excel spreadsheets.
The Web site also features energy-conversion calculators and features links to the Transportation Energy Data Book and Buildings Energy Data Book. Readers are encouraged to suggest improvements to the PTEDB through the feedback form on the Web site.
2

Biopower Technology Description
Biopower, also called biomass power, is the generation of electric power from biomass resources – now usually urban waste wood, crop, and forest residues; and, in the future, crops grown specifically for energy production. Biopower reduces most emissions (including emissions of greenhouse gases-GHGs) compared with fossil fuel-based electricity. Because biomass absorbs CO2 as it grows, the entire biopower cycle of growing, converting to electricity, and regrowing biomass can result in very low CO2 emissions compared to fossil energy without carbon sequestration, such as coal, oil or natural gas. Through the use of residues, biopower systems can even represent a net sink for GHG emissions by avoiding methane emissions that would result from landfilling of the unused biomass. Representative Technologies for Conversion of Feedstock to Fuel for Power and Heat • Homogenization is a process by which feedstock is made physically uniform for further processing or for combustion (includes chopping, grinding, baling, cubing, and pelletizing). • Gasification (via pyrolysis, partial oxidation, or steam reforming) converts biomass to a fuel gas that can be substituted for natural gas in combustion turbines or reformed into H2 for fuel cell applications. • Anaerobic digestion produces biogas that can be used in standard or combined heat and power (CHP) applications. Agricultural digester systems use animal or agricultural waste. Landfill gas also is produced anaerobically. • Biofuels production for power and heat provides liquid-based fuels such as methanol, ethanol, hydrogen, or biodiesel. Representative Technologies for Conversion of Fuel to Power and Heat • Direct combustion systems burn biomass fuel in a boiler to produce steam that is expanded in a Rankine Cycle prime mover to produce power. • Cofiring substitutes biomass for coal or other fossil fuels in existing coal-fired boilers. • Biomass or biomass-derived fuels (e.g. syngas, ethanol, biodiesel) also can be burned in combustion turbines (Brayton cycle) or engines (Otto or Diesel cycle) to produce power. • When further processed, biomass-derived fuels can be used by fuels cells to produce electricity System Concepts • CHP applications involve recovery of heat for steam and/or hot water for district energy, industrial processes, and other applications. • Nearly all current biopower generation is based on direct combustion in small, biomass-only plants with relatively low electric efficiency (20%), although total system efficiencies for CHP can approach 90%. Most biomass direct-combustion generation facilities utilize the basic Rankine cycle for electric-power generation, which is made up of the steam generator (boiler), turbine, condenser, and pump. • For the near term, cofiring is the most cost-effective of the power-only technologies. Large coal steam plants have electric efficiencies near 33%. The highest levels of coal cofiring (15% on a heat-input basis) require separate feed preparation and injection systems. • Biomass gasification combined-cycle plants promise comparable or higher electric efficiencies (> 40%) using only biomass, because they involve gas turbines (Brayton cycle), which are more efficient than Rankine cycles, as is true for coal. Other technologies being developed include integrated gasification/fuel cell and biorefinery concepts.
3

Technology Applications • The existing biopower sector – nearly 1,000 plants – is mainly comprised of direct-combustion plants, with an additional small amount of cofiring (six operating plants). Plant size averages 20 MWe, and the biomass-to-electricity conversion efficiency is about 20%. Grid-connected electrical capacity has increased from less than 200 MWe in 1978 to more than 9,700 MWe in 2001. More than 75% of this power is generated in the forest products industry’s CHP applications for process heat. Wood-fired systems account for close to 95% of this capacity. In addition, about 3,300 MWe of municipal solid waste and landfill gas generating capacity exists. Recent studies estimate that on a life-cycle basis, existing biopower plants represent an annual net carbon sink of 4 MMTCe. Prices generally range from 8¢/kWh to 12¢/kWh.
Current Status • CHP applications using a waste fuel are generally the most cost-effective biopower option. Growth is limited by availability of waste fuel and heat demand. • Biomass cofiring with coal ($50 - 250/kW of biomass capacity) is the most near-term option for large-scale use of biomass for power-only electricity generation. Cofiring also reduces sulfur dioxide and nitrogen oxide emissions. In addition, when cofiring crop and forest-product residues, GHG emissions are reduced by a greater percentage (e.g. 23% GHG emissions reduction with 15% cofiring). • Biomass gasification for large-scale (20-100MWe) power production is being commercialized. It will be an important technology for cogeneration in the forest-products industries (which project a need for biomass and black liquor CHP technologies with a higher electric-thermal ratio), as well as for new baseload capacity. Gasification also is important as a potential platform for a biorefinery. • Small biopower and biodiesel systems have been used for many years in the developing world for electricity generation. However, these systems have not always been reliable and clean. DOE is developing systems for village-power applications and for developed-world distributed generation that are efficient, reliable, and clean. These systems range in size from 3kW to 5MW and completed field verification by 2003. • Approximately 15 million to 21 million gallons of biodiesel are produced annually in the United States. • Utility and industrial biopower generation totaled more than 60 billion kWh in 2001, representing about 75% of nonhydroelectric renewable generation. About two-thirds of this energy is derived from wood and wood wastes, while one-third of the biopower is from municipal solid waste and landfill gas. Industry consumes more than 2.1 quadrillion Btu of primary biomass energy.
Technology History • In the latter part of the 19th century, wood was the primary fuel for residential, commercial, and transportation uses. By the 1950s, other fuels had supplanted wood. In 1973, wood use had dropped to 50 million tons per year. • At that point, the forest products and pulp-and-paper industries began to use wood with coal in new plants and switched to wood-fired steam power generation. • The Public Utility Regulatory Policies Act (PURPA) of 1978 stimulated the development of nonutility cogeneration and small-scale plants to in the wood-processing and pulp-and-paper sectors and increased supply of power to the grid. • The combination of low natural gas prices, improved economies of scale in combined cycle palns, and withdrawal of incentives in the late 1980s, led to annual installations declining from about 600 MW in 1989, to 300-350MW in 1990. • There are now nearly 1,000 wood-fired plants in the United States, with about two-thirds of those providing power (and heat) for on-site uses only.
4

Technology Future The levelized cost of electricity (in constant 1997$/kWh) for biomass direct-fired and gasification configurations are projected to be:
2000 2010 2020 Direct-fired 7.5 7.0 5.8 Gasification 6.7 6.1 5.4 Source: Renewable Energy Technology Characterizations, EPRI TR-109496, 1997.
• R&D directions include: Gasification – This technology requires extensive field verification in order to be adopted by the
relatively conservative utility and forest-products industries, especially to demonstrate integrated operation of biomass gasifier with advanced-power generation (turbines and/or fuel cells). Integration of gasification into a biorefinery platform is a key new research area.
Small Modular Systems – Small-scale systems for distributed or minigrid (for premium or village power) applications will be increasingly in demand.
Cofiring – The DOE biopower program is moving away from research on cofiring, as this technology has reached a mature status. However, continued industry research and field verifications are needed to address specific technical and nontechnical barriers to cofiring. Future technology development will benefit from finding ways to better prepare, inject, and control biomass combustion in a coal-fired boiler. Improved methods for combining coal and biomass fuels will maximize efficiency and minimize emissions. Systems are expected to include biomass cofiring up to 5% of natural gas combined-cycle capacity.
Source: National Renewable Energy Laboratory. U.S. Climate Change Technology Program. Technology Options: For the Near and Long Term. DOE/PI-0002. November 2003 (draft update, September 2005).
5

Biomass
Market Data
Cumulative Generating Capability, by Type Source: Energy Information Administration (EIA), EIA, Annual Energy Review 2004, DOE/EIA-0384(2004) (MW) (Washington, D.C., August 2005), Tables 8.11a and 8.11c, and world data from United Nations
Development Program, World Energy Assessment, 2000, Table 7.25. 1980 1985 1990 1995 1996 1997 1998 1999 2000 2001 2002 2003 2004
U.S. Electric Power Sector Municipal Solid Waste1 N/A 151 1,852 2,733 2,600 2,528 2,636 2,614 2,789 2,993 2,949 2,842 2,856
Wood and Other Biomass2 78 200 964 1,451 1,425 1,452 1,438 1,484 1,486 1,487 1,410 1,389 1,389
U.S. Cogenerators3
Municipal Solid Waste1 659 786 998 1,062 1,058 1,046 1,094 834 842 961 961 Wood and Other Biomass2 4,585 5,298 5,382 5,472 5,364 5,311 4,655 4,394 4,399 4,482 4,502
U.S. Total Municipal Solid Waste1 NA 151 2,511 3,519 3,598 3,590 3,694 3,660 3,883 3,827 3,845 3,803 3,817
Wood and Other Biomass2 78 200 5,549 6,750 6,808 6,924 6,802 6,795 6,141 5,882 5,844 5,871 5,891 Biomass Total 78 351 8,061 10,269 10,405 10,515 10,495 10,454 10,024 9,709 9,689 9,674 9,708
Rest of World Total4 29,505 World Total 40,000 1 Municipal solid waste, landfill gas, sludge waste, tires, agricultural byproducts, and other biomass. 2 Wood, black liquor, and other wood waste. 3 Data include electric power sector and end-use sector (industrial and commercial) generators. 4 Number derived from subtracting U.S. total from the world total. Figures may not add due to rounding.
6
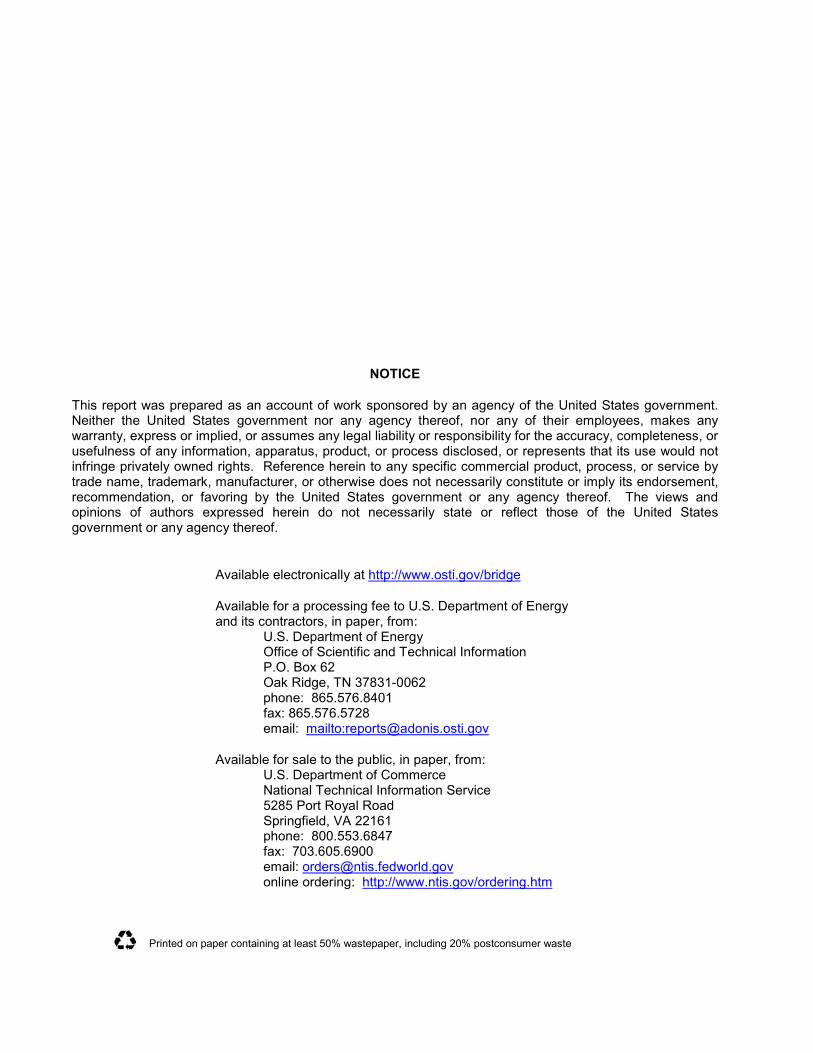
U.S. Annual Installed Source: Renewable Electric Plant Information System (REPiS), Version 7, NREL, Generating Capability, by 2003. Type (MW)
1980 1985 1990 1995 1996 1997 1998 1999 2000 2001 2002 20031
Agricultural Waste2 22.6 20.1 0 4.0 0 21.6 0 0 0 0 0 0 Biogas3 0.1 58.6 51.3 17.5 74.8 92.7 87.3 107.6 43.8 66.8 30.2 23.1 Municipal Solid Waste4 50.0 117.2 260.3 94.5 0 0 0 22.0 0 0 0 30.0 Wood Residues5 260.4 254.8 299.4 66.5 91.6 40.0 90.3 13.0 0 11.3 38.8 0
Total 333.0 450.7 611.0 182.5 166.4 154.3 177.6 142.6 43.8 78.1 69.0 53.1
U.S. Cumulative Generating Source: Renewable Electric Plant Information System (REPiS), Version 7, NREL, Capability, by Type6 (MW) 2003.
1980 1985 1990 1995 1996 1997 1998 1999 2000 2001 2002 20031
Agricultural Waste2 40 92 165 351 351 373 373 373 373 373 373 373
Biogas3 18 117 361 526 601 694 781 889 933 999 1,030 1,053
Municipal Solid Waste4 263 697 2,172 2,948 2,948 2,948 2,948 2,970 2,970 2,970 2,970 3,000
Wood Residues5 3,576 4,935 6,305 7,212 7,303 7,343 7,434 7,447 7,447 7,458 7,497 7,497
Total 3,897 5,840 9,003 11,037 11,203 11,358 11,535 11,678 11,722 11,800 11,869 11,922
Note: The data in this table does not match data in the previous table, due to different coverage ratios in EIA and REPIS databases. 1 2003 data not complete as REPiS database is updated through 2002. 2 Agricultural residues, cannery wastes, nut hulls, fruit pits, nut shells 3 Biogas, alcohol (includes butahol, ethanol, and methanol), bagasse, hydrogen, landfill gas, livestock manure, wood gas (from wood gasifier) 4 Municipal solid waste (includes industrial and medical), hazardous waste, scrap tires, wastewater sludge, refused-derived fuel 5 Timber and logging residues (includes tree bark, wood chips, saw dust, pulping liquor, peat, tree pitch, wood or wood waste) 6 There are an additional 65.45 MW of Ag Waste, 5.445 MW of Bio Gas, and 483.31 MW of Wood Residues that are not accounted for here because they have no specific online date.
7

Generation from Source: EIA, Annual Energy Review 2003, Tables 8.2a and 8.2c, and world data from United Nations Development Cumulative Capacity, by Program, World Energy Assessment, 2000, Table 7.25. Type (Million kWh)
1980 1985 1990 1995 1996 1997 1998 1999 2000 2001 2002 2003 2004 U.S. Electric Power Sector Municipal Solid Waste1 158 640 10,245 16,326 16,078 16,397 16,963 17,112 17,592 17,221 17,359 18,141 17,809
Wood and Other Biomass2 275 743 5,327 5,885 6,493 6,468 6,644 7,254 7,301 6,571 7,265 7,402 7,475
U.S. Cogenerators3
Municipal Solid Waste1 2,904 4,079 4,834 5,312 5,485 5,460 5,540 4,543 5,498 5,889 4,938 Wood and Other Biomass2 26,939 30,636 30,307 30,480 29,694 29,787 30,294 28,629 31,400 29,735 29,820
U.S. Total Municipal Solid Waste1 158 640 13,149 20,405 20,911 21,709 22,448 22,572 23,131 21,765 22,857 23,736 22,747
Wood and Other Biomass2 275 743 32,266 36,521 36,800 36,948 36,338 37,041 37,595 35,200 38,665 37,529 37,295 Biomass Total 433 1,383 45,415 56,926 57,712 58,658 58,786 59,613 60,726 56,964 61,522 61,265 60,042
Rest of World Total4 101,214 World Total 160,000 1 Municipal solid waste, landfill gas, sludge waste, tires, agricultural byproducts, and other biomass. 2 Wood, black liquor, and other wood waste. 3 Data include electric power sector and end-use sector (industrial and commercial) generators. 4 Number derived from subtracting U.S. total from the world total. Figures may not add due to rounding.
U.S. Annual Energy Source: EIA, Annual Energy Review 2004, Tables 8.4b and 8.4c Consumption for Electricity Generation (Trillion Btu)
1980 1985 1990 1995 1996 1997 1998 1999 2000 2001 2002 2003 2004 Electric-Power Sector 4.5 14.4 285.9 388.0 397.3 408.3 412.0 415.5 420.7 430.4 494.1 493.1 492.4
Commercial Sector1 16.7 22.3 32.1 34.3 32.7 33.5 26.5 22.6 28.5 30.6 32.2
Industrial Sector1 351.0 385.3 407.1 380.7 362.0 373.0 378.8 379.6 481.5 378.7 567.8
Total Biomass 4.5 14.4 653.5 795.6 836.5 823.3 806.8 822.0 825.9 832.6 1,004.1 902.4 1,092.4
Data include wood (wood, black liquor, and other wood waste) and waste (municipal solid waste, landfill gas, sludge waste, tires, agricultural byproducts, and other biomass). 1 Data includes combined-heat-and-power (CHP) and electricity-only plants.
8

Technology Performance Source: Renewable Energy Technology Characterizations, EPRI TR-109496, 1997.
Efficiency 1980 1990 19951 2000 2005 2010 20152 2020 Capacity Factor (%) Direct-fired 80.0 80.0 80.0 80.0 80.0 80.0
Cofired 85.0 85.0 85.0 85.0 85.0 85.0 Gasification 80.0 80.0 80.0 80.0 80.0 80.0
Efficiency (%) Direct-fired 23.0 27.7 27.7 27.7 30.8 33.9 Cofired 32.7 32.5 32.5 32.5 32.5 32.5 Gasification 36.0 36.0 37.0 37.0 39.3 41.5
Net Heat Rate (kJ/kWh) Direct-fired 15,280 13,000 13,000 13,000 11,810 10,620 Cofired 11,015 11,066 11,066 11,066 11,066 11,066 Gasification 10,000 10,000 9,730 9,730 9,200 8,670
Cost 1980 1990 19951 2000 2005 2010 2015 2020 Total Capital Cost ($/kW) Direct-fired 1,965 1,745 1,510 1,346 1,231 1,115
Cofired3 272 256 241 230 224 217 Gasification 2,102 1,892 1,650 1,464 1,361 1,258
Feed Cost ($/GJ) Direct-fired 2.50 2.50 2.50 2.50 2.50 2.50 Cofired3 -0.73 -0.73 -0.73 -0.73 -0.73 -0.73 Gasification 2.50 2.50 2.50 2.50 2.50 2.50
Fixed Operating Cost ($/kW-yr) Direct-fired 73.0 60.0 60.0 60.0 54.5 49.0 Cofired3 10.4 10.1 9.8 9.6 9.5 9.3 Gasification 68.7 43.4 43.4 43.4 43.4 43.4
1980 1990 19951 2000 2005 2010 2015 2020 Variable Operating Costs ($/kWh) Direct-fired 0.009 0.007 0.007 0.007 0.006 0.006
Cofired3 -0.002 -0.002 -0.002 -0.002 -0.002 -0.002 Gasification 0.004 0.004 0.004 0.004 0.004 0.004
Total Operating Costs ($/kWh) Direct-fired 0.055 0.047 0.047 0.047 0.043 0.039 Cofired3 -0.008 -0.008 -0.008 -0.009 -0.009 -0.009 Gasification 0.040 0.036 0.036 0.036 0.034 0.033 Levelized Cost of Energy ($/kWh) Direct-fired 0.087 0.075 0.070 0.058 Cofired3 N/A N/A N/A N/A N/A N/A
Gasification 0.073 0.067 0.061 0.054 1 Data is for 1997, the base year of the Renewable Energy Technology Characterizations analysis. 2 Number derived by interpolation. 3 Note that cofired cost characteristics represent only the biomass portion of costs for capital and incremental costs above conventional costs for Operations & Maintenance (O&M), and assume $9.14/dry tonne biomass and $39.09/tonne coal, a heat input from biomass at 19,104 kJ/kg, and that variable O&M includes an SO2 credit valued at $110/tonne SO2. No cofiring COE is reported in the RETC.
9

Geothermal Energy Technology Description
Geothermal energy is heat from within the Earth. Hot water or steam are used to produce electricity or applied directly for space heating and industrial processes. This energy can offset the emission of carbon dioxide from conventional fossil-powered electricity generation, industrial processes, building thermal systems, and other applications. System Concepts • Geophysical, geochemical, and geological exploration locates resources to drill, including highly permeable hot reservoirs, shallow warm groundwater, hot impermeable rock masses, and highly pressured hot fluids. • Well fields and distribution systems allow the hot fluids to move to the point of use, and afterward, back to the earth. • Utilization systems may apply the heat directly or convert it to another form of energy such as electricity. Representative Technologies • Exploration technologies identify geothermal reservoirs and their fracture systems; drilling, reservoir testing, and modeling optimize production and predict useful lifetime; steam turbines use natural steam or hot water flashed to steam to produce electricity; binary conversion systems produce electricity from water not hot enough to flash. • Direct applications use the heat from geothermal fluids without conversion to electricity. Geothermal heat pumps use the shallow earth as a heat source and heat sink for heating and cooling applications. • Coproduction, the recovery of minerals and metals from geothermal brine, is being pursued. Zinc is recovered at the Salton Sea geothermal field in California.
Technology Applications • With improved technology, the United States has a resource base capable of producing up to 100 GW of electricity at less than 5¢/kWh. • Hydrothermal reservoirs are being used to produce electricity with an online availability of up to 97%; advanced energy-conversion technologies are being implemented to improve plant thermal efficiency. • Direct-use applications are successful throughout the western United States and provide heat for space heating, aquaculture, greenhouses, spas, and other applications. • Geothermal heat pumps continue to penetrate markets for heating/cooling (HVAC) services.
Current Status • The DOE Geothermal Program sponsored research that won two R&D 100 Awards in 2003: Acoustic Telemetry Technology, which provides a high speed data link between the surface and the drill bit; and Low Emission Atmospheric Monitoring Separator, which safely contains and cleans vented steam during drilling, well testing, and plant start-up. • A second pipeline to carry replacement water has been completed through the joint efforts of industry and federal, state, and local agencies. This will increase production and extend the lifetime of The Geysers Geothermal Field in California. The second pipeline adds 85 MW of capacity.
10

Technology History • The use of geothermal energy as a source of hot water for spas dates back thousands of years. • In 1892, the world's first district heating system was built in Boise, Idaho, as water was piped from hot springs to town buildings. Within a few years, the system was serving 200 homes and 40 downtown businesses. Today, the Boise district heating system continues to flourish. Although no one imitated this system for nearly 70 years, there are now 17 district heating systems in the United States and dozens more around the world. • The United States’ first geothermal power plant went into operation in 1922 at The Geysers in California. The plant was 250 kW, but fell into disuse. • In 1960, the country's first large-scale geothermal electricity-generating plant began operation. Pacific Gas and Electric operated the plant, located at The Geysers. The resource at The Geysers is dry steam. The first turbine produces 11 megawatts (MW) of net power and operated successfully for more than 30 years. • In 1979, the first electrical development of a water-dominated geothermal resource occurred at the East Mesa field in the Imperial Valley in California. • In 1980, UNOCAL built the country's first flash plant, generating 10 MW at Brawley, California. • In 1981, with a supporting loan from DOE, Ormat International Inc. successfully demonstrated binary technology in the Imperial Valley of California. This project established the technical feasibility of larger-scale commercial binary power plants. The project was so successful that Ormat repaid the loan within a year. • By the mid-1980s, electricity was being generated by geothermal power in four western states: California, Hawaii, Utah, and Nevada. • In the 1990s, the U.S. geothermal industry focused its attention on building power plants overseas, with major projects in Indonesia and the Philippines. • In 1997, a pipeline began delivering treated municipal wastewater and lake water to The Geysers steamfield in California, increasing the operating capacity by 70 MW. • In 2000, DOE initiated its GeoPowering the West program to encourage development of geothermal resources in the western United States by reducing nontechnical barriers. • The DOE Geothermal Program sponsored research that won two R&D awards in 2003, advancing this renewable energy. • With approval of the federal production tax credit and with support from state-level renewable portfolio standards, U.S. geothermal power is poised to double in capacity within the next couple of years.
Technology Future The levelized cost of electricity (in constant 1997$/kWh) for the two major future geothermal energy configurations are projected to be:
2000 2010 2020 Hydrothermal Flash 3.0 2.4 2.1 Hydrothermal Binary 3.6 2.9 2.7
Source: Renewable Energy Technology Characterizations, EPRI TR-109496, 1997.
• Costs at the best sites are competitive at today’s energy prices – and investment is limited by uncertainty in prices; lack of new, confirmed resources; high front-end costs; and lag time between investment and return. • Improvements in cost and accuracy of resource exploration and characterization can lower the electricity cost; demonstration of new resource concepts, such as enhanced geothermal systems, would allow a large expansion of the U.S. use of hydrothermal when economics become favorable.
11

Market Context • Hydrothermal reservoirs have an installed capacity of about 2,133 MW electric in the United States and about 8,000 MW worldwide. Direct-use applications have an installed capacity of about 600 MW thermal in the United States. About 300 MW electric are being developed in California, Nevada, and Idaho. • Geothermal will continue production at existing plants (2.1 GW) with future construction potential (100 GW by 2040). Direct heat will replace existing systems in markets in 19 western states. • By 2015, geothermal could provide about 10 GW, enough heat and electricity for 7 million homes; by 2020, an installed electricity capacity of 20,000 MW from hydrothermal plants and 20,000 MW from enhanced geothermal systems is projected.
Source: National Renewable Energy Laboratory. U.S. Climate Change Technology Program. Technology Options: For the Near and Long Term. DOE/PI-0002. November 2003 (draft update, September 2005).
12
Geothermal
Market Data
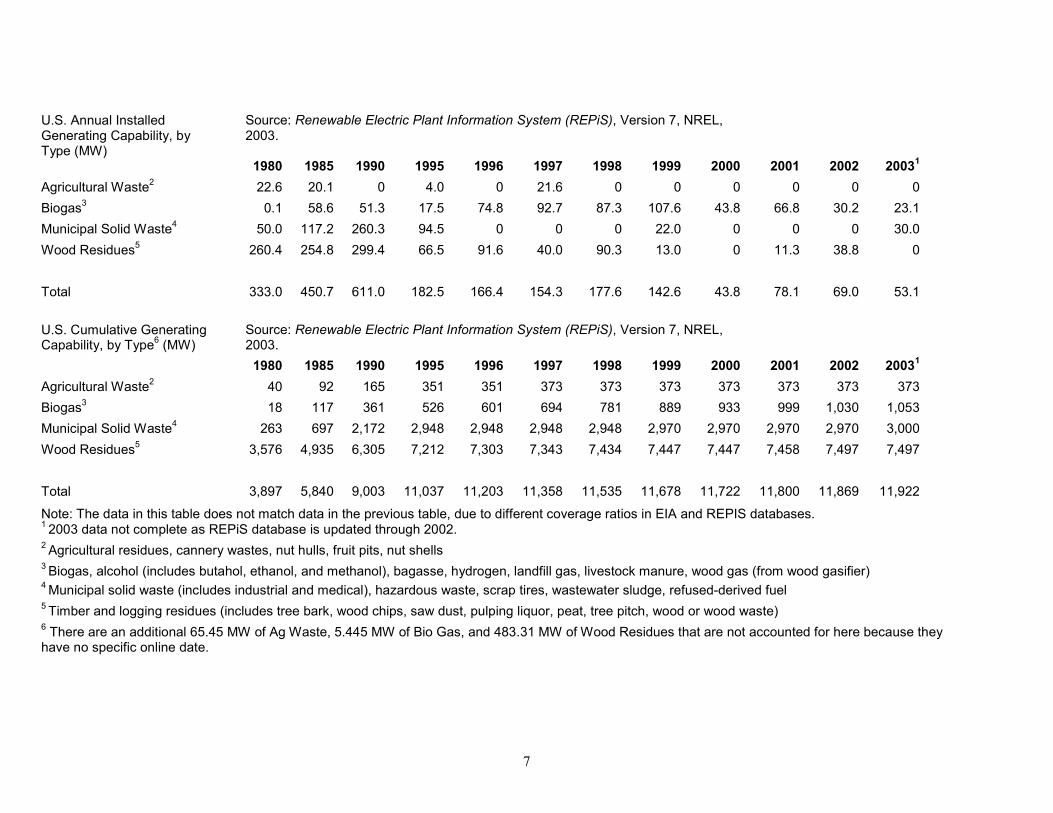
Cumulative Installed Source: U.S. electricity data from EIA, Annual Energy Review 2004, DOE/EIA-0384(2004) (Washington, D.C., August Capacity 2005), Table 8.11a; world totals from Renewable Energy World/July-August 2000, page 123, Table 1; 1998 world totals
from UNDP World Energy Assessment 2000, Tables 7.20 and 7.25; 1997 world electricity and U.S. and world direct-use heat data from Stefansson and Fridleifsson 1998, “Geothermal Energy: European and World-wide Perspective.”
1980 1985 1990 1995 1996 1997 1998 1999 2000 2001 2002 2003 2004 Electricity (MWe) U.S. 909 1,580 2,666 2,968 2,893 2,893 2,893 2,846 2,793 2,216 2,252 2,133 2,133 Rest of World 1,191 3,184 3,166 3,829 5,128 5,346 5,181 World Total 2,100 4,764 5,832 6,797 8,021 8,239 7,974
Direct-Use Heat (MWth) U.S. 1,905 Rest of World 7,799 World Total 1,950 7,072 8,064 8,664 9,704 11,000 17,175
Cumulative Installed Source: International Geothermal Association, http://iga.igg.cnr.it/index.php Capacity
1980 1985 1990 1995 1996 1997 1998 1999 2000 2001 2002 2003 Electricity (MWe) U.S. 2,775 2,817 2,228 2,020 Rest of World 3,057 4,016 5,746 6,382 World Total 5,832 6,833 7,974 8,402
Direct-Use Heat (MWth) U.S. 1,874 3,766 4,350 Rest of World 6,730 11,379 World Total 8,604 15,145
13

Annual Installed Electric Source: Renewable Electric Plant Information System (REPiS), Version 7, NREL, 2003. Capacity (MWe)
1980 1985 1990 1995 1996 1997 1998 1999 2000 2001 2002 2003* U.S. 251.0 352.9 48.6 36.0 59.9
Cumulative Installed Electric Source: Renewable Electric Plant Information System (REPiS), Version 7, NREL, 2003. Capacity (MWe)
1980 1985 1990 1995 1996 1997 1998 1999 2000 2001 2002 2003* U.S. 802 1,698 2,540 2,684 2,720 2,720 2,720 2,720 2,779 2,779 2,779 2,779
* 2003 data not complete as REPiS database is updated through 2002.
Installed Capacity and Power Source: Lund and Freeston, World-Wide Direct Uses of Geothermal Energy 2000, Lund and Boyd, Geothermal Direct-Generation/Energy Production Use in the United States Update: 1995-1999, J. Lund, World Status of Geothermal Energy Use Overview 1995-1999 from Installed Capacity http://www.geothermie.de/europaundweltweit/Lund/wsoge_index.htm, Sifford and Blommquist, Geothermal Electric
Power Production in the United States: A Survey and Update for 1995-1999, and G. Huttrer, The Status of World Geothermal Power Generation 1995-2000. Proceedings of the World Geothermal Congress 2000 http://geothermal.stanford.edu/wgc2000/SessionList.htm, Kyushu-Tohoku, Japan, May 28-June10, 2000.
Cumulative Installed Capacity
1980 1985 1990 1995 1996 1997 1998 1999 2000 Electricity (MWe)
U.S. 2,369 2,343 2,314 2,284 2,293 2,228 Rest of World 4,464 5,746 World Total 3,887 4,764 5,832 6,833 7,974 Direct-Use Heat* (MWth)
U.S. 4,200 Rest of World 12,975 World Total 1,950 7,072 8,064 8,664 16,209 17,175
14

Annual Generation/Energy Production from Cumulative Installed Capacity
1980 1985 1990 1995 1996 1997 1998 1999 2000 Electricity (Billion kWhe)
U.S. 14.4 15.1 14.6 14.7 15.0 15.5 Rest of World 33.8 World Total 49.3 Direct-Use Heat* (TJ) U.S. 13,890 20,302 21,700 Rest of World 98,551 141,707 163,439 World Total 86,249 112,441 162,009 185,139 * Direct-use heat includes geothermal heat pumps as well as traditional uses. Geothermal heat pumps account for 1854 MWth (14,617 TJ) in 1995 and 6849 MWth (23,214 TJ) in 1999 of the world totals and 3600 MWth (8,800 TJ) in 2000 of the U.S. total. Conversion of GWh to TJ is done at 1TJ = 0.2778 GWh.
Annual Generation from Source: U.S. electricity data from EIA, Annual Energy Review 2004, DOE/EIA-0384(2004) (Washington, D.C., Cumulative Installed Capacity August 2005), Table 8.2a; world electricity totals from Renewable Energy World/July-August 2000, page 126,
Table 2; 1997 world electricity and U.S. and world direct-use heat data from Stefansson and Fridleifsson 1998, “Geothermal Energy: European and World-wide Perspective.” 1998 world totals from UNDP World Energy Assessment 2000, Table 7.25; 1995, 2000, and 2003 direct-use heat and 1999 electricity world total from International Geothermal Association, http://iga.igg.cnr.it/index.php.
1980 1985 1990 1995 1996 1997 1998 1999 2000 2001 2002 2003 2004 Electricity (Billion kWhe) U.S. 5.1 9.3 15.4 13.4 14.3 14.7 14.8 14.8 14.1 13.7 14.5 14.4 14.4 Rest of World 8.9 7.7 3.6 6.6 29.0 31.2 35.2 World Total 14 17 19 20 43.8 46 49 49.3 Direct-Use Heat (billion kWhth) U.S. 3.9 4.0 5.6 6.2 Rest of World
31.1 World Total 31.2 40 53.0
27.4 47.3
35.1
15

Annual Geothermal Energy Source: EIA, Annual Energy Review 2004, DOE/EIA-0384(2004) (Washington, D.C., August 2005), Table 8.4a. Consumption for Electric Generation (Trillion Btu)
1980 1985 1990 1995 1996 199 1998 1999 2000 2001 2002 2003 2004 7
U.S. 110 198 326 280 300 309 311 312 296 289 305 303 302 Rest of World World Total
Annual U.S. Geothermal Heat Pump Source: EIA, Renewable Energy Annual 2004, DOE/EIA-0603(2004) (Washington, D.C., June 2006), Shipments, by type (units) Table 58.
1996 1997 1998 1999 2000 2001* 2002 2003 2004 ARI-320 4,696 4,697 7,772 10,510 7,910 7,808 N/A 6,445 10,306 9,130 ARI-325/330 26,800 25,697 28,335 26,042 31,631 26,219 N/A 26,802 25,211 31,855 Other non-ARI Rated 1995 838 991 1,327 1,714 2,138 1,554 N/A 3,892 922 2,821 Totals 32,334 31,385 37,434 38,266 41,679 35,581 N/A 37,139 36,439 43,806 * No survey was conducted for 2001.
Capacity of U.S. Heat Pump Shipments Source: EIA, Renewable Energy Annual 2004, DOE/EIA-0603(2004) (Washington, D.C., June 2006), (Rated Tons) Table 59.
1996 1997 1998 1999 2000 2001* 2002 2003 2004 ARI-320 13,120 15,060 24,708 35,776 27,970 26,469 N/A 16,756 29,238 23,764 ARI-325/330 113,925 92,819 110,186 98,912 153,947 130,132 N/A 96,541 89,731 100,317 Other non-ARI Rated 1995 3,935 5,091 6,662 6,758 9,735 7,590 N/A 12,000 5,469 20,220 Totals 130,980 112,970 141,556 141,446 191,652 164,191 N/A 125,297 124,438 144,301 1 One Rated Ton of Capacity equals 12,000 Btu's. 2 No survey was conducted for 2001.
Annual U.S. Geothermal Heat Pump Source: EIA, Renewable Energy Annual 2004, DOE/EIA-0603(2003) (Washington, D.C., June 2006), Table 61, REA Shipments by Customer Type and 2003 Table 40, REA 2002 Table 40, REA 2001 Table 40, REA 2000 Table 38, REA 1999 Table 38, and REA 1998 Model Type (units) Table 40.
1996 1997 1998 1999 2000 2001* 2002 2003 2004 Exporter 2,276 226 109 6,172 784 N/A 1,165 945 1,092 Wholesale Distributor 21,444 29,181 14,377 9,193 9,804 N/A 20,888 16,167 23,647 Retail Distributor 8,336 829 3,222 2,555 2,272 N/A 552 1,145 355 Installer 18,762 25,302 18,429 24,917 20,491 N/A 10,999 10,784 13,562
16

End User 689 657 994 66 63 N/A 207 1,103 397 Others 13 1,727 1,135 6,259 2,167 N/A 3,328 6,295 4,753 Total 51,520 57,922 38,266 49,162 35,581 N/A 37,139 36,439 43,806
Annual U.S. Geothermal Heat Pump Shipments by Export & Census Region (units)
Export Midwest Northeast South West Total
Source: EIA, Renewable Energy Annual 2004, DOE/EIA-0603(2003) (Washington, D.C., June 2006), Table 60, REA 2003 Table 39, REA 2002 Table 39, REA 2001 Table 39, REA 2000 Table 37, REA 1999 Table 37, and REA 1998 Table 39.
1996 1997 1998 1999 2000 2001* 2002 2003 2004 4,090 2,427 481 6,303 1,220 N/A 3,271 2,764 2,984
11,874 13,402 12,240 13,112 10,749 N/A 12,982 12,042 14,650 6,417 9,280 5,403 6,044 4,138 N/A 3,903 5,924 8,060
25,302 26,788 16,195 20,935 17,403 N/A 13,660 12,543 14,674 3,837 6,025 3,947 2,768 2,071 N/A 3,323 3,166 3,438
51,520 57,922 38,266 49,162 35,581 N/A 37,139 36,439 43,806
Technology Performance
Source: Renewable Energy Technology Characterizations, EPRI TR-109496, 1997.
Efficiency Capacity Factor (%) Flashed Steam
Binary Hot Dry Rock
1980 1990 1995 89 89 80
2000 92 92 81
2005 93 93 82
2010 95 95 83
2015 96 96 84
2020 96 96 85
Cost Capital Cost ($/kW) Flashed Steam
Binary Hot Dry Rock
1980 1990 1995 1,444 2,112 5,519
2000 1,372 1,994 5,176
2005 1,250 1,875 4,756
2010 1,194 1,754 4,312
2015 1,147 1,696 3,794
2020 1,100 1,637 3,276
Fixed O&M ($/kW-yr) Flashed Steam Binary Hot Dry Rock
96.4 87.4 219
87.1 78.5 207
74.8 66.8 191
66.3 59.5 179
62.25 55.95
171
58.2 52.4 163
17

Concentrating Solar Power Technology Description
Concentrating Solar Power (CSP) systems concentrate solar energy 50 to 10,000 times to produce high-temperature thermal energy, which is used to produce electricity for distributed or bulk generation process applications. System Concepts • In CSP systems, highly reflective sun-tracking mirrors produce temperatures of 400°C to 800°C in the working fluid of a receiver; this heat is used in conventional heat engines (steam or gas turbines or Stirling engines) to produce electricity at solar-toelectric efficiencies for the system of up to 30%. • CSP technologies provide firm, nonintermittent electricity generation (peaking or intermediate load capacity) when coupled with storage. • Because solar-thermal technologies can yield extremely high temperatures, the technologies could some day be used for direct conversion (rather than indirect conversion through electrochemical reactions) of natural gas or water into hydrogen for future hydrogen-based economies. Representative Technologies • A parabolic trough system focuses solar energy on a linear oil-filled receiver to collect heat to generate steam to power a steam turbine. When the sun is not shining, steam can be generated with a fossil fuel to meet utility needs. Some of the new trough plants include thermal storage. Plant sizes can range from 1.0 to 100 MWe. • A power tower system uses many large heliostats to focus the solar energy onto a tower-mounted central receiver filled with a molten-salt working fluid that produces steam. The hot salt can be stored extremely efficiently to allow power production to match utility demand, even when the sun is not shining. Plant size can range from 30 to 200 MWe. • A dish/engine system uses a dish-shaped reflector to power a small Stirling or Brayton engine/generator or a high-concentrator PV module mounted at the focus of the dish. Dishes are 2-25 kW in size and can be used individually or in small groups for distributed, remote, or village power; or in clusters (1-10 MWe) for utility-scale applications, including end-of-line support. They are easily hybridized with fossil fuel.
Technology Applications • Nine parabolic trough plants, with a rated capacity of 354 MWe, have been operating in California since the 1980s. Trough system electricity costs of about 12¢-14¢/kWh have been demonstrated commercially. • Solar Two, a 10-MWe pilot power tower with three hours of storage, provided all the information needed to scale up to a 30-100 MW commercial plant, the first of which is now being planned in Spain. • A number of prototype dish/Stirling systems are currently operating in Nevada, Arizona, Colorado, and Spain. High levels of performance have been established; durability remains to be proven, although some systems have operated for more than 10,000 hours.
18

Current Status • New commercial plants are being considered for California, Nevada, New Mexico, Colorado, and Arizona. A 1MW power plant began operation in Arizona in 2005. • The 10-MW Solar Two pilot power tower plant operated successfully near Barstow, California, leading to the first commercial plant being planned in Spain. • Operations and maintenance costs have been reduced through technology improvements at the commercial parabolic trough plants in California by 40%, saving plant operators $50 million.
Technology History Organized, large-scale development of solar collectors began in the United States in the mid-1970s under the Energy Research and Development Administration (ERDA) and continued with the establishment of the U.S. Department of Energy (DOE) in 1978. Troughs: • Parabolic trough collectors capable of generating temperatures greater than 500ºC (932 F) were initially developed for industrial process heat (IPH) applications. Acurex, SunTec, and Solar Kinetics were the key parabolic trough manufacturers in the United States during this period. • Parabolic trough development also was taking place in Europe and culminated with the construction of the IEA Small Solar Power Systems (SSPS) Project/Distributed Collector System in Tabernas, Spain, in 1981. This facility consisted of two parabolic trough solar fields – one using a single-axis tracking Acurex collector and one the double-axis tracking parabolic trough collectors developed by M.A.N. of Munich, Germany. • In 1982, Luz International Limited (Luz) developed a parabolic trough collector for IPH applications that was based largely on the experience that had been gained by DOE/Sandia and the SSPS projects. • Southern California Edison (SCE) signed a power purchase agreement with Luz for the Solar Electric Generating System (SEGS) I and II plants, which came online in 1985. Luz later signed a number of Standard Offer (SO) power purchase contracts under the Public Utility Regulatory Policies Act (PURPA), leading to the development of the SEGS III through SEGS IX projects. Initially, the plants were limited by PURPA to 30 MW in size; later this limit was raised to 80 MW. In 1991, Luz filed for bankruptcy when it was unable to secure construction financing for its 10th plant (SEGS X). • The 354 MWe of SEGS trough systems are still being operated today. Experience gained through their operation will allow the next generation of trough technology to be installed and operated much more cost-effectively. Power Towers: • A number of experimental power tower systems and components have been field-tested around the world in the past 15 years, demonstrating the engineering feasibility and economic potential of the technology. • Since the early 1980s, power towers have been fielded in Russia, Italy, Spain, Japan, and the United States. • In early power towers, the thermal energy collected at the receiver was used to generate steam directly to drive a turbine generator. • The U.S.-sponsored Solar Two was designed to demonstrate the dispatchability provided by molten-salt storage and to provide the experience necessary to lessen the perception of risk from these large systems. • U.S. industry is currently pursuing a subsidized power tower project opportunity in Spain. This project, dubbed “Solar Tres,” represents a 4x scale-up of the Solar 2 design. Dish/Engine Systems: • Dish/engine technology is the oldest of the solar technologies, dating back to the 1800s when a number of companies demonstrated solar-powered steam Rankine and Stirling-based systems.
19

• Development of modern technology began in the late 1970s and early 1980s. This technology used directly illuminated, tubular solar receivers, a kinematic Stirling engine developed for automotive applications, and silver/glass mirror dishes. Systems, nominally rated at 25 kWe, achieved solar-toelectric conversion efficiencies of around 30%. Eight prototype systems were deployed and operated on a daily basis from 1986 through 1988. • In the early 1990s, Cummins Engine Company attempted to commercialize dish/Stirling systems based on free-piston Stirling engine technology. Efforts included a 5 to 10 kWe dish/Stirling system for remote power applications, and a 25 kWe dish/engine system for utility applications. However, largely because of a corporate decision to focus on its core diesel-engine business, Cummins canceled their solar development in 1996. Technical difficulties with Cummins' free-piston Stirling engines were never resolved. • Current dish/engine efforts are being continued by three U.S. industry teams – Science Applications International Corp. (SAIC) teamed with STM Corp., Boeing with Stirling Energy Systems, and WG Associates with Sunfire Corporation. SAIC and Boeing together have five 25kW systems under test and evaluation at utility, industry, and university sites in Arizona, California, and Nevada. WGA has two 10kW systems under test in New Mexico, with a third off-grid system being developed in 2002 on an Indian reservation for water-pumping applications.
Technology Future The levelized cost of electricity (in constant 2003$/kWh) for three CSP configurations are projected at:
2003 2007 2012 2025 Trough 11.3 6.4 5.4 N/A Power Tower 12.0 5.7 4.0 N/A Dish/Engine 40.0 20.0 N/A 6
Source: Solar Energy Technologies Program Multiyear Technical Plan, NREL Report No. MP-52033875; DOE/GO-102004-1775.
• Parabolic troughs have been commercialized and nine plants (354 MW total) have operated in California since the 1980s. • A 64-MW parabolic trough plant is under construction near Boulder City, Nevada. Nevada Power and Sierra Pacific Power will purchase the power to comply with the solar portion of Nevada’s renewable portfolio standard. • The World Bank’s Solar Initiative is pursuing CSP technologies for less-developed countries. The World Bank considers CSP to be a primary candidate for Global Environment Facility funding. Market Context • There is currently 350 MW of CSP generation in the United States, all of it in Southern California's Mojave Desert. • Power purchase agreements have been signed for 800 MW of new dish/engine capacity in California. The plants are anticipated to come on-line within the next several years. Significant domestic and international interest will likely result in additional projects. • According to a recent study commissioned by the Department of Energy, CSP technologies can achieve significantly lower costs (below 6¢/kWh) at modest production volumes. • At Congress’ request, DOE scoped out what would be required to deploy 1,000MW of CSP in the Southwest United States. DOE is actively engaged with the Western Governors’ Association to map a strategy to deploy 1-4 GW of CSP in the Southwest by 2015. • A near-term to midterm opportunity exists to build production capacity in the United States for both domestic use and international exports.
Source: National Renewable Energy Laboratory. U.S. Climate Change Technology Program. Technology Options: For the Near and Long Term. DOE/PI-0002. November 2003 (draft update, September 2005).
20
Concentrating Solar Power
Market Data
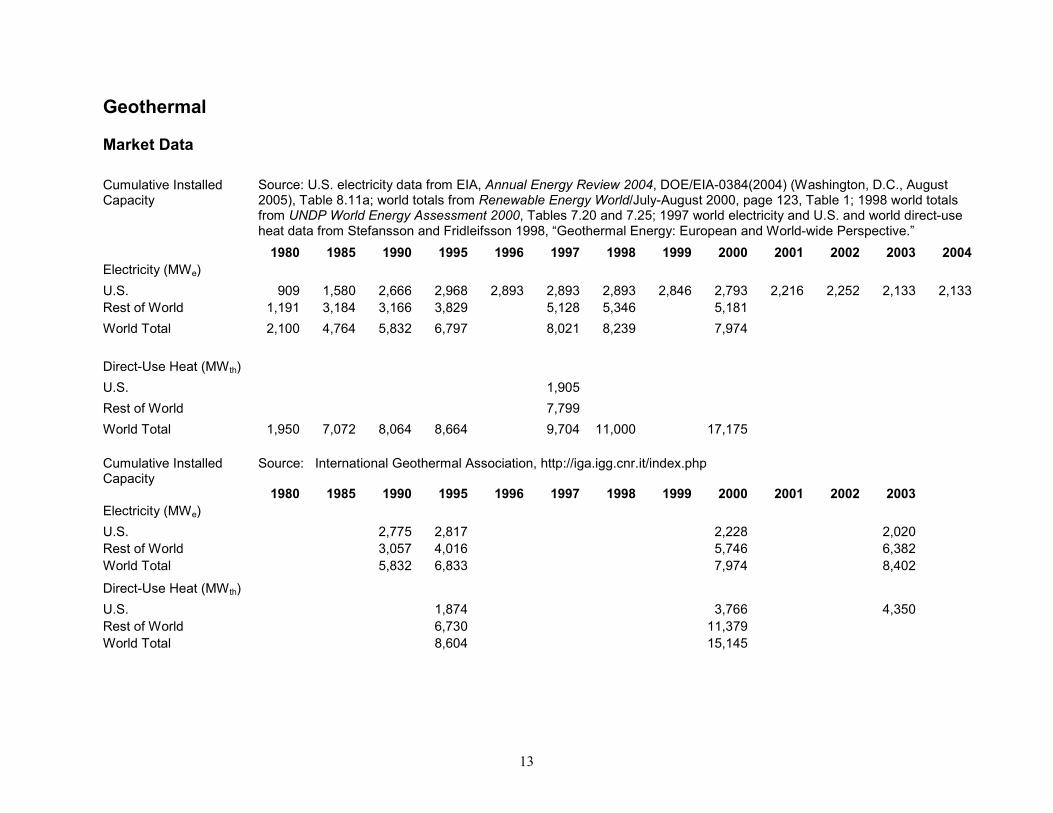
U.S. Installations (electric Source: Renewable Electric Plant Information System (REPiS), Version 7, NREL, 2003, and Renewable only) Energy Technology Characterizations, EPRI TR-109496. Cumulative (MW) 1980 1985 1990 1995 1996 1997 1998 1999 2000 2001 2002
U.S. 0 24 274 354 364 364 364 364 354 354 354 Power Tower 0 10 0 0 10 10 10 10 0 0 0 Trough 0 14 274 354 354 354 354 354 354 354 354 Dish/Engine 0 0 0 0 0 0 0.125 0.125 0.125 0.125 0.125
Annual Generation from Source: EIA, Annual Energy Outlook 1998-2006, Table A16, Renewable Resources in the Electric Supply, 1993, Table Cumulative Installed 4. Capacity (Billion kWh)
1990 1995 1996 1997 1998 1999 2000 2001 2002 2003 2004 U.S. 1* 0.82 0.90 0.89 0.89 0.87 0.49 0.54 0.54 0.57 0.58
* Includes both solar thermal and less than 0.02 billion kilowatthours grid-connected photovoltaic generation. Annual U.S. Solar Source: EIA - Annual Energy Review 2004, Table 10.3 and Renewable Energy Annual 2004 Table 30. Thermal Shipments (Thousand Square Feet)
1980 198 1990 1995 1996 1997 1998 1999 2000 2001 2002 2003 2004P
5 Total1
19,398 NA 11,409 7,666 7,616 8,138 7,756 8,583 8,354 11,189 11,663 11,444 14,114 Imports 235 NA 1,562 2,037 1,930 2,102 2,206 2,352 2,201 3,502 3,068 2,986 3,723 Exports 1,115 NA 245 530 454 379 360 537 496 840 659 518 813
1 Total shipments as reported by respondents include all domestic and export shipments and may include imports that subsequently were shipped to domestic or to foreign customers. No data are available for 1985. P = Preliminary
21

Technology Performance Efficiency
Capacity Factor (%)
Solar to Electric Eff. (%)
Source: Solar Energy Technologies Program Multiyear Technical Plan, NREL Report No. MP-520-33875; DOE/GO-102004-1775.
2003 2005 2007 2012 2018 2025 Power Tower 78 75 73 NA 72 NA Trough 28 39 56 56 NA NA Dish 24 NA 24 NA NA 50 Power Tower 14 16 17 NA 18 NA Trough 13 13 16 17 NA NA Dish 20 NA 23 NA NA 26
Cost* Total ($/kWe)
O&M ($/kWh)
Levelized Cost of Energy ($/kWh)
2003 2005 2007 2012 2018 2025 Power Tower 6800 4100 3500 NA 2500 NA Trough 2805 3556 3422 2920 NA NA Dish NA NA NA NA NA NA Power Tower .04 .01 .01 NA .01 NA Trough .02 .01 .01 .007 NA NA Dish NA NA NA NA NA NA Power Tower .12 .06 .06 NA .04 NA Trough .11 .10 .06 .05 NA NA Dish .40 NA .20 NA NA .06
22

Photovoltaics Technology Description
Solar photovoltaic (PV) arrays use semiconductor devices called solar cells to convert sunlight to electricity without moving parts and without producing fuel wastes, air pollution, or greenhouse gases. Using solar PV for electricity – and eventually using solar PV to produce hydrogen for fuel cells for electric vehicles, by producing hydrogen from water – will help reduce carbon dioxide emissions worldwide. System Concepts • Flat-plate PV arrays use global sunlight; concentrators use direct sunlight. Modules are mounted on a stationary array or on single- or dual-axis sun trackers. Arrays can be ground-mounted or on all types of buildings and structures (e.g., semitransparent solar canopy). The DC output from PV can be conditioned into grid-quality AC electricity, or DC can be used to charge batteries or to split water to produce hydrogen (electrolysis of water). • PV systems are expected to be used in the United States for residential and commercial buildings, peak-power shaving, and intermediate daytime load. With energy storage, PV can provide dispatchable electricity and/or produce hydrogen. • Almost all locations in the United States and worldwide have enough sunlight for cost-effective PV. For example, U.S. sunlight in the contiguous states varies by only about 25% from an average in Kansas. Land area is not a problem for PV. Not only can PV be more easily sited in a distributed fashion than almost all alternatives (for example, on roofs or above parking lots), a PV-generating station 140 km by 140 km sited at a high solar insolation location in the United States (such as the desert Southwest) could generate all of the electricity needed in the country (2.5 × 10⁶ GWh/year, assuming a system efficiency of 10% and an area packing factor of 50% to avoid self-shading). Representative Technologies • Wafers of single-crystal or polycrystalline silicon – best cells: 25% efficiency; commercial modules: 12%-17%. Silicon modules dominate the PV market and currently cost about $2/Wp to manufacture. • Thin-film semiconductors (e.g., amorphous silicon, copper indium diselenide, cadmium telluride, and dye-sensitized cells) – best cells: 12%-19%; commercial modules: 6%-11%. A new generation of thin-film PV modules is going through the high-risk transition to first-time and large-scale manufacturing. If successful, market share could increase rapidly. • High-efficiency, single-crystal silicon and multijunction gallium-arsenide-alloy cells for concentrators – best cells: 27%-39% efficient; precommercial modules: 15%-24%; prototype systems are being tested in high solar areas in the southwest United States. • Grid-connected PV systems currently sell for about $6-$7/Wp (17¢-22¢/kWh), including support structures, power conditioning, and land.
Technology Applications • PV systems can be installed as either grid-supply technologies or as customer-sited alternatives to retail electricity. As suppliers of bulk grid power, PV modules would typically be installed in large array fields ranging in total peak output from a few megawatts on up. Very few of these systems have
23

been installed to-date. A greater focus of the recent marketplace is on customer-sited systems, which may be installed to meet a variety of customer needs. These installations may be residential-size systems of just 1 kilowatt, or commercial-size systems of several hundred kilowatts. In either case, PV systems meet customer needs for alternatives to purchased power, reliable power, protection from price escalation, desire for green power, etc. Interest is growing in the use of PV systems as part of the building structure or façade (“building integrated”). Such systems use PV modules designed to look like shingles, windows, or other common building elements. • PV systems are expected to be used in the United States for residential and commercial buildings; distributed utility systems for grid support, peak power shaving, and intermediate daytime load following; with electric storage and improved transmission for dispatchable electricity; and H2 production for portable fuel. • Other applications for PV systems include electricity for remote locations, especially for billions of people worldwide who do not have electricity. Typically, these applications will be in hybrid minigrid or battery-charging configurations. • Almost all locations in the United States and worldwide have enough sunlight for PV (e.g., U.S. sunlight varies by only about 25% from an average in Kansas). • Land area is not a problem for PV. Not only can PV be more easily sited in a distributed fashion than almost all alternatives (e.g., on roofs or above parking lots), a PV-generating station 140 km-by140 km sited at an average solar location in the United States could generate all of the electricity needed in the country (2.5 × 10⁶ GWh/year), assuming a system efficiency of 10% and an area packing factor of 50% (to avoid self-shading). This area (0.3% of U.S.) is less than one-third of the area used for military purposes in the United States.
Current Status • Because of public/private partnerships, such as the Thin-Film Partnership with its national research teams, U.S. PV technology leads the world in measurable results such as record efficiencies for cells and modules. Another partnership, the PV Advanced Manufacturing R&D program, has resulted in industry cost reductions of more than 60% and facilitated a sixteen-fold increase of manufacturing capacity during the past 12 years. • A new generation of potentially lower-cost technologies (thin films) is entering the marketplace. A 30-megawatt amorphous silicon thin-film plant by United Solar reached full production in 2005. Two plants (First Solar and Shell Solar) using even newer thin films (cadmium telluride and copper indium diselenide alloys) are in first-time manufacturing at the MW-scale. Thin-film PV has been a focus of the federal R&D efforts of the past decade, because it holds promise for module cost reductions. • During the past two years, record sunlight-to-electricity conversion efficiencies for solar cells were set by federally funded universities, national labs, or industry in copper indium gallium diselenide (19%-efficient cells and 13%-efficient modules) and cadmium telluride (16%-efficient cells and 11%efficient modules). Cell and module efficiencies for these technologies have increased more than 50% in the past decade. • A unique multijunction (III-V materials alloy) cell was spun off to the space power industry, leading to a record cell efficiency (35%) and an R&D 100 Award in 2001. This device configuration is expected to dominate future space power for commercial and military satellites. Recent champion cell efficiency has reached 39% under concentrated sunlight. DOE is interested in this technology (III-V multijunctions), as an insertion candidate for high efficiency terrestrial PV concentrator systems.
Technology History • French physicist Edmond Becquerel first described the photovoltaic (PV) effect in 1839, but it remained a curiosity of science for the next three quarters of a century. At only 19, Becquerel found that certain materials would produce small amounts of electric current when exposed to light. The effect was first studied in solids, such as selenium, by Heinrich Hertz in the 1870s. Soon afterward, selenium PV cells were converting light to electricity at more than 1% efficiency. As a result, selenium was quickly adopted in the emerging field of photography for use in light-measuring devices.
24

• Major steps toward commercializing PV were taken in the 1940s and early 1950s, when the Czochralski process was developed for producing highly pure crystalline silicon. In 1954, scientists at Bell Laboratories depended on the Czochralski process to develop the first crystalline silicon photovoltaic cell, which had an efficiency of 4%. Although a few attempts were made in the 1950s to use silicon cells in commercial products, it was the new space program that gave the technology its first major application. In 1958, the U.S. Vanguard space satellite carried a small array of PV cells to power its radio. The cells worked so well that PV technology has been part of the space program ever since. • Even today, PV plays an important role in space, supplying nearly all power for satellites. The commercial integrated circuit technology also contributed to the development of PV cells. Transistors and PV cells are made from similar materials and operate on similar physical mechanisms. As a result, advances in transistor research provided a steady flow of new information about PV cell technology. (Today, however, this technology transfer process often works in reverse, as advances in PV research and development are sometimes adopted by the integrated circuit industry.) • Despite these advances, PV devices in 1970 were still too expensive for most “down-to-Earth” uses. But, in the mid-1970s, increasing energy costs, sparked by a world oil crisis, renewed interest in making PV technology more affordable. Since then, the federal government, industry, and research organizations have invested billions of dollars in research, development, and production. A thriving industry now exists to meet the rapidly growing demand for photovoltaic products.
Technology Future The levelized cost of electricity (in constant 2003$/kWh) for PV are projected to be:
2003 2007 2020 2025 Utility-owned Residential 0.25-0.40 0.22 0.8-0.10 NA (crystalline Si) Concentrator 0.40 0.20 NA 0.04-0.06
Source: Solar Energy Technologies Program Multiyear Technical Plan, NREL Report No. MP-52033875; DOE/GO-102004-1775.
• Worldwide, approximately 1,200 MW of PV were sold in 2004, with systems valued at more than $7 billion; total installed PV is more than 2 GW. The U.S. world market share fell to about 12% in 2004. • Worldwide, market growth for PV has averaged more than 20%/year for the past decade as a result of reduced prices and successful global marketing. Worldwide sales grew 36% in 2001, 44% in 2002, 33% in 2003, and 60% in 2004. • Hundreds of applications are cost-effective for off-grid needs. However, the fastest-growing segment of the market is battery-free, grid-connected PV, such as roof-mounted arrays on homes and commercial buildings in the United States. California is subsidizing PV systems to reduce their dependence on natural gas, especially for peak daytime loads that match PV output, such as air-conditioning. Market Context • Electricity for remote locations, especially for billions of people worldwide who do not have electricity. • U.S. markets include retail electricity for residential and commercial buildings; distributed utility systems for grid support, peak-shaving, and other daytime uses (e.g., remote water pumping). • Future electricity and hydrogen storage for dispatchable electricity, electric car-charging stations, and hydrogen production for portable fuel.
Source: National Renewable Energy Laboratory. U.S. Climate Change Technology Program. Technology Options: For the Near and Long Term. DOE/PI-0002. November 2003 (draft update, September 2005).
25

Photovoltaics
Market Data
PV Cell/Module Production Source: PV News, Vol. 15, No. 2, Feb. 1996; Vol. 16, No. 2, Feb. 1997; Vol. 20, No. 2, Feb. 2001; Vol. 22, (Shipments) No. 5, May 2003; and Volume 23, No. 4, April 2004. Paul Maycock, www.pvenergy.com Annual (MW) 1980 1985 1990 1995 1996 1997 1998 1999 2000 2001 2002 2003 U.S. 3 8 15 35 39 51 54 61 75 100 121 103 Japan 1 10 17 16 21 35 49 80 129 171 251 364 Europe 0 3 10 20 19 30 34 40 61 87 135 193 Rest of World 0 1 5 6 10 9 19 21 23 33 54 84 World Total 4 23 47 78 89 126 155 201 288 391 560 744
Cumulative (MW) 1980 1985 1990 1995 1996 1997 1998 1999 2000 2001 2002 2003 U.S. 5 45 101 219 258 309 363 424 499 599 720 823 Japan 1 26 95 185 206 241 290 370 499 670 921 1,285 Europe 1 13 47 136 155 185 219 259 320 407 542 735 Rest of World 0 3 20 45 55 65 83 104 127 160 214 298 World Total 7 87 263 585 674 800 954 1,156 1,444 1,835 2,395 3,139
U.S. % of World Sales 1980 1985 1990 1995 1996 1997 1998 1999 2000 2001 2002 2003 Annual 71% 34% 32% 44% 44% 41% 35% 30% 26% 26% 22% 14% Cumulative 75% 52% 39% 37% 38% 39% 38% 37% 35% 33% 30% 26%
Annual Capacity Source: Strategies Unlimited (Shipments retained, MW)*
1980 1985 1990 1995 1996 1997 1998 1999 2000 U.S. 1.4 4.2 5.1 8.4 9.2 10.5 13.6 18.4 21.3 Total World 3 15 39 68 79 110 131 170 246
*Excludes indoor consumer (watches/calculators).
26

Cumulative Capacity Source: Strategies Unlimited (Shipments retained, MW)*
1980 1985 1990 1995 1996 1997 1998 1999 2000 U.S. 3 23 43 76 85 96 109 128 149 Total World 6 61 199 474 552 663 794 964 1,210
*Excludes indoor consumer (watches/calculators).
U.S. Shipments (MW) Source: EIA, Annual Energy Review 2004, DOE/EIA-0384(2004) (Washington, D.C., September 2004), Tables 10.5 and 10.6; and EIA, Renewable Energy Annual 2003, DOE/EIA-0603(2003) (Washington, D.C., December 2004) Table 26.
Annual Shipments 1985 1990 1995 1996 1997 1998 1999 2000 2001 2002 2003 2004 Total 5.8 13.8 31.1 35.5 46.4 50.6 76.8 88.2 97.7 112.1 109.4 181.1 Imports 0.3 1.4 1.3 1.9 1.9 1.9 4.8 8.8 10.2 7.3 9.7 47.7 Exports 1.7 7.5 19.9 22.4 33.8 35.5 55.6 68.4 61.4 66.8 60.7 102.8
Domestic Total On-Grid* 0.4 0.2 1.7 1.8 2.2 4.2 6.9 4.9 10.1 13.7 18.9 55.9 Domestic Total Off-Grid* 3.7 6.1 9.5 11.2 10.3 10.8 14.4 15.0 26.2 31.6 29.8 22.4
Cumulative Shipments 1985 1990 1995 1996 1997 1998 1999 2000 2001 2002 2003 2004 (since 1982) Total 35.2 84.7 193.3 228.8 275.2 325.7 402.5 490.7 588.4 700.5 809.8 991.0 Imports 1.0 5.6 14.3 16.2 18 19.9 24.7 33.5 43.7 51.0 60.8 108.5 Exports 5.7 32.9 104 126.5 160.3 195.8 251.3 319.7 381.0 447.8 508.5 611.3
Domestic Total On-Grid* 2.9 4.7 8.2 10.0 12.2 16.5 23.3 28.2 38.3 52.0 70.9 126.9 Domestic Total Off-Grid* 26.6 47.2 81.1 92.3 102.7 113.5 127.9 142.8 169.0 200.6 230.4 252.8 * Domestic Totals include imports and exclude exports. Electricity generation only, excludes water pumping, communications, transportation, consumer goods, health, and original equipment manufacturers.
U.S. Shipments (MW) Source: Renewable Energy World, July-August 2003, Volume 6, Number 4; and PV News, Vol. 23, No. 5, May 2004
1980 1985 1990 1995 1996 1997 1998 1999 2000 2001 2002 2003 Total 34.8 38.9 51.0 53.7 60.8 75.0 100.3 120.6 103.0 Imports 2.0 4.0 5.0 9.0 18.0 Exports 24.0 25.1 36.3 37.9 39.8 55.0 73.3 81.2 54.0
27

Annual U.S. Installations Source: The 2002 National Survey Report of Photovoltaic Power Applications in the United States, prepared (MW) by Paul D. Maycock and Ward Bower, May 31, 2003, prepared for the IEA, Table 1. http://www.oja-
services.nl/iea-pvps/nsr02/download/usa.pdf; and PV News, Vol. 23 No. 5. 1980 1985 1990 1995 1996 1997 1998 1999 2000 2001 2002 2003
Grid-Connected 1.5 2.0 2.0 2.2 3.7 5.5 12.0 22.0 32.0Distributed Off-Grid Consumer 3.5 4.0 4.2 4.5 5.5 6.0 7.0 8.4 9.0 Government 0.8 1.2 1.5 1.5 2.5 2.5 1.0 1.0 1.0 Off-Grid 4.0 4.4 4.8 5.2 6.5 7.5 9.0 13.0 16.0Industrial/Commercial Consumer (<40 w) 2.0 2.2 2.2 2.4 2.5 2.5 3.0 4.0 4.0 Central Station 0 0 0 0 0 0 0 0 5.0 Total 11.8 13.8 14.7 15.8 20.7 24.0 32.0 48.4 67.0
Cumulative U.S. Source: The 2002 National Survey Report of Photovoltaic Power Applications in the United States, prepared Installations* (MW) by Paul D. Maycock and Ward Bower, May 31, 2003, prepared for the IEA, Table 1
http://www.oja-services.nl/iea-pvps/nsr02/usa2.htm. 1980 1985 1990 1995 1996 1997 1998 1999 2000 2001 2002 2003
Off-grid Residential 19.3 23.3 27.5 32.0 37.5 43.5 50.5 Off-grid Nonresidential 25.8 30.2 35.0 40.2 46.7 55.2 64.7 On-grid Distributed 9.7 11.0 13.7 15.9 21.1 28.1 40.6 On-grid Centralized 12.0 12.0 12.0 12.0 12.0 12.0 12.0 Total 66.8 76.5 88.2 100.1 117.3 138.8 167.8 * Excludes installations less than 40kW.
Annual World Installations Source: Renewable Energy World, July-August 2003, Volume 6, Number 4. (MW)
1980 1985 1990 1995 1996 1997 1998 1999 2000 2001 2002 Consumer Products 16 22 26 30 35 40 45 60 U.S. Off-Grid Residential 3 8 9 10 13 15 19 25 World Off-Grid Rural 6 15 19 24 31 38 45 60 Communications/ Signal N/A N/A 14 N/A 23 28 31 35 40 46 60 PV/Diesel, Commercial 7 12 16 20 25 30 36 45 Grid-Conn. Res., Comm. 1 7 27 36 60 120 199 270 Central Station (>100kW) 1 2 2 2 5 5 5 Total 48 89 127 153 201 288 395 525
28
2

Annual U.S. Shipments by Source: PV News, Vol. 15, No. 2, Feb. 1996; Vol. 16, No. 2, Feb. 1997; Vol. 17, No. 2, Feb. 1998; Vol. 18, Cell Type (MW) No. 2, Feb. 1999; Vol. 19, No. 3, March 2000; Vol. 20, No. 3, March 2001; Vol. 21, No. 3, March 2002; Vol.
22, No. 5, May 2003; and Renewable Energy World, July-August 2003, Volume 6, Number 4.
1980 1985 1990 1995 1996 1997 1998 1999 2000 2001 2002 Single Crystal 22.0 24.1 31.8 30.0 36.6 44.0 63.0 71.9 Flat-Plate Polycrystal (other than 9.0 10.3 14.0 14.7 16.0 17.0 20.6 24 ribbon) Amorphous Silicon 1.3 1.1 2.5 3.8 5.3 6.5 7.3 11 Crystal Silicon 0.3 0.7 0.7 0.2 0.5 0.5 0.5 0.5 Concentrators Ribbon Silicon N/A N/A N/A 2.0 3.0 4.0 4.0 4.2 5.0 6.9 6.9 Cadmium Telluride 0.1 0.4 0 0 0 0 0.6 1.6 Microcrystal SI/Single SI -SI on Low-Cost-Sub 0.1 0.3 0.5 1.0 2.0 2.0 1.7 1.7 A-SI on Cz Slice 0 0 -Total 34.8 39.9 53.5 53.7 64.6 75 100.6 120.6
Annual World Shipments Source: PV News, Vol. 15, No. 2, Feb. 1996; Vol. 16, No. 2, Feb. 1997; Vol. 17, No. 2, Feb. 1998; Vol. 18, by Cell Type (MW) No. 2, Feb. 1999; Vol. 19, No. 3, March 2000; Vol. 20, No. 3, March 2001; Vol. 21, No. 3, March 2002; Vol.
22, No. 5, May 2003; and Renewable Energy World, July-August 2003, Volume 6, Number 4. 1980 1985 1990 1995 1996 1997 1998 0 1999 2000 2001 2002
Single Crystal 46.7 48.5 62.8 59.8 73 89.7 150.41 162.31 Flat-Plate Polycrystal 20.1 24 43 66.3 88.4 140.6 278.9 306.55 Amorphous Silicon 9.1 11.7 15 19.2 23.9 27 28.01 32.51 Crystal Silicon 0.3 0.7 0.2 0.2 0.5 0.5 0.5 0.5 Concentrators Ribbon Silicon N/A N/A N/A 2 3 4 4 4.2 14.7 16.9 16.9 Cadmium Telluride 1.3 1.6 1.2 1.2 1.2 1.2 2.1 4.6 Microcrystal SI/Single SI 3.7 SI on Low-Cost-Sub 0.1 0.3 0.5 1 2 2 1.7 1.7 A-SI on Cz Slice 8.1 12 30 30 Total 79.5 89.8 126.7 151.7 201.3 287.7 512.22 561.77
293.7

Annual U.S. Shipments by Source: EIA, Solar Collector Manufacturing Activity annual reports, 1982-1992; and EIA, Renewable Energy Cell Type (MW) Annual 1997, Table 27; REA 2000, Table 26; REA 2002, Table 28; REA 2003, Table 28.
1985 1990 1995 1996 1997 1998 1999 2000 2001 2002 2003 2004 Single-Crystal Silicon 19.9 21.7 30 30.8 47.2 51.9 54.7 74.7 59.4 94.9 Cast and Ribbon 64.29.9 12.3 14.3 16.4 26.2 33.2 29.9 29.4 38.6Crystalline Silicon Crystalline Silicon Total 5.5 12.5 29.8 34 44.3 47.2 73.5 85.2 84.7 104.1 98.0 159.1 Thin-Film Silicon 0.3 1.3 1.3 1.4 1.9 3.3 3.3 2.7 12.5 7.4 11.0 22.0 Concentrator Silicon 0.1 0.2 0.2 0.1 0.1 0.3 0.5 0.6 0.5 0 Other Total 5.8 13.8 31.2 35.6 46.3 50.6 76.8 88.2 97.7 112.1 109.5 181.1
Annual Grid-Connected Source: The 2002 National Survey Report of Photovoltaic Power Applications in the United States, prepared Capacity (MW) by Paul D. Maycock and Ward Bower, May 31, 2003, prepared for the IEA, derived from Table 1
http://www.oja-services.nl/iea-pvps/nsr02/usa2.htm. Japan data from PV News, Vol. 23, No. 1, January 2004.
1995 1996 1997 1998 1999 2000 2001 2002 2003 U.S. 1.3 2.7 2.2 5.2 7.0 12.5 Japan 3.9 7.5 19.5 24.1 57.7 74.4 91.0 155.0 168.0
Note: Japan data not necessarily grid-connected
Cumulative Grid- Source: The 2002 National Survey Report of Photovoltaic Power Applications in the United States, prepared Connected Capacity (MW) by Paul D. Maycock and Ward Bower, May 31, 2003, prepared for the IEA, derived from Table 1
http://www.oja-services.nl/iea-pvps/nsr02/usa2.htm. Japan data from PV News, Vol. 23, No. 1, January 2004.
1995 1996 1997 1998 1999 2000 2001 2002 2003 U.S. 21.7 23.0 25.7 27.9 33.1 40.1 52.6 Japan 5.8 13.3 32.8 56.9 114.6 189.0 280.0 435.0 603.0
Japan Grid-Connected Source: IEA Photovoltaic Power Systems Program, National Survey Report of PV Power Applications in Capacity (MW) Japan 2002, http://www.oja-services.nl/iea-pvps/nsr02/jpn2.htm Table 1.
1995 1996 1997 1998 1999 2000 2001 2002 Annual 6.0 9.7 22.6 34.7 71.3 114.8 119.3 178.2 Cumulative 13.7 23.4 46.0 80.7 151.9 266.7 386.0 564.2
30

Annual U.S.-Installed Capacity (MW) Source: Renewable Electric Plant Information System (REPiS), Version 7, NREL, 2003.
Top 10 States 1980 1985 1990 1995 1996 1997 1998 1999 2000 2001 2002 2003 California 0.034 0.016 0.720 0.900 0.606 0.577 2.993 5.833 7.236 16.072 7.452 Arizona 0.004 0.026 0.067 0.724 0.301 0.574 0.177 2.516 1.333 0.008 New York 0.013 0.067 0.425 0.021 0.246 0.041 0.377 1.078 Ohio 0.001 0.001 0.010 0.144 0.004 1.986 Hawaii 0.000 0.046 0.008 0.291 0.113 0.250 0.275 Texas 0.006 0.015 0.002 0.008 0.010 0.133 0.248 0.089 0.028 0.020 Colorado 0.018 0.100 0.006 0.132 0.344 0.137 Georgia 0.352 0.019 0.221 0.003 0.032 Florida 0.009 0.008 0.018 0.036 0.047 0.106 0.202 0.031 0.050 Illinois 0.002 0.005 0.034 0.043 0.449 0.044 Total U.S. 0.015 0.078 0.049 1.029 2.131 1.670 1.899 5.140 8.244 10.807 21.251 8.008
2003 data not complete as REPiS database is updated through 2002.
Cumulative U.S.-Installed Capacity (MW) Source: Renewable Electric Plant Information System (REPiS), Version 7, NREL, 2003.
Top 10 States 1980 1985 1990 1995 1996 1997 1998 1999 2000 2001 2002 2003 California 0.002 1.369 2.803 6.495 7.396 8.002 8.579 11.572 17.405 24.641 40.713 48.164 Arizona 0.008 0.032 0.048 0.097 0.164 0.888 1.190 1.764 1.941 4.457 5.790 5.798 New York 0 0 0.013 0.226 0.650 0.671 0.917 0.958 1.334 1.334 2.412 2.412 Ohio 0 0 0 0 0 0.001 0.002 0.012 0.155 0.159 2.145 2.145 Hawaii 0 0.014 0.033 0.033 0.079 0.087 0.378 0.491 0.741 1.016 1.016 1.016 Texas 0.006 0.021 0.366 0.437 0.437 0.446 0.579 0.828 0.917 0.945 0.965 0.965 Colorado 0 0 0.010 0.040 0.140 0.146 0.278 0.622 0.759 0.759 0.759 0.759 Georgia 0 0 0 0 0.352 0.352 0.352 0.371 0.592 0.592 0.595 0.627 Florida 0.009 0.093 0.117 0.135 0.135 0.171 0.218 0.325 0.527 0.558 0.609 0.609 Illinois 0 0 0.021 0.021 0.021 0.023 0.029 0.062 0.105 0.554 0.598 0.598 Total U.S. 1 0.025 2.104 4.170 8.560 10.691 12.362 14.261 19.401 27.645 38.452 59.703 67.710
1 There are an additional 3.4 MW of photovoltaic capacity that are not accounted for here because they have no specific online date. 2003 data not complete as REPiS database is updated through 2002.
31

Technology Performance
Efficiency Cell (%)
Source: Solar Energy Technologies Program Multiyear Technical Plan, NREL Report No. MP-520-33875; DOE/GO-102004-1775.
2003 2007 2020 2025 Crystalline Silicon NA NA NA NA Concentrator 25 33 NA 40
Module (%) Crystalline Silicon Concentrator
14 NA
15 NA
15-20 NA
NA NA
System (%) Crystalline Silicon Concentrator
11.5 15
14 22
16 NA
NA 33
Cost Module ($/Wp)
($/m 2)
BOS ($/Wp)
Crystalline Silicon Concentrator
Crystalline Silicon Concentrator
2003 4.80 160
0.85 0.60
2007 2.50 90
0.60 0.30
2020 1.00-1.50
NA
0.40 NA
2025 NA 80
NA 0.15
Total Installed System ($/Wp) Crystalline Silicon * Concentrator
6.20-9.50 NA
5.20 NA
2.30-2.80 NA
NA NA
O&M ($/kWh) Crystalline Silicon Concentrator
0.08 0.02
.0.02 0.01
0.005 NA
NA 0.005
32

Wind Energy Technology Description
Wind turbine technology converts the kinetic energy in wind to electricity. Grid-connected wind power reduces greenhouse gas emissions by displacing the need for natural gas and coal-fired generation. Village and off-grid applications are important for displacing diesel generation and for improving quality of life, especially in developing countries. System Concepts • Most modern wind turbines operate using aerodynamic lift generated by airfoil-type blades, yielding much higher efficiency than traditional windmills that relied on wind “pushing” the blades. Lifting forces spin the blades, driving a generator that produces electric power in proportion to wind speed. Turbines either rotate at constant speed and directly link to the grid, or at variable speed for better performance, using a power electronics system for grid connection. Utility-scale turbines for wind plants range in size up to several megawatts, and smaller turbines (under 100 kilowatts) serve a range of distributed, remote, and standalone power applications. Representative Technologies • The most common machine configuration is a three-bladed wind turbine, which operates “upwind” of the tower, with the blades facing into the wind. To improve the cost-effectiveness of wind turbines, technology advances are being made for rotors and controls, drive trains, towers, manufacturing methods, site-tailored designs, and offshore and onshore foundations.
Technology Applications • In the United States, the wind energy capacity exploded from 1,600 MW in 1994 to more than 9,200 MW by the end of 2005 – enough to serve more than 2.5 million households. • Current performance is characterized by levelized costs of 3¢-5¢/kWh (depending on resource quality and financing terms), capacity factors of 30%-50%, availability of 95-98%, total installed costs of approximately $1,000-$1,300/kW, and efficiencies of 65%-75% of theoretical (Betz limit) maximum.
Current Status • In 1989, the wind program set a goal of 5¢/kWh by 1995 and 4¢/kWh by 2000 for sites with average wind speeds of 16 mph. The program and the wind industry met the goals as part of dramatic cost reductions from 25¢-50¢/kWh in the early 1980s to 4¢-6¢/kWh today (2005). • Wind power is the world’s fastest-growing energy source. In the past decade, the global wind energy capacity has increased tenfold from 3,500 MW in 1994 to almost 50,000 MW by the end of 2004. During 2004, nearly 8,000 MW of new capacity was added worldwide. • Domestic public interest in environmentally responsible electric generation technology is reflected by new state energy policies and in the success of “green marketing” of wind power throughout the country. • The National Wind Technology Center (operated by the National Renewable Energy Laboratory in Golden, Colorado) is recognized as a world-class center for wind energy R&D and has many facilities – such as blade structural test stands and a large gearbox test stand – not otherwise available to the domestic industry.
Technology History • Prior to 1980, DOE sponsored (and NASA managed) large-scale turbine development – starting with hundred-kilowatt machines and culminating in the late 1980s with the 3.2-MW, DOE-supported Mod-5 machine built by Boeing. • Small-scale (2-20 kW) turbine development efforts also were supported by DOE at the Rocky Flats test site. Numerous designs were available commercially for residential and farm uses.
33

• In 1981, the first wind farms were installed in California by a small group of entrepreneurial companies. PURPA provided substantial regulatory support for this initial surge. • During the next five years, the market boomed, installing U.S., Danish, and Dutch turbines. • By 1985, annual market growth had peaked at 400 MW. Following that, federal tax credits were abruptly ended, and California incentives weakened the following year. • In 1988, European market exceeded the United States for the first time, spurred by ambitious national programs. A number of new companies emerged in the U.K. and Germany. • In 1989, DOE’s focus changed to supporting industry-driven research on components and systems. At the same time, many U.S. companies became proficient in operating the 1,600 MW of installed capacity in California. They launched into value engineering and incremental increases in turbine size. • DOE program supported value-engineering efforts and other advanced turbine-development efforts. • In 1992, Congress passed the Renewable Energy Production Tax Credit (REPI), which provided a 1.5 cent/kWh tax credit for wind-produced electricity. Coupled with several state programs and mandates, installations in the United States began to increase. • In 1997, Enron purchased Zond Energy Systems, one of the value-engineered turbine manufacturers. In 2002, General Electric Co. purchased Enron Wind Corporation. • In FY2001, DOE initiated a low wind-speed turbine development program to broaden the U.S. cost-competitive resource base. • In 2004, Clipper Windpower began testing on its highly innovative, multiple-drive 2.5 MW Liberty prototype wind turbine. • In 2005, the U.S. wind energy industry had a record-breaking year for new installations, adding more than 2,400 MW of new capacity to the nation’s electric grid. • In 2006, the U.S. Department of Energy signed a $27 million contract with General Electric to develop a multimegawatt offshore wind power system; and Clipper Windpower begins manufacturing its multiple-drive, 2.5 MW turbine.
Technology Future The levelized cost of electricity (2002 $/MWh) for wind energy technology is projected to be:
2005 2010 2020 2030 2040 2050 Class 4 5.5 4.0 3.1 2.9 2.9 2.8 Class 6 4.1 3.0 2.6 2.5 2.4 2.3
Source: Projected Benefits of Federal Energy Efficiency and Renewable Energy Programs – FY 2006 Budget Request, NREL/TP-620-37931, May 2005.
• Installed wind capacity in the United States expanded from 2,554 MW to 4,150 MW during the period of 2000 to 2005, but still make up less than 1% of total U.S. generation. • California has the greatest installed wind capacity, followed by Texas, Iowa, Minnesota, Oregon, Washington, Wyoming, New Mexico, Colorado, and Oklahoma. • Wind technology is competitive today in bulk power markets at Class 5 and 6 wind sites, with support from the production tax credit – and in high-value niche applications or markets that recognize non-cost attributes. Its competitiveness is negatively affected by policies regarding ancillary services and transmission and distribution regulations. • Continued cost reductions from low wind-speed technologies will increase the resource areas available for wind development by 20-fold and move wind generation five times closer to major load centers. • Wind energy is often the least variable cost source of generation in grid supplied electricity and due to its less predictable (variable resource) supply; wind usually displaces natural gas and coal generated electricity as these sources adjust to hourly changes in demand and supply. Emerging markets for wind energy include providing energy for water purification, irrigation, and hydrogen production.
34

• Utility restructuring is a critical challenge to increased deployment in the near term because it emphasizes short-term, low-capital-cost alternatives – and lacks public policy to support deployment of sustainable technologies such as wind energy, leaving wind power at a disadvantage. • In the United States, the wind industry is thinly capitalized, except for General Electric Wind Energy, which recently acquired wind technology and manufacturing assets in April 2002. About six manufacturers and six to 10 developers characterize the U.S. industry. • In Europe, there are about 10 turbine manufacturers and about 20 to 30 project developers. European manufacturers have established North American manufacturing facilities and are actively participating in the U.S. market. • Initial lower levels of wind deployment (up to 15%-20% of the total U.S. electric system capacity) are not expected to introduce significant grid reliability issues. Because the wind resource is variable, intensive use of this technology at larger penetrations may require modification to system operations or ancillary services. Transmission infrastructure upgrades and expansion will be required for large penetrations of onshore wind turbines. However, offshore resources are located close to major load centers. • Small wind turbines (100 kW and smaller) for distributed and residential grid-connected applications are being used to harness the nation’s abundant wind resources and defer impacts to the long-distance transmission market. Key market drivers include state renewable portfolio standards, incentive programs, and demand for community-owned wind applications.
Source: National Renewable Energy Laboratory. U.S. Climate Change Technology Program. Technology Options: For the Near and Long Term. DOE/PI-0002. November 2003 (draft update, September 2005).
35

Wind
Market Data
Grid-Connected Wind Source: Reference IEA (data supplemented by Windpower Monthly, April 2001), 2001 data from Windpower Monthly, Capacity (MW) January 2002, 2002 data from AWEA "Global Wind Energy Market Report 2004".
Cumulative 1980 1985 1990 1995 1996 1997 1998 1999 2000 2001 2002 2003 U.S. 10 1,039 1,525 1,770 1,794 1,741 1,890 2,455 2,554 4,240 4,685 6,374 Germany 2 3 60 1,137 1,576 2,082 2,874 4,445 6,095 8,100 11,994 14,609 Spain 0 0 9 126 216 421 834 1,539 2,334 3,175 4,825 6,202 Denmark 3 50 310 630 785 1,100 1,400 1,752 2,338 2,417 2,889 3,110 Netherlands 0 0 49 255 305 325 364 416 447 483 693 912 Italy 3 22 70 103 180 282 427 682 788 904
0 0 6 193 264 324 331 344 391 477 552 649 UK Europe 5 58 450 2,494 3,384 4,644 6,420 9,399 12,961 16,362 23,308 28,706 India 0 0 20 550 820 933 968 1,095 1,220 1,426 1,702 2110 Japan 0 0 1 10 14 7 32 75 121 250 415 686 Rest of World 0 0 6 63 106 254 315 574 797 992 1,270 1,418
World Total 15 1,097 2,002 4,887 6,118 7,579 9,625 13,598 17,653 23,270 31,128 39,294
Installed U.S. Wind Capacity Source: Renewable Electric Plant Information System (REPiS), Version 7, NREL, 2003. (MW)
1980 1985 1990 1995 1996 1997 1998 1999 2000 2001 2002 2003 2
Annual 0.023 337 154 37 8 8 173 695 124 1,843 454 12
Cumulative1 0.060 674 1,569 1,773 1,781 1,788 1,961 2,656 2,780 4,623 5,078 5,090 1 There are an additional 48 MW of wind capacity that are not accounted for here because they have no specific online date. 2 2003 data not complete as REPiS database is updated through 2002.
Annual Market Shares Source: US DOE- 1982-87 wind turbine shipment database; 1988-94. DOE Wind Program Data Sheets; 1996-2000 American Wind Energy Association
1980 1985 1990 1995 1996 1997 1998 1999 2000 U.S. Mfg Share of U.S. Market 98% 44% 36% 67% NA 38% 78% 44% 0% U.S. Mfg Share of World Market 65% 42% 20% 5% 2% 4% 13% 9% 6%
36

State-Installed Capacity Source: American Wind Energy Association and Global Energy Concepts. Annual State-Installed Capacity (MW) Top 10 States 1980 1985 1990 1995 1996 1997 1998 1999 2000 2001 2002 2003 2004 2005 California* N/A N/A 3.0 0.0 8.4 0.7 250.0 0.0 67.1 108.0 206.3 99.7 61.9 Texas 0 0 41.0 0.0 0.0 0.0 139.2 0.0 915.2 0.0 203.5 0.0 701.8 Minnesota 0 0 0.0 0.0 0.2 109.2 137.6 17.8 28.6 17.9 239.8 52.1 145.3 Iowa 0 0 0.1 0.0 1.2 3.1 237.5 0.0 81.8 98.5 49.2 310.7 202.3
Wyoming 0 0 0.0 0.1 0.0 1.2 71.3 18.1 50.0 0.0 144.0 0.0 3.8 Oregon 0 0 0.0 0.0 0.0 25.1 0.0 0.0 131.8 64.8 41.0 0.0 75.0
Washington 0 0 0.0 0.0 0.0 0.0 0.0 0.0 176.9 48.0 15.6 0.0 149.4 Colorado 0 0 0.0 0.0 0.0 0.0 21.6 0.0 39.6 0.0 162.0 6.0 0.1 New Mexico 0 0 0.0 0.0 0.0 0.0 1.3 0.0 0.0 0.0 205.3 60.0 140.0 Oklahoma 0 0 0.0 0.0 0.0 0.0 0.0 0.0 0.0 0.0 176.3 0.0 298.3 Total of 10 States N/A N/A 44.1 0.1 9.8 139.3 858.5 35.9 1491.0 337.2 1443.0 528.5 1,777.8 Total U.S. N/A N/A 44.0 1.0 16.0 142.0 884.0 67.0 1694.0 449.7 1694.5 559.9 2,431.4
Top 10 States 1980 1985 1990 1995 1996 1997 1998 1999 2000 2001 2002 2003 2004 2005 California* N/A N/A 1,387.0 1,387.0 1,396.0 1,396.0 1,646.0 1,646.0 1,714.0 1,822.0 2,042.6 2,142.3 2,204.2 Texas 0 0 41.0 41.0 41.0 41.0 180.2 180.2 1,095.5 1,095.5 1,293.0 1,293.0 1,994.8 Minnesota 0 0 25.7 25.7 25.9 135.1 272.7 290.5 319.1 335.9 562.7 614.8 760.1 Iowa 0 0 0.7 0.8 2.0 5.0 242.5 242.5 324.2 422.7 471.2 781.9 984.2
Wyoming 0 0 0.0 0.1 0.1 1.3 72.5 90.6 140.6 140.6 284.6 284.6 288.4 Oregon 0 0 0.0 0.0 0.0 25.1 25.1 25.1 157.5 218.4 259.4 259.4 334.4
Washington 0 0 0.0 0.0 0.0 0.0 0.0 0.0 178.2 228.2 243.8 243.8 393.2 Colorado 0 0 0.0 0.0 0.0 0.0 21.6 21.6 61.2 61.2 223.2 229.2 229.3 New Mexico 0 0 0.0 0.0 0.0 0.0 1.3 1.3 1.3 1.3 206.6 266.6 406.6 Oklahoma 0 0.0 0.0 0.0 0.0 0.0 0.0 0.0 0.0 176.3 176.3 474.6 Total of 10 states N/A N/A 1,454.4 1,454.6 1,465.0 1,603.5 2,461.9 2,497.8 3,991.6 4,325.8 5,763.4 6,291.9 8,069.7 Total U.S. 10.0 1039.0 1525.0 1,697.0 1,698.0 1,706.0 1,848.0 2,511.0 2,578.0 4,275.0 4,686.0 6,353.0 6,912.9 9,344.3 0* The data set includes 1,193.53 MW of wind in California that is not given a specific installation year, but rather a range of years (1072.36 MW in 1981-1995, 87.98 in 1982-1987, and 33.19 MW in "mid-1980's"), this has led to the "Not Available" values for 1985 and 1990 for California and the totals, and this data is not listed in the annual installations, but has been added to the cumulative totals for 1995 and later.
37

Cumulative Installed Source: U.S. - EIA, Annual Energy Review 2004, DOE/EIA-0384(2004) (Washington, D.C., August 2005), Table 8.11a; Capacity (MW) IEA R&D Wind Countries - IEA Wind Energy Annual Reports, 1995-2003. IEA Total - "Renewables Information 2002,"
IEA, 2002. 1980 1985 1990 1995 1996 1997 1998 1999 2000 2001 20021 2003 2004
U.S. 17.5 1,799 1,731 1,678 1,610 1,720 2,252 2,377 3,864 4,417 5,995 6,190 IEA R&D Wind Countries2
10,040 15,440 21,553 27,935 35,275 IEA Total N/A 2,386 4,235 5,124 6,228 8,001 11,390 16,103 1. Wind capacity in 2002 will be revised upward to at least 4.4 million kilowatts, as the Energy Information Administration continues to identify new wind facilities. 2. Data for IEA R&D Wind Countries through 2001 included 16 IEA countries. Ireland and Switzerland were added in 2002 and Portugal was added in 2003.
Annual Generation from Source: U.S. - EIA, Annual Energy Review 2004, DOE/EIA-0384(2004) (Washington, D.C., August 2005),Table 8.2a; Cumulative Installed IEA R&D Wind Countries - IEA Wind Energy Annual Reports, 1995-2003. IEA Total - "Renewables Information 2002", Capacity (Billion kWh) IEA, 2002.
1980 1985 1990 1995 1996 1997 1998 1999 2000 2001 2002 2003 2004 U.S. N/A 0.006 2.8 3.2 3.2 3.3 3.0 4.5 5.6 6.7 10.4 11.2 14.2 IEA R&D Wind Countries2
7.1 8.4 10.9 11.3 22.0 26.4 37.2 49.0 69.0 IEA Total 3.8 7.3 8.4 10.7 14.4 19.1 28.9 2. Data for International Energy Agency R&D Wind Countries through 2001 included 16 IEA countries. Ireland and Switzerland were added in 2002 and Portugal was added in 2003.
Annual Wind Energy Consumption for Electric Generation (Trillion Btu)
Source: EIA, Annual Energy Review 2004, DOE/EIA-0384(2003) (Washington, D.C., September 2004), Table 8.4a
1980 1985 1990 1995 1996 1997 1998 1999 2000 2001 2002 2003 2004 U.S. Total (s)=Less than 0.5 trillion Btu.
N/A (s) 29.0 32.6 33.4 33.6 30.9 45.9 57.1 68.4 104.8 114.6 143.0
38

Technology Performance Source: Projected Benefits of Federal Energy Efficiency and Renewable Energy Programs – FY
Energy Production 2006 Budget Request, NREL/TP-620-37931, May 2005. 2005 2010 2015 2020 2025 2030 2035 2040 2045 2050
Capacity Factor (%) Class 4 33.8 40.4 46.3 46.9 47.2 48.0 48.2 48.2 48.2 48.3 Class 6 43.6 49.5 50.7 51.4 51.7 51.9 52.1 52.2 52.3 52.5
Source: Projected Benefits of Federal Energy Efficiency and Renewable Energy Programs – FY Cost 2006 Budget Request, NREL/TP-620-37931, May 2005. (2002 dollars)
Capital Cost ($/kW) Class 4 Class 6
2005 1103 1050
2010 982 893
2015 919 840
2020 893 819
2025 866 814
2030 866 788
2035 861 777
2040 856 767
2045 851 756
2050 840 746
O&M ($/kW) Onshore 25.0 20.0 16.0 15.0 14.2 13.8 13.5 13.2 12.8 12.8
Levelized Cost of Energy* ($/kWh)
(2002 dollars)
Source: Projected Benefits of Federal Energy Efficiency a 2006 Budget Request, NREL/TP-620-37931, May 2005.
2005 2010 2015 2020 2025 Class 4 55.1 40.3 32.3 30.8 29.6 Class 6 40.9 30.3 27.2 26.1 25.6
nd Rene
2030 29.0 24.7
2035 28.7 24.3
wable En
2040 28.5 23.8
ergy Prog
2045 28.2 23.4
rams – FY
2050 27.8 23.1
39

Hydrogen Technology Description
Similar to electricity, hydrogen can be produced from many sources, including fossil fuels, renewable resources, and nuclear energy. Hydrogen and electricity can be converted from one to the other using electrolyzers (electricity to hydrogen) and fuel cells (hydrogen to electricity). Hydrogen is a clean energy storage medium, particularly for distributed generation. When hydrogen produced from renewable resources is used in fuel cell vehicles or power devices, there are very few emissions – the major byproduct is water. With improved conventional energy conversion and carbon-capture technologies, hydrogen from fossil resources can be used efficiently with few emissions. The Hydrogen Economy vision is based on this cycle: separate water into hydrogen and oxygen using renewable or nuclear energy, or fossil resources with carbon sequestration. Use the hydrogen to power a fuel cell, internal combustion engine, or turbine, where hydrogen and oxygen (from air) recombine to produce electrical energy, heat, and water to complete the cycle. This process produces no particulate matter, no carbon dioxide, and no pollution.
System Concepts • Hydrogen can be used as a sustainable transportation fuel or stored to meet peak-power demand. It also can be used as a feedstock in chemical processes. • Hydrogen produced by decarbonization of fossil fuels followed by sequestration of the carbon can enable the continued, clean use of fossil fuels during the transition to a carbon-free Hydrogen Economy. • A hydrogen system is comprised of production, storage, distribution, and use. • A fuel cell works like a battery but does not run down or need recharging. It will produce electricity and heat as long as fuel (hydrogen) is supplied. A fuel cell consists of two electrodes—a negative electrode (or anode) and a positive electrode (or cathode)—sandwiched around an electrolyte. Hydrogen is fed to the anode, and oxygen is fed to the cathode. Activated by a catalyst, hydrogen atoms separate into protons and electrons, which take different paths to the cathode. The electrons go through an external circuit, creating a flow of electricity. The protons migrate through the electrolyte to the cathode, where they reunite with oxygen and the electrons to produce water and heat. Fuel cells can be used to power vehicles, or to provide electricity and heat to buildings. Representative Technologies Hydrogen production • Thermochemical conversion of fossil fuels, biomass, and wastes to produce hydrogen and CO2 with the CO2 available for sequestration (large-scale steam methane reforming is widely commercialized) • Renewable (wind, solar, geothermal, hydro) and nuclear electricity converted to hydrogen by electrolysis of water (commercially available electrolyzers supply a small but important part of the super-high-purity hydrogen market) • Photoelectrochemical and photobiological processes for direct production of hydrogen from sunlight and water. Hydrogen storage • Pressurized gas and cryogenic liquid (commercial today)
40

• Higher pressure (10,000 psi), carbon-wrapped conformable gas cylinders • Cryogenic gas • Chemically bound as metal or chemical hydrides or physically adsorbed on carbon nanostructures Hydrogen distribution • By pipeline (relatively significant pipeline networks exist in industrial areas of the Gulf Coast region, and near Chicago) • By decentralized or point-of-use production using natural gas or electricity • By truck (liquid and compressed hydrogen delivery is practiced commercially) Hydrogen use • Transportation sector: internal combustion engines or fuel cells to power vehicles with electric power trains. Potential long-term use as an aviation fuel and in marine applications • Industrial sector: ammonia production, reductant in metal production, hydrotreating of crude oils, hydrogenation of oils in the food industry, reducing agent in electronics industry. • Buildings sector: combined heat, power, and fuel applications using fuel cells • Power sector: fuel cells, gas turbines, generators for distributed power generation
Technology Applications • In the United States, nearly all of the hydrogen used as a chemical (i.e. for petroleum refining and upgrading, ammonia production) is produced from natural gas. The current main use of hydrogen as a fuel is by NASA to propel rockets. • Hydrogen's potential use in fuel and energy applications includes powering vehicles, running turbines or fuel cells to produce electricity, and generating heat and electricity for buildings. The current focus is on hydrogen's use in fuel cells. The primary fuel cell technologies under development are: Phosphoric acid fuel cell (PAFC) - A phosphoric acid fuel cell (PAFC) consists of an anode and a cathode made of a finely dispersed platinum catalyst on carbon paper, and a silicon carbide matrix that holds the phosphoric acid electrolyte. This is the most commercially developed type of fuel cell and is being used in hotels, hospitals, and office buildings. More than 250 commercial units exist in 19 countries on five continents. This fuel cell also can be used in large vehicles, such as buses. Polymer electrolyte membrane (PEM) fuel cell - The polymer electrolyte membrane (PEM) fuel cell uses a fluorocarbon ion exchange with a polymeric membrane as the electrolyte. The PEM cell appears to be more adaptable to automobile use than the PAFC type of cell. These cells operate at relatively low temperatures and can vary their output to meet shifting power demands. These cells are the best candidates for light-duty vehicles, for buildings, and much smaller applications. Solid oxide fuel cells (SOFC) - Solid oxide fuel cells (SOFC) currently under development use a thin layer of zirconium oxide as a solid ceramic electrolyte, and include a lanthanum manganate cathode and a nickel-zirconia anode. This is a promising option for high-powered applications, such as industrial uses or central electricity generating stations. Direct-methanol fuel cell (DMFC) - A relatively new member of the fuel cell family, the direct-methanol fuel cell (DMFC) is similar to the PEM cell in that it uses a polymer membrane as an electrolyte. However, a catalyst on the DMFC anode draws hydrogen from liquid methanol, eliminating the need for a fuel reformer. Molten carbonate fuel cell (MCFC) - The molten carbonate fuel cell uses a molten carbonate salt as the electrolyte. It has the potential to be fueled with coal-derived fuel gases or natural gas. Alkaline fuel cell - The alkaline fuel cell uses an alkaline electrolyte such as potassium hydroxide. Originally used by NASA on missions, it is now finding applications in hydrogen-powered vehicles. Regenerative or Reversible Fuel Cells - This special class of fuel cells produces electricity from hydrogen and oxygen, but can be reversed and powered with electricity to produce hydrogen and oxygen.
41

Current Status • Currently, 48% of the worldwide production of hydrogen is via large-scale steam reforming of natural gas. Today, we safely use about 90 billion cubic meters (3.2 trillion cubic feet) of hydrogen yearly. • Hydrogen technologies are in various stages of development across the system: Production - Hydrogen production from conventional fossil-fuel feedstocks is commercial, and results in significant CO2 emissions. Large-scale CO2 sequestration options have not been proved and require R&D. Current commercial electrolyzer systems are 55-75% efficient, but the cost of hydrogen is strongly dependent on the cost of electricity. Production processes using wastes and biomass are under development, with a number of engineering scale-up projects underway. Direct conversion of sunlight to hydrogen using a semiconductor-based photoelectrochemical cell was recently demonstrated at 12.4% efficiency. Storage - Liquid and compressed gas tanks are available and have been demonstrated in a small number of bus and automobile demonstration projects. Lightweight, fiber-wrapped tanks have been developed and tested for higher-pressure hydrogen storage. Experimental metal hydride tanks have been used in automobile demonstrations. Alternative solid-state storage systems using alanates and carbon nanotubes are under development. Use - Small demonstrations by domestic and foreign bus and energy companies have been undertaken. Small-scale power systems using fuel cells fuel cells have been introduced to the power generation market, but subsidies are required to be economically competitive. Small fuel cells for battery replacement applications have been developed. The United States is conducting a major five-year learning demonstration of fuel cell vehicles and hydrogen infrastructure. Four teams comprised of automobile manufacturers and energy companies are conducting the study. • Major industrial companies are pursuing R&D in fuel cells and hydrogen production technologies with a mid-term time frame for deployment for both stationary and vehicular applications.
Technology History • From the early 1800s to the mid-1900s, a gaseous product called town gas (manufactured from coal) supplied lighting and heating for America and Europe. Town gas is 50% hydrogen, with the rest comprised of mostly methane and carbon dioxide, with 3% to 6% carbon monoxide. Then, large natural gas fields were discovered, and networks of natural gas pipelines displaced town gas. (Town gas is still found in limited use today in Europe and Asia.) • From 1958 to present, the National Aeronautics and Space Administration (NASA) has continued work on using hydrogen as a rocket fuel and electricity source via fuel cells. NASA became the worldwide largest user of liquid hydrogen and is renowned for its safe handling of hydrogen. • During the 20th century, hydrogen was used extensively as a key component in the manufacture of ammonia, methanol, gasoline, and heating oil. It was – and still is – also used to make fertilizers, glass, refined metals, vitamins, cosmetics, semiconductor circuits, soaps, lubricants, cleaners, margarine, and peanut butter. • Recently, (in the late 20th century/dawn of 21st century) many industries worldwide have begun producing hydrogen, hydrogen-powered vehicles, hydrogen fuel cells, and other hydrogen products. From Japan’s hydrogen delivery trucks to BMW’s liquid-hydrogen passenger cars; to Ballard’s fuel cell transit buses in Chicago and Vancouver, B.C.; to Palm Desert’s Renewable Transportation Project; to Iceland’s commitment to be the first hydrogen economy by 2030; to the forward-thinking work of many hydrogen organizations worldwide; to Hydrogen Now!’s public education work; the dynamic progress in Germany, Europe, Japan, Canada, the United States, Australia, Iceland, and several other countries launch hydrogen onto the main stage of the world’s energy scene. Specific U.S.-based examples of hydrogen production and uses are as follows: - A fully functional integrated renewable hydrogen utility system for the generation of hydrogen using concentrated solar power was demonstrated by cooperative project between industry and an Arizona utility company.
42

- A renewable energy fuel cell system in Reno, Nevada, produced hydrogen via electrolysis using intermittent renewable resources such as wind and solar energy. - An industry-led project has developed fueling systems for small fleets and home refueling of passenger vehicles. The refueling systems deliver gaseous hydrogen up to 5,000 psi to the vehicle. A transit agency in California installed an autothermal reformer, generating hydrogen for buses and other vehicles. This facility also operates a PV-powered electrolysis system to provide renewable hydrogen to their fleet.
Technology Future • Fuel cells are a promising technology for use as a source of heat and electricity for buildings, and as an electrical power source for electric vehicles. Although these applications would ideally run off pure hydrogen, in the near-term they are likely to be fueled with natural gas, methanol, or even gasoline. Reforming these fuels to create hydrogen will allow the use of much of our current energy infrastructure—gas stations, natural gas pipelines—while fuel cells are phased in. The electricity grid and the natural gas pipeline system will serve to supply primary energy to hydrogen producers. • By 2010, advances will be made in photobiological and photoelectrochemical processes for hydrogen production, efficiencies of fuel cells for electric power generation will increase, and advances will be made in fuel cell systems based on carbon structures, alanates, and metal hydrides. The RD&D target for 2010 is $45/kW for internal combustion engines operating on hydrogen; the cost goal is $30/kW by 2015. • Although comparatively little hydrogen is currently used as fuel or as an energy carrier, the long-term potential is for us to make a transition to a hydrogen-based economy in which hydrogen will join electricity as a major energy carrier. Furthermore, much of the hydrogen will be derived from domestically plentiful renewable energy or fossil resources, making the Hydrogen Economy synonymous with sustainable development and energy security. • In summary, future fuel cell technology will be characterized by reduced costs and increased reliability for transportation and stationary (power) applications. • To enable the transition to a hydrogen economy, the cost of hydrogen energy is targeted to be equivalent to gasoline market prices ($2-3/gallon in 2001 dollars). • For a fully developed hydrogen energy system, a new hydrogen infrastructure/delivery system will be required. • In the future, hydrogen also could join electricity as an important energy carrier. An energy carrier stores, moves, and delivers energy in a usable form to consumers. Renewable energy sources, such as the sun or wind, can't produce energy all the time. The sun doesn't always shine nor the wind blow. But hydrogen can store this energy until it is needed and it can be transported to where it is needed. • Some experts think that hydrogen will form the basic energy infrastructure that will power future societies, replacing today's natural gas, oil, coal, and electricity infrastructures. They see a new hydrogen economy to replace our current energy economies, although that vision probably won't happen until far in the future.
Source: National Renewable Energy Laboratory. U.S. Climate Change Technology Program. Technology Options: For the Near and Long Term. DOE/PI-0002. November 2003 (draft update, September 2005); and National Renewable Energy Laboratory. Gas-Fired Distributed Energy Resource Technology Characterizations. NREL/TP-620/34783. November 2003.
43

Advanced Hydropower Technology Description
Hydroelectric power generates no greenhouse gas. To the extent that existing hydropower can be maintained or expanded through advances in technology, it can continue to be an important part of a greenhouse gas emissions-free energy portfolio. Advanced hydropower is technology that produces hydroelectricity both efficiently and with improved environmental performance. Traditional hydropower may have environmental effects, such as fish mortality and changes to downstream water quality and quantity. The goal of advanced hydropower is to maximize the use of water for generation while improving environmental performance. System Concepts • Conventional hydropower projects use either impulse or reaction turbines to convert kinetic energy in flowing or falling water into turbine torque and power. Source water may be from free-flowing rivers, streams, or canals, or water released from upstream storage reservoirs. • New environmental and biological criteria for turbine design and operation are being developed to help sustain hydropower’s role as a clean, renewable energy source – and to enable upgrades of existing facilities and retrofits at existing dams. Representative Technologies • New turbine designs that improve survivability of fish that pass through the power plant. • Autoventing turbines to increase dissolved oxygen in discharges downstream of dams. • Re-regulating and aerating weirs used to stabilize tailwater discharges and improve water quality. • Adjustable-speed generators producing hydroelectricity over a wider range of heads and providing more uniform instream-flow releases without sacrificing generation opportunities. • New assessment methods to balance instream-flow needs of fish with water for energy production and to optimize operation of reservoir systems. • Advanced instrumentation and control systems that modify turbine operation to maximize environmental benefits and energy production.
Technology Applications • Hydropower provides about 78,000 MW of the nation’s electrical-generating capability. This is about 80 percent of the electricity generated from renewable energy sources. • Existing hydropower generation faces a combination of real and perceived environmental effects, competing uses of water, regulatory pressures, and changes in energy economics (deregulation, etc.); potential hydropower resources are not being developed for similar reasons. • Some new environmentally friendly technologies such as low head and low impact hydroelectric are being implemented in part stimulated by green power programs. • DOE's Advanced Hydropower Turbine System (AHTS) program will be completing public-private partnerships with industry to demonstrate the feasibility of new turbine designs (e.g., aerating turbines at the Osage Dam, and a Minimum Gap Runner turbine at the Wanapum Dam).
44

Current Status • TVA has demonstrated that improved turbine designs, equipment upgrades, and systems optimization can lead to significant economic and environmental benefits – energy production was increased approximately 12% while downstream fish resources were significantly improved. • Field-testing of the Kaplan turbine Minimum Gap Runner design indicates that fish survival can be significantly increased, if conventional turbines are modified. The full complement of Minimum Gap Runner design features will be tested at the Wanapum Dam in FY 2005.
Technology History • Since the time of ancient Egypt, people have used the energy in flowing water to operate machinery and grind grain and corn. However, hydropower had a greater influence on people's lives during the 20th century than at any other time in history. Hydropower played a major role in making the wonders of electricity a part of everyday life and helped spur industrial development. Hydropower continues to produce 24% of the world's electricity and supply more than 1 billion people with power. • The first hydroelectric power plant was built in 1882 in Appleton, Wisconsin, to provide 12.5 kilowatts to light two paper mills and a home. Today's hydropower plants generally range in size from several hundred kilowatts to several hundred megawatts, but a few mammoth plants have capacities up to 10,000 megawatts and supply electricity to millions of people. • By 1920, 25% of electrical generation in the United States was from hydropower; and, by 1940, it increased to 40%. • Most hydropower plants are built through federal or local agencies as part of a multipurpose project. In addition to generating electricity, dams and reservoirs provide flood control, water supply, irrigation, transportation, recreation, and refuges for fish and birds. Private utilities also build hydropower plants, although not as many as government agencies.
Technology Future • Voith Siemens Hydro Power and the TVA have established a partnership to market environmentally friendly technology at hydropower facilities. Their products were developed partly by funding provided by DOE and the Corps of Engineers, as well as private sources. • In a competitive solicitation, DOE accepted proposals for advanced turbine designs from Voith Siemens, Alstom, American Hydro, and General Electric Co. Field verification and testing is underway with some of these designs to demonstrate improved environmental performance. • Flash Technology is developing strobe lighting systems to force fish away from hydropower intakes and to avoid entrainment mortality in turbines. Implementation at more sites may allow improved environmental performance with reduced spillage. Market Context • Advanced hydropower products can be applied at more than 80% of existing hydropower projects (installed conventional capacity is now 94 GW); the potential market also includes 15-20 GW at existing dams (i.e. no new dams required for development) and more than 30 GW of undeveloped hydropower. • Retrofitting advanced technology and optimizing system operations at existing facilities would lead to at least a 6% increase in energy output – if fully implemented, this would equate to 5 GW and 18,600 GWh of new, clean energy production.
Source: National Renewable Energy Laboratory. U.S. Climate Change Technology Program. Technology Options: For the Near and Long Term. DOE/PI-0002. November 2003 (draft update, September 2005).
45

Hydroelectric Power Market Data U.S. Installed Capacity (MW)* Source: Renewable Electric Plant Information System (REPiS), Version 7, NREL, 2003.
1980 1985 1990 1995 1996 1997 1998 1999 2000 2001 2002 2003 Annual 1,391 3,237 862 1,054 19.9 64.0 7.6 179.3 1.1 11 0.002 21.0
Cumulative 80,491 87,839 90,955 94,052 94,072 94,136 94,143 94,323 94,324 94,335 94,335 94,356
* There are an additional 21 MW of hydroelectric capacity that are not accounted for here because they have no specific online date. 2003 data not complete as REPiS database is updated through 2002.
Cumulative Grid- Source: U.S. data from EIA, AER 2004, Table 8.11a; World Total from EIA, International Energy Annual, 1996-2003, Table 6.4. Connected Hydro International data from International Energy Agency, Electricity Information 2004. Capacity (MW)1
1980 1985 1990 1995 1996 1997 1998 1999 2000 2001 2002 2003 2004 U.S. Conventional and other Hydro 81,700 88,900 73,923 78,562 76,437 79,415 79,151 79,393 79,359 79,484 79,354 78,694 78,703
Pumped Storage2 N/A N/A 19,462 21,387 21,110 19,310 19,518 19,565 19,522 19,096 20,373 20,522 20,522
U.S. Hydro Total 81,700 88,900 93,385 99,948 97,548 98,725 98,669 98,958 98,881 98,580 99,727 99,216 99,225 OECD Europe3 124,184 124,577 130,886 132,893 134,902 135,939 133,307 136,251 140,779 141,913 147,580 NA NA IEA Europe4 123,960 124,357 130,663 132,666 134,038 135,074 132,315 135,254 138,093 138,912 144,010 NA NA Japan 21,377 19,980 20,825 21,171 21,222 21,277 21,477 21,555 22,019 22,081 21,690 NA NA OECD Total 286,969 300,725 316,291 340,259 342,893 346,342 342,673 346,446 351,513 352,564 338,130 NA NA IEA Total 286,745 300,505 316,068 330,703 331,947 335,395 331,930 335,768 339,145 339,880 324,920 NA NA World Total 470,669 537,734 600,206 650,936 661,237 673,797 680,610 697,749 712,689 723,581 NA NA NA 1. Excludes pumped storage, except for specific U.S. pumped storage capacity listed.
2. Pumped storage values for 1980-1985 are included in "Conventional and other Hydro" 3. OECD included 24 countries as of 1980. Mexico, Czech Republic, Hungary, Poland, South Korea, Slovak Republic joined after 1980. Countries' data are included only after the year they joined. 4. IEA included 26 countries as of 2003. Countries' data are included only after the year they joined the OECD. NA = Not Available; Updated international data not available at time of publication
46

Annual Generation from Source: EIA, International Energy Annual 2003, DOE/EIA-0219(02), Table 1.5. Cumulative Installed Capacity (Billion kWh)
1980 1985 1990 1995 1996 1997 1998 1999 2000 2001 2002 United States 279 284 289 308 344 352 319 313 270 208 255 Canada 251 301 294 332 352 347 329 342 355 330 315 Mexico 17 26 23 27 31 26 24 32 33 28 25 Brazil 177 205 251 263 276 289 290 302 265 282 Western Europe 453 453 506 491 506 523 531 555 553 503 Former U.S.S.R. 128 205 231 238 215 216 225 227 228 239 243 Eastern Europe 432 26 23 34 34 36 35 35 31 30 32 China 184 91 125 184 185 193 203 211 241 258 309 Japan 82 88 81 80 89 92 86 86 83 81 Rest of World 27 273 328 435 504 515 522 533 541 558 571 581
58
World Total 88 1,736 1,973 2,167 2,466 2,511 2,564 2,571 2,609 2,658 2,565 2,627
State Generating Capability* Source: EIA, Electric Power Annual 2004 – Spreadsheets, “1990 - 2002 Existing Nameplate and Net Summer (MW) Capacity by Energy Source and Producer Type (EIA-860)”
http://www.eia.doe.gov/cneaf/electricity/epa/existing_capacity_state.xls Top 10 States 1990 1995 1996 1997 1998 1999 2000 2001 2002 2003 2004 Washington 19,935 20,487 20,431 20,923 21,012 21,011 21,011 21,006 21,016 21,018 20,941 California 12,687 13,519 13,500 13,475 13,383 13,445 13,475 13,471 13,523 13,306 13,323 Oregon 8,221 8,268 8,267 8,264 8,265 8,249 8,261 8,240 8,211 8,235 8,236 New York 5,345 5,545 5,557 5,565 5,668 5,662 5,659 5,712 5,804 5,842 5,891 Tennessee 3,717 3,818 3,818 3,937 3,950 3,950 3,950 3,948 3,948 3,948 3,948 Georgia 2,453 3,287 3,005 3,305 3,314 3,314 3,313 3,313 3,613 3,414 3,566 South Carolina 2,367 3,468 3,468 3,442 3,442 3,452 3,455 3,453 3,453 3,459 3,499 Virginia 3,072 3,126 3,149 3,082 3,093 3,090 3,091 3,088 3,088 3,088 3,088 Alabama 2,857 2,868 2,864 2,904 2,961 2,961 2,961 2,959 2,959 3,159 3,261 Arizona 2,685 2,885 2,885 2,893 2,893 2,890 2,890 2,890 2,893 2,899 2,903
U.S. Total 89,828 94,513 94,372 95,222 95,496 95,802 95,879 95,844 96,343 96,353 96,699 * Values are nameplate capacity for total electric industry
47

State Annual Generation from Source: EIA, Electric Power Annual 2002 – Spreadsheets, “1990 - 2002 Net Generation by State by Type of Cumulative Installed Capacity* Producer by Energy Source (EIA-906)” http://www.eia.doe.gov/cneaf/electricity/epa/generation_state.xls (Billion kWh) Top 10 States 1990 1995 1996 1997 1998 1999 2000 2001 2002 2003 2004 Washington 87.5 82.5 98.5 104.2 79.8 97.0 80.3 54.7 78.2 71.8 71.6 Oregon 41.2 40.8 44.9 46.7 39.9 45.6 38.1 28.6 34.4 33.3 33.1 California 24.8 50.5 46.9 42.1 50.8 40.4 39.3 25.2 30.9 36.4 34.1 New York 27.1 24.8 27.8 29.5 28.2 23.6 23.9 22.2 24.1 24.3 24.0 Montana 10.7 10.7 13.8 13.4 11.1 13.8 9.6 6.6 9.6 8.7 8.9 Alabama 10.4 9.5 11.1 11.5 10.6 7.8 5.8 8.4 8.8 12.7 10.6 Idaho 9.1 11.0 13.3 14.7 12.9 13.5 11.0 7.2 8.8 8.4 8.5 Arizona 7.7 8.5 9.5 12.4 11.2 10.1 8.6 7.9 7.6 7.1 7.0 Tennessee 9.5 9.0 10.8 10.4 10.2 7.2 5.7 6.2 7.3 12.0 10.4 South Dakota 3.9 6.0 8.0 9.0 5.8 6.7 5.7 3.4 4.4 4.3 3.6
U.S. Total 289.4 308.1 344.1 352.4 318.9 313.4 270.0 208.1 255.6 275.8 268.4 * Values are for total electric industry. Years before 1998 do not include nonutility generation.
Annual Hydroelectric Source: EIA, Annual Energy Review 2004, DOE/EIA-0384(2004) (Washington, D.C., August 2005) Table 8.4a Consumption for Electric Generation (Trillion Btu)
1980 1985 1990 1995 1996 1997 1998 1999 2000 2001 2002 2003 2004
U.S. Total 2,900 2,970 3,046 3,205 3,590 3,640 3,297 3,268 2,811 2,201 2,689 2,825 2,725 Note: Conventional hydroelectric power only, for all sectors. Hydroelectric data through 1988 include industrial plants as well as electric utilities. Beginning in 1989, data are for electric utilities, independent power producers, commercial plants, and industrial plants.
48

Building Technologies
Technology Description Building equipment Energy use in buildings depends on equipment to transform fuel or electricity into end-use services such as delivered heat or cooling, light, fresh air, vertical transport, cleaning of clothes or dishes, and information processing. There are energy-saving opportunities within individual pieces of equipment – as well as at the system level – through proper sizing, reduced distribution and standby losses, heat recovery and storage, and optimal control. Building envelope The building envelope is the interface between the interior of a building and the outdoor environment. In most buildings, the envelope – along with the outdoor weather – is the primary determinant of the amount of energy used to heat, cool, and ventilate. A more energy-efficient envelope means lower energy use in a building and lower greenhouse gas emissions. The envelope concept can be extended to that of the “building fabric,” which includes the interior partitions, ceilings, and floors. Interior elements and surfaces can be used to store, release, control, and distribute energy, thereby further increasing the overall efficiency of the buildings. Whole building integration Whole building integration uses data from design (together with sensed data) to automatically configure controls and commission (i.e., start-up and check out) and operate buildings. Control systems use advanced, robust techniques and are based on smaller, less expensive, and much more abundant sensors. These data ensure optimal building performance by enabling control of building systems in an integrated manner and continuously recommissioning them using automated tools that detect and diagnose performance anomalies and degradation. Whole building integration systems optimize operation across building systems, inform and implement energy purchasing, guide maintenance activities, document and report building performance, and optimally coordinate on-site energy generation with building energy demand and the electric power grid, while ensuring that occupant needs for comfort, health, and safety were met at the lowest possible cost.
System Concepts
Building equipment • Major categories of end-use equipment include heating, cooling, and hot water; ventilation and thermal distribution; lighting; home appliances; miscellaneous (process equipment and consumer products); and on-site energy and power. • Key components vary by type of equipment, but some crosscutting opportunities for efficiency include improved materials, efficient low-emissions combustion and heat transfer, advanced refrigerants and cycles, electrodeless and solid-state lighting, smart sensors and controls, improved small-power supplies, variable-capacity systems, reduction of thermal and electrical standby losses, cogeneration based on modular fuel cells and microturbines, and utilization of waste heat from fuel cells and microturbines. Building envelope • Control of envelope characteristics provides control over the flow of heat, air, moisture, and light into the building. These flows and the interior energy and environmental loads determine the size and energy use of HVAC and distribution systems.
49
• Materials for exterior walls, roofs, foundations, windows, doors, interior partition walls, ceilings, and floors that can impact future energy use include insulation with innovative formula foams and vacuum panels; optical control coatings for windows and roofs; and thermal storage materials, including lightweight heat-storage systems. Whole building integration • The system consists of design tools, automated diagnostics, interoperable control-system components, abundant wireless sensors and controls, and highly integrated operation of energy-using and producing systems. • These components would work together to collect data, configure controls, monitor operations, optimize control, and correct out-of-range conditions that contribute to poor building performance. Whole building integration would ensure that essential information – especially the design intent and construction implementation data – would be preserved and shared across many applications throughout the lifetime of the building. • Equipment and system performance records would be stored as part of a networked building performance knowledge base, which would grow over time and provide feedback to designers, equipment manufacturers, and building operators and owners. • Optimally integrate on-site power production with building energy needs and the electric-power grid by applying intelligent control to building cooling, heating, and power.
Representative Technologies
Building equipment • Residential gas-fired absorption heat pumps, centrifugal chillers, desiccant preconditioners for treating ventilation air, heat-pump water heaters, proton exchange membrane fuel cells, heat pump water heaters, solid-state lighting, and lighting controls. • Specialized HVAC (heating, ventilating, and air-conditioning) systems for research laboratories, server/data systems, and other buildings housing high-technology processes. Building envelope • Superinsulation: Vacuum powder-filled, gas-filled, and vacuum fiber-filled panels; structurally reinforced beaded vacuum panels; and switchable evacuated panels with insulating values more than four times those of the best currently available materials should soon be available for niche markets. High-thermal-resistant foam insulations with acceptable ozone depletion and global warming characteristics should allow for continued use of this highly desirable thermal insulation. • Advanced window systems: Krypton-filled, triple-glazed, low-E windows; electrochromic glazing; and hybrid electrochromic/photovoltaic films and coatings should provide improved lighting and thermal control of fenestration systems. Advanced techniques for integration, control, and distribution of daylight should significantly reduce the need for electric lighting in buildings. Self-drying wall and roof designs should allow for improved insulation levels and increase the lifetimes for these components. More durable high-reflectance coatings should allow better control of solar heat on building surfaces. • Advanced thermal storage materials: Dry phase-change materials and encapsulated materials should allow significant load distribution over the full diurnal cycle and significant load reduction when used with passive solar systems. Whole building integration • DOE is developing computer-based building commissioning and operation tools to improve the energy efficiency of “existing” buildings. It is also investing in the next generation of building-simulation programs that could be integrated into design tools. • DOE, in collaboration with industry, also is developing and testing technologies for combined cooling, heating, and power; and wireless sensor and control systems for buildings.
50

Technology Applications Building equipment • Technology improvements during the past 20 years – through quality engineering, new materials, and better controls – have improved efficiencies in lighting and equipment by 15% to 75%, depending on the type of equipment. Efficiencies of compact fluorescent lamps are 70% better than incandescent lamps; refrigerator energy use has been reduced by more than three-quarters during the past 20 years; H-axis clothes washers are 50% more efficient than current minimum standards. Electronic equipment has achieved order-of-magnitude efficiency gains, at the microchip level, every two to three years. Building envelope • Building insulations have progressed from the 2-4 hr ºF ft2/Btu/in. fibrous materials available before 1970 to foams reaching 7 hr ºF ft2/Btu/in. Superinsulations of more than 25 ºF ft2/Btu/in. will be available for niche markets soon. Improvements in window performance have been even more spectacular. In the 1970s, window thermal resistance was 1 to 2 ºF ft2/Btu. Now, new windows have thermal resistance of up to 6 ºF ft2/Btu (whole window performance). Windows are now widely available with selective coatings that reduce infrared transmittance without reducing visible transmittance. In addition, variable-transmittance windows under development will allow optimal control to minimize heating, cooling, and lighting loads. Whole building integration • Savings from improved operation and maintenance procedures could save more than 30% of the annual energy costs of existing commercial buildings, even in many of those buildings thought to be working properly by their owners/operators. These technologies would have very short paybacks, because they would ensure that technologies were performing as promised, for a fraction of the cost of the installed technology. • Savings for new buildings could exceed 70%, using integration of building systems; and, with combined cooling, heating and power, buildings could become net electricity producers and distributed suppliers to the electric power grid.
Current Status Building equipment • Recent DOE-sponsored R&D, often with industry participation, includes an improved air-conditioning cycle to reduce oversizing and improve efficiency; a replacement for inefficient, high-temperature halogen up-lights (torchieres), which use only 25% of the power, last longer, and eliminate potential fire hazards; ozone-safe refrigerants, where supported R&D was directed toward lubrication materials problems associated with novel refrigerants and ground-source heat pumps. Building envelope • A DOE-sponsored RD&D partnership with the Polyisocyanurate Insulation Manufacturers Association, the National Roofing Contractors Association, the Society of the Plastics Industry, and Environmental Protection Agency (EPA) helped the industry find a replacement for chloroflurocarbons (CFCs) in polyisocyanurate foam insulation. This effort enabled the buildings industry to transition from CFC-11 to HCFC-141b by the deadline required by the Montreal protocol. • Spectrally selective window glazings – which reduce solar heat gain and lower cooling loads – and high-performance insulating materials for demanding thermal applications are available. Whole building integration • Energy 10 models passive solar systems in buildings. • DOE-2: international standard for whole building energy performance simulation has thousands of users. DOE released Energy Plus, new standard for building energy simulation and DOE-2 successor. • The International Alliance for Interoperability is setting international standards for interoperability of computer tools and components for buildings. • DOE-BESTEST is the basis for ANSI/ASHRAE Standard 140, Method of Test for the Evaluation of Building Energy Simulation Programs.
51

Technology History • 1890s – First commercially available solar water heaters produced in southern California. Initial designs were roof-mounted tanks and later glazed tubular solar collectors in thermosiphon configuration. Several thousand systems were sold to homeowners. • 1900s – Solar water-heating technology advanced to roughly its present design in 1908 when William J. Bailey of the Carnegie Steel Company, invented a collector with an insulated box and copper coils. • 1940s – Bailey sold 4,000 units by the end of WWI, and a Florida businessperson who bought the patent rights sold nearly 60,000 units by 1941. • 1950s – Industry virtually expires due to inability to compete against cheap and available natural gas and electric service. • 1970s – The modern solar industry began in response to the OPEC oil embargo in 1973-74, with a number of federal and state incentives established to promote solar energy. President Jimmy Carter put solar water-heating panels on the White House. FAFCO, a California company specializing in solar pool heating; and Solaron, a Colorado company that specialized in solar space and water heating, became the first national solar manufacturers in the United States. In 1974, more than 20 companies started production of flat-plate solar collectors, most using active systems with antifreeze capabilities. Sales in 1979 were estimated at 50,000 systems. In Israel, Japan, and Australia, commercial markets and manufacturing had developed with fairly widespread use. • 1980s – In 1980, the Solar Rating and Certification Corp (SRCC) was established for testing and certification of solar equipment to meet set standards. In 1984, the year before solar tax credits expired, an estimated 100,000-plus solar hot-water systems were sold. Incentives from the 1970s helped create the 150-business manufacturing industry for solar systems with more than $800 million in annual sales by 1985. When the tax credits expired in 1985, the industry declined significantly. During the Gulf War, sales again increased by about 10% to 20% to its peak level, more than 11,000 square feet per year (sq.ft./yr) in 1989 and 1990. • 1990s – Solar water-heating collector manufacturing activity declined slightly, but has hovered around 6,000 to 8,000 sq.ft./yr. Today's industry represents the few strong survivors: More than 1.2 million buildings in the United States have solar water-heating systems, and 250,000 solar-heated swimming pools exist. Unglazed, low-temperature solar water heaters for swimming pools have been a real success story, with more than a doubling of growth in square footage of collectors shipped from 1995 to 2001.
Reference: American Solar Energy Society and Solar Energy Industry Association
52

Technology Future Building equipment • Building equipment, appliances, and lighting systems currently on the market vary from 20% to 100% efficient (heat pumps can exceed this level by using “free” energy drawn from the environment). This efficiency range is narrower where cost-effective appliance standards have previously eliminated the least-efficient models. • The stock and energy intensity of homes are growing faster than the building stock itself, as manufacturers introduce – and consumers and businesses eagerly accept – new types of equipment, more sophisticated and automated technologies, and increased levels of end-use services. • The rapid turnover and growth of many types of building equipment – especially electronics for computing, control, communications, and entertainment – represent important opportunities to rapidly introduce new, efficient technologies and quickly propagate them throughout the stock. • The market success of most new equipment and appliance technologies is virtually ensured if the efficiency improvement has a 3-year payback or better and amenities are maintained; technologies with payback of 4 to 8-plus years also can succeed in the market, provided that they offer other customer-valued features (e.g., reliability, longer life, improved comfort or convenience, quiet operation, smaller size, lower pollution levels). • Applications extend to every segment of the residential and nonresidential sectors. Major government, institutional, and corporate buyers represent a special target group for voluntary early deployment of the best new technologies. • Building equipment and appliances represent an annual market in the United States, alone, of more than $200B, involving thousands of large and small companies. Certain technologies, such as office and home electronics, compete in global markets with little or no change in performance specifications. Building envelope • A critical challenge is to ensure that new homes and buildings are constructed with good thermal envelopes and windows when the technologies are most cost-effective to implement. • The market potential is significant for building owners taking some actions to improve building envelopes. Currently, 40% of residences are well insulated, 40% are adequately insulated, and 20% are poorly insulated. More than 40% of new window sales are of advanced types (low-E and gas-filled). In commercial buildings, more than 17% of all windows are advanced types. More than 70% of commercial buildings have roof insulation; somewhat fewer have insulated walls. • Building products are mostly commodity products. A number of companies produce them; and each has a diverse distribution system, including direct sales, contractors, retailers, and discount stores. Another critical challenge is improving the efficiency of retrofits of existing buildings. Retrofitting is seldom cost-effective on a stand-alone basis. New materials and techniques are required. • Many advanced envelope products are cost-competitive now, and new technologies will become so on an ongoing basis. There will be modest cost reductions over time as manufacturers compete. • Building structures represent an annual market in the United States of more than $70B/year and involve thousands of large and small product manufacturers and a large, diverse distribution system that plays a crucial role in product marketing. Exporting is not an important factor in the sales of most building structure products. Whole building integration • The future vision of buildings technologies is one of “net zero energy” buildings which use a combination of integrated electricity generation--such as photovoltaics--paired with energy efficiency and power controls, to create a building that on average during a year produces enough energy for all the energy demands within the building. • Design tools for energy efficiency are used by fewer than 2% of the professionals involved in the design, construction, and operation of commercial buildings in the United States. A larger fraction of commercial buildings have central building-control systems. Few diagnostic tools are available commercially beyond those used for air-balancing or integrated into equipment (e.g., Trane Intellipack
53

____________________________________________________________________________________
____________________________________________________________________________________
System) and the recently announced air-conditioning diagnostic hand-held service tool by Honeywell (i.e. Honeywell HVAC Service Assistant). • The Department of Energy – in concert with the California Energy Commission – is testing a number of automated diagnostic tools and techniques with commercial building owners, operators, and service providers in an effort to promote commercial use. About 12 software vendors develop, support, and maintain energy design tools; most are small businesses. Another 15 to 20 building automation and control vendors exist in the marketplace – the major players include Johnson Controls, Honeywell, and Siemens. • Deployment involves four major aspects: seamless integration into existing building design and operation practices and platforms, lowering the cost of intelligent-building and enabling technologies, transforming markets to rapidly introduce new energy-efficient technologies, and a focus on conveying benefits that are desired in the marketplace (not only energy efficiency). • These technologies would apply to all buildings, but especially to existing commercial buildings and all new buildings. In addition, new technologies would be integrated into the building design and operation processes.
Source: National Renewable Energy Laboratory. U.S. Climate Change Technology Program. Technology Options: For the Near and Long Term. DOE/PI-0002. November 2003 (draft update, September 2005).
For more data on the Buildings sector, please refer to the “Buildings Energy Data Book” which is a comprehensive collection of buildings- and energy-related data. The Buildings Energy Data Book is available online at http://buildingsdatabook.eren.doe.gov/
54

Solar BuildingsMarket Data U.S. Installations Source: EIA, Renewable Energy Annual 2004, Table 38, REA 2003 Table 18 and Table 10; REA 2002, Table 18; REA 1997- 2000, Table 16; (Thousands of Sq. Ft.) REA 1996, Table 18.
1980 1985 1990 1995 1996 1997 1998 1999 2000 2001 2002 2003 2004 Annual
755 765 595 463 373 367 274 423 511 452Hot Water 6,787 7,528 7,201 8,141 7,863 10,797 11,073 10,800 13,634 Pool Heaters
Total Solar Thermal 1 18,283 19,166 11,164 7,136 7,162 7,759 7,396 8,046 7,857 10,349 11,004 10,926 14,114 6,763
Cumulative
755 1,520 2,115 2,578 2,951 3,318 3,592 4,015 4,526 4,978Hot Water 6,763 13,550 21,078 28,279 36,420 44,283 55,080 66,153 76,953 90,587 Pool Heaters
Total Solar Thermal 1 62,829 153,035 199,459 233,386 240,548 248,307 255,703 263,749 271,606 281,955 292,959 303,885 317,999 1. Domestic shipments - total shipments minus export shipments
U.S. Annual Shipments Source: EIA, Renewable Energy Annual 2003, Table 11; and REA 1999, Table 11. (Thousand Sq. Ft.)
1980 1985 1990 1995 1996 1997 1998 1999 2000 2001 2002 2003 2004 Total 19,398 N/A 11,409 7,666 7,616 8,138 7,756 8,583 8,354 11,189 11,663 11,444 14,114 Imports N/A 1,562 2,037 1,930 2,102 2,206 2,352 2,201 3,502 3,068 2,986 3,723 Exports 1,115 N/A 245 530 454 379 360 537 496 840 659 518 813
U.S. Shipments by Cell Source: EIA Annual Energy Review 2004, Table 10.3; and Renewable Energy Annual 2003, Table 12. Type (Thousand sq. ft.)
1980 1985 1990 1995 1996 1997 1998 1999 2000 2001 2002 2003 2004 Low-Temperature 12,233 N/A 3,645 6,813 6,821 7,524 7,292 8,152 7,948 10,919 11,126 10,877 13,608 Collectors Medium-Temperature 7,165 N/A 2,527 840 785 606 443 427 400 268 535 560 506 Collectors
High-Temperature N/A N/A 5,237 13 10 7 21 4 5 2 2 7 0 Collectors Total 19,398 N/A 11,409 7,666 7,616 8,137 7,756 8,583 8,353 11,189 11,661 11,444 14,114
55

U.S. Shipments of High-Temperature Source: EIA, Renewable Energy Annual 2003, Table 18; REA 2002, Table 18; REA 1996, Table F9; Collectors by Market Sector, and End REA 1997, 1999-2000, Table 16; and REA 1998, Table 19. Use (Thousands of Sq. Ft.)
1995 1996 1997 1998 1999 2000 2001 2002 2003 2004 Market Sector 0 0 0 0 0 0 0 0 0 Residential 1 7 7 18 0 1 2 7 0 Commercial 0 2 0 0 0 0 0 0 0 Industrial 9 0 0 2 4 1 0 0 0 Utility 3 0 0 1 0 0 0 0 0 Other 13 10 7 21 4 2 2 7 0 Total
End Use 0 0 0 0 0 0 0 0 0 Pool Heating 0 7 7 18 0 0 0 0 0 Hot Water 0 0 0 0 0 0 0 0 0 Space Heating 1 0 0 0 0 0 0 0 0 Space Cooling 0 0 0 0 0 0 2 7 0 Combined Space and Water Heating 0 2 0 0 0 0 0 0 0 Process Heating 9 0 0 2 4 2 0 0 0 Electricity Generation 2 0 0 1 0 0 0 0 0 Other 13 10 7 21 4 2 2 7 0 Total 0 0 0 0 0 0 0 0 0 2000 data not published by EIA
56

U.S. Shipments of Medium- Temperature Collectors by Source: EIA, Renewable Energy Annual 2003, Table 18; REA 2002, Table 18; REA Market Sector, and End Use (Thousands of Sq. Ft.) 1996, Table F9; REA 1997, 1999-2000, Table 16; and REA 1998, Table 19.
1995 1996 1997 1998 1999 2000 2001 2002 2003 2004 Market Sector Residential 774 728 569 355 366 238 481 507 478 Commercial 51 50 35 70 59 23 69 44 0 Industrial 12 1 0 18 0 5 60 0 26 Utility 0 0 0 0 0 4 0 0 Other 3 7 2 0 1 1 2 3 Total 839 786 606 443 426 268 614 553 507
0 2End Use
Pool Heating 32 21 11 36 12 16 28 22 33 Hot Water 743 754 588 384 373 231 421 510 452 Space Heating 62 6 2 13 24 9 145 4 6 Space Cooling 0 0 0 0 0 0 0 0 Combined Space and Water Heating 2 2 3 8 16 12 15 16 16 Process Heating 0 1 0 0 0 4 0 0
0 Electricity Generation 0 0 0 0 0 0 0 0 Other 0 0 1 1 0 0 0 0
0Total 839 784 605 442 427 268 614 553 507 02000 data not published by EIA 2
57

U.S. Shipments of Low- Temperature Collectors Source: EIA, Renewable Energy Annual 2003, Table 18; REA 2002, Table 18; REA by Market Sector, and End Use (Thousands of 1996, Table F9; REA 1997, 1999-2000, Table 16; and REA 1998, Table 19. Sq. Ft.)
1995 1996 1997 1998 1999 2000 2001 2002 2003 2004 Market Sector Residential 6,192 6,146 6,791 6,810 7,408 9,885 10,519 9,993 12,386 Commercial 552 625 726 429 726 987 524 813 1,178 Industrial 69 51 7 44 18 12 2 71 44 Utility 0 0 0 0 0 0 0 0 0 Other 0 0 0 2 0 34 0 0 0 Total 6,813 6,822 7,524 7,285 8,152 10,919 11,046 10,877 13,608
End Use Pool Heating 6,731 6,766 7,517 7,164 8,129 10,782 11,045 10,778 13,600 Hot Water 11 4 0 60 0 42 1 0 0 Space Heating 70 51 7 53 18 61 0 65 8 Space Cooling 0 0 0 0 0 0 0 0 0 Combined Space and Water Heating 0 Process Heating 0 0 0 0 5 34 0 34 0 Electricity Generation 0 0 0 0 0 0 0 0 0 Other 0 0 0 0 0 0 0 0 0 Total 6,813 6,821 7,524 7,285 8,152 10,919 11,046 10,877 13,608 2000 data not published by EIA
58

Technology Performance Source: Arthur D. Little, Review of FY 2001 Office of Power Technology's Solar Buildings Program Planning Unit
Energy Production Summary, December 1999. 1980 1985 1990 1995 2000 2005 2010 2015 2020
Energy Savings DHW (kWh/yr) 2,750 Pool Heater (therms/yr) 1,600
Source: Hot-Water Heater data from Arthur D. Little, Water-Heating Situation Analysis, November 1996, page 53, Cost and Pool-Heater data from Ken Sheinkopf, Solar Today, Nov/Dec 1997, pp. 22-25.
1980 1985 1990 1995 2000 2005 2010 2015 2020 Capital Cost* ($/System) Domestic Hot-Water Heater 1,900 - 2,500 Pool Heater 3,300 - 4,000
O&M ($/System-yr) Domestic Hot-Water Heater 25 - 30 Pool Heater 0
* Costs represent a range of technologies, with the lower bounds representing advanced technologies, such as a low-cost polymer integral collector for domestic hot-water heaters, which are expected to become commercially available after 2010.
For more data on the Buildings sector, please refer to the “Buildings Energy Data Book” which is a comprehensive collection of buildings- and energy-related data. The Buildings Energy Data Book is available online at http://buildingsdatabook.eren.doe.gov/
59

Reciprocating Engines Technology Description
Reciprocating engines, also known as internal combustion engines, require fuel, air, compression, and a combustion source to function. They make up the largest share of the small power generation market and can be used in a variety of applications due to their small size, low unit costs, and useful thermal output. System Concepts • Reciprocating engines fall into one of two categories depending on the ignition source: spark ignition (SI), typically fueled by gasoline or natural gas; or compression ignition (CI), typically fueled by diesel oil. • Reciprocating engines also are categorized by the number of revolutions it takes to complete a combustion cycle. A two-stroke engine completes its combustion cycle in one revolution, and a four-stroke engine completes the combustion process in two revolutions. Representative Technologies • The four-stroke SI engine has an intake, compression, power, and exhaust cycle. In the intake stroke, as the piston moves downward in its cylinder, the intake valve opens and the upper portion of the cylinder fills with fuel and air. When the piston returns upward in the compression cycle, the spark plug fires, igniting the fuel/air mixture. This controlled combustion forces the piston down in the power stroke, turning the crankshaft and producing useful shaft power. Finally, the piston moves up again, exhausting the burnt fuel and air in the exhaust stroke. • The four-stroke CI engine operates in a similar manner, except diesel fuel and air ignite when the piston compresses the mixture to a critical pressure. At this pressure, no spark or ignition system is needed because the mixture ignites spontaneously, providing the energy to push the piston down in the power stroke. • The two-stroke engine, whether SI or CI, has a higher power density, because it requires half as many crankshaft revolutions to produce power. However, two-stroke engines are prone to let more fuel pass through, resulting in higher hydrocarbon emissions in the form of unburned fuel.
Technology Applications • Reciprocating engines can be installed to accommodate baseload, peaking, emergency or standby power applications. Commercially available engines range in size from 10 kW to more than 7 MW, making them suitable for many distributed-power applications. Utility substations and small municipalities can install engines to provide baseload or peak shaving power. However, the most promising markets for reciprocating engines are on-site at commercial, industrial, and institutional facilities. With fast start-up time, reciprocating engines can play integral backup roles in many building energy systems. On-site reciprocating engines become even more attractive in regions with high electric rates (energy/demand charges). • When properly treated, the engines can run on fuel generated by waste treatment (methane) and other biofuels. • By using the recuperators that capture and return waste exhaust heat, reciprocating engines can be used in combined heat and power (CHP) systems to achieve energy efficiency levels approaching 80%. In fact, reciprocating engines make up a large portion of the CHP or cogeneration market.
Current Status • Commercially available engines have efficiencies (LHV) between 28% and 50% and yield NOx emissions of 0.5-2.0 grams per horsepower hour (hp-hr) for lean-burn natural gas engines and 3.5-6.0 g/bhp-hr for conventional dual-fuel engines. CHP engines achieve efficiencies (LHV) of 70-80%.
60

• Installed cost for reciprocating engines range between $695 and $1,350/ kW depending on size and whether the unit is for a straight generation or cogeneration application. Operating and maintenance costs range 0.8 -1.8 ¢/kWh. Production costs are generally lowest for high-speed engines. • Exhaust temperature for most reciprocating engines is 700-1,200° F in non-CHP mode and 350500°F in a CHP system after heat recovery. • Noise levels with sound enclosures are typically between 70-80 dB. • The reciprocating-engine systems typically include several major parts: fuel storage, handling, and conditioning, prime mover (engine), emission controls, waste recovery (CHP systems) and rejections (radiators), and electrical switchgear. • Annual shipments of reciprocating engines (sized 10MW or less) have almost doubled to 18 GW between 1997 and 2000. The growth is overwhelming in the diesel market, which represented 16 GW shipments compared with 2 GW of natural gas reciprocating engine shipments in 2000. • The cost of full maintenance contracts range from 0.7 to 2.0 cents/kWh. Remote monitoring is now available as a part of service contracts.
(Source: Diesel and Gas Turbine Worldwide, 2003).
Key indicators for stationary reciprocating engines: Installed Worldwide Capacity
Installed US Capacity
Number of CHP sites using Recips in the U.S. in 2000
146 GW 52 GW 1,055
Sources: Distributed Generation: The Power Paradigm for the New Millenium, 2001; “Gas-Fired Distributed Energy Resource Technology Characterizations (2003).”
Technology History • Natural gas-reciprocating engines have been used for power generation since the 1940s. The earliest engines were derived from diesel blocks and incorporated the same components of the diesel engine. Spark plugs and carburetors replaced fuel injectors, and lower compression-ratio pistons were substituted to run the engine on gaseous fuels. These engines were designed to run without regard to fuel efficiency or emission levels. They were used mainly to produce power at local utilities and to drive pumps and compressors. • In the mid-1980s, manufacturers were facing pressure to lower NOx emissions and increase fuel economy. Leaner air-fuel mixtures were developed using turbochargers and charge air coolers, and in combination with lower in-cylinder fire temperatures, the engines reduced NOx from 20 to 5 g/bhp-hr. The lower in-cylinder fire temperatures also meant that the BMEP (Brake Mean Effective Pressure) could increase without damaging the valves and manifolds. • Reciprocating-engine sales have grown more then fivefold from 1988 (2 GW) to 1998 (11.5 GW). Gas-fired engine sales in 1990 were 4% compared to 14% in 1998. The trend is likely to continue for gas-fired reciprocating engines due to strict air-emission regulations and because performance has been steadily improving for the past 15 years. • More than 35 million reciprocating engine units are produced in North America annually for automobiles, trucks, construction and mining equipment, marine propulsion, lawn care and a diverse range of power-generation applications.
Technology Future In 1998, The U.S. Department of Energy – in partnership with the Gas Technology Institute, the Southwest Research Institute, and equipment manufacturers – joined the Advanced Reciprocating Engines Systems (ARES) consortium, aimed at further advancing the performance of the engine. Performance targets include: High Efficiency- Target fuel-to-electricity conversion efficiency (LHV) is 50 % by 2010.
61

Environment – Engine improvements in efficiency, combustion strategy, and emissions reductions will substantially reduce overall emissions to the environments. The NOx target for the ARES program is 0.1 g/hp-hr, a 90% decrease from today’s NOx emissions rate. Fuel Flexibility – Natural gas-fired engines are to be adapted to handle biogas, renewables, propane and hydrogen, as well as dual fuel capabilities. Cost of Power – The target for energy costs, including operating and maintenance costs, is 10% less than current state-of-the-art engine systems. Availability, Reliability, and Maintainability – The goal is to maintain levels equivalent to current state-of-the-art systems. Other R&D directions include: new turbocharger methods, heat recovery equipment specific to the reciprocating engine, alternate ignition system, emission-control technologies, improved generator technology, frequency inverters, controls/sensors, higher compression ratio, and dedicated natural-gas cylinder heads.
Source: National Renewable Energy Laboratory. Gas-Fired Distributed Energy Resource Technology Characterizations. NREL/TP-620-34783. November 2003.
62

Reciprocating Engines
Technology Performance
Power Ranges (kW) of Selected Manufacturers Source: Manufacturer Specs Low High
Caterpillar 150 3,350 Waukesha 200 2,800 Cummins 5 1,750 Jenbacher 200 2,600 Wartsila 500 5,000
Market Data
Source: Debbie Haught, DOE, communication 2/26/02 - from Diesel and Gas Turbine Market Shipments Worldwide. (GW of units under 10 MW in size)
1996 1997 1998 1999 2000 Diesel Recips 7.96 7.51 8.23 10.02 16.46 Gas Recips 0.73 1.35 1.19 1.63 2.07
63

Microturbines Technology Description
Microturbines are small combustion turbines of a size comparable to a refrigerator and with outputs of 30 kW to 400 kW. They are used for stationary energy generation applications at sites with space limitations for power production. They are fuel-flexible machines that can run on natural gas, biogas, propane, butane, diesel, and kerosene. Microturbines have few moving parts, high efficiency, low emissions, low electricity costs, and waste heat utilization opportunities; and are lightweight and compact in size. Waste heat recovery can be used in combined heat and power (CHP) systems to achieve energy efficiency levels greater than 80%. System Concepts • Microturbines consist of a compressor, combustor, turbine, alternator, recuperator, and generator. • Microturbines are classified by the physical arrangement of the component parts: single shaft or two-shaft, simple cycle or recuperated, inter-cooled, and reheat. The machines generally operate at more than 40,000 rpm, while some machines operate at more than 100,000 rpm. • A single shaft is the more common design, because it is simpler and less expensive to build. Conversely, the split shaft is necessary for machine-drive applications, which do not require an inverter to change the frequency of the AC power. • Efficiency gains can be achieved with greater use of materials like ceramics, which perform well at higher engine-operating temperatures. Representative Technologies • Microturbines in a simple-cycle, or unrecuperated, turbine; heated, compressed air is mixed with fuel and burned under constant pressure conditions. The resulting hot gas is allowed to expand through a turbine to perform work. Simple-cycle microturbines have a lower cost, higher reliability, and more heat available for CHP applications than recuperated units. • Recuperated units use a sheet-metal heat exchanger that recovers some of the heat from an exhaust stream and transfers it to the incoming air stream. The preheated air is then used in the combustion process. If the air is preheated, less fuel is necessary to raise its temperature to the required level at the turbine inlet. Recuperated units have a higher efficiency and thermal-to-electric ratio than unrecuperated units, and yield 30%-40% fuel savings from preheating.
Technology Applications • Microturbines can be used in a wide range of applications in the commercial, industrial, and institutional sectors; microgrid power parks; remote off-grid locations; and premium power markets. • Microturbines can be used for backup power, baseload power, premium power, remote power, grid support, peak shaving, cooling and heating power, mechanical drive, and use of wastes and biofuels. • Microturbines can be paired with other distributed energy resources such as energy-storage devices and thermally activated technologies.
Current Status • Microturbine systems have recently entered the market, and the manufacturers are targeting both traditional and nontraditional applications in the industrial and buildings sectors, including CHP, backup power, continuous power generation, and peak shaving. • The most popular microturbine installed to date is the 30-kW system manufactured by Capstone. Microturbine efficiencies are 25-29% (LHV).
64

• The typical 30 kW unit package cost averages $1,100/kW. For gas-fired microturbines, the present installation cost (site preparation and natural gas hookup) for a typical 30 kW commercial unit averages $2,263/kW for power only systems and $2,636 for CHP systems. Service contracts are available at 1 to 2 cents/kWh
Technology History • Microturbines represent a relatively new technology, which entered the commercial market in 1999-2000. The technology used in microturbines is derived from aircraft auxiliary power systems, diesel-engine turbochargers, and automotive designs. • In 1988, Capstone Turbine Corporation began developing the microturbine concept; and, in 1998, Capstone was the first manufacturer to offer commercial power products using microturbine technology.
Technology Future • The acceptable cost target for microturbine energy is $0.05/kWh, which would present a cost advantage over most nonbaseload utility power. • "Ultra-clean, high-efficiency" microturbine product designs focus on the following DOE performance targets:
− High Efficiency — Fuel-to-electricity conversion efficiency of at least 40%. − Environment — NOx < 7 ppm (natural gas). − Durability — 1,000 hours of reliable operations between major overhauls and a service life of at
least 45,000 hours. − Cost of Power — System costs < $500/kW, costs of electricity that are competitive with
alternatives (including grid) for market applications by 2005 (for units in the 30-60 kW range) − Fuel Flexibility — Options for using multiple fuels including diesel, ethanol, landfill gas, and
biofuels. Source: National Renewable Energy Laboratory. Gas-Fired Distributed Energy Resource Technology Characterizations. NREL/TP-620-34783. November 2003.
65

Microturbines
Market Data Microturbine Shipments Source: Debbie Haught, communications 2/26/02.
Capstone sales reported in Quarterly SEC filings, others estimated. No. of units 1998 1999 2000 2001 Capstone 2 211 790 1,033 Other Manufacturers 120
MW Capstone 6 23.7 38.1 Other Manufacturers 10.2
Technology Performance Source: Manufacturer Surveys, Arthur D. Little (ADL) estimates.
Current System Efficiency (%) LHV: 17-20% unrecuperated, 25-30%+ recuperated Lifetime (years) 5-10 years, depending on duty cycle Emissions (natural gas fuel)
CO 2
SO 2
NO x
CO PM
Current Future (2010
670 - 1,180 g/kWh (17-30% efficiency)
Negligible (natural gas) Negligible
9-25 ppm <9 ppm 25-50 ppm <9 ppm Negligible Negligible
Future Products: Current Products: 25-100 kW up to 1 MW
Typical System Size Units can be bundled or "ganged" to produce power in larger increments
Maintenance Requirements (Expected) 10,000-12,000 hr before major overhaul (rotor replacement) Footprint [ft2/kW] 0.2-0.4
66

Technology Performance
Sources: Debbie Haught, DOE, communication 2/26/02 and Energetics Inc. Distributed Energy Technology Simulator: Microturbine Validation, July 12 2001.
Capstone Turbine Corporation Elliot Energy
Systems Ingersoll-Rand Energy
Services Turbec DTE Energy Technologies
Model Name Model 330 Capstone 60 TA-80 PowerWorks ENT 400 recuperated Size 30 kW 60 kW 80 kW 70 kW 100 kW 300 kW Voltage 400-480 VAC 400 VAC 480/277 VAC
Fuel Flexibility natural gas, medium Btu gas, diesel, kerosene
natural gas natural gas natural gas, biogas, ethanol, diesel
natural gas (diesel, propane future)
Fuel Efficiency (cf/kWh) 13.73 14.23 11.2
Efficiency 26% (+/-2%) 28% (+/- 2%) 28% 30-33% 30% 28% (+/- 2%) 70-90% CHP 70-90% CHP 80% CHP 80% CHP 74% CHP
Emissions NOx <9ppmV @15% O2
NOx diesel <60ppm, NOx NG <25ppm, CO diesel <400ppm, CO
NG <85ppm
NOx <9ppmV @15% O2, CO <9ppmV @15%
O2
NOx <15ppmV @15% O2, CO <15ppm, UHC
<10ppm
NOx <9ppmV @15% O2
1999: 211 units 2000: 2 precommercial units, expected
commercial in 2001
2000: 20 units in the European
market Available late 2001 Units Sold 2000: 790 units
2001: 1,033 units 2001: 100 units Unit Cost $1000/kW $75,000
Cold Start-Up Time 3 min 3 min emergency, 7 min normal
Web site www.capstone.com www.elliott-turbo.com/new/produ cts_microtubines.html
www.irco.com/energy systems/powerworks. html
www.turbec.com www.dtetech.com/ener gynow/portfolio/2_1_4. asp
67

Fuel Cells Technology Description
A fuel cell is an electrochemical energy conversion device that converts hydrogen and oxygen into electricity and water. This unique process is practically silent, nearly eliminates emissions, and has no moving parts.
System Concepts
• Similar to a battery, fuel cells have an anode and a cathode separated by an electrolyte. • Hydrogen enters the anode and air (oxygen) enters the cathode. The hydrogen and oxygen are separated into ions and electrons, in the presence of a catalyst. Ions are conducted through the electrolyte while the electrons flow through the anode and the cathode via an external circuit. The current produced can be utilized for electricity. The ions and electrons then recombine, with water and heat as the only byproducts. • Fuel cell systems today typically consist of a fuel processor, fuel cell stack, and power conditioner. The fuel processor, or reformer, converts hydrocarbon fuels to a mixture of hydrogen-rich gases and, depending on the type of fuel cell, can remove contaminants to provide pure hydrogen. The fuel cell stack is where the hydrogen and oxygen electrochemically combine to produce electricity. The electricity produced is direct current (DC) and the power conditioner converts the DC electricity to alternating current (AC) electricity, for which most of the end-use technologies are designed. As a hydrogen infrastructure emerges, the need for the reformer will disappear as pure hydrogen will be available near point of use.
Representative Technologies
Fuel cells are categorized by the kind of electrolyte they use: • Alkaline Fuel Cells (AFCs) were the first type of fuel cell to be used in space applications. AFCs contain a potassium hydroxide (KOH) solution as the electrolyte and operate at temperatures between 60 and 260°C (140 to 500°F). The fuel supplied to an AFC must be pure hydrogen. Carbon monoxide poisons an AFC, and carbon dioxide (even the small amount in the air) reacts with the electrolyte to form potassium carbonate. • Phosphoric Acid Fuel Cells (PAFCs) were the first fuel cells to be commercialized. These fuel cells operate at 190-210°C (374-410°F) and achieve 35 to 45% fuel-to-electricity efficiencies LHV. Commercially-validated reliabilities are 90-95%. • Proton Exchange Membrane Fuel Cells (PEMFCs) operate at relatively low temperatures of 70-100°C (150-180°F), have high-power density, can vary their output quickly to meet shifts in power demand, and are suited for applications where quick start-up is required (e.g., transportation and power generation). The PEM is a thin fluorinated plastic sheet that allows hydrogen ions (protons) to pass through it. The membrane is coated on both sides with highly dispersed metal alloy particles (mostly platinum) that are active catalysts. • Molten Carbonate Fuel Cell (MCFC) technology has the potential to reach fuel-to-electricity efficiencies of 45% to 60% on a higher heating value basis (HHV). Operating temperatures for MCFCs are around 650° C (1,200°F), which allows total system thermal efficiencies up to 50% HHV in combined-cycle applications. MCFCs have been operated on hydrogen, carbon monoxide, natural gas, propane, landfill gas, marine diesel, and simulated coal gasification products. • Solid Oxide Fuel Cells (SOFCs) operate at temperatures up to 1,000°C (1,800°F), which further enhances combined-cycle performance. A solid oxide system usually uses a hard ceramic material instead
68

of a liquid electrolyte. The solid-state ceramic construction enables the high temperatures, allows more flexibility in fuel choice, and contributes to stability and reliability. As with MCFCs, SOFCs are capable of fuel-to-electricity efficiencies of 45% to 55% LHV and total system thermal efficiencies up to 85% LHV in combined-cycle applications.
Technology Applications • Fuel cell systems can be sized for grid-connected applications or customer-sited applications in residential, commercial, and industrial facilities. Depending on the type of fuel cell (most likely SOFC and MCFC), useful heat can be captured and used in combined heat and power systems (CHP). • Premium power applications are an important niche market for fuel cells. Multiple fuel cells can be used to provide extremely high (more then six-nines) reliability and high-quality power for critical loads. • Data centers and sensitive manufacturing processes are ideal settings for fuel cells. • Fuel cells also can provide power for vehicles and portable power. PEMFCs are a leading candidate for powering the next generation of vehicles. The military is interested in the high-efficiency, low-noise, small-footprint portable power.
Current Status • The cost of fuel cells hinders competition in widespread domestic and international markets without significant subsidies. • PAFC – More than 250 PAFC systems are in service worldwide, with those installed by ONSI having surpassed 2 million total operating hours with excellent operational characteristics and high availability.
Economic Specifications of the PAFC (200 kW) Expense Description Cost Capital Cost 1 complete PAFC power plant $850,000 Installation Electrical, plumbing, and foundation $40,000 Operation Natural gas costs $5.35/MMcf Minor Maintenance Service events, semiannual and annual maintenance $20,000/yr Major Overhaul Replacement of the cell stack $320,000/5 yrs
Source: Energetics, Distributed Energy Technology Simulator: Phosphoric Acid Fuel Cell Validation, May 2001.
• PEMFC – Ballard’s first 250 kW commercial unit is under test. PEM systems up to 200 kW are also operating in several hydrogen-powered buses. Most units are small (<10 kW). PEMFCs currently cost several thousand dollars per kW. • SOFC – A small, 25 kW natural gas tubular SOFC systems has accumulated more than 70,000 hours of operations, displaying all the essential systems parameters needed to proceed to commercial configurations. Both 5 kW and 250 kW models are in demonstration. • MCFC – 50 kW and 2 MW systems have been field-tested. Commercial offerings are in the 250 kW-2 MW range.
Fuel Cell Type Electrolyte
AFC PEMFC
KOH Nafion
PAFC Phosphoric Acid
Operating Temp (°C)
260 65-85
190-210
Electrical Efficiency (% HHV) 32-40 30-40
35-45
Commercial Availability
1960s 2000-2001
1992
Typical Unit Size Range
Start-up time (hours)
5-250 kW < 0.1
200 kW 1-4
69
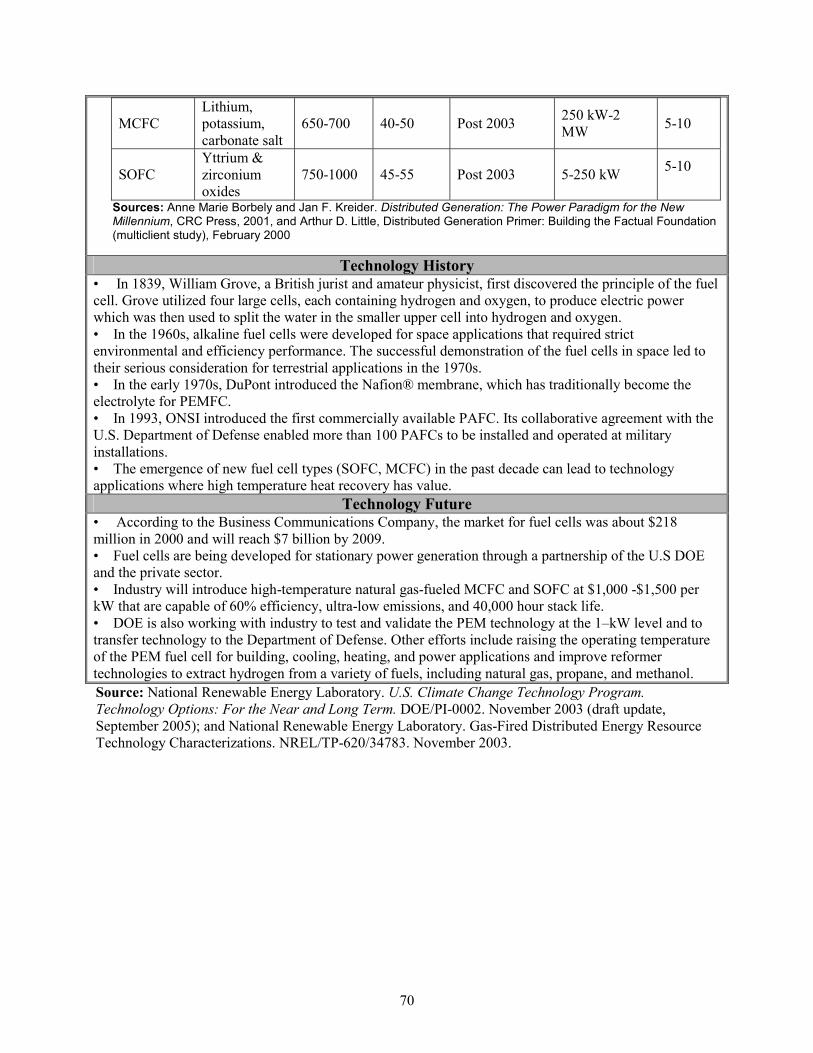
MCFC Lithium, potassium, carbonate salt
650-700 40-50 Post 2003 250 kW-2 MW 5-10
SOFC Yttrium & zirconium 750-1000 45-55 Post 2003 5-250 kW 5-10
oxides Sources: Anne Marie Borbely and Jan F. Kreider. Distributed Generation: The Power Paradigm for the New Millennium, CRC Press, 2001, and Arthur D. Little, Distributed Generation Primer: Building the Factual Foundation (multiclient study), February 2000
Technology History • In 1839, William Grove, a British jurist and amateur physicist, first discovered the principle of the fuel cell. Grove utilized four large cells, each containing hydrogen and oxygen, to produce electric power which was then used to split the water in the smaller upper cell into hydrogen and oxygen. • In the 1960s, alkaline fuel cells were developed for space applications that required strict environmental and efficiency performance. The successful demonstration of the fuel cells in space led to their serious consideration for terrestrial applications in the 1970s. • In the early 1970s, DuPont introduced the Nafion® membrane, which has traditionally become the electrolyte for PEMFC. • In 1993, ONSI introduced the first commercially available PAFC. Its collaborative agreement with the U.S. Department of Defense enabled more than 100 PAFCs to be installed and operated at military installations. • The emergence of new fuel cell types (SOFC, MCFC) in the past decade can lead to technology applications where high temperature heat recovery has value.
Technology Future • According to the Business Communications Company, the market for fuel cells was about $218 million in 2000 and will reach $7 billion by 2009. • Fuel cells are being developed for stationary power generation through a partnership of the U.S DOE and the private sector. • Industry will introduce high-temperature natural gas-fueled MCFC and SOFC at $1,000 -$1,500 per kW that are capable of 60% efficiency, ultra-low emissions, and 40,000 hour stack life. • DOE is also working with industry to test and validate the PEM technology at the 1–kW level and to transfer technology to the Department of Defense. Other efforts include raising the operating temperature of the PEM fuel cell for building, cooling, heating, and power applications and improve reformer technologies to extract hydrogen from a variety of fuels, including natural gas, propane, and methanol. Source: National Renewable Energy Laboratory. U.S. Climate Change Technology Program. Technology Options: For the Near and Long Term. DOE/PI-0002. November 2003 (draft update, September 2005); and National Renewable Energy Laboratory. Gas-Fired Distributed Energy Resource Technology Characterizations. NREL/TP-620/34783. November 2003.
70

Fuel Cells
Technology Performance Source: Hydrogen, Fuel Cells & Infrastructure Technologies Progra Development and Demonstration Plan, February 2005
m Multiyear Research,
Characteristic Units
Small (3-25 kW)
2004 Status 2005 2010 2004 Status
Large (50-250kW)
2005 2010
Electrical Energy Efficiency @ rated power
CHP Energy Efficiency @ rated power
Cost
Transient Response Time (from 10% to 90% power)
Cold Start-up Time (to rated power @ -20 degrees C ambient) Continuous-use application
Survivability (min and max ambient temperature)
Durability @ <10% rated power degradation
%
%
$/kW
msec
min
C degrees
hour
3000
30 32 35
75 75 80
1500 1000
<3 <3 <3
<90 <60 <30
-25 +40
-30 +40
-35 +40
>8,000 16,000 40,000
30
75
2500
<3
<90
-25 +40
15,000
32
75
1500
<3
<60
-30 +40
20,000
40
80
750
<3
<30
-35 +40
40,000
71

Noise dB(A) <70 @ 1m
<65 @ 1m
<60 @ 1m
<65 @ 1m
<60 @ 1m
<55 @ 1m
Emissions g/ (Combined NOX, CO, SOX, 1,000 <15 <10 <9 <8 <2 <1.5 Hydrocarbon, Particulates) kW
a Includes fuel processor, stack, and all ancillaries. b Ratio of DC output energy to the LHV of the input fuel (natural gas or LPG) average value at rated power over life of power plant. c For LPG, efficiencies are 1.5 percentage points lower than natural gas because the reforming process is more complex. d Ratio of DC output energy plus recovered thermal energy to the LHV of the input fuel (natural gas or LPG) average value at rated power over life of power plant e Includes projected cost advantage of high-volume production (2,000 units/year). Current cost does not include integrated auxiliaries, battery and power regulator necessary for black start. f Not applicable to backup power because this application does not use a fuel processor.
72

Batteries Technology Description
Batteries are likely the most widely known type of energy storage. They all store and release electricity through electrochemical processes and come in a variety of shapes and sizes. Some are small enough to fit on a computer circuit board, while others are large enough to power a submarine. Some batteries are used several times a day while others may sit idle for 10 or 20 years before they are ever used. Obviously, for such a diversity of uses, a variety of battery types are necessary. But all of them work from the same basic principles. System Concepts Battery electrode plates, typically consisting of chemically reactive materials, are placed in an electrolyte, which facilitates the transfer of ions in the battery. The negative electrode gives up electrons during the discharge cycle. This flow of electrons creates electricity that is supplied to any load connected to the battery. The electrons are then transported to the positive electrode. This process is reversed during charging. Batteries store and deliver direct current (DC) electricity. Thus, power-conversion equipment is required to connect a battery to the alternating current (AC) electric grid. Representative Technologies • The most mature battery systems are based on lead-acid technology. There are two major kinds of lead acid batteries: flooded lead acid batteries and valve-regulated-lead-acid (VRLA) batteries. • There are several rechargeable, advanced batteries under development for stationary and mobile applications, including lithium-ion, lithium polymer, nickel metal hydride, zinc-air, zinc-bromine, sodium sulfur, and sodium bromide. • These advanced batteries offer potential advantages over lead acid batteries in terms of cost, energy density, footprint, lifetime, operating characteristics, reduced maintenance, and improved performance.
Technology Applications • Lead-acid batteries are the most common energy storage technology for stationary and mobile applications. They offer maximum efficiency and reliability for the widest variety of stationary applications: telecommunications, utility switchgear and control, uninterruptible power supplies (UPS), photovoltaic, and nuclear power plants. They provide instantaneous discharge for a few seconds or a few hours. • Installations can be any size. The largest system to date is 20 MW. Lead-acid batteries provide power quality, reliability, peak shaving, spinning reserve, and other ancillary services. The disadvantages of the flooded lead-acid battery include the need for periodic addition of water, and the need for adequate ventilation because the batteries can give off hydrogen gas when charging. • VRLA batteries are sealed batteries fitted with pressure-release valves. They have been called low-maintenance batteries, because they do not require periodic adding of water. They can be stacked horizontally as well as vertically, resulting in a smaller footprint than flooded lead-acid batteries. Disadvantages include higher cost and increased sensitivity to the charging cycle used. High temperature results in reduced battery life and performance. • Several advanced “flow batteries” are being developed. The zinc-bromine battery consists of a zinc positive electrode and a bromine negative electrode separated by a microporous separator. An aqueous solution of zinc/bromide is circulated through the two compartments of the cell from two separate reservoirs. Zinc-bromine batteries are currently being demonstrated in a number of hybrid installations, with microturbines and diesel generators. Sodium bromide/sodium bromine batteries are similar to zinc
73

bromine batteries in function and are under development for large-scale, utility applications. The advantages of flow-battery technologies are low cost, modularity, scalability, transportability, low weight, flexible operation – and all components are easily recyclable. The major disadvantage is a relatively low cycle efficiency. • Other advanced batteries include the lithium-ion, lithium-polymer, and sodium-sulfur batteries. The advantages of lithium batteries include their high specific energy (four times that of lead-acid batteries) and charge retention. Sodium sulfur batteries operate at high temperature and are being tested for utility load-leveling applications.
Current Status • Energy storage systems for large-scale power quality applications (~10 MW) are economically viable now, with sales from one manufacturer doubling from 2000 to 2001. • Lead-acid battery annual sales tripled between 1993 and 2000. The relative importance of battery sales for switchgear and UPS applications shrunk during this period from 45% to 26% of annual sales by 2000. VRLA and flooded battery sales were $5.34 million and $1.71 million, respectively, in 2000. • Lead-acid battery manufacturers saw sales drop with the collapse of the telecommunications bubble in 2001. They saw significant growth in sales in 2000, due to the demand from communications firms, and invested in production and marketing in anticipation of further growth. • Many manufacturers have been subject to mergers and acquisitions. A few dozen manufacturers in the United States and abroad still make batteries. • Government and private industry are currently developing a variety of advanced batteries for transportation and defense applications: lithium-ion, lithium polymer, nickel metal hydride, sodium metal chloride, sodium sulfur, and zinc bromine. • Rechargeable lithium batteries already have been introduced in the market for consumer electronics and other portable equipment. • There are two demonstration sites of ZBB’s Zinc Bromine batteries in Michigan and two additional ones in Australia. • Utility-grade batteries are sized 17-40 MWh and range in efficiency from 70% to 80%. Such batteries have power densities ranging from 0.2 to 0.4 kW/kg and 30-50 Wh/kg in energy density. • Batteries are the most common energy storage device. • About 150 MW of utility peak-shaving batteries were in use in Japan in 2003. • In 2003, construction began on two 10-MW flow battery systems – one in the U.K. and the other in the United States.
Technology History • Most historians date the invention of batteries to about 1800, when experiments by Alessandro Volta resulted in the generation of electrical current from chemical reactions between dissimilar metals. • Secondary batteries date back to 1860, when Raymond Gaston Planté invented the lead-acid battery. His cell used two thin lead plates separated by rubber sheets. He rolled the combination up and immersed it in a dilute sulfuric acid solution. Initial capacity was extremely limited because the positive plate had little active material available for reaction. • Others developed batteries using a paste of lead oxides for the positive plate active materials. This allowed much quicker formation and better plate efficiency than the solid Planté plate. Although the rudiments of the flooded lead-acid battery date back to the 1880s, there has been a continuing stream of improvements in the materials of construction and the manufacturing and formation processes. • Because many of the problems with flooded lead-acid batteries involved electrolyte leakage, many attempts have been made to eliminate free acid in the battery. German researchers developed the gelled-electrolyte lead-acid battery (a type of VRLA) in the early 1960s. Working from a different approach, Gates Energy Products developed a spiral-wound VRLA cell, which represents the state of the art today.
74
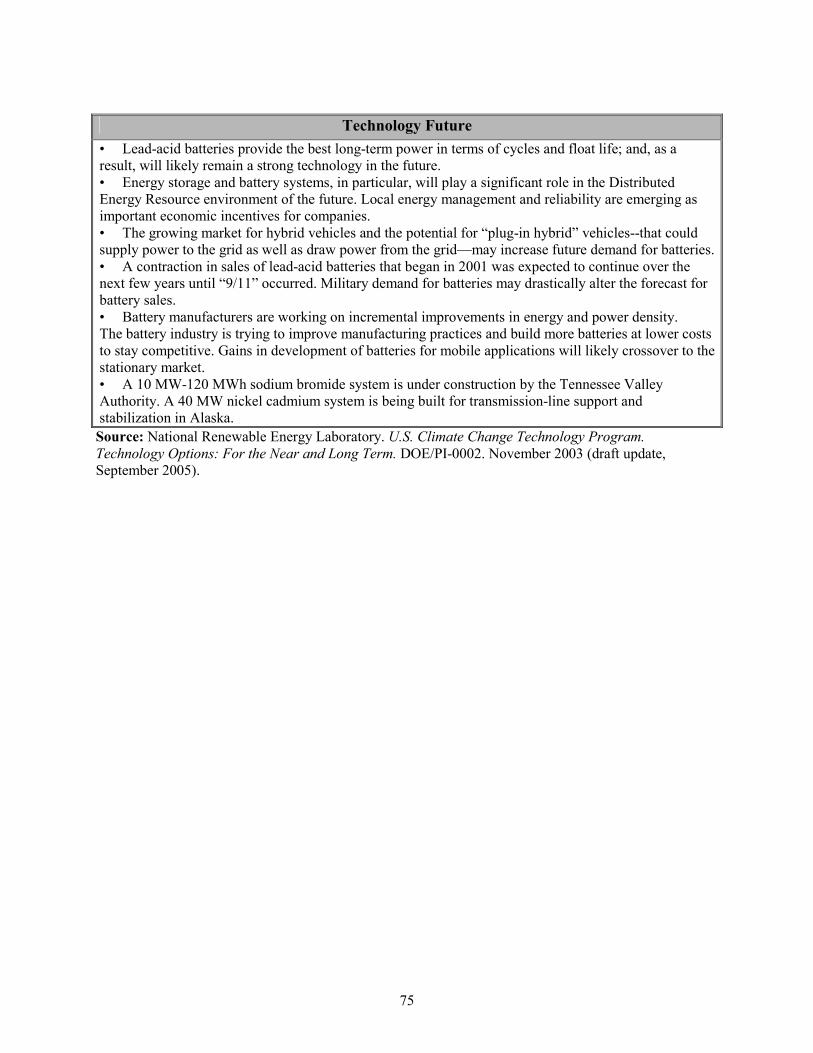
Technology Future • Lead-acid batteries provide the best long-term power in terms of cycles and float life; and, as a result, will likely remain a strong technology in the future. • Energy storage and battery systems, in particular, will play a significant role in the Distributed Energy Resource environment of the future. Local energy management and reliability are emerging as important economic incentives for companies. • The growing market for hybrid vehicles and the potential for “plug-in hybrid” vehicles--that could supply power to the grid as well as draw power from the grid—may increase future demand for batteries. • A contraction in sales of lead-acid batteries that began in 2001 was expected to continue over the next few years until “9/11” occurred. Military demand for batteries may drastically alter the forecast for battery sales. • Battery manufacturers are working on incremental improvements in energy and power density. The battery industry is trying to improve manufacturing practices and build more batteries at lower costs to stay competitive. Gains in development of batteries for mobile applications will likely crossover to the stationary market. • A 10 MW-120 MWh sodium bromide system is under construction by the Tennessee Valley Authority. A 40 MW nickel cadmium system is being built for transmission-line support and stabilization in Alaska.
Source: National Renewable Energy Laboratory. U.S. Climate Change Technology Program. Technology Options: For the Near and Long Term. DOE/PI-0002. November 2003 (draft update, September 2005).
75

Batteries
Market Data
Recent Battery Sales Source: Battery Council International, Annual Sales Summary, October 2001.
1993 2000 Growth Flooded Batteries (Million $) 156.9 533.5 340% VRLA Batteries (Million $) 79.6 170.6 214% Total Lead-Acid Batteries (Million $) 236.5 704.1 298%
Percent Communications 58% 69% Percent Switchgear/UPS 45% 26%
Market Predictions Source: Sandia National Laboratories, Battery Energy Storage Market Feasibility Study, September 1997.
Year MW ($ Million) 2000 496 372 2005 805 443 2010 965 434
76

Technology Performance
Grid-Connected Energy Storage Source: Sandia National Laboratories, Characteristics and Technologies for Technologies Costs and Efficiencies Long- vs. Short-Term Energy Storage, March 2001. Energy-Storage System Energy Related
Cost ($/kWh) Power Related Cost ($/kW) Balance of Plant
($/kWh) Discharge Efficiency Lead-acid Batteries
low 175 200 50 0.85 average 225 250 50 0.85
high 250 300 50 0.85 Power-Quality Batteries 100 250 40 0.85 Advanced Batteries 245 300 40 0.70
Technology Performance
Off-Grid Storage Applications, Their Source: Sandia National Laboratories, Energy Storage Systems Program Requirements, and Potential Markets to Report for FY99, June 2000. 2010 According to Boeing Application Single Home:
Developing Community
Developing Community: No Industry Developing Community:
Light Industry
Developing Community:
Moderate Industry
Advanced Community or Military Base
Storage-System Attributes Power (kW) 0.5 8 40 400 1 MW
Energy (kWh) 3 45 240 3,600 1.5 MWh Power
Base (kW) 0.5 5 10 100 100 Peak (kW) < 8 < 40 < 400 < 1000
Discharge Duration 5 to 72 hrs 5 to 72 hrs 5 to 24 hrs 5 to 24 hrs 0.5 to 1 hr Total Projected Number of Systems 47 Million 137,000 40,000 84,000 131,000 Fraction of Market Captured by Storage > 50 > 50 ~ 30 ~ 10 < 5 Total Number of Storage Systems to Capture Market Share
24 Million 69,000 12,000 8,000 < 7,000
77

Technology Performance
Advanced Batteries Characteristics Source: DOE Energy Storage Systems Program Annual Peer Review FY01, Boulder City Battery Energy Storage, November 2001.
Energy Storage System Sodium Sulfur Vanadium Redox Zinc Bromine Field Experience Over 30
Projects, 25 kW to 6 MW,
Largest 48 MW
Several Projects 100kW to 3 MW (pulse power), Largest 1.15 MWh
Several Projects, 50 kW to 250 kW, Largest 400 kWh
Production Capacity 160 MWh/yr 30 MWh/yr 40 to 70 MWh/yr Actual Production 50 MWh/yr 10 MWh/yr 4.5 MWh/yr Life 15 yrs 7 to 15 yrs 10 to 20 yrs Efficiency 72% 70to 80 % 65 to 70% O&M Costs $32.5k/yr $50k/yr $30 to $150k/yr
78

Advanced Energy Storage Technology Description
Advanced storage technologies under active development include processes that are mechanical (flywheels, pneumatic), electrochemical (advanced batteries, reversible fuel cells, hydrogen, ultracapacitors), and purely electrical (superconducting magnetic storage). Energy storage devices are added to the utility grid to improve productivity, increase reliability, or defer equipment upgrades. Energy storage devices must be charged and recharged with electricity generated elsewhere. Because the storage efficiency (output compared to input energy) is less than 100%, on a kilowatt-per-kilowatt basis, energy storage does not directly decrease CO2 production. The exception to this rule is the use of advanced energy storage in conjunction with intermittent renewable energy sources (such as photovoltaics and wind) that produce no direct CO2. Energy storage allows these intermittent resources to be dispatchable. Energy-storage devices do positively affect CO2 production on an industrial output basis by providing high-quality power, maximizing industrial productivity. New battery technologies, including sodium sulfur and flow batteries, significantly improve the energy and power densities for stationary battery storage as compared to traditional flooded lead-acid batteries. System Concepts • Stationary applications: Electric demand falls at night, providing an opportunity for the most cost effective electric generators to produce low cost power at night for storage. The stored energy could displace high cost, less efficient power normally produced at the peak during the day. CO2 emissions would be reduced if the efficiency of the energy storage were greater than 85%. Energy storage also can be used to alleviate the pressure on highly loaded components in the grid (transmission lines, transformers, etc.) These components are typically only loaded heavily for a small portion of the day. The storage system would be placed downstream from the heavily loaded component. This would reduce electrical losses of overloaded systems. Equipment upgrades also would be postponed, allowing the most efficient use of capital by utility companies. For intermittent renewables, advanced energy storage technology would improve their applicability. • Power quality and reliability: The operation of modern, computerized manufacturing depends directly on the quality of power the plant receives. Any voltage sag or momentary interruption can trip off a manufacturing line and electronic equipment. Industries that are particularly sensitive are semiconductor manufacturing; plastics and paper manufacturing; electronic retailers; and financial services such as banking, stock brokerages, and credit card-processing centers. If an interruption occurs that disrupts these processes, product is often lost, plant cleanup can be required, equipment can be damaged, and transactions can be lost. Any loss must be made up decreasing the overall efficiency of the operation, thereby increasing the amount of CO2 production required for each unit of output. Energy-storage value is usually measured economically with the cost of power-quality losses, which is estimated in excess of $1.5 B/year in the United States alone. Industry is also installing energy-storage systems to purchase relatively cheap off-peak power for use during on-peak times. This use dovetails very nicely with the utilities’ interest in minimizing the load on highly loaded sections of the electric grid. Many energy-storage systems offer multiple benefits. This 5-MVA, 3.5-MWh valve-regulated lead-acid battery system is installed at a lead recycling plant in the Los Angeles, California, area. The system provides power-quality protection for the plant’s pollution-control equipment, preventing an environmental release in the event of a loss of power. The system carries the critical plant loads while an orderly shutdown occurs. The battery system also in discharged daily during the afternoon peak (and recharged nightly), reducing the plant’s energy costs.
Technology Applications • For utilities, the most mature storage technology is pumped hydro; however, it requires topography with significant differences in elevation, so it’s only practical in certain locations. Compressed-air energy storage uses off-peak electricity to force air into underground caverns or dedicated tanks, and releases the air to drive turbines to generate on-peak electricity; this, too, is location-specific. Batteries, both
79

m
conventional and advanced, are commonly used for energy-storage systems. Advanced flowing electrolyte batteries offer the promise of longer lifetimes and easier scalability to large, multi-MW systems. Superconducting magnetic energy storage (SMES) is largely focused on high-power, short-duration applications such as power quality and transmission system stability. Ultracapacitors have very high power density, but currently have relatively low total energy capacity and are also applicable for high-power, short-duration applications. Flywheels are now commercially viable in power quality and UPS applications, and emerging for high power, high-energy applications. • Each energy-storage system consists of four major components: the storage device (battery, flywheel, etc.); a power-conversion system; a control system for the storage system, possibly tied in with a utility SCADA (Supervisory Control And Data Acquisition) system or industrial facility control system; and interconnection hardware connecting the storage system to the grid. All common energy-storage devices are DC devices (battery) or produce a varying output (flywheels) requiring a power conversion system to connect it to the AC grid. The control system must manage the charging and discharging of the system, monitor the state of health of the various components, and interface with the local environment at a minimum to receive on/off signals. Interconnection hardware allows for the safe connection between the storage system and the local grid.
Current Status Utilities
Technology Efficiency Energy density Power density Sizes Comments [%] [W-h/kg] [kW/kg] [MW-h]____________________
Pumped hydro 75 0.27/100 m low 5,000-20,000 37 existing in U.S. Compressed gas 70 0 low 250-2,200 1 U.S., 1 German
SMES 90+ 0 high 20 MW high-power apps Batteries 70–84 30-50 0.2-0.4 17-40 most common
Flywheels 90+ 15-30 1-3 0.1-20 kWh US & foreign dev. Ultracapacitors 90+ 2-10 high 0.1-0.5 kWh
high-power dens Technology Future
• For utilities, only pumped hydro has made a significant penetration with approximately 21 GW. • Approximately 150 MW of utility peak-shaving batteries are in service in Japan. • Two 10-MW flow battery systems are under construction – one in the United Kingdom and the other in the United States. • Megawatt-scale power quality systems are cost effective and entering the marketplace today. Source: National Renewable Energy Laboratory. U.S. Climate Change Technology Program. Technology Options: For the Near and Long Term. DOE/PI-0002. November 2003 (draft update, September 2005).
80

Superconducting Power Technology Technology Description
The United States’ ongoing appetite for clean, reliable, and affordable electricity has increased at a rate that seriously threatens to exceed current capacity. Demand is estimated to increase by an average rate of 1.8% per year for the next 20 years, yet investments in transmission and distribution infrastructure have not kept pace with those in generation. Furthermore, a majority of the new gas-fired generation is not optimally sited where existing transmission assets are located. Witnessing the regional outages being experienced throughout the country – and those most recently highlighted in the northeast blackout of August 2003 – the inadequacies of the investment in infrastructure have, in effect, issued a wake-up call for modernizing and expanding grid capacity. High-temperature superconducting (HTS) wires can carry many more times the amount of electricity of ordinary aluminum or copper wires. HTS materials were first discovered in the mid-1980s and are brittle oxide, or ceramic-like materials, that can carry electricity with virtually no resistance losses. Through years of federal research in partnership with companies throughout the nation, technology has developed to bond these HTS materials to various metals, providing the flexibility to fashion these ceramics into wires for use in transmission cables and for coils for power transformers, motors, generators, etc. Superconducting technologies make possible electric power equipment that is half the size of conventional alternatives, with half the energy losses. When HTS equipment becomes pervasive, up to 50% of the energy now lost in transmission and distribution will become available for customer use. HTS also will reduce the impact of power delivery on the environment and is helping create a new high-tech industry to help meet industry challenges due to delays in electric utility restructuring. Other benefits of superconducting electric power systems include improved grid stability, reliability, power quality, and deferred generation expansion. Affordability of capacity expansion is also enhanced, because underground superconducting cables require only 10% of the rights-of-way of conventional overhead transmission; and because HTS cables may be installed in conventional underground ducts without extensive street excavation. System Concepts • HTS cables have almost no resistance losses and can transport three-five times as much power as a conventional cable in the same size conduit. • HTS power transformers have about 30% reduction in total losses, can be 50% smaller and lighter than conventional units, may have a total ownership cost that is about 20% lower, are nonflammable, and do not contain oil or any other potential pollutant. In addition, there are electrical performance benefits associated with current limiting capacity and reduced impedance that will yield cost savings to power companies. • HTS Fault Current Limiters can provide power companies with surge protection within the transmission and distribution system. They are reusable, require minimal maintenance, and do not need replacement after being activated. • HTS motors rated at more than 750 kW would save enough energy over their lifetime to pay for the motor. Replacement of all U.S. motors greater than 750-kW with HTS motors would save consumers $2 billion per year in electricity costs. The motors are 50% smaller and lighter than conventional motors, as well.
Source: American Superconductor
81

• HTS generators with more than 100 MVA output will be more energy efficient, compact, and lighter than the conventional generator. The generator has characteristics that may help stabilize the transmission grid. System Components • HTS cables consist of large numbers of wires containing HTS materials operating at 65-77 K, insulated thermally and electrically from the environment. A cryogenic refrigerating system maintains the temperature of the cable at the desired operating temperature, regardless of the load on the cable. • HTS transformers use the same types of HTS materials as cables, formed into coils and mounted on conventional transformer cores. Electrical insulation is accomplished by means other than conventional oil-and-paper, and typically involves a combination of solid materials, liquid cryogens, and vacuum. HTS transformers may be overloaded for periods of time without loss of transformer life. • HTS motors, generators, magnetic separators, and current limiters use HTS wires and tapes in a coil form. Rotating cryogenic seals provide cooling for the rotating machines. • HTS flywheel systems use nearly frictionless bearings made from superconducting “discs,” cooled below the transition temperature of the HTS materials.
Technology Applications • HTS wires: First generation “BSCCO” wires are available today in kilometer lengths at about $200/kA-m. Prototype, pre-commercial, second-generation “coated conductors” have been made in 100 m lengths by industry and are to be scaled up in 2006-2008 to 1,000-m lengths. The 100-m tapes carry approximately 100 amperes of current in nitrogen. • HTS cables: Under the DOE Superconductivity Partnership with Industry (SPI), a team led by Southwire Company has installed and successfully tested a 30-m prototype cable that has been powering three manufacturing plants in Carrollton, Georgia, since February 2000. Three new HTS cable demonstration projects are underway with partial DOE funding from the SPI for 2006. A 600-m cable to be operated at 138-kV will be installed on Long Island, New York; and a 350-m distribution cable is installed in downtown Albany, New York. A section of the 350-m cable will also be manufactured using second-generation “coated conductors.” A 200-m HTS distribution cable carrying 3,000 amperes is installed at a suburban substation in Columbus, Ohio. • HTS transformers: Waukesha Electric Systems, with partial DOE funding, demonstrated a 1-MVA single-phase prototype transformer in 1999 and is leading a team developing technology needed for electrical insulation that would be used for a pre-commercial, three-phase prototype transformer. • HTS motors: Rockwell Automation successfully demonstrated a prototype 750-kW motor in 2000 and is researching motor components with improved performance characteristics.
Current Status • The development at the national laboratories of ion-beam assisted deposition and rolling-assisted, biaxially textured substrate (RABiTSTM) technologies for producing high-performance HTS film conductors suitable for cables and transformers, and the involvement of four unique industry-led teams to capitalize on it, was a major success story for FY 1997. • The world’s first HTS cable to power industrial plants exceeded 28,000 hours of trouble-free operation in Carrollton, Georgia, (Southwire Company) in early 2005, and is the world’s longest-running superconducting cable. The 30-m cable system has been operating unattended since June 2001. Short lengths of coated conductors made under stringent laboratory conditions exceeded the DOE goal of 1,000 A/cm width. • SuperPower verified greater than 80% current limiting performance of proof-of-concept Fault Current Limiter at up to 8,660 volts. • Rockwell Automation demonstrated a prototype 1000-HP synchronous motor that exceeded design specifications by 60%, and is now designing a motor that would use second-generation coated conductors with enhanced performance-to-cost ratio for the industrial marketplace.
82

Technology History • In 1911, after technology allowed liquid helium to be produced, Dutch physicist Heike Kammerlingh Onnes found that at 4.2 K, the electrical resistance of mercury decreased to almost zero. This marked the first discovery of superconducting materials. • Until 1986, superconductivity applications were highly limited due to the high cost of cooling to such low temperatures, which resulted in costs higher than the benefits of using the new technology. In 1986, two IBM scientists, J. George Bednorz and Karl Müller achieved superconductivity on lanthanum copper oxides doped with barium or strontium at temperatures as high as 38 K. • In 1987, the compound Y1Ba2Cu3O7 (YBCO) was given considerable attention, as it possessed the highest critical temperature at that time, at 93 K. In the following years, other copper oxide variations were found, such as bismuth lead strontium calcium copper oxide (110 K), and thallium barium calcium copper oxide (125 K). • In 1990, the first (dc) HTS motor was demonstrated. • In 1992, a 1-meter-long HTS cable was demonstrated. • By 1996, a 200-horsepower HTS motor was tested and exceeded its design goals by 60%. A Pirelli Cable team installed a 120m HTS cable in Detroit, Michigan under the DOE Superconductivity Partnership Initiative. Since February 2000, Southwire’s 30m prototype cable has been powering three manufacturing plants in Carrollton, Georgia. • HTS transformers have seen increased interest, as Waukesha Electric Systems demonstrated a 1MVA prototype transformer in 1999. This team is also leading the development of a 5/10-MVA, 26.4kV/4.2-kV three-phase prototype. • A 750 kW HTS motor was demonstrated by Rockwell Automation. This team is now (in 2006) researching motor components.
Technology Future High-temperature superconducting cables and equipment: Commercialization and market introduction requires development of inexpensive wires for transmission and distribution, and end uses such as electric motors. These wires are now under development under a government-industry partnership but are still years from wide-scale use. In addition, there is an international race underway to develop and deploy the new second-generation coated conductors. Numerous companies in Europe, Japan, Korea and China are pursuing the technologies first demonstrated by the national labs. Using high-temperature superconductivity wires to replace existing electric wires and cables may be analogous to the market penetration that occurred when the United States moved from copper wire to fiber optics in communications. Some pre-commercial demonstrations using commercial BSCCO wires are underway, but the Superconductivity Partnerships with Industry and the Second-Generation Wire Initiative could be expanded to include additional U.S. companies. The Power Delivery Research Initiative, authorized in the 2005 Energy Policy Act, would help enable broad utility involvement in the technology.
Source: National Renewable Energy Laboratory. U.S. Climate Change Technology Program. Technology Options: For the Near and Long Term. DOE/PI-0002. November 2003 (draft update, September 2005).
83

Superconducting Power Technology
Market Data
Source: Oak Ridge National Laboratory - High Temperature Superconductivity: The Products and Projected Market for HTS devices Their Benefits, 2002 Edition, Total Market Benefits, p 40. (Thousands of Dollars)
2004 2006 2008 2010 2012 2014 2016 2018 2020
Motors 0 0 27.29 169.24 527.03 1310.49 3103.37 6360.31 11322.83 Transformers 0 3.8 14.22 37.47 90.63 197.73 371.87 605.23 877.71 Generators 0 0 0 4.09 15.56 41.12 101.16 224.26 426.61 Cables 0 0.17 0.59 1.44 2.81 4.86 7.7 11.21 15.17 Total 0 3.97 42.1 212.24 636.03 1554.2 3584.1 7201.01 12642.32 The report assumes electrical generation and equipment market growth averaging 2.5% per year through 2020. This number was chosen based on historic figures (the past fifteen years) and the assumption that electric demand will drive electric supply.
Source: Analysis of Future Prices and Markets for High-Temperature Superconductors, September Projected Market for HTS devices 2001, DOE. (Thousands of Dollars)
2011 2013 2015 2017 2019 2021 2023 2025
Motors 225 956 4,025 15,399 50,968 108,429 148,770 164,072 Transformers 0 0 243 1,451 9,353 56,081 222,277 390,964 Generators 6,926 24,710 83,634 227,535 445,693 592,904 656,499 675,656 Cables 4,117 14,405 48,335 135,001 318,844 488,783 570,326 586,284 Total 11,270 40,071 136,236 379,386 824,857 1,246,196 1,597,872 1,816,975
84

Technology Performance
Source: Oak Ridge National Laboratory – High-Temperature Superconductivity: The Products and HTS Energy Savings Their Benefits, 2002 Edition, Tables M-2, T-1, G-1, C-2 (GWh)
2004 2006 2008 2010 2012 2014 2016 2018 2020
Motors 0 0 0.4 3 8 21 48 98 172 Transformers 0 0.1 0.2 1 1 3 6 9 14 Generators 0 0 0 0.1 0.2 1 2 3 6 Cables 0 3 18 56 133 270 488 806 1,236 Total 0 4 19 60 143 294 544 916 1,428
Source: Analysis of Future Prices and Markets for High-Temperature Superconductors, September HTS Energy Savings 2001, DOE. (GWh)
2009 2011 2013 2015 2017 2019 2021 2023 2025
Motors 0 0 1 4 15 57 154 300 468 Transformers 0 0 0 0 2 15 94 449 1,194 Generators 2 11 44 171 556 1,417 2,699 4,196 5,785 Cables 1 3 13 55 196 598 1,336 2,289 3,326 Total 3 14 58 231 769 2,086 4,283 7,235 10,774
85

Thermally Activated Technologies Technology Description
• Thermally activated heat pumps can revolutionize the way residential and commercial buildings are heated and cooled. This technology enables highly efficient heat pump cycles to replace the best natural gas furnaces, reducing energy use as much as 50%. Heat pumps take in heat at a lower temperature and release it a higher one, with a reversing valve that allows the heat pump to provide space heating or cooling as necessary. In the heating mode, heat is taken from outside air when the refrigerant evaporates and is delivered to the building interior when it condenses. In the cooling mode, the function of the two heat-exchanger coils is reversed, so heat moves inside to outside. • Absorption chillers provide cooling to buildings by using heat. Unlike conventional electric chillers, which use mechanical energy in a vapor-compression process to provide refrigeration, absorption chillers primarily use heat energy with limited mechanical energy for pumping. The chiller transfers thermal energy from the heat source to the heat sink through an absorbent fluid and a refrigerant. The chiller achieves its refrigerative effect by absorbing and then releasing water vapor into and out of a lithium bromide solution. In the process, heat is applied at the generator and water vapor is driven off to a condenser. The cooled water vapor then passes through an expansion valve, reducing the pressure. The low-pressure water vapor then enters an evaporator, where ambient heat is added from a load and the actual cooling takes place. The heated, low-pressure vapor returns to the absorber, where it recombines with lithium bromide and becomes a low-pressure liquid. This low-pressure solution is pumped to a higher pressure and into the generator to repeat the process. • Desiccant equipment is useful for mitigation of indoor air-quality problems and for improved humidity control in buildings. The desiccant is usually formed in a wheel made up of lightweight honeycomb or corrugated material (see figure). Commercially available desiccants include silica gel, activated alumina, natural and synthetic zeolites, lithium chloride, and synthetic polymers. The wheel is rotated through supply air, usually from the outside, and the material naturally attracts the moisture from the air before it is routed to the building. The desiccant is then regenerated using thermal energy from natural gas, the sun, or waste heat.
Technology Applications • Thermally activated heat pumps are a new generation of advanced absorption cycle heat pumps that can efficiently condition residential and commercial space. Different heat pumps will be best suited for different applications. For example, the GAX heat pump is targeted for northern states because of its superior heating performance; and the Hi-Cool heat pump targets the South, where cooling is a priority. • Absorption chillers can change a building’s thermal and electric profile by shifting the cooling from an electric load to a thermal load. This shift can be very important for facilities with time-of-day
Thermally Activated Technologies (TATs), such as heat pumps, absorption chillers, and desiccant units, provide on-site space conditioning and water heating, which greatly reduce the electric load of a residential or commercial facility. These technologies can greatly contribute to system reliability. System Concepts • TATs may be powered by natural gas, fuel oil, propane, or biogas, avoiding substantial energy conversion losses associated with electric power transmission, distribution, and generation. • These technologies may use the waste heat from on-site power generation and provide total energy solutions for onsite cooling, heating, and power. Representative Technologies
86

electrical rates, high cooling-season rates, and high demand charges. Facilities with high thermal loads, such as data centers, grocery stores, and casinos, are promising markets for absorption chillers. • Desiccant technology can either supplement a conventional air-conditioning system or act as a standalone operation. A desiccant can remove moisture, odors, and pollutants for a healthier and more comfortable indoor environment. Facilities with stringent indoor air-quality needs (schools, hospitals, grocery stores, hotels) have adapted desiccant technology. • CHP applications are well suited for TATs. They offer a source of “free” fuel in the form of waste heat that can power heat pumps and absorption chillers, and regenerate desiccant units.
Current Status • Thermally activated heat pump technology can replace the best natural gas furnace and reduce energy use by as much as 50%, while also providing gas-fired technology. • Desiccant technology may be used in pharmaceutical manufacturing to extend the shelf life of products; refrigerated warehouses to prevent water vapor from forming on the walls, floors, and ceilings; operating rooms to remove moisture form the air, keeping duct work and sterile surfaces dry; and hotels, to prevent buildup of mold and mildew.
Technology History • In the 1930s, the concept of dehumidifying air by scrubbing it with lithium chloride was introduced, paving the way for development of the first desiccant unit. • In 1970, Trane introduced a mass-produced, steam-fired, double-effect LiBr/H2O absorption chiller. • In 1987, the National Appliance Energy Conversion Act instituted minimum efficiency standards for central air-conditioners and heat pumps.
Technology Future • Expand the residential market of the second-generation Hi-Cool residential absorption heat pump technology to include markets in southern states; the targeted 30% improvement in cooling performance can only be achieved with major new advancements in absorption technology or with an engine-driven system. • Work in parallel with the first-generation GAX effort to determine the most attractive second-generation Hi-Cool technology. • Fabricate and test the 8-ton advanced cycle VX GAX ammonia/water heat pump. • Fabricate and test the 3-ton complex compound heat pump and chiller. • Develop, test, and market an advanced Double Condenser Coupled commercial chiller, which is expected to be 50% more efficient than conventional chillers. • Assess new equipment designs and concepts for desiccants using diagnostic techniques, such as infrared thermal performance mapping and advanced tracer gas-leak detection.
87

88

3.1 – States with Competitive Electricity Markets Purple-colored states (Figure 3.1.1) are active in the restructuring process, and these states have either enacted enabling legislation or issued a regulatory order to implement retail access. Retail access is either currently available to all or some customers. Those states are Arizona, Connecticut, Delaware, District of Columbia, Illinois, Maine,Maryland, Massachusetts, Michigan, New Hampshire, New Jersey, New York, Ohio, Oregon, Pennsylvania, Rhode Island, Texas, and Virginia. In Oregon, the law allows nonresidential customers retail access.
A green-colored state signifies a delay in the restructuring process or the implementation of retail access. Those states are Arkansas, Montana, Nevada, New Mexico, and Oklahoma.
California is the only blue-colored state, because direct retail access has been suspended.
Source: U.S. DOE, Energy Information Administration, last updated February 2003.
Figure 3.1.1: Status of Restructuring of State Electricity Markets
89

3.2 – States with System Benefit Charges (SBC) A System Benefit Charge (SBC) is a small fee added to a customer’s electricity bill usedto fund programs that benefit the public, such as low-income energy assistance, energyefficiency, and renewable energy. There are 15 states with SBCs (Table 3.2.1) through which a portion of the money will be used to support renewable resources. Together, these states will collect about $4 billion (Figure 3.2.1) in funds to support renewable resources between 1998 and 2017.
Shttp://www.ucsusa.org/clean_energy/clean_energy_p
Cumulative 1998-2017
$114mil
RI: $30 milMA: $494 mil
CT: $248 milNJ: $286 mil.
$89 mil$67 mil.
$21 mil
$200 mil
$2,048 mil
$95 mil.$14 mil
$234 mil. • 15 state funds = $4 billion by 2017
DE: $18 mil.$25 mil.
ource: Union of Concerned Scientists, June 2004 olicies/state-clean-energy-maps-and-graphs.html
Figure 3.2.1: State System Benefit Funds
90
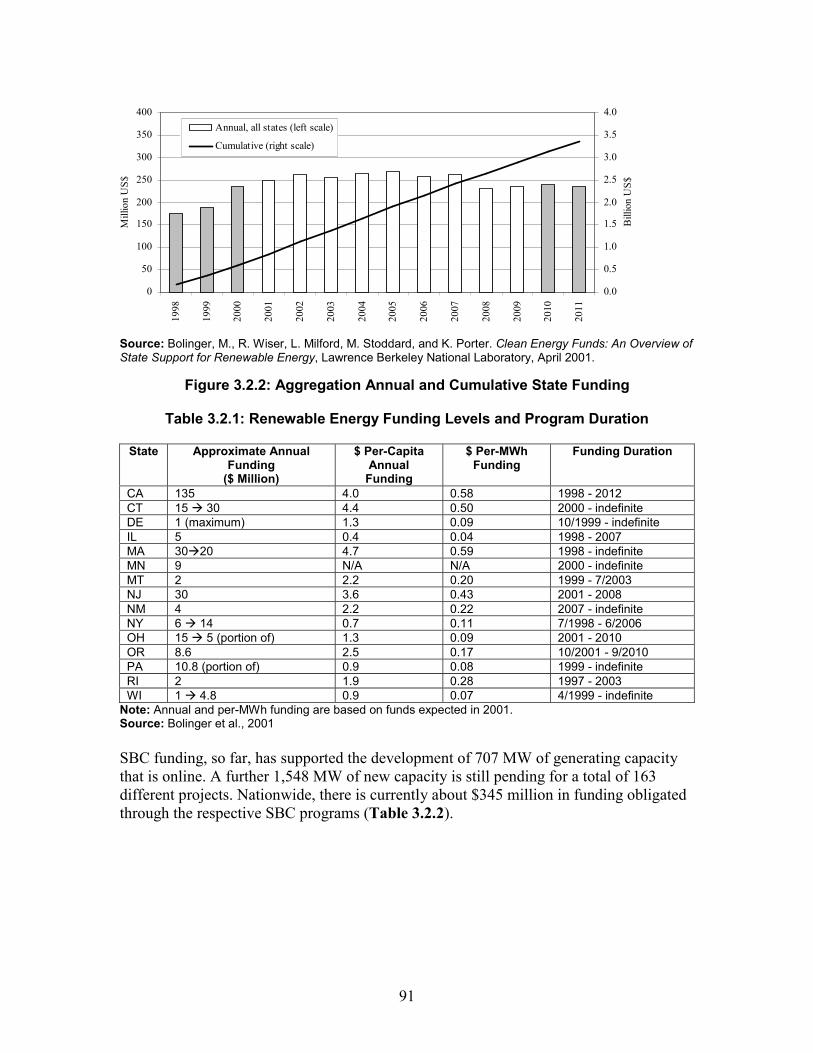
Source: Bolinger, M., R. Wiser, L. Milford, M. Stoddard, and K. Porter. Clean Energy Funds: An Overview of State Support for Renewable Energy, Lawrence Berkeley National Laboratory, April 2001.
Figure 3.2.2: Aggregation Annual and Cumulative State Funding
Table 3.2.1: Renewable Energy Funding Levels and Program Duration
State Approximate Annual Funding
($ Million)
$ Per-Capita Annual
Funding
$ Per-MWh Funding
Funding Duration
CA 135 4.0 0.58 1998 - 2012 CT 15 Æ 30 4.4 0.50 2000 - indefinite DE 1 (maximum) 1.3 0.09 10/1999 - indefinite IL 5 0.4 0.04 1998 - 2007MA 30Æ20 4.7 0.59 1998 - indefinite MN 9 N/A N/A 2000 - indefinite MT 2 2.2 0.20 1999 - 7/2003 NJ 30 3.6 0.43 2001 - 2008NM 4 2.2 0.22 2007 - indefinite NY 6Æ 14 0.7 0.11 7/1998 - 6/2006 OH 15 Æ 5 (portion of) 1.3 0.09 2001 - 2010OR 8.6 2.5 0.17 10/2001 - 9/2010 PA 10.8 (portion of) 0.9 0.08 1999 - indefinite RI 2 1.9 0.28 1997 - 2003WI 1Æ 4.8 0.9 0.07 4/1999 - indefinite
Note: Annual and per-MWh funding are based on funds expected in 2001. Source: Bolinger et al., 2001
SBC funding, so far, has supported the development of 707 MW of generating capacitythat is online. A further 1,548 MW of new capacity is still pending for a total of 163 different projects. Nationwide, there is currently about $345 million in funding obligated through the respective SBC programs (Table 3.2.2).
0
50
100
150
200
250
300
350
400
1998
1999
2000
2001
2002
2003
2004
2005
2006
2007
2008
2009
2010
2011
Mill
ion
US$
0.0
0.5
1.0
1.5
2.0
2.5
3.0
3.5
4.0
Bill
ion
US$
Annual, all states (left scale)
Cumulative (right scale)
91

Table 3.2.2: State SBC Funding for Utility-Scale Renewable Projects(as of September 2004)
Project Location
# of Projects
Original Dollars
Obligated ($)
Current Dollars
Obligated ($)
CapacityObligated
(MW)
CapacityCancelled
(MW)
CapacityPending
(MW)
CapacityOn-Line
(MW) CA 60 $243,573,376 $193,019,993 1,285.3 30.6 830.1 424.5 IL 4 $9,305,000 $9,305,000 101.6 0.0 51.2 50.4 MA 4 $19,469,093 $19,469,093 49.6 0.0 49.6 0.0 MN 68 $61,841,977 $61,841,977 124.9 1.7 91.7 31.5 NH* 1 $2,378,930 $2,378,930 50.0 0.0 50.0 0.0 NJ 5 $14,590,000 $14,590,000 41.1 0.0 41.4 0.0 NY 12 $26,560,000 $26,560,000 325.2 0.0 283.6 41.6 OR 1 $3,800,000 $3,800,000 41.0 0.0 0.0 41.0 PA 8 $17,600,000 $14,000,000 269.6 0.0 151.1 118.5 Total 163 $399,118,376 $344,964,993 2,288.1 32.3 1,548.4 707.4 *New Hampshire does not currently have a clean energy fund. The single project located in New Hampshireis receiving support from Massachusetts’ clean energy fund. Source: Bolinger, M., R. Wiser, and G. Fitzgerald, 2004. The Impact of State Clean Energy Fund Supportfor Utility-Scale Renewable Energy Projects. Prepared by Lawrence Berkeley National Laboratory and theClean Energy States Alliance, October. http://www.cleanenergystates.org/CaseStudies/LBNL-56422_Utility-Scale_Renewables.pdf
Of the 163 projects announced, the vast majority – both in terms of number of projects and generating capacity – are wind power projects (Table 3.2.3). In descending order of capacity are geothermal, landfill gas, biomass, hydropower, waste tire, and digester gas.
Table 3.2.3: Support for Utility-Scale Renewable Projects by Resource Type (as of September 2004)
Resource Type
# of Projects
Original Dollars
Obligated ($)
Current Dollars
Obligated ($)
CapacityObligated
(MW)
CapacityCancelled
(MW)
CapacityPending
(MW)
CapacityOn-Line
(MW) Biomass 8 $15,406,770 $11,466,832 85.2 9.5 64.4 11.3 Digester Gas
3 $4,108,210 $4,108,210 6.0 0.0 3.9 2.1
Geothermal 4 $80,331,618 $80,331,618 156.9 0.0 97.9 59.0 Hydro 7 $12,977,258 $11,787,988 45.7 0.0 14.5 31.3 Landfill Gas 28 $38,108,552 $31,098,469 90.7 19.8 35.1 35.8 Waste Tire 1 $7,232,413 $3,287,461 30.0 0.0 30.0 0.0 Wind 112 $240,953,555 $202,884,417 1,873.60 3.0 1,302.6 568.0 Total 163 $399,118,376 $344,964,993 2,288.1 32.3 1,548.4 707.4 Source: Bolinger, M., R. Wiser, and G. Fitzgerald, 2004. The Impact of State Clean Energy Fund Supportfor Utility-Scale Renewable Energy Projects. Prepared by Lawrence Berkeley National Laboratory and theClean Energy States Alliance, October. http://www.cleanenergystates.org/CaseStudies/LBNL-56422_Utility-Scale_Renewables.pdf
92

3.3 – States with Renewable Portfolio Standards (RPS) A Renewable Portfolio Standard (RPS) is a policy that obligates a retail electricitysupplier to include renewable resources in its electricity-generation portfolio. Retail suppliers can meet the obligation by constructing or owning eligible renewable resources or purchasing the power from eligible generators. To date, 20 states plus Washington, D.C., have adopted RPS policies (Table 3.3.1) or renewable purchase obligations (Figure 3.3.1), while several other states have adopted nonbonding renewable energygoals (Table 3.3.2). In addition, a number of states have increased their renewable energystandards in recent years. In conjunction with system benefits funds, RPS policies are expected to lead to the development of more than 29,000 MW of new renewable energycapacity by 2017 (Figure 3.3.2).
S
Obligations by State
Nevada: 20% by 2015
Hawaii: 20% by 2020
Texas:5% by 2015
California: 20% by 2017
Colorado: 10% by 2015
New Mexico:10% by 2011
Arizona:1.1% by 2007
Iowa: 2% by 1999Minnesota: 19% by 2015*
Wisconsin:2.2% by 2011
New York:25% by 2013
Maine:30% by 2000
MA:4% by 2009
CT: 10% by 2010
RI:16% by 2019
PA: 8% by 2020
NJ: 6.5% by 2008
MD: 7.5% by 2019
*Includes requirements adopted in 1994 and 2003 for one utility, Xcel Energy.
DC: 11% by 2022
DE: 10% by 2019
Montana: 15% by 2015
ource: NREL/Union of Concerned Scientists, October 2005
Figure 3.3.1: Renewable Portfolio Standards and Renewables Purchase
93

Table 3.3.1: State Renewable Portfolio Standards and Purchase Requirements State Purchase
Requirements Eligible Resources Credit Trading Penalties
AZ 15% by 2015 (of this 30% must be customer sited)
PV and solar thermal electric,R&D, solar hot water, and in-state landfill gas, wind, andbiomass.
No central credit trading system
Under consideration
CA Investor-owned utilities must add minimum 1% annually to 20% by2017.
Biomass, solar thermal,photovoltaic, wind, geothermal, existing hydro < 30MW, fuel cells using renewable fuels, digester gas,landfill gas, ocean energy.
WREGIS systemunder development
At discretion of CPUC
CO 10% by 2015 Photovoltaics, Landfill Gas, Wind, Biomass, GeothermalElectric, Anaerobic Digestion, Small Hydroelectric, Fuel Cells(Renewable Fuels)
WREGIS systemunder development
To be determined
CT 3% Class I or IITechnologies by Jan 1,2004
Class I 1% Jan 1, 2004 increasing to 1.5% by2005, 2% by 2006,3.5% by 2007, 5% by2008, 6% by 2009, and7% by Jan 1, 2010
Class I: solar, wind, newsustainable biomass, landfill gas, fuel cells, ocean thermal, wave, tidal, advanced renewableenergy conversion technologies, new run of river hydro (<5 MW). Class II: licensed hydro, MSW,and other biomass.
Yes. Using NEPOOLGeneration Information System.
Penalty of5.5¢/kWhpaid to the Renewable EnergyInvestment Fund for the developmentof Class Irenewables
DE 10% by 2019 Solar Thermal Electric,Photovoltaics, Landfill Gas, Wind, Biomass, Hydroelectric,Geothermal Electric, Anaerobic Digestion, Tidal Energy, WaveEnergy, Ocean Thermal, Fuel Cells (Renewable Fuels)
Yes. GATS Penalty of2.5¢/kWh(increases to5¢/kWh formulti-year noncompliance)
DC 11% by 2022 (0.386% solar)
Solar Thermal Electric,Photovoltaics, Landfill Gas, Wind, Biomass, Hydroelectric,Geothermal Electric, MunicipalSolid Waste, Cofiring, TidalEnergy, Wave Energy, Ocean Thermal
Yes. GATS. Electric deliveryrequirement to PJM
Penalty of2.5¢/kWh fortier 1 resources, 1¢/kWh fortier II, and30¢/kWh for PV
HI 8% by end of 2005, 10% by 2010, 15% by2015 and 20% by 2020
Wind, solar, hydropower, biomass including landfill gas, waste to energy, and fuelsderived from organic sources, geothermal, ocean energy, fuelcells using hydrogen fromrenewables
No Unspecified;standard to be revisited if utilities can not meet it incost-effective manner
IA Investor-owned utilities to purchase 105 MW(~2% of 1999 sales)
Solar, wind, methane recovery, and biomass
No Unspecified
ME 30% of retail sales in 2000 and thereafter.PUC will revisit within 5 years.
Fuel cells, tidal, solar, wind, geothermal, hydro, biomass, and MSW (< 100MW); high efficiencycogeneration. Self-generation isnot eligible. Resource supplyunder this definition exceeds RPS requirement.
Yes. NEPOOLGeneration Information System.
Possiblesanctions atdiscretion ofPUC
94

State Purchase Requirements
Eligible Resources Credit Trading Penalties
MD 3.5% by 2006 with 1% from Tier 1 sources, Tier 1 increasing by 1% every other year from 2007 to 2018, Tier II remains at 2.5%, 7.5%total by 2019 and in subsequent years
Tier 1: solar, wind, geothermal,qualifying biomass, small hydropower (<30MW), and landfill methane Tier II: existing large hydropower, poultry litter incineration, existing waste to energy
Yes AlternativeCompliancefee of 2¢/kWh forTier 1 and 1.5¢/kWh forTier 2 paidto Maryland Renewable Energy Fund
MA 1% of sales to end-use customers from newrenewables in 2003, +0.5%/yr to 4% in 2009 1%/yr increase thereafter until determined by Division of Energy Resources
New renewables placed into commercial operation after 1997, including solar, wind, ocean thermal, wave, tidal, fuel cellsusing renewable fuels, landfill gas, and low-emission advanced biomass. Excess production from existing generators over historical baseline eligible.
Yes. Using NEPOOLGeneration Information System.
Entities maycomply bypaying 5¢/kWh.Non-complying retailersmust submit a compliance plan.Revocationor suspensionof license is possible.
MN (Not true RPS) Applies to Xcel Energy only:425 MW wind by 2002 and 110 MW biomass. Additional 400 MW windby 2006 and 300 MWby 2010
Wind, biomass. No, other than standard regulatoryoversight.
No
MT 5% in 2008; 10% in 2010; 15% in 2015
Solar Thermal Electric,Photovoltaics, Landfill Gas, Wind, Biomass, Hydroelectric,Geothermal Electric, Anaerobic Digestion, Fuel Cells (Renewable Fuels)
Yes. Electricitymust be delivered to MT.
Penalty of1¢/kWhgoes to universallow-incomeenergyassistance fund.
NV 6% in 2005, rising to20% by 2015. Minimum 5% must come from solar.
Solar, wind, geothermal, & biomass (includes agricultural waste, wood, MSW, animalwaste and aquatic plants).Distributed resources receivesextra credit (1.15).
Yes. Financial penalties may be applied for noncompliance.
NJ Class I or II: 2.5% by2008
Class I: 4% by 2008, with solar requirement of 0.16% retail sales (90MW)Goal of 20% by 2020.
Class I.: Solar, PV, wind, fuel cells, geothermal, wave, tidal, landfill methane, and sustainable biomass.
Class II: hydro <30 MW andMSW facilities that meet airpollution requirements.
Yes. GATS. Alternative CompliancePayment of 5¢/kWh,30¢/kWh for solar.
NM 5% of retail sales by2006. Increase by 1%/yr to 10% by January 1,
Solar, wind, hydro (<=5 MW),biomass, geothermal, and fuelcells. 1 kWh solar = 3kWh; 1
Yes. RECs valid for 4 years from dateof issuance.
At discretion of PUC.
95

State Purchase Requirements
Eligible Resources Credit Trading Penalties
2011 and thereafter. kWh biomass, geothermal, landfill gas, or fuel cells =2 kWh toward compliance
NY 25% by 2013; 1% voluntary standard; 2% of total incremental RPS requirement (7.71%) is set-aside for customer-sited
Photovoltaics, Landfill Gas, Wind, Biomass, Hydroelectric,Fuel Cells, CHP/Cogeneration,Biogas, Liquid Biofuel, Anaerobic Digestion, Tidal Energy, WaveEnergy, Ocean Thermal
Possibly. Electricitymust be delivered to NY.
Unspecified.
PA 18% by 2020; 8% Tier 1and 10% Tier II
Solar set-aside of 0.5%by 2020
Solar Water Heat, Solar Space Heat, Solar Thermal Electric, Solar Thermal Process Heat, Photovoltaics, Landfill Gas, Wind, Biomass, Hydroelectric,Geothermal Electric, Fuel Cells, Municipal Solid Waste, CHP/Cogeneration, Waste Coal, Coal Mine Methane, CoalGasification, Anaerobic Digestion, Other DistributedGeneration Technologies
Yes. GATS Penalty of4.5¢/kWh, for solar penalty is 200% of PV REC value.
RI 16% by 2020; 3% by2003, increasing 0.5% annually 2008-2010, increasing 1% annually2011-2014, increasing 1.5% annually 2015-2019
Solar, wind, eligible biomass, including co-firing, geothermal,small hydropower, ocean, fuelcells using hydrogen derivedfrom renewables
Yes. NEPOOLGeneration Information System.
Penalty of5¢/kWh can be made to Renewable EnergyDevelopment Fund
TX 5880 MW by 2015 (5000 MW new)
Target of at least 500 MW from renewablesother than wind
Solar, wind, geothermal, hydro,wave, tidal, biomass, includinglandfill gas. New (operational after Sept. 1, 1999) or small(<2MW) facilities eligible.
Yes. ERCOT REC Trading System.
Lesser of5¢/kWh or 200% of average market value of renewableenergycredits.
WI 0.5% by 2001 increasing to 2.2% by2011 (0.6% can comefrom facilities installedprior to 1998).
Wind, solar, biomass,geothermal, tidal, fuel cells thatuse renewable fuel, & hydro under 60 MW. Eligibility may be extended by PUC.
Yes. Utilities with excess RECs can trade or bank them.
Penalty of$5,000-$500,000 is allowed inlegislation.
Source: Table updated by NREL, March 2006. Derived from table in Wiser, R. Porter, K., Grace, R., Kappel, C. Creating Geothermal Markets: Evaluating Experience with State Renewables Portfolio Standards, report prepared for the National Geothermal Collaborative, 2003.
96

Table 3.3.2: State Renewable Energy Goals (Nonbinding)State Purchase Requirements Eligible Resources
Illinois 8% by 2013 (75% wind) Solar Water Heat, Solar Thermal Electric, Photovoltaics, Landfill Gas, Wind, Biomass,Hydroelectric, CHP/Cogeneration, "Other Such Alternative Sources of EnvironmentallyPreferable Energy"
Minnesota 1% by 2005 increasing by at least 1%/year to 10% by 2015
Wind, solar, hydro (<60 MW), and biomass
Vermont Meet growth in electricity demand from2005-2013 with renewable energysources (becomes mandatory in 2013 ifnot met).
Solar Thermal Electric, Photovoltaics, Landfill Gas, Wind, Biomass, Hydroelectric, Anaerobic Digestion, Fuel Cells (Renewable Fuels)
Source: NREL, March 2006.
Nationwide the RPS requirements for renewable energy are estimated to total 2,335 MWof generating capacity. The vast majority (93.5%) is wind power, followed by biomass (2.3%), landfill gas (2.3%), hydropower (1.3%), solar energy (0.4%), and other (0.3%). The five largest states in terms of capacity are Texas, Minnesota, Iowa, California, and Wisconsin.
Table 3.3.3 Estimated Renewable Energy Capacity Satisfying RPS Requirements Through 2003 (Megawatts, Nameplate Capacity)
State Biomass Hydro LandfillGas
Solar Photovoltaic
s
Wind Other/ Unknown
Total
Arizona 0 0 5 9 0 0 14 California 0 20 6 0 175 0 201 Connecticut 0 0 0 0 0 0 0 Maine 0 0 0 0 0 0 0 Massachusetts 0 0 8 0 1 0 9 Nevada 0 0 0 0 0 0 0 New Jersey 0 0 0 0 0 0 0 New Mexico 0 0 0 0 0 0 0 Wisconsin 0 0 3 0 94 0 97 Iowa 16 0 0 0 237 7 260 Minnesota 25 0 0 0 476 0 501 Texas 5 10 31 0.2 1,140 0 1,186 Wisconsin 7 0 0 0 50 0 57 Hawaii 0 0 0 0 0 0 0 Illinois 0 0 0 0 0 0 0 Minnesota 0 0 0 0 0 0 0 Pennsylvania 0 0 0 0 10 0 10 Total 53 30 53 9.2 2,183 7 2,335 Share of Total 2.3% 1.3% 2.3% 0.4% 93.5% 0.3% 100.0%Source: Petersick, T. 2004. State Renewable Energy Requirements and Goals: Status Through 2003, U.S. DOE Energy Information Administration, July http://www.eia.doe.gov/oiaf/analysispaper/rps/index.html
97
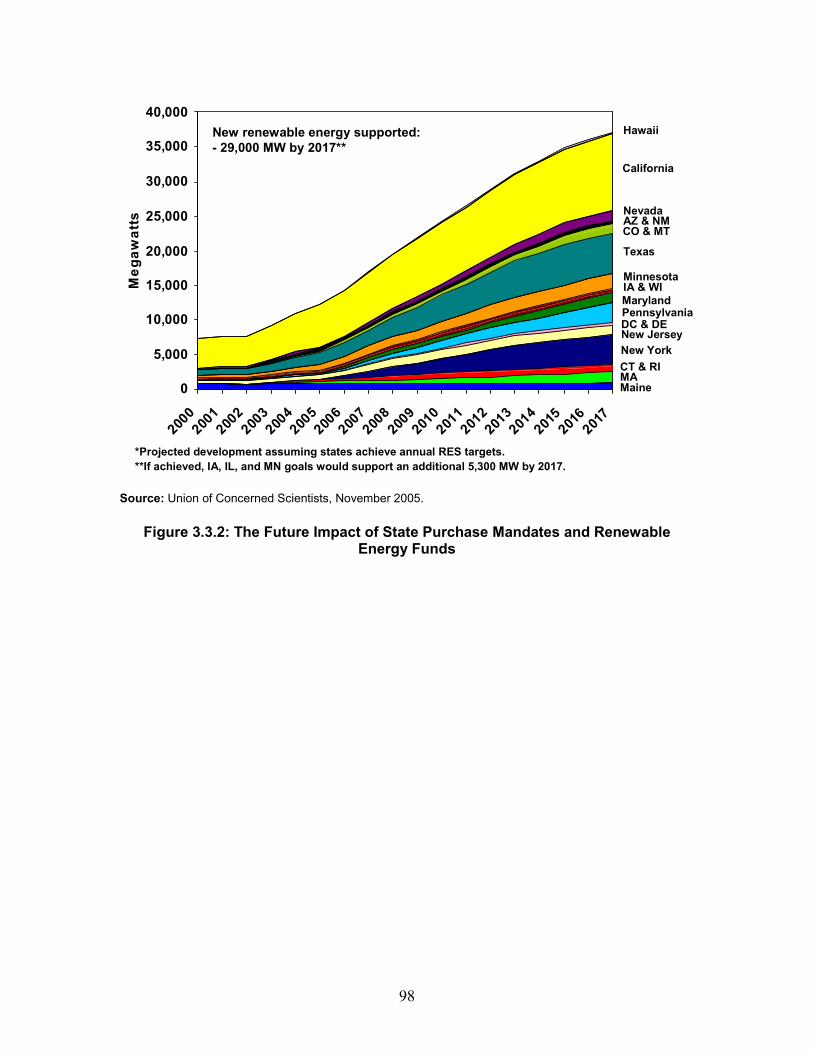
2000200
1200
2200
3200
4200
5200
6200
7200
8200
9201
0201
1201
2201
3201
4201
5201
6201
7
40,000
*Projected development assuming states achieve annual RES targets.**If achieved, IA, IL, and MN goals would support an additional 5,300 MW by 2017.
Source: Union of Concerned Scientists, November 2005.
Figure 3.3.2: The Future Impact of State Purchase Mandates and RenewableEnergy Funds
0
5,000
10,000
15,000
20,000
25,000
30,000
35,000 M
egaw
atts
Hawaii
California
Nevada
IA & WI
New Jersey
CT & RI MA Maine
Minnesota
AZ & NM
New York
Texas
New renewable energy supported: - 29,000 MW by 2017**
Maryland
CO & MT
PennsylvaniaDC & DE
98
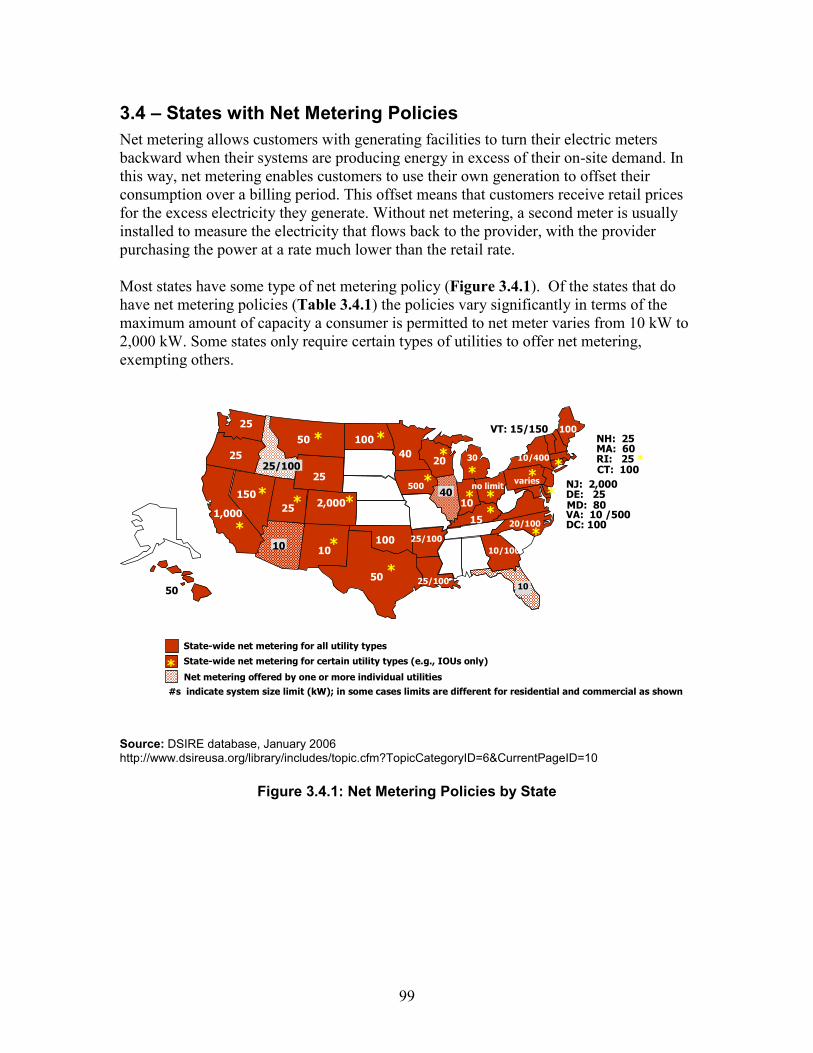
3.4 – States with Net Metering Policies Net metering allows customers with generating facilities to turn their electric metersbackward when their systems are producing energy in excess of their on-site demand. Inthis way, net metering enables customers to use their own generation to offset theirconsumption over a billing period. This offset means that customers receive retail prices for the excess electricity they generate. Without net metering, a second meter is usuallyinstalled to measure the electricity that flows back to the provider, with the provider purchasing the power at a rate much lower than the retail rate.
Most states have some type of net metering policy (Figure 3.4.1). Of the states that do have net metering policies (Table 3.4.1) the policies vary significantly in terms of themaximum amount of capacity a consumer is permitted to net meter varies from 10 kW to 2,000 kW. Some states only require certain types of utilities to offer net metering, exempting others.
Shttp://www.dsireusa.org/library/includes/top
State-wide net metering for certain utility types (e.g., IOUs only)
Net metering offered by one or more individual utilities
25 kW
NH: 25
50 kW
100kW
50
10
10025
1,000
MA: 6025 RI: 25 *
DC: 100
DE: 25
50
100
402025/100
2,00040 150
10/100
25no limit
25/100
25/100
10
500
VT: 15/150
10/400
NJ: 2,000
15
10
100
MD: 8025
50
varies
10
30
* CT: 100
State-wide net metering for all utility types
* *
*
*
**
*
*
*
**
**
**
*#s indicate system size limit (kW); in some cases limits are different for residential and commercial as shown
VA: 10 /500
*
20/100*
ource: DSIRE database, January 2006 ic.cfm?TopicCategoryID=6&CurrentPageID=10
Figure 3.4.1: Net Metering Policies by State
99
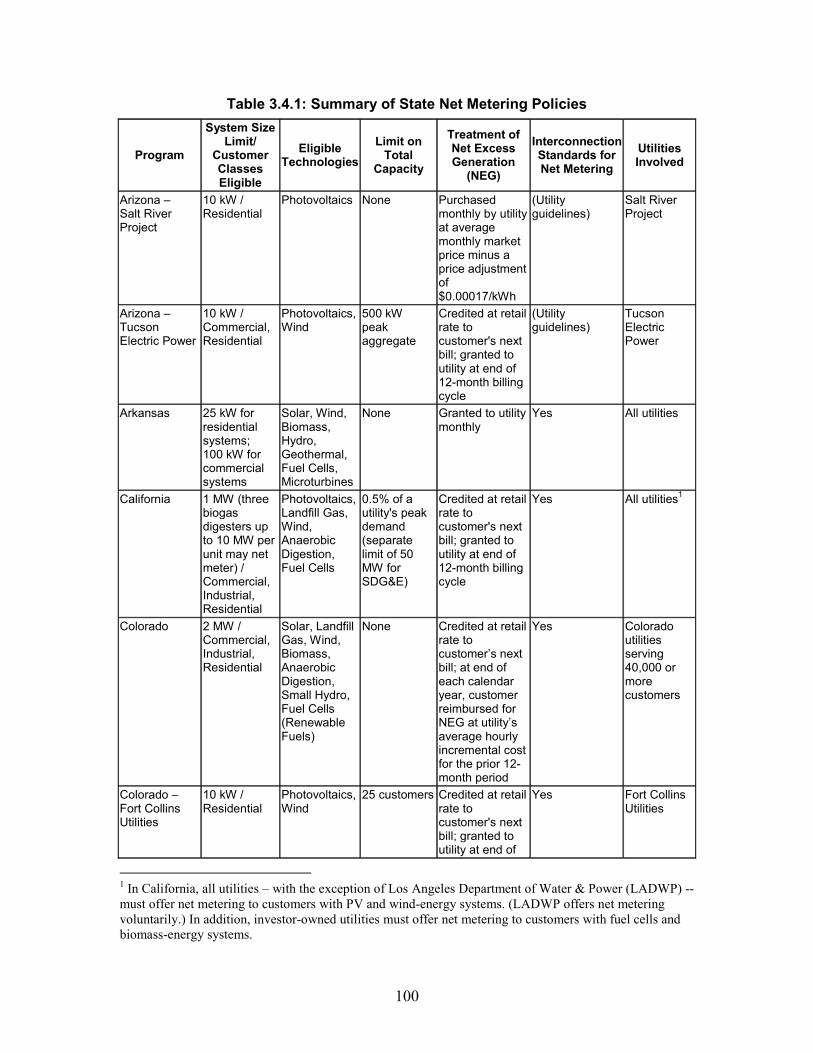
100
Table 3.4.1: Summary of State Net Metering Policies
Program
System Size Limit/
Customer Classes Eligible
Eligible Technologies
Limit on Total
Capacity
Treatment of Net Excess Generation
(NEG)
Interconnection Standards for Net Metering
Utilities Involved
Arizona – Salt River Project
10 kW / Residential
Photovoltaics None Purchased monthly by utility at average monthly market price minus a price adjustment of $0.00017/kWh
(Utility guidelines)
Salt River Project
Arizona – Tucson Electric Power
10 kW / Commercial, Residential
Photovoltaics, Wind
500 kW peak aggregate
Credited at retail rate to customer's next bill; granted to utility at end of 12-month billing cycle
(Utility guidelines)
Tucson Electric Power
Arkansas 25 kW for residential systems; 100 kW for commercial systems
Solar, Wind, Biomass, Hydro, Geothermal, Fuel Cells, Microturbines
None Granted to utility monthly
Yes All utilities
California 1 MW (three biogas digesters up to 10 MW per unit may net meter) / Commercial, Industrial, Residential
Photovoltaics, Landfill Gas, Wind, Anaerobic Digestion, Fuel Cells
0.5% of a utility's peak demand (separate limit of 50 MW for SDG&E)
Credited at retail rate to customer's next bill; granted to utility at end of 12-month billing cycle
Yes All utilities1
Colorado
2 MW / Commercial, Industrial, Residential
Solar, Landfill Gas, Wind, Biomass, Anaerobic Digestion, Small Hydro, Fuel Cells (Renewable Fuels)
None Credited at retail rate to customer’s next bill; at end of each calendar year, customer reimbursed for NEG at utility’s average hourly incremental cost for the prior 12-month period
Yes Colorado utilities serving 40,000 or more customers
Colorado – Fort Collins Utilities
10 kW / Residential
Photovoltaics, Wind
25 customers Credited at retail rate to customer's next bill; granted to utility at end of
Yes Fort Collins Utilities
1 In California, all utilities – with the exception of Los Angeles Department of Water & Power (LADWP) -- must offer net metering to customers with PV and wind-energy systems. (LADWP offers net metering voluntarily.) In addition, investor-owned utilities must offer net metering to customers with fuel cells and biomass-energy systems.

101
Program
System Size Limit/
Customer Classes Eligible
Eligible Technologies
Limit on Total
Capacity
Treatment of Net Excess Generation
(NEG)
Interconnection Standards for Net Metering
Utilities Involved
12-month billing cycle
Colorado – Gunnison County Electric
10 kW / Commercial, Residential
Photovoltaics, Wind
50 customers Purchased by utility at wholesale rate
Yes Gunnison County Electric
Colorado – Holy Cross Energy
None / Commercial, Industrial, Residential
Photovoltaics, Wind, Biomass, Hydro, Geothermal
25 kW Credited at retail rate to customer's next bill; purchased by utility at wholesale rate at end of 12-month billing cycle
Yes Holy Cross Energy
Connecticut 100 kW for renewables; 50 kW for fossil fuels / Residential, Commercial
Solar, Landfill Gas, Wind, Biomass, Fuel Cells, Municipal Solid Waste, Small Hydro, Tidal Energy, Wave Energy, Ocean Thermal
None Purchased by utility at spot-market energy rate
Yes Investor-owned utilities only
Delaware 25 kW / Commercial, Residential
Solar, Wind, Biomass, Hydro, Geothermal
None Varies by utility Yes All utilities (applies to municipal utilities if they opt to compete outside their limits)
District of Columbia
100 kW / Commercial, Industrial, Residential
Renewables (unspecified), Fuel Cells, Microturbines, CHP
None Credited at retail rate to customer's next bill
Yes (under development)
All utilities
Florida – JEA
10 kW / Residential
Photovoltaics, Wind
None Credited at retail rate to customer's next bill
(Utility guidelines)
JEA
Florida – New Smyrna Beach Utilities
10 kW / Commercial, Industrial, Residential
Photovoltaics None Credited at retail rate to customer's next bill
(Utility guidelines)
New Smyrna Beach Utilities
Georgia 100 kW for commercial systems; 10 kW for residential systems;
Photovoltaics, Wind, Fuel Cells
0.2% of a utility’s annual peak demand
Credited at retail rate to customer's next bill; granted to utility at end of 12-month billing
Yes All utilities

102
Program
System Size Limit/
Customer Classes Eligible
Eligible Technologies
Limit on Total
Capacity
Treatment of Net Excess Generation
(NEG)
Interconnection Standards for Net Metering
Utilities Involved
cycle Hawaii 50 kW /
Commercial, Residential, Government
Photovoltaics, Wind, Biomass, Hydro
0.5% of a utility's annual peak demand
Credited at retail rate to customer's next bill; granted to utility at end of 12-month billing cycle
Yes All utilities
Idaho – Idaho Power
100 kW for large commercial and agricultural; 25 kW for residential and small commercial
Photovoltaics, Wind, Biomass, Hydro, Fuel Cells
2.9 MW (0.1% of utility’s 2000 peak demand)
Purchased monthly by utility at retail rate for residential and small commercial customers; purchased at 85% of Dow Jones index price for non-firm energy for large commercial and agricultural customers
(Utility guidelines)
Idaho Power
Idaho – Utah Power & Light
100 kW for large commercial and irrigation; 25 kW for residential and small commercial
Solar, Wind, Biomass, Hydro
714 kW (0.1% of utility’s Idaho retail peak demand in 2002)
Purchased monthly by utility at retail rate for residential and small commercial customers; purchased at 85% of Dow Jones index price for non-firm energy for large commercial and agricultural customers
(Utility guidelines)
Utah Power & Light
Idaho – Avista Utilities
25 kW / Commercial, Residential, Agricultural
Solar, Wind, Biomass, Hydro, Fuel Cells
1.52 MW (0.1% of utility's 1996 peak demand)
Credited at retail rate to customer's next bill; granted to utility at end of 12-month billing cycle
(Utility guidelines)
Avista Utilities
Illinois – ComEd Wind and PV Generation Program
40 kW / All retail customers
Photovoltaics, Wind
0.1% of utility’s annual peak demand
Purchased monthly by utility at avoided-cost rate; customer receives an annual incentive payment for production
(Utility guidelines)
ComEd

103
Program
System Size Limit/
Customer Classes Eligible
Eligible Technologies
Limit on Total
Capacity
Treatment of Net Excess Generation
(NEG)
Interconnection Standards for Net Metering
Utilities Involved
Indiana 10 kW / Residential, Schools
Photovoltaics, Wind, Small Hydro
0.1% of a utility’s most recent peak summer load
Credited at retail rate to customer's next bill
Yes Investor-owned utilities
Iowa 500 kW / Commercial, Industrial, Residential
Photovoltaics, Wind, Biomass, Hydro, Municipal Solid Waste
None Credited at retail rate to customer's next bill
No Investor-owned utilities
Kentucky 15 kW Commercial, Residential, Nonprofit, Schools, Agricultural, Institutional, Government
Photovoltaics 0.1% of a utility’s single-hour peak load during the previous year
Credit at retail rate to customer's next bill (no expiration)
Yes Investor-owned utilities, cooperatives
Louisiana
100 kW for commercial and agricultural systems; 25 kW for residential systems
Photovoltaics, Wind, Biomass, Hydro, Geothermal, Fuel Cells (Renewable Fuels), Microturbines
None Credited at retail rate to customer's next bill indefinitely
Yes All utilities
Maine 100 kW / Commercial, Industrial, Residential
Solar, Wind, Biomass, Hydro, Geothermal, Fuel Cells, Municipal Solid Waste, CHP, Tidal Energy
None Credited at retail rate to customer's next bill; granted to utility at end of 12-month billing cycle
No All utilities
Maryland 200 kW (500 kW with MD PSC permission) / Commercial, Residential, Schools, Government
Photovoltaics, Wind, Biomass
34.7 MW (0.2% of state's adjusted peak load in 1998)
To be determined by MD Public Service Commission
Yes All utilities
Massachusetts 60 kW / Commercial, Industrial, Residential
Renewables, CHP, Fuel Cells
None Credited at average monthly market rate to customer’s next bill
Yes All utilities
Michigan 30 kW / Commercial, Industrial, Residential, Nonprofit, Schools,
Solar, Wind, Biomass, Hydro, Geothermal, Municipal Solid Waste
0.1% of a utility's peak load or 100 kW (whichever is greater)
Credited at retail rate to customer's next bill; granted to utility at end of 12-month billing
Yes Various utilities (voluntary participation)

104
Program
System Size Limit/
Customer Classes Eligible
Eligible Technologies
Limit on Total
Capacity
Treatment of Net Excess Generation
(NEG)
Interconnection Standards for Net Metering
Utilities Involved
Government, Agricultural, Institutional
cycle
Minnesota 40 kW / Commercial, Industrial, Residential
Photovoltaics, Wind, Biomass, Hydro, Municipal Solid Waste, CHP
None Purchased at average retail utility energy rate
Yes All utilities
Montana 50 kW / Commercial, Industrial, Residential
Photovoltaics, Wind, Hydro
None Credited at retail rate to customer's next bill; granted to utility at end of 12-month billing cycle
Yes Investor-owned utilities
Montana – Montana Electric Cooperatives
10 kW / Commercial, Residential
Photovoltaics, Wind, Geothermal, Fuel Cells, Small Hydro
None Credited at retail rate to customer's next bill; granted to utility at end of 12-month billing cycle
Yes Most of MEC’s 26 member cooperatives
Nevada 150 kW2 / Commercial, Industrial, Residential
Solar, Wind, Biomass, Hydro, Geothermal
1% of a utility’s peak capacity
Credited at retail rate to customer’s next bill; no expiration3
Yes Investor-owned utilities
New Hampshire
25 kW / Commercial, Industrial, Residential
Photovoltaics, Wind, Hydro
0.05% of a utility's peak demand
Credited at retail rate to customer's next bill
Yes All utilities
New Jersey 2 MW / Commercial, Residential
Solar, Wind, Biomass, Hydro, Geothermal, Fuel Cells (Renewable Fuels), Tidal Energy, Wave Energy
None Credited at retail rate to customer's next bill; purchased by utility at avoided-cost rate at end of 12-month billing cycle
Yes All utilities
New Mexico 10 kW / Commercial, Industrial, Residential
Solar, Wind, Biomass, Hydro, Geothermal, Fuel Cells, Municipal Solid Waste,
None Credited to customer's next bill or purchased by utility at avoided-cost rate
Yes Investor-owned utilities, cooperatives
2 In Nevada, utilities are permitted to require customers with systems of more than 30 kW in capacity to install a second meter at the customer’s expense. 3 In Nevada, it is unclear how NEG is treated for systems of more than 30 kW in capacity.

105
Program
System Size Limit/
Customer Classes Eligible
Eligible Technologies
Limit on Total
Capacity
Treatment of Net Excess Generation
(NEG)
Interconnection Standards for Net Metering
Utilities Involved
CHP, Microturbines
New York 400 kW for farm waste; 125 kW for farm-based wind; 25 kW for residential wind; 10 kW for solar
Photovoltaics, Biomass, Wind
Solar: 0.1% of a utility’s demand in 1996; farm biogas: 0.4% of a utility’s demand in 1996; wind: 0.2% of a utility’s 2003 demand
Credited to customer's next bill – except NEG from wind systems over 10 kW, which is credited to customer’s next bill at the utility’s avoided-cost rate. All NEG purchased by utility at avoided-cost rate at end of 12-month billing cycle.
Yes All utilities
North Carolina 20 kW residential; 100 kW non-residential
Photovoltaics, Wind, Biomass
0.2% of a utility’s North Carolina retail peak load for the previous year
Credited at retail rate to customer's next monthly bill; granted to utility every June 1 and October 1
Yes Investor-owned utilities
North Dakota 100 kW / Commercial, Industrial, Residential
Solar, Wind, Biomass, Hydro, Geothermal, Municipal Solid Waste, CHP
None Purchased by utility at avoided-cost rate
No Investor-owned utilities
Ohio 100 kW for microturbines; no limit for other systems / Commercial, Industrial, Residential
Solar, Wind, Biomass, Hydro, Fuel Cells, Microturbines
1% of a utility’s peak demand
Credited at utility’s unbundled-generation rate to customer’s next monthly bill
Yes All competitive utilities
Ohio – Bowling Green Municipal Utilities
25 kW / Commercial, Residential
Photovoltaics, Wind, Hydro, Fuel Cells
None Negotiated with utility
(Utility guidelines)
Bowling Green Municipal Utilities
Oklahoma 100 kW or 25,000 kWh/year (whichever is less) / Commercial, Industrial, Residential
Solar, Wind, Biomass, Hydro, Geothermal, Municipal Solid Waste, CHP
None Granted to utility monthly or credited to customer's next bill at utility’s avoided-cost rate (varies by utility)
No All utilities
Oregon 25 kW / Commercial,
Solar, Wind, Hydro, Fuel
0.5% of a utility's
Credited at retail rate to
Yes All utilities
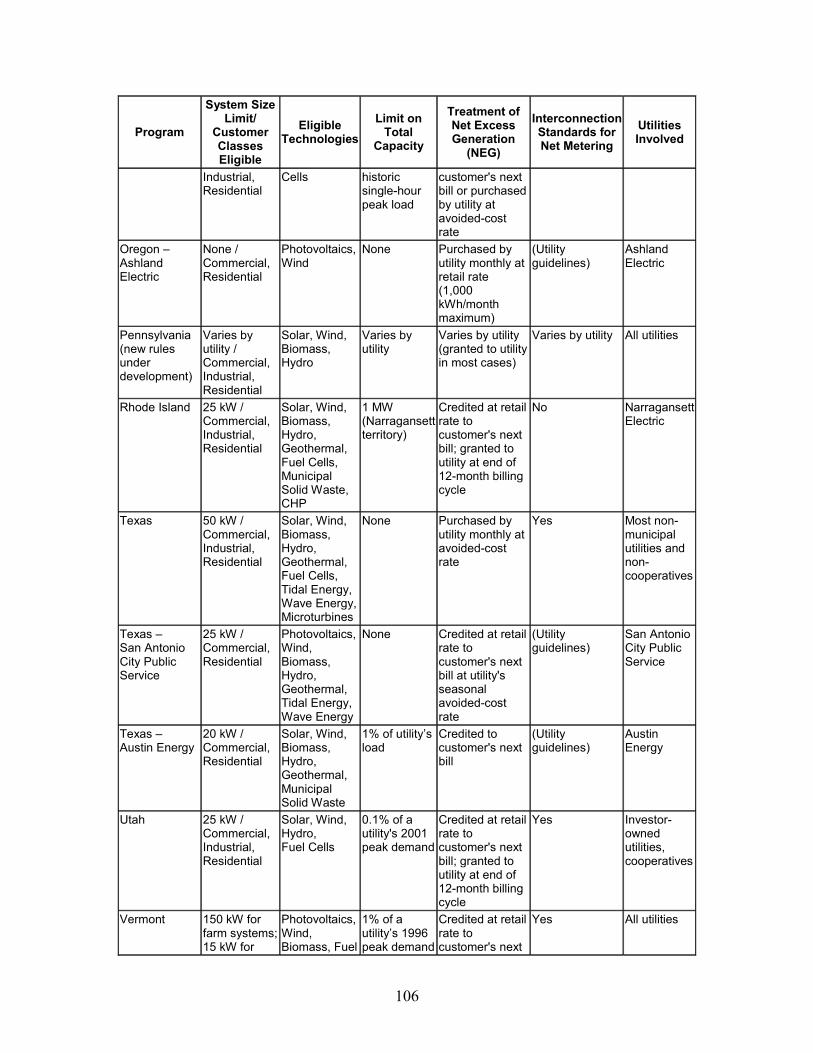
106
Program
System Size Limit/
Customer Classes Eligible
Eligible Technologies
Limit on Total
Capacity
Treatment of Net Excess Generation
(NEG)
Interconnection Standards for Net Metering
Utilities Involved
Industrial, Residential
Cells historic single-hour peak load
customer's next bill or purchased by utility at avoided-cost rate
Oregon – Ashland Electric
None / Commercial, Residential
Photovoltaics, Wind
None Purchased by utility monthly at retail rate (1,000 kWh/month maximum)
(Utility guidelines)
Ashland Electric
Pennsylvania (new rules under development)
Varies by utility / Commercial, Industrial, Residential
Solar, Wind, Biomass, Hydro
Varies by utility
Varies by utility (granted to utility in most cases)
Varies by utility All utilities
Rhode Island 25 kW / Commercial, Industrial, Residential
Solar, Wind, Biomass, Hydro, Geothermal, Fuel Cells, Municipal Solid Waste, CHP
1 MW (Narragansett territory)
Credited at retail rate to customer's next bill; granted to utility at end of 12-month billing cycle
No Narragansett Electric
Texas 50 kW / Commercial, Industrial, Residential
Solar, Wind, Biomass, Hydro, Geothermal, Fuel Cells, Tidal Energy, Wave Energy, Microturbines
None Purchased by utility monthly at avoided-cost rate
Yes Most non-municipal utilities and non-cooperatives
Texas – San Antonio City Public Service
25 kW / Commercial, Residential
Photovoltaics, Wind, Biomass, Hydro, Geothermal, Tidal Energy, Wave Energy
None Credited at retail rate to customer's next bill at utility's seasonal avoided-cost rate
(Utility guidelines)
San Antonio City Public Service
Texas – Austin Energy
20 kW / Commercial, Residential
Solar, Wind, Biomass, Hydro, Geothermal, Municipal Solid Waste
1% of utility’s load
Credited to customer's next bill
(Utility guidelines)
Austin Energy
Utah 25 kW / Commercial, Industrial, Residential
Solar, Wind, Hydro, Fuel Cells
0.1% of a utility's 2001 peak demand
Credited at retail rate to customer's next bill; granted to utility at end of 12-month billing cycle
Yes Investor-owned utilities, cooperatives
Vermont 150 kW for farm systems; 15 kW for
Photovoltaics, Wind, Biomass, Fuel
1% of a utility’s 1996 peak demand
Credited at retail rate to customer's next
Yes All utilities

107
Program
System Size Limit/
Customer Classes Eligible
Eligible Technologies
Limit on Total
Capacity
Treatment of Net Excess Generation
(NEG)
Interconnection Standards for Net Metering
Utilities Involved
commercial and residential / Commercial, Residential, Agricultural
Cells or peak demand during most recent calendar year (whichever is less)
bill; granted to utility at end of 12-month billing cycle
Virginia 500 kW for non-residential; 10 kW for residential / Commercial, Residential, Nonprofit, Schools, Government, Institutional
Solar, Wind, Hydro
0.1% of a utility’s annual peak demand
Credited at retail rate to customer's next bill; granted to utility at end of 12-month billing cycle
Yes All utilities
Washington 25 kW / Commercial, Industrial, Residential
Solar, Wind, Hydro, Fuel Cells
0.1% of a utility’s 1996 peak load
Credited at retail rate to customer's next bill; granted to utility at end of 12-month billing cycle
Yes All utilities
Washington – Grays Harbor PUD
25 kW / Commercial, Industrial, Residential
Solar, Wind, Hydro, Fuel Cells
0.1% of utility’s 1996 peak load
Purchased by utility annually at 50% of retail rate
Yes Grays Harbor PUD
Wisconsin 20 kW / Commercial, Industrial, Residential
Solar, Wind, Biomass, Hydro, Geothermal, Municipal Solid Waste, CHP
None Purchased by utility at retail rate (renewables) or avoided-cost rate (non-renewables)
Yes Investor-owned utilities
Wyoming 25 kW / Commercial, Industrial, Residential
Solar, Wind, Biomass, Hydro
None Credited at retail rate to customer's next bill; purchased by utility at avoided-cost rate at end of 12-month billing cycle
Yes All utilities
Sources: The Interstate Renewable Energy Council (IREC) and the N.C. Solar Center (NCSC). "Connecting to the Grid" Project Web site, http://www.irecusa.org/connect; Database of State Incentives for Renewable Energy (DSIRE), http://www.dsireusa.org, March 2006. Additional information, including most legislative and regulatory source citations, is available via DSIRE.

3.5 – States with Environmental Disclosure Policies As electricity markets open to competition, retail consumers are increasingly gaining the ability to choose their electricity suppliers. With this choice comes the need for consumers to have access to information about the price, source, and environmental characteristics of their electricity. For green power marketers, in particular, it is important that consumers understand the environmental implications of their energy consumption decisions. To date, 25 states and the District of Columbia have environmental disclosure policies in place (Figure 3.5.1), requiring electricity suppliers to provide information on fuel sources and, in some cases, emissions associated with electricity generation. Although most of these policies have been adopted in states with retail competition, a handful of states with no plans to implement restructuring have required environmental disclosure.
Source: DSIRE database, January 2006. http://www.dsireusa.org/index.cfm?&CurrentPageID=10
Figure 3.5.1: Environmental Disclosure Requirements by State
D.C.
State has a Disclosure Rule
108

3.6 – Green Power Markets There are three distinct markets for green power in the United States. In regulated markets, a single utility may provide a green power option to its customers through “green pricing,” which is an optional service or tariff offered to customers. These utilities include investor-owned utilities, rural electric cooperatives, and other publicly owned utilities. More than 600 utilities in 34 states offer green pricing, or are in the process of preparing programs.
In restructured (or competitive) electricity markets, retail electricity customers can choose from among multiple electricity suppliers, some of which may offer green power. Electricity markets are now open to full competition in a number of states, while others are phasing in competition.
Finally, consumers can purchase green power through “renewable energy certificates.”These certificates represent the environmental attributes of renewable energy generation and can be sold to customers in either type of market, whether or not they already have access to a green power product from their existing retail power provider.
Utility market research shows that majorities of customer respondents are likely to state that they would pay at least $5 more per month for renewable energy. And business and other nonresidential customers, including colleges and universities, and government entities are increasingly interested in green power.
Customers At the end of 2004, more than 500,000 electricity customers nationally were purchasinggreen power products through regulated utility companies, from green power marketers in a competitive market setting, or in the form of RECs (Table 3.6.1). In aggregate, utility green pricing programs have shown steady growth in customers over time as thenumber of utility programs has increased and as existing programs have grown. On theother hand, competitive markets have been less consistent. While green power sales have grown in Texas and some Northeast states, other markets have failed altogether—most notably in California and Connecticut. While REC customers represent a small fraction of the total customer base, REC sales have increased dramatically because of a number ofvery large purchases.
Average participation rates among utility green pricing programs have remained steady at just more than 1%, although the top performing utility green pricing programs have achieved rates ranging from 4% to 15%. Competitive markets have experienced penetration rates of from 1% to 2% in states where the market has been conducive toretail competition.
109

Table 3.6.1: Estimated Green Power Customers by Market Segment
2000 2001 2002 2003 2004
Utility Green Pricing 130,000* 170,000* 230,000* 270,000 330,000
Competitive Markets >160,000** >110,000** ~150,000 >150,000 >180,000
REC Markets -- -- < 10,000 < 10,000 < 10,000
Retail Total >290,000 >280,000 ~390,000 ~430,000 ~520,000 * Annual program participant numbers have been adjusted downward from those originally reported in Bird and Swezey (2003), because of program participation revisions made by the Los Angeles Department of Water and Power. ** Includes only customers purchasing Green-e certified green power products, as reported by the Center for Resource Solutions (2001; 2002).
Sales Retail sales of renewable energy in voluntary purchase markets experienced stronggrowth in 2004, increasing more than 60% to 6.2 billion kWh annually. This includes sales of renewable energy derived from both new and preexisting renewable energysources. REC sales nearly tripled, while sales through utility green pricing programs and competitive marketers also exhibited strong annual growth of about 40%.
Table 3.6.2: Estimated Green Power Sales by Market Segment(million kWh)
2003 2004 Increase
Utility Green Pricing 1,280 1,840 43%
Competitive Markets 1,900 2,650 40%
REC Markets 660 1,720 162%
Retail Total 3,840 6,210 62%
*Includes sales of new and existing renewable energy.
Purchases by residential customers represent slightly more than half of total renewableenergy sales in voluntary markets. In 2004, nonresidential customers accounted for 30% and 20% of total renewable energy sales in green pricing programs and competitivemarkets, respectively, and nearly all REC sales.
Since 2000, the amount of renewable energy capacity serving green power markets has increased more than tenfold. At the end of 2004, more than 2,200 MW of new renewable energy generation capacity was being used to supply green power markets, with another 450 MW planned.
110

Table 3.6.3: Estimated Green Power Sales by Customer Segment, 2004 (million kWh)
Green Pricing
Competitive Markets
REC Markets Total Share
Residential 1,300 2,140 40 3,480 56%
Nonresidential 540 510 1,690 2,740 44%
Total 1,840 2,650 1,720 6,210 100%
Totals may not add due to rounding.
Table 3.6.4: Estimated New Renewables Capacity Supplying Green Power Markets,2000-2004 (megawatts)
Market 2000 2001 2002 2003 2004
Utility Green Pricing 77 221 279 510 706
Competitive Markets/RECs 90 542 695 1,126 1,528
Total 167 764 974 1,636 2,233 Totals may not add due to rounding. Source: Bird and Swezey (2005).
Table 3.6.5: New Renewables Capacity Supplying Green Power Markets, 2004
Source MW in Place % MW Planned %Wind 2,045.6 91.6 364.5 80.1 Biomass 135.6 6.1 58.8 12.9 Solar 8.1 0.4 0.4 0.1 Geothermal 35.5 1.6 0.0 0.0 Small Hydro 8.5 0.4 31.3 6.9 Total 2,233.3 100.0 455.0 100.0
Source: L.Bird and B. Swezey, Estimates of New Renewable Energy CapacityServing U.S. Green Power Markets (2004), National Renewable Energy Laboratory, September 2005. http://www.eere.energy.gov/greenpower/resources/tables/new_gp_cap.shtml
111

3.7 – States with Utility Green Pricing Programs Green pricing is an optional utility service that allows customers an opportunity to support a greater level of utility company investment in renewable energy technologies. Participating customers pay a premium on their electric bill to cover the extra cost of therenewable energy. Many utilities are offering green pricing to build customer loyalty and expand business lines and expertise prior to electric market competition. To date, more than 600 investor-owned, municipal, and cooperative utilities in 34 states have either implemented or announced plans to offer a green pricing option (Figure 3.7.1).
Source: L. Bird and B. Swezey, National Renewable Energy Laboratory. Updated May 2005. http://www.eere.energy.gov/greenpower/markets/pricing.shtml?page=4
Figure 3.7.1: Number of Utilities Offering Green Pricing Programs by State
112
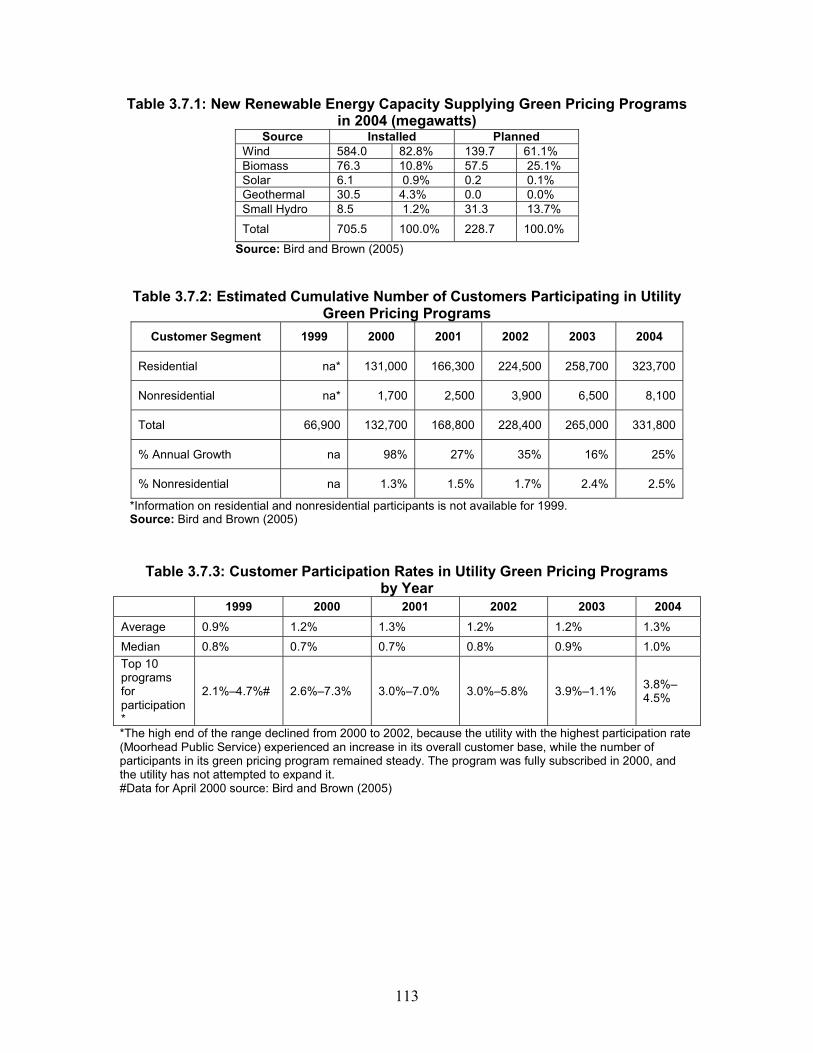
Table 3.7.1: New Renewable Energy Capacity Supplying Green Pricing Programs in 2004 (megawatts)
Source Installed Planned Wind 584.0 82.8% 139.7 61.1% Biomass 76.3 10.8% 57.5 25.1% Solar 6.1 0.9% 0.2 0.1% Geothermal 30.5 4.3% 0.0 0.0% Small Hydro 8.5 1.2% 31.3 13.7%
Total 705.5 100.0% 228.7 100.0%
Source: Bird and Brown (2005)
Table 3.7.2: Estimated Cumulative Number of Customers Participating in UtilityGreen Pricing Programs
Customer Segment 1999 2000 2001 2002 2003 2004
Residential na* 131,000 166,300 224,500 258,700 323,700
Nonresidential na* 1,700 2,500 3,900 6,500 8,100
Total 66,900 132,700 168,800 228,400 265,000 331,800
% Annual Growth na 98% 27% 35% 16% 25%
% Nonresidential na 1.3% 1.5% 1.7% 2.4% 2.5%
*Information on residential and nonresidential participants is not available for 1999. Source: Bird and Brown (2005)
Table 3.7.3: Customer Participation Rates in Utility Green Pricing Programs by Year
1999 2000 2001 2002 2003 2004 Average 0.9% 1.2% 1.3% 1.2% 1.2% 1.3% Median 0.8% 0.7% 0.7% 0.8% 0.9% 1.0% Top 10 programs for participation*
2.1%–4.7%# 2.6%–7.3% 3.0%–7.0% 3.0%–5.8% 3.9%–1.1% 3.8%–4.5%
*The high end of the range declined from 2000 to 2002, because the utility with the highest participation rate (Moorhead Public Service) experienced an increase in its overall customer base, while the number of participants in its green pricing program remained steady. The program was fully subscribed in 2000, and the utility has not attempted to expand it. #Data for April 2000 source: Bird and Brown (2005)
113

Table 3.7.4: Annual Sales of Green Energy through Utility Green Pricing Programs (million kWh)
2000 2001 2002 2003 2004
Residential customers --- 399.7 661.3 874.1 1,295.0
Nonresidential customers --- 172.8 233.7 410.3 544.2
Total All customers 453.7 572.5 895.0 1,284.4 1,839.2
% Annual Growth 26% 56% 44% 43%
% Nonresidential Customers --- 30% 26% 32% 30%
*Sales information for customer segments not available for 2000.
Source: Bird and Brown (2005)
Table 3.7.5: Price Premiums Charged for Utility Green Pricing Products (¢/kWh)
1999 2000 2001 2002 2003 2004 Average 2.15 3.48 2.93 2.82 2.62 2.45 Median 2.00 2.50 2.50 2.50 2.00 2.00
Range 0.4–5.0 (0.5)–20.0 0.9–17.6 0.7–17.6 0.6–17.6 0.33–17.6
10 Programs with Lowest Premiums* 0.4–2.5** (0.5)–2.5 1.0–1.5 0.7–1.5 0.6–1.3 0.33–
1.0 Number of ProgramsRepresented 24 50 60 80 91 101
*Represents the 10 utility programs with the lowest price premiums for new customer-driven renewableenergy. This includes only programs that have installed – or announced firm plans to install or purchase power from – new renewable energy sources. In 2001, the discrepancy between the low end of the range for all programs and the Top 10 programs was because the program with the lowest premium (0.9¢/kWh) was not eligible for the Top 10, because it was either selling existing renewables or had not installed any newrenewable capacity for its program. **Data for April 2000.
Source: Bird and Brown (2005)
114

Table 3.7.6: Utility Green Pricing Programs by State, October 2005
State Utility Name Program
TypeStart Date Premium Name
AK Golden Valley Electric Association Sustainable NaturalAlternative Power (SNAP)
various localprojects
2005 Contribution
AL Alabama Power Company Renewable Energy Rate biomass co-firing
2003 6.0¢/kWh
AL TVA: City of Athens ElectricDepartment, Cullman Electric Coop, Cullman Power Board, Decator Utilities, Florence Utilities, Hartselle Utilities, Huntsville, Joe Wheeler EMC, Muscle Shoals Electric Board, Scottsboro Electric Power Board, Sheffield Utilities, Tuscumbia Electric Department
Green Power Switch landfill gas, PV, wind
2000 2.67¢/kWh
AZ Arizona Public Service APS Solar Partners Program central PV 1997 17.6¢/kWh
AZ Salt River Project EarthWise Energy central PV, wind, landfillgas, smallhydro, geothermal
1998/ 2001
3.0¢/kWh
AZ Tucson Electric GreenWatts landfill gas, PV 2000 10¢/kWhAZ UniSource Energy Services GreenWatts PV 2004 10¢/kWhCA Anaheim Public Utilities Green Power for the Schools PV 2002 Contribution
CA Anaheim Public Utilities Green Power for the Grid wind, landfillgas
2002 1.5¢/kWh
CA Burbank Water and Power Clean Green Support various 2001 1.0¢/kWhCA Los Angeles Department of Water
and PowerGreen Power for a Green LA wind, landfill
gas 1999 3.0¢/kWh
CA PacifiCorp: Pacific Power Blue Sky Block wind 2000 1.95¢/kWhCA Palo Alto Utilities/3 Phases Energy
ServicesPalo Alto Green wind, PV 2003 1.5¢/kWh
CA Pasadena Water & Power Green Power wind 2003 2.5¢/kWhCA Roseville Electric RE Green Energy geothermal,
PV 2000 1.0¢/kWh
CA Sacramento Municipal Utility District Greenergy wind, landfillgas, hydro, PV
1997 1.0¢/kWh or $6/month
CA Silicon Valley Power / 3 PhasesEnergy Services
Santa Clara Green Power wind, PV 2004 1.5¢/kWh
CO Colorado Springs Utilities Green Power wind 1999 3.0¢/kWhCO Holy Cross Energy Wind Power Pioneers wind 1998 2.5¢/kWhCO Holy Cross Energy Local Renewable Energy
Poolsmall hydro, PV
2002 3.3¢/kWh
CO Platte River Power Authority: EstesPark, Fort Collins Utilities, Longmont Power & Communications, Loveland Water & Light
Wind Energy Premium wind 1999 1.0¢/kWh -2.5¢/kWh
115

Program State Utility Name Name Type
Start Date Premium
CO Tri-State Generation & Transmission: Carbon Power, Chimney Rock, Gunnison County Electric, Kit Carson Electric, La Plata Electric, MountainParks Electric, Mountain ViewElectric, New Mexico, Northwest Rural, Poudre Valley Rural ElectricAssociation, Public Power District, San Isabel Electric, San Luis ValleyRural Electric Coop, San Miguel Power, Sangre, Springer Electric, United Power, White River (18 of 44 coops offer program)
Renewable Resource Power Service
wind, hydro 1998 2.5¢/kWh
CO Xcel Energy Renewable Energy Trust PV 1993 Contribution
CO Xcel Energy WindSource wind 1997 0.97¢/kWhCO Yampa Valley Electric Association Wind Energy Program wind 1999 3.0¢/kWhFL City of Tallahassee/Sterling Planet Green for You biomass, PV 2002 1.6¢/kWhFL City of Tallahassee/Sterling Planet Green for You PV only 2002 11.6¢/kWhFL Florida Power & Light / Green
Mountain EnergySunshine Energy biomass, wind,
PV 2004 0.975¢/kWh
FL Gainesville Regional Utilities GRUgreen Energy landfill gas, wind, PV
2003 2.0¢/kWh
FL Keys Energy Services / Sterling Planet
GO GREEN: Florida Ever Green
solar hot water, PV, biomass
2004 2.75¢/kWh
FL Keys Energy Services / Sterling Planet
GO GREEN: USA Green wind, biomass,PV
2004 1.60¢/kWh
FL Tampa Electric Company (TECO) Tampa Electric's Renewable Energy Program
PV, landfillgas, biomass co-firing
2000 5.0¢/kWh
FL Utilities Commission City of NewSmyrna Beach
Green Fund local PV projects
1999 Contribution
GA Georgia Electric Membership Corporation (16 of 42 coops offer program): Carroll EMC, Coastal Electric, Cobb EMC, Coweta-Fayette EMC, Flint Energies, GreyStone Power, Habersham EMC, Irwin EMC, Jackson EMC, Jefferson Energy, Lamar EMC, Ocmulgee EMC,Sawnee EMC, Snapping Shoals EMC, Tri-County EMC, Walton EMCof Monroe
Green Power EMC landfill gas 2001 2.0¢/kWh-3.3¢/kWh
GA Georgia Power Green Energy landfill gas 2005 5.5¢/ kWh
GA TVA: Blue Ridge Mountain ElectricMembership Corporation, North Georgia Electric Membership Corporation
Green Power Switch landfill gas, PV, wind
2000 2.67¢/ kWh
HI Hawaiian Electric Sun Power for Schools PV in schools 1997 Contribution
ID Avista Utilities Buck-A-Block wind 2002 0.33¢/kWhID Idaho Power Green Power Program various 2001 ContributionID PacifiCorp: Utah Power Blue Sky wind 2003 1.95¢/kWh
116
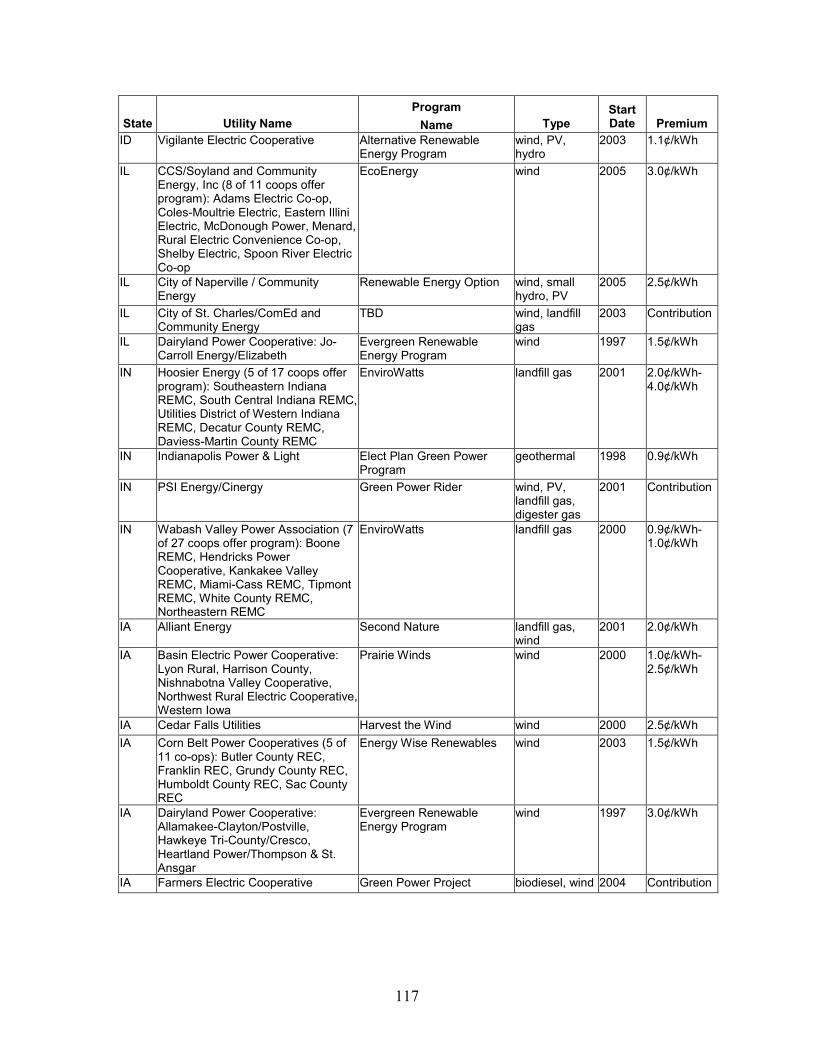
Program State Utility Name Name Type
Start Date Premium
ID Vigilante Electric Cooperative Alternative Renewable Energy Program
wind, PV, hydro
2003 1.1¢/kWh
IL CCS/Soyland and CommunityEnergy, Inc (8 of 11 coops offer program): Adams Electric Co-op, Coles-Moultrie Electric, Eastern Illini Electric, McDonough Power, Menard, Rural Electric Convenience Co-op, Shelby Electric, Spoon River Electric Co-op
EcoEnergy wind 2005 3.0¢/kWh
IL City of Naperville / CommunityEnergy
Renewable Energy Option wind, small hydro, PV
2005 2.5¢/kWh
IL City of St. Charles/ComEd andCommunity Energy
TBD wind, landfillgas
2003 Contribution
IL Dairyland Power Cooperative: Jo-Carroll Energy/Elizabeth
Evergreen Renewable Energy Program
wind 1997 1.5¢/kWh
IN Hoosier Energy (5 of 17 coops offer program): Southeastern IndianaREMC, South Central Indiana REMC, Utilities District of Western Indiana REMC, Decatur County REMC, Daviess-Martin County REMC
EnviroWatts landfill gas 2001 2.0¢/kWh-4.0¢/kWh
IN Indianapolis Power & Light Elect Plan Green Power Program
geothermal 1998 0.9¢/kWh
IN PSI Energy/Cinergy Green Power Rider wind, PV, landfill gas, digester gas
2001 Contribution
IN Wabash Valley Power Association (7of 27 coops offer program): Boone REMC, Hendricks Power Cooperative, Kankakee ValleyREMC, Miami-Cass REMC, Tipmont REMC, White County REMC, Northeastern REMC
EnviroWatts landfill gas 2000 0.9¢/kWh-1.0¢/kWh
IA Alliant Energy Second Nature landfill gas, wind
2001 2.0¢/kWh
IA Basin Electric Power Cooperative: Lyon Rural, Harrison County,Nishnabotna Valley Cooperative, Northwest Rural Electric Cooperative, Western Iowa
Prairie Winds wind 2000 1.0¢/kWh-2.5¢/kWh
IA Cedar Falls Utilities Harvest the Wind wind 2000 2.5¢/kWhIA Corn Belt Power Cooperatives (5 of
11 co-ops): Butler County REC, Franklin REC, Grundy County REC,Humboldt County REC, Sac CountyREC
Energy Wise Renewables wind 2003 1.5¢/kWh
IA Dairyland Power Cooperative: Allamakee-Clayton/Postville, Hawkeye Tri-County/Cresco, Heartland Power/Thompson & St. Ansgar
Evergreen Renewable Energy Program
wind 1997 3.0¢/kWh
IA Farmers Electric Cooperative Green Power Project biodiesel, wind 2004 Contribution
117

Program State Utility Name Name Type
Start Date Premium
IA Iowa Association of Municipal Utilities (80 of 137 participating) Afton,Algona, Alta Vista, Aplington, Auburn, Bancroft, Bellevue, Bloomfield,Breda, Brooklyn, Buffalo, Burt,Callender, Carlisle, Cascade, Coggon, Coon Rapids, Corning, Corwith, Danville, Dayton, Durant, Dysart, Earlville, Eldridge, Ellsworth, Estherville, Fairbank, Farnhamville, Fontanelle, Forest City, Gowrie, Grafton, Grand Junction, Greenfield, Grundy Center, Guttenberg, Hopkinton, Hudson, Independence,Keosauqua, La Porte City, Lake Mills, Lake View, Laurens, Lenox, Livermore, Maquoketa, Marathon, McGregor, Milford, Montezuma, Mount Pleasant, Neola, NewHampton, Ogden, Orient, Osage, Panora, Pella, Pocahontas, Preston, Readlyn, Rockford, Sabula, Sergeant Bluff, Sibley, Spencer, Stanhope, State Center, Stratford, StrawberryPoint, Stuart, Tipton, Villisca, Vinton,Webster City, West Bend, West Liberty, West Point, Westfield,Whittemore, Wilton, Winterset
Green City Energy wind, biomass, PV
2003 Varies byutility
IA MidAmerican Energy Renewable Advantage wind 2004 ContributionIA Missouri River Energy Services
(MRES): Alton, Atlantic, Denison, Fontanelle, Hartley, Hawarden, Kimballton, Lake Park, Manilla, Orange City, Paullina, Primghar, Remsen, Rock Rapids, Sanborn, Shelby, Sioux Center, Woodbine
RiverWinds wind 2003 1.0¢/kWh-2.5¢/kWh
IA Muscatine Power and Water Solar Muscatine PV 2004 ContributionIA Waverly Light & Power Green Power Choice wind 2003 ContributionIA Waverly Light & Power Iowa Energy Tags wind 2001 2.0¢/kWhKY East Kentucky Power Cooperative:
Blue Grass Energy, Clark, Cumberland, Fleming, Grayson, Inter-county Energy, Jackson, Licking, Mason, Nolin, Owen Electric, Salt River, Shelby, South Kentucky
EnviroWatts landfill gas 2002 2.75¢/kWh
KY TVA: Bowling Green MunicipalUtilities, Franklin Electric Plant Board
Green Power Switch landfill gas, PV, wind
2000 2.67¢/kWh
MA Concord Municipal Light Plant (CMLP)
Green Power hydro 2004 3.0¢/kWh
MI Consumers Energy Green Generation wind, landfillgas
2005 1.67¢/kWh
MI Lansing Board of Water and Light GreenWise Electric Power landfill gas, small hydro
2001 3.0¢/kWh
MI Traverse City Light and Power Green Rate wind 1996 1.5¢/kWhMI Upper Peninsula Power Company NatureWise wind, landfill
gas and animal waste methane
2004 4.0¢/kWh
118

Program State Utility Name Name Type
Start Date Premium
MI We Energies Energy for Tomorrow wind, landfillgas, hydro
2000 2.0¢/kWh
MN Alliant Energy Second Nature landfill gas, wind
2002 2.0¢/kWh
MN Basin Electric Power Cooperative: Minnesota Valley Electric Coop, Sioux Valley Southwestern
Prairie Winds wind 2002 1.0¢/kWh-2.5¢/kWh
MN Central Minnesota Municipal Power Agency
Green Energy Program wind, landfillgas
n/a 1.5¢/kWh-2.5¢/kWh
MN Dairyland Power Cooperative: Freeborn-Mower Cooperative / Albert Lea, People's / Rochester, Tri-County/ Rushford
Evergreen Renewable Energy Program
wind 1997 1.5¢/kWh
MN Great River Energy (all 28 coops offer program): Agralite, Arrowhead, BENCO Electric, Brown County Rural Electric, Connexus Energy, Co-op Light & Power, Crow Wing Power, Dakota Electric Association, East Central Electric Association, Federated Rural Electric, Goodhue County, Itasca Mantrap Cooperative, Kandiyohi Power Cooperative, Lake Country Power, Lake Region Electric Cooperative, McLeod Cooperative Power, Meeker Cooperative Light & Power, Mille Lacs ElectricCooperative, Minnesota Valley,Nobles Cooperative Electric, North Itasca, Redwood ElectricCooperative, Runestone Electric, South Central Electric Association ,Stearns Electric, Steele-Waseca, Todd-Wadena , Wright-Hennepin Electric
Wellspring Renewable Wind Energy Program
wind 1998 1.45¢/kWh-2.0¢/kWh
MN Minnesota Power WindSense wind 2002 2.5¢/kWhMN Minnkota Power Cooperative:
Beltrami, Clearwater Polk, North Star, PKM, Red Lake, Red River, Roseau, Wild Rice, Thief River Falls
Infinity Wind Energy wind 1999 1.5¢/kWh
MN Missouri River Energy Services (39 of 55 munis offer program): Adrian, Alexandria, Barnesville, Benson, Breckenridge, Detroit Lakes, ElbowLake, Henning, Jackson, Lakefield,Lake Park, Luverne, Madison,Moorhead, Ortonville, St. James, Sauk Centre, Staples, Wadena, Westbrook, Worthington
RiverWinds wind 2002 1.0¢/kWh-2.5¢/kWh
MN Moorhead Public Service Capture the Wind wind 1998 1.5¢/kWhMN Otter Tail Power Company TailWinds wind 2002 2.6¢/kWh
119

Program State Utility Name Name Type
Start Date Premium
MN Southern Minnesota Municipal Power Agency (all 18 offer program): Fairmont Public Utilities, Wells PublicUtilities, Austin Utilities, Preston Public Utilities, Spring Valley Utilities,Blooming Prairie Public Utilities, Rochester Public Utilities, Owatonna Public Utilities, Waseca Utilities, St. Peter Municipal Utilities, Lake CityUtilities, New Prague Utilities Commission, Redwood Falls PublicUtilities, Litchfield Public Utilities, Princeton Public Utilities, North Branch Water and Light, Mora Municipal Utilities, Grand Marais Public Utilities
SMMPA Wind Power wind 2000 1.0¢/kWh
MN Xcel Energy WindSource wind 2003 2.0¢/kWhMS TVA: City of Oxford, North East
Mississippi Electric PowerAsssociation, Starkville ElectricSystem
Green Power Switch landfill gas, PV, wind
2000 2.67¢/kWh
MO Boone Electric Cooperative Renewable Choice wind 2003 2.0¢/kWhMO City Utilities of Springfield WindCurrent wind 2000 5.0¢/kWhMT Basin Electric Power Cooperative:
Lower YellowstonePrairie Winds wind 2000 1.0¢/kWh-
2.5¢/kWhMT Northwestern Energy E+ Green wind, PV 2003 2.0¢/kWhMT Park Electric Cooperative Green Power Program wind, hydro 2002 1.2¢/kWhMT Southern Montana Electric
Generation and Transmission Cooperative (5 co-ops): FergusElectric, Yellowstone Valley, Bear Tooth Electric, Mid Yellowstone, andTongue River
Environmentally Preferred Power
wind, hydro 2002 1.05¢/kWh
MT Vigilante Electric Cooperative Alternative Renewable Energy Program
wind, hydro, PV
2003 1.1¢/kWh
NE Lincoln Electric System LES Renewable EnergyProgram
wind 1998 4.3¢/kWh
NE Omaha Public Power District Green Power Program landfill gas, wind
2002 3.0¢/kWh
NE Tri-State: Chimney Rock PublicPower District, Northwest Rural Public Power District
Renewable Resource Power Service
wind, landfillgas
2001 2.5¢/kWh
NM El Paso Electric Renewable Energy Tariff wind 2003 3.19¢/kWh
NM Los Alamos Department of PublicUtilities
Green Power wind 2005 1.8¢/kWh
NM Public Service of New Mexico PNM Sky Blue wind 2003 1.8¢/kWhNM Tri-State: Kit Carson Electric
CooperativeRenewable Resource Power Service
wind, landfillgas
2001 2.5¢/kWh
NM Xcel Energy WindSource wind 1999 3.0¢/kWhNC Dominion North Carolina Power NC GreenPower biomass, wind,
solar2003 4.0¢/kWh
NC Duke Power NC GreenPower biomass, wind, solar
2003 4.0¢/kWh
120

Program State Utility Name Name Type
Start Date Premium
NC ElectriCities: City of High Point, Cityof Laurinburg, City of Newton, City of Shelby, City of Statesville, town of Apex, Town of Granite Falls
NC GreenPower biomass, wind, solar
2003 4.0¢/kWh
NC NC Electric Cooperatives (15 of 27 cooperatives offer the program): Albemarle EMC, Blue Ridge ElectricMembership Corp., BrunswickElectric Membership Corp., Carteret Craven Electric Coop., Edgecombe-Martin County Electric MembershipCorp., EnergyUnited, Four CountyElectric Membership Corp., Haywood Electric Membership Corp., Jones-Onslow Electric Membership Corp., Pee Dee Electric Membership Corp., Piedmont Electric Membership Corp., Randolph Electric Membership Corp., Roanoke Electric Membership Corp., Tri-County Electric Membership Corp., Wake Electric Membership Corp.
NC GreenPower biomass, wind, PV
2003 4.0¢/kWh
NC Progress Energy / CP&L NC GreenPower biomass, wind, solar
2003 4.0¢/kWh
NC TVA: Mountain Electric Cooperative Green Power Switch landfill gas, PV, wind
2000 2.67¢/kWh
ND Basin Electric Power Cooperative (49 coops offer program in 5 states): Oliver Mercer Electric Coop, Mor-gran-sou Electric Coop, KEM Electric Coop, North Central Electric Coop, Verendrye, Capital , Northern Plains, Dakota Valley, Burke Divide, Montrail Williams, McKenzie Electric Coop, West Plains, Slope Electric Coop
PrairieWinds wind 2000 1.0¢/kWh-2.5¢/kWh
ND Minnkota Power Cooperative: Cass County Electric, Cavalier RuralElectric, Nodak Electric, Northern Municipal Power Agency (12municipals)
Infinity Wind Energy wind 1999 1.5¢/kWh
ND Missouri River Energy Services: Cityof Lakota
RiverWinds wind 2002 1.0¢/kWh-2.5¢/kWh
OH American Municipal Power-Ohio / Green Mountain Energy: City of Bowling Green, Cuyahoga Falls, Wyandotte
Nature's Energy small hydro, landfill gas, wind
2003 1.3¢/kWh-1.5¢/kWh
OK OG&E Electric Services OG&E Wind Power wind 2003 2.0¢/kWhOK Oklahoma Municipal Power Authority:
Tonkawa, Altus, Frederick, Okeene, Prague Municipal Utilities and Edmond Electric
Pure & Simple wind 2004 1.8¢/kWh
121

Program State Utility Name Name Type
Start Date Premium
OK Western Farmers ElectricCooperative (19 of 19): Alfalfa Electric Cooperative, Caddo ElectricCooperative, Canadian ValleyElectric Cooperative, Choctaw Electri Cooperative, Cimmaron ElectricCooperative, Cotton Electric Cooperative, East Central Oklahoma Electric Cooperative, Harmon Electric Cooperative, Kay ElectricCooperative, Kiamichi ElectricCooperative, Kiwash ElectricCooperative, Northfork ElectricCooperative, Northwestern ElectricCooperative, Oklahoma ElectricCooperative, People's ElectricCooperative, Red River Valley Rural Electric Cooperative, Rural ElectricCooperative, Southeastern ElectricCooperative, Southwest Rural Electric Cooperative
WindWorks wind 2004 0.5¢/kWh
OR City of Ashland/Bonneville Environmental Foundation
Renewable Pioneers PV, wind 2003 2.0¢/kWh
OR Columbia River PUD Choice Energy wind 2005 2.0¢/kWhOR Emerald People's Utility
District/Green Mountain EnergyChoose RenewableElectricity
wind, geothermal
2003 1.2¢/kWh
OR Eugene Water & Electric Board EWEB Wind Power wind 1999 0.71¢/kWhOR Midstate Electric Cooperative Environmentally-Preferred
Powerwind, small hydro
1999 2.5¢/kWh
OR Oregon Trail Electric Cooperative Green Power wind 2002 1.5¢/kWhOR PacifiCorp: Pacific Power Blue Sky QS (Commercial
Only)wind 2004 Sliding scale
depending on size
OR PacifiCorp: Pacific Power Blue Sky Block wind 2000 1.95¢/kWhOR PacifiCorp: Pacific Power / 3 Phases
Energy ServicesBlue Sky Usage wind, biomass,
PV 2002 0.78¢/kWh
OR PacifiCorp: Pacific Power / 3 PhasesEnergy Services
Blue Sky Habitat wind, biomass, PV
2002 0.78¢/kWh + $2.50/mo.donation
OR Pacific Northwest Generating Cooperative: Central ElectricCooperative, Clearwater Power, Consumers Power, Douglas ElectricCooperative, Umatilla Electric Cooperative (5 of 16 coops offer program)
Green Power landfill gas 1998 1.8¢/kWh-4.0¢/kWh
OR Portland General Electric / Green Mountain Energy
Green Source existing geothermal, wind
2002 0.8¢/kWh
OR Portland General Electric / Green Mountain Energy
Healthy Habitat existing geothermal, wind
2002 0.8¢/kWh + $2.50/mo.donation
OR Portland General Electric Company Clean Wind for Medium to Large Commercial &Industrial Accounts
wind 2003 1.35¢/kWh-1.7¢/kWh
122

Program State Utility Name Name Type
Start Date Premium
OR Portland General Electric Company Clean Wind Power wind 2002 1.75¢/kWhSC Santee Cooper, Aiken Electric
Cooperative, Berkeley ElectricCooperative, Edisto ElectricCooperative, Fairfield ElectricCooperative, Horry ElectricCooperative, Laurens Electric Cooperative, Lynches River ElectricCooperative, Marlboro ElectricCooperative, Mid-Carolina ElectricCooperative, Palmetto ElectricCooperative, Pee Dee ElectricCooperative, Santee ElectricCooperative, Tri-County Electric Cooperative, York ElectricCooperative
Green Power Program landfill gas 2001 3.0¢/kWh
SD Basin Electric Power Cooperative: Bon Homme-Yankton Electric Assn.,Central Electric Cooperative Association, Charles Mix Electric Association, City of Elk Point, Clay-Union Electric Corporation, Codington-Clark Electric Cooperative, Dakota EnergyCooperative, Douglas ElectricCooperative, FEM ElectricAssociation, H-D ElectricCooperative, Kingsbury ElectricCooperative, Lyon-Lincoln ElectricCooperative, McCook Electric Cooperative, Northern ElectricCooperative, Oahe ElectricCooperative, Renville-Sibley Coop. Power Assn., Sioux ValleySouthwestern Electric Coop, Southeastern Electric Coop, Union County Electric Cooperative, Whetstone Valley ElectricCooperative, Black Hills ElectricCoop, LaCreek Electric Coop, WestRiver Power Association, Butte Electric Coop, Cherry Todd ElectricCoop, Moreau Grand, Grand Electric Cooperative, Rosebud
Prairie Winds wind 2000 1.0¢/kWh-2.5¢/kWh
SD Missouri River Energy Services: Cityof Vermillion
RiverWinds wind 2002 1.0¢/kWh-2.5¢/kWh
TN TVA: Alcoa Electric Department, Appalachian Electric Cooperative, Athens Utility Board, Bristol Tennessee Electric System, CaneyFork Electric Cooperative, City of Maryville Electric Department, Clarksville Department of Electricity,Cleveland Utilities, Clinton Utilities Board, Cookeville ElectricDepartment, Cumberland Electric Membership Corporation, Dickson Electric Department, Duck River Electric Membership Corporation,
Green Power Switch landfill gas, PV, wind
2000 2.67¢/kWh
123

Program State Utility Name Name Type
Start Date Premium
Elizabethton Electric System, EPB (Chattanooga), Erwin Utilities, Fayetteville Public Utilities, GibsonElectric Membership Corporation, Greeneville Light and Power System, Harriman Utility Board, Johnson CityPower Board, Jackson EnergyAuthority, Knoxville Utilities Board, Lafollette Utilities Board, Lawrenceburg Power System, LenoirCity Utilities Board, Loudon Utilities, McMinnville Electric System, Memphis Light, Gas & Water,Meriwhether Lewis ElectricCooperative, Middle Tennessee Electric Membership Corporation, Morristown Power System, Mountain Electric Cooperative, Murfreesboro Electric Department, NashvilleElectric Service, Newport Utilities, Oak Ridge Electric Department, Paris Board of Public Utilities, Plateau Electric Cooperative, Powell ValleyElectric Cooperative, Pulaski Electric System, Sequachee Valley ElectricCooperative, Sevier County ElectricSystem, Springfield Department of Electricity, Sweetwater UtilitiesBoard, Tullahoma Utilities Board, Upper Cumberland ElectricMembership Corporation, Volunteer Energy
TX Austin Energy (City of Austin) GreenChoice wind, landfillgas, hydro
2000/1997
0.5¢/kWh
TX City Public Service of San Antonio Windtricity wind 2000 3.0¢/kWhTX El Paso Electric Company Renewable Energy Tariff wind 2001 1.92¢/kWh
UT City of St. George Clean Green Power wind, small hydro
2005 2.95¢/kWh
UT Deseret Power GreenWay various 2004 1.95¢/kWhUT Pacificorp: Utah Power Blue Sky wind 2000 1.95¢/kWhVT Central Vermont Public Service CVPS Cow Power biogas 2004 4.0¢/kWhVT Green Mountain Power CoolHome / CoolBusiness wind, biomass 2002 Contribution
WA Avista Utilities Buck-A-Block wind 2002 0.33¢/kWhWA Benton County Public Utility District Green Power Program landfill gas,
wind 1999 Contribution
WA Chelan County PUD Sustainable NaturalAlternative Power (SNAP)
PV, wind, micro hydro
2001 Contribution
WA Clallam County PUD Clallam County PUD Green Power Program
landfill gas 2001 0.7¢/kWh
WA Clark Public Utilities Green Lights PV, wind 2002 1.5¢/kWhWA Cowlitz PUD Renewable Resource
Energywind, PV 2002 2.0¢/kWh
124

Program State Utility Name Name Type
Start Date Premium
WA Grant County PUD Alternative EnergyResources Program
wind 2002 2.0¢/kWh
WA Grays Harbor PUD Green Power wind 2002 3.0¢/kWhWA Lewis County PUD Green Power Energy Rate wind 2003 2.0¢/kWh
WA Mason County PUD No. 3 Mason Evergreen Power wind 2003 2.0¢/kWh
WA Orcas Power & Light Go Green wind, hydro 1999 3.5¢/kWhWA Pacific County PUD Green Power landfill gas 2002 1.05¢/kWhWA Pacificorp: Pacific Power Blue Sky wind 2000 1.95¢/kWhWA Peninsula Light Green by Choice wind, hydro 2002 2.8¢/kWhWA Puget Sound Energy Green Power Plan wind, PV,
biogas 2002 2.0¢/kWh
WA Seattle City Light Green UP (C&I only) wind 2005 1.5¢/kWhWA Seattle City Light Seattle Green Power PV, biogas 2002 ContributionWA Snohomish County Public Utility
DistrictPlanet Power wind 2002 2.0¢/kWh
WA Tacoma Power EverGreen Options small hydro, wind
2000 1.5¢/kWh
WI Alliant Energy Second Nature wind, landfillgas
2000 2.0¢/kWh
WI Dairyland Power Cooperative: Barron Electric, Bayfield/ Iron River, Chippewa / Cornell Valley, Clark / Greenwood, Dunn / Menomonie, Eau Claire / Fall Creek, Jackson / Black River Falls, Jump River / Ladysmith, Oakdale, Pierce-Pepin / Ellsworth, Polk-Burnett / Centuria, Price /Phillips, Richland, Riverland / Arcadia, St. Croix / Baldwin, Scenic Rivers / Lancaster, Taylor / Medford, Vernon / Westby
Evergreen Renewable Energy Program
wind 1998 1.5¢/kWh
WI Great River Energy: Head of the Lakes
Wellspring Renewable Wind Energy Program
wind 1997 1.45¢/kWh-2.0¢/kWh
WI Madison Gas & Electric Wind Power Program wind 1999 3.3¢/kWhWI We Energies Energy for Tomorrow landfill gas,
hydro, wind 1996 2.04¢/kWh
WI Wisconsin Public Power Inc. (34 of 37 munis offer program): Algoma, Cedarburg, Florence, Kaukauna, Muscoda, Stoughton, Reedsburg, Oconomowoc, Waterloo, Whitehall, Columbus, Hartford, Lake Mills, NewHolstein, Richland Center, Boscobel, Cuba City, Hustisford, Sturgeon Bay, Waunakee, Lodi, New London, Plymouth, River Falls, Sun Prairie, Waupun, Eagle River, Jefferson,Menasha, New Richmond, Prairie du Sac, Slinger, Two Rivers, Westby
Renewable Energy Program small hydro, wind, biogas
2001 2.0¢/kWh
WI Wisconsin Public Service NatureWise wind, landfillgas, biogas
2002 1.86¢/kWh
WI Wisconsin Public Service Solar Wise for Schools PV in schools 1996 Contribution
125

Program State Utility Name Name Type
Start Date Premium
WY Lower Valley Energy Green Power wind 2003 1.17¢/kWhWY Pacificorp: Pacific Power Blue Sky wind 2000 1.95¢/kWhWY Tri-State: Carbon Power & Light Renewable Resource Power
Servicewind, landfillgas
2001 2.5¢/kWh
WY Yampa Valley Electric Association Wind Energy Program wind 1999 3.0¢/kWh
126

3.8 – Competitive Green Power Offerings and Renewable EnergyCertificates Green power marketing refers to selling green power in the competitive marketplace, in which multiple suppliers and service offerings exist. Electricity markets are now open to full competition in a number of states, while others are phasing-in competition, allowingsome customers to choose their electricity supplier. As of mid-2004, competitive marketers offer green power to retail or wholesale customers in Maine, Maryland, Massachusetts, Pennsylvania, New Jersey, New York, Rhode Island, Texas, Virginia, and the District of Columbia (Figure 3.8.1).
Renewable energy certificates (RECs) – also known as green tags, renewable energycredits, or tradeable renewable certificates – present the environmental attributes of power generated from renewable electric plants. A number of organizations offer green energy certificates separate from electricity service (i.e. customers do not need to switch from their current electricity supplier to purchase these certificates). See our list below oforganizations that offer green certificate products.
Source: L. Bird and B. Swezey, National Renewable Energy Laboratory. Updated July 2005. http://www.eere.energy.gov/greenpower/markets/marketing.shtml?page=4
Figure 3.8.1: Green Power Marketing Activity in Competitive Electricity Markets
127

Based on data received from green power marketers, an estimated 200,000 retail customers were purchasing green power from competitive suppliers – or in the form of RECs – at the end of 2004. Most of these customers are purchasing green power from competitive suppliers in states with retail competition, primarily in the Northeast and Texas, including about 30,000 participants in utility/marketer programs. Of the total, fewer than 10,000 retail customers purchase REC products (Table 3.8.1), with most customers concentrated in the Mid-Atlantic and Northeast states where REC marketers tend to be most active. In competitive markets, the vast majority of customers purchasinggreen power are residential customers, while the fraction of nonresidential customers purchasing RECs is higher – on the order of one-fifth.
Table 3.8.1: Estimated Number of Customers Purchasing RECs or Green Powerfrom Competitive Marketers, 2002-2004
2002 2003 2004
Competitive Markets ~150,000 >150,000 >180,000
RECs <10,000 <10,000 <10,000
Total <160,000 ~160,000 ~190,000
Table 3.8.2: Retail Sales of Renewable Energy in Competitive Markets and RECs (million kWh)
2003 2004 Competitive Markets Residential na 2,140 Nonresidential na 510
Subtotal 1,900 2,650 RECsResidential na 40 Nonresidential na 1,690 Subtotal 660 1,720
Total Sales 2,560 4,370 na = not available An estimated 1,530 MW of new renewables capacity is used to supply competitive green power markets, oris being sold as RECs in both retail and wholesale markets; wind energy is the predominant resource type. More than 225 MW of additional renewables capacity is planned, again dominated by wind.
An estimated 4.4 billion kWh of renewable energy was sold to retail customers bycompetitive and REC marketers. About 2.7 billion kWh of this total was sold to retail customers bundled with electricity in competitive electricity markets – a 40% increase from 2003. This figure includes renewable energy from both existing and new sources, as well as that sold to customers in products that contain only a small percentage of renewable energy. It also includes sales of renewable energy through default utility/supplier programs or utility/marketer partnership in states with retail competition,
128

which totaled 136 million kWh. Retail sales of RECs, which are sold separate from electricity and largely derived from new renewable energy sources, grew nearlythreefold, reaching 1.7 billion kWh in 2004.
Table 3.8.3: New Renewables Capacity Supplying Competitive Markets and Renewable Energy Certificates, 2004
Source MW in Place % MW Planned %Wind 1,461.6 95.7 224.8 99.3 Biomass 59.3 3.9 1.3 0.6 Solar 2.0 0.1 0.2 0.1 Geothermal 5.0 0.3 0.0 0.0 Small Hydro 0.0 0.0 0.0 0.0 Total 1,527.9 100.0 226.3 100.0
Source: L.Bird and B. Swezey, Estimates of New Renewable Energy CapacityServing U.S. Green Power Markets (2004), National Renewable Energy Laboratory, September 2005. http://www.eere.energy.gov/greenpower/resources/tables/new_gp_cap.shtml
Table 3.8.4: Estimated Wholesale RECs Supplying Voluntary Markets, 2003
Retail Sales Millions of MWh
Estimated RECs Sales Millions of MWh
Utility Green Pricing 1.3 0.4 Competitive Markets 1.9 1.9 Unbundled RECs 0.7 0.7 Total Green Power Market 3.9 3.0
Source: L. Bird, NREL, 2004
Table 3.8.5: Voluntary Market REC Retirements in Texas and NEPOOL
YearTexas Voluntary REC
Retirements(MWh)
NEPOOL Voluntary REC Retirements
(MWh)* 2001 N/a 0 2002 241,000 112,973 2003 797,000 56,905
Sources: ERCOT 2004; NEPOOL GIS
129

Table 3.8.6: Voluntary Market Wholesale REC Prices for New Sources by Type and Region ($/MWh)
Wind Solar Biomass Small Hydro CA 1.75-2.00 1.50 WECC 1.25-7.50 30.00-150.00 1.50-3.50 Central 2.00-5.50 1.50 PJM 15.00-17.00 80.00-200.00 4:00-5.00 New York 15.00-16.00 6.00 NEPOOL 35.00 45.00 5.00 SPP 2.50-5.00 Southeast 3.50
Sources: Evolution Markets (data for July 2003 through October 2004) and GT Energy.
Table 3.8.7: Voluntary Market Wholesale REC Prices for Existing Sources by Type and Region ($/MWh)
Biomass Geothermal Hydro Small Hydro LIHI Hydro WECC 0.25-2.50 1.00-3.50 Central PJMNew York 2.00-5.00 2.00-3.00 1.00-3.50 NEPOOL 2.00-4.00 6.00 Southeast Source: Evolution Markets. Data for July 2003 through October 2004.
130

Table 3.8.8: Retail Green Power Product Offerings in Competitive ElectricityMarkets, October 2005
State Company Product Name Residential Price
Premium1
Fee Resource Mix2 Certification
CT Community Energy(CT Clean EnergyOptions Program)
CT Clean EnergyOptions 50% or 100% of usage
1.1¢/kWh — 50% new wind, 50% landfill gas
—
CT Levco 100% Renewable Electricity Program
0.0¢/kWh — 98% waste-to-energy and hydro
(Class II), 2% newsolar, wind, fuel
cells, and landfill gas
—
CT Sterling Planet (CTClean Energy Options
Program)
Sterling Select 50%or 100% of usage
1.15¢/kWh — 33% new wind, 33% existing small low
impact hydro, 34% new landfill gas
—
DC PEPCO EnergyServices (3)
Green Electricity10%, 51% or 100%
of usage
1.35¢/kWh (for 100% usage)
— landfill gas —
DC PEPCO EnergyServices (3)
NewWind Energy51% or 100% of
usage
2.05¢kWh (for 100% usage)
— new wind —
DC Washington Gas Energy Services /
Community Energy
New Wind Energy(5%, 10%, 25%, 50%, or 100% of
usage)
2.5¢/kWh — new wind —
ME Maine Renewable Energy/Maine
Interfaith Power & Light (4)
Maine Clean Power 2.37¢/kWh — 100% low impact hydro
—
ME Maine Renewable Energy/Maine
Interfaith Power & Light (4)
Maine Clean Power Plus
2.87¢/kWh — 80% low impact hydro, 20% wind
—
MD PEPCO EnergyServices (5)
Green Electricity10%, 51% or 100%
of usage
2.75¢/kWh (for 100% usage)
— landfill gas —
MD PEPCO EnergyServices (5)
NewWind Energy51% or 100% of
usage
3.35¢/kWh (for 100% usage)
— new wind —
MD PEPCO EnergyServices (5)
Non-residentialproduct
NA — 50% to 100% eligible renewables
Green-e
MD Washington Gas Energy Services /
Community Energy
New Wind Energy 2.5¢/kWh — new wind (5%, 10%, 25%, 50%, or 100% of usage) or
100 kWh blocks
—
MA Cape Light Compact (6)
Cape Light Compact Green 50% or 100%
1.768¢/kWh(for 100%
usage)
— 75% small hydro, 24% new wind or
landfill gas, 1% newsolar
—
MA MassachusettsElectric/Nantucket
Electric/CommunityEnergy
New Wind Energy50% or 100% of
usage
2.4¢/kWh — 50% small hydro, 50% new wind
Green-e
131

State Company Product Name Residential Price
Premium1
Fee Resource Mix2 Certification
MA MassachusettsElectric/Nantucket Electric/Mass EnergyConsumers Alliance
New England GreenStart 50% or 100% of usage
2.4¢/kWh (for 100% usage)
— 75% small hydro, 19% biomass, 5% wind, 1% solar (≥25% of total isnew)
—
MA MassachusettsElectric/Nantucket Electric/Sterling Planet
Sterling Premium 50% or 100% of usage
1.35¢/kWh — 50% small hydro, 30% bioenergy, 15% wind, 5% newsolar
Environmental ResourcesTrust
NJ Green Mountain Energy Company (7)
Enviro Blend 1.0¢/kWh $3.95/mo. 5% new wind, 0.4%solar, 44.6% captured methane, 50% large hydro
—
NJ PSE&G/JCP&L/ Community Energy
Clean Power Choice Program
1.3¢/kWh — 50% wind, 49% lowimpact hydro, 1% solar
—
NJ PSE&G/JCP&L/ Green Mountain Energy
Clean Power Choice Program
0.9¢/kWh — 50% wind, 50% lowimpact hydro
—
NJ PSE&G/JCP&L/ Jersey-Atlantic Wind
Clean Power Choice Program
2.9¢/kWh — 50% wind, 50% lowimpact hydro
—
NJ PSE&G/JCP&L/ Jersey-Atlantic Wind
Clean Power Choice Program: NewJersey Wind Energy
5.5¢/kWh — 100-kWh new wind —
NJ PSE&G/JCP&L/ Sterling Planet
Clean Power Choice Program
1.2¢/kWh — 33% wind, 33% small hydro, 34% bioenergy
Environmental ResourcesTrust
NY ConEdison Solutions (8) / CommunityEnergy
GREEN Power 0.5¢/kWh — 25% new wind, 75% small hydro
Green-e
NY ECONnergy Keet It Clean $.10/day for 100kWh
— 100% new wind —
$.20/day for 200kWh
NY Energy Cooperative of New York (9)
Renewable Electricity
0.5¢/kWh to 0.75¢/kWh
— 25% new wind, 75% existing landfill gas
—
NY Long Island Power Authority / CommunityEnergy
New Wind Energy 2.5¢/kWh — new wind —
NY Long Island Power Authority / CommunityEnergy
New Wind Energyand Water
1.3¢/kWh — 60% new wind, 40% small hydro
—
NY Long Island Power Authority / EnviroGen
Green Power Program
1.0¢/kWh — 75% landfill gas, 25% small hydro
—
NY Long Island Power Authority / Sterling Planet
New York Clean 1.0¢/kWh — 55% small hydro, 35% bioenergy, 10% wind
—
NY Long Island Power Authority / Sterling Planet
Sterling Green 1.5¢/kWh — 40% wind, 30% small hydro, 30% bioenergy
—
NY NYSEG/Community Energy
Catch the Wind/NewWind Energy
2.5¢/kWh — 100-kWh blocks of new wind
—
132

State Company Product Name Residential Price
Premium1
Fee Resource Mix2 Certification
NY Niagara Mohawk / Community Energy
60% New Wind Energy and 40%Small Hydro
1.0¢/kWh — 60% new wind, 40% hydro
—
NY Niagara Mohawk / Community Energy
NewWind Energy 2.0¢/kWh — new wind —
NY Niagara Mohawk / EnviroGen
Think Green! 1.0¢/kWh — 75% landfill gas, 25% hydro
—
NY Niagara Mohawk / Sterling Planet
Sterling Green 1.5¢/kWh — 40% wind, 30% small hydro, 30% bioenergy
Environmental ResourcesTrust
NY Niagara Mohawk/Green Mountain Energy
Green Mountain Energy Electricity
1.3¢/kWh — 50% small hydro, 50% wind
Green-e
NY Rochester Gas &Electric/CommunityEnergy
Catch the Wind/NewWind Energy
2.5¢/kWh — 100-kWh blocks of new wind
—
NY Suburban EnergyServices /SterlingPlanet
Sterling GreenRenewable Electricity
1.5¢/kWh — 40% new wind, 30% small hydro, 30% bioenergy
—
PA Energy Cooperative of Pennsylvania (10)
EcoChoice 100 2.78¢/kWh — 89% landfill gas, 10% wind, 1% solar
Green-e
PA Energy Cooperative of Pennsylvania (10)
Wind Energy 2.5¢/kWh — wind —
PA PECO Energy/CommunityEnergy (10)
PECO Wind 2.54¢/kWh — 100-kWh blocks of new wind
—
PA PEPCO EnergyServices (10)
Green Electricity10%, 51% or 100% of usage
3.7¢/kWh (for 100% usage)
— 100% renewable —
PA PEPCO EnergyServices (10)
NewWind Energy51% or 100% of usage
4.48¢/kWh (for 100% usage)
— 100% new wind —
RI Narragansett Electric / Community Energy, Inc.
NewWind Energy50% or 100% of usage
2.0¢/kWh — 50% small hydro, 50% new wind
Green-e
RI Narragansett Electric / People's Power & Light
New England GreenStart RI 50% or 100% of usage
1.5¢/kWh — 69% small hydro, 30% new wind, 1% new solar
Green-e
RI Narragansett Electric / Sterling Planet
Sterling Supreme100%
1.98¢/kWh — 40% small hydro, 25% biomass, 25% new solar, 10% wind
Environmental ResourcesTrust
TX Gexa Energy (11) Gexa Green -1.1¢/kWh — 100% renewable — TX Green Mountain
Energy Company (11)100% Wind Power: Reliable Rate orMonth-to-Month
1.46¢/kWh $5.34/mo. wind —
TX Green Mountain Energy Company (11)
Pollution Free:Reliable Rate orMonth-to-Month
-0.03¢/kWh $5.34/mo. wind and hydro —
TX Reliant Energy (11) Renewable Plan -1.1¢/kWh — wind — VA PEPCO Energy
Services (12)Green Electricity10%, 51% or 100% of usage
4.53¢/kWh (for 100% usage)
— landfill gas —
133

State Company Product Name Residential Price
Premium1
Fee Resource Mix2 Certification
VA PEPCO EnergyServices (12)
NewWind Energy51% or 100% of usage
5.33¢/kWh (for 100% usage)
— new wind —
VA Washington Gas Energy Services / Community Energy
New Wind EnergyCertificates
2.5¢/kWh — 100 kWh blocks of new wind
—
1 Prices updated as of July 2005 and may also apply to small commercial customers. Prices may differ for large commercial/industrial customers and may vary by service territory.2 New is defined as operating or repowered after January 1, 1999 based on the Green-e TRC certificationstandards. 3 Offered in PEPCO service territory. Product prices are for renewal customers based on annual average costs for customers in PEPCO's service territory (6.8¢/kWh).4 Price premium is for Central Maine Power service territory based on standard offer of 7.13¢/kWh.5 Product offered in Baltimore Gas and Electric and PEPCO service territories. Price is for PEPCO service territory based on price to compare of 6.55¢/kWh.6 Price premium is based on a comparison to the Cape Light Compact's standard electricity product. 7 Green Mountain Energy offers products in Conectiv, JCPL, and PSE&G service territories. Product pricesare for PSE&G (price to compare of 6.503¢/kWh). 8 Price premium is based on a comparison to ConEdison Solutions' standard electricity product in the ConEdison service territory.9 Price premium is for Niagara Mohawk service territory. Program only available in Niagara Mohawk serviceterritory. Premium varies depending on energy taxes and usage. 10 Product prices are for PECO service territory (price to compare of 6.21¢/kWh). 11 Product prices are based on price to beat of 12.1¢/kWh for TXU service territory (specifically Dallas, Texas) (Except where noted). Except for Gexa Green, which is listed in price per kWh, prices based on 1000 kwh of usage monthly, and include monthly fees. 12 Products are available in Dominion Virginia Power service territory
134
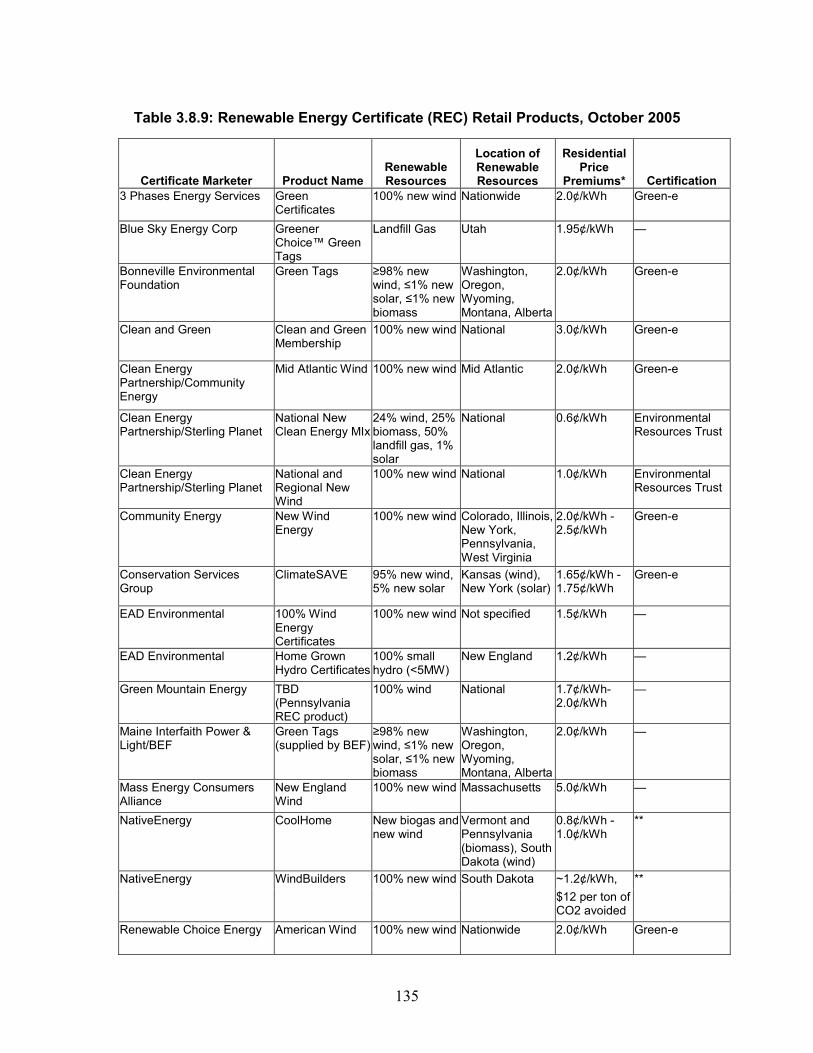
Table 3.8.9: Renewable Energy Certificate (REC) Retail Products, October 2005
Certificate Marketer Product NameRenewable Resources
Location of Renewable Resources
Residential Price
Premiums* Certification 3 Phases Energy Services Green
Certificates100% new wind Nationwide 2.0¢/kWh Green-e
Blue Sky Energy Corp Greener Choice™ Green Tags
Landfill Gas Utah 1.95¢/kWh —
Bonneville EnvironmentalFoundation
Green Tags ≥98% newwind, ≤1% newsolar, ≤1% newbiomass
Washington, Oregon, Wyoming,Montana, Alberta
2.0¢/kWh Green-e
Clean and Green Clean and Green Membership
100% new wind National 3.0¢/kWh Green-e
Clean EnergyPartnership/CommunityEnergy
Mid Atlantic Wind 100% new wind Mid Atlantic 2.0¢/kWh Green-e
Clean EnergyPartnership/Sterling Planet
National NewClean Energy MIx
24% wind, 25% biomass, 50% landfill gas, 1% solar
National 0.6¢/kWh Environmental Resources Trust
Clean EnergyPartnership/Sterling Planet
National and Regional NewWind
100% new wind National 1.0¢/kWh Environmental Resources Trust
Community Energy New Wind Energy
100% new wind Colorado, Illinois, New York, Pennsylvania, West Virginia
2.0¢/kWh -2.5¢/kWh
Green-e
Conservation ServicesGroup
ClimateSAVE 95% new wind, 5% new solar
Kansas (wind), New York (solar)
1.65¢/kWh - 1.75¢/kWh
Green-e
EAD Environmental 100% WindEnergyCertificates
100% new wind Not specified 1.5¢/kWh —
EAD Environmental Home Grown Hydro Certificates
100% small hydro (<5MW)
New England 1.2¢/kWh —
Green Mountain Energy TBD(Pennsylvania REC product)
100% wind National 1.7¢/kWh-2.0¢/kWh
—
Maine Interfaith Power & Light/BEF
Green Tags (supplied by BEF)
≥98% newwind, ≤1% newsolar, ≤1% newbiomass
Washington, Oregon, Wyoming,Montana, Alberta
2.0¢/kWh —
Mass Energy Consumers Alliance
New England Wind
100% new wind Massachusetts 5.0¢/kWh —
NativeEnergy CoolHome New biogas and new wind
Vermont and Pennsylvania (biomass), South Dakota (wind)
0.8¢/kWh -1.0¢/kWh
**
NativeEnergy WindBuilders 100% new wind South Dakota ~1.2¢/kWh, ** $12 per ton of CO2 avoided
Renewable Choice Energy American Wind 100% new wind Nationwide 2.0¢/kWh Green-e
135

Certificate Marketer Product NameRenewable Resources
Location of Renewable Resources
Residential Price
Premiums* Certification Renewable Ventures PVUSA Solar
Green Certificates
100% solar California 3.3¢/kWh Green-e
SKY energy, Inc. Wind-eRenewable Energy
100% new wind Nationwide 2.4¢/kWh Green-e
Sterling Planet Green America 45% new wind, 50% newbiomass, 5% new solar
Nationwide 1.6¢/kWh Green-e
TerraPass Inc. TerraPass Various(including efficiency andCO2 offsets)
Nationwide ~$11/ton CO2 —
Waverly Light & Power Iowa EnergyTags
100% wind Iowa 2.0¢/kWh —
WindCurrent Chesapeake Windcurrent
100% new wind Mid-Atlantic States
2.5¢/kWh Green-e
Premium may also apply to small commercial customers. Large users may be able to negotiate price premiums. Most product prices are as of July 2005. ** The Climate Neutral Network certifies the methodology used to calculate the CO2 emissions offset. NA = Not applicable.
136

3.9 – Federal Agency Purchases of Green Power The federal government exceeded its goal of obtaining 2.5% of its electricity needs from renewable energy sources by September 30, 2005. The federal renewable energy goal was established under Executive Order 13123, issued by President Clinton in 1999. The federal government, which is the nation's largest energy consumer, purchases 2.375 billion kWh of renewable energy annually.
The Energy Policy Act of 2005, signed into law by President Bush on August 8, 2005, establishes a new set of federal renewable energy goals, calling for agencies to derive 3%of their electric energy from renewable sources in fiscal years 2007 through 2009, increasing to 5% in fiscal years 2010 through 2012, and 7.5% by 2013 and each fiscal year thereafter.
137

3.10 – State Incentive Programs Many states have policies or programs in place to support renewable energy resources, such as tax incentives; industry recruitment incentives; or grant, loan, or rebate programs. The following table lists the incentives currently available by state (Table 3.10.1).
Table 3.10.1 Financial Incentives for Renewable Energy Resources by State
State Tax Incentives Grants, Loans, Rebates and Other Incentives AL Wood-Burning Heating System
Deduction (Personal) Renewable Fuels Development Program (Biomass, Municipal SolidWaste)
AK Power Project Loan FundAZ Qualifying Wood Stove Deduction;
Solar and Wind Energy Systems Credit (Personal); Solar and Wind Equipment Sales Tax Exemption (Personal)
APS – EPS Credit Purchase Program; SRP – Earthwise Solar Energy; TEP – SunShare PV Buydown; UES – SunShare PVBuydown
AR CA Solar or Wind Energy System
Credit – Personal; Tax Deduction for Interest on Loans for EnergyEfficiency; Solar or Wind EnergySystem Credit – Corporate; California Property Tax Exemption for Solar Systems
Emerging Renewable (Rebate) Program; SELFGEN – SELF-Generation Program; Anaheim Public Utilities – PV Buydown Program; Burbank Water & Power – Residential & Commercial Solar Support; City of Palo Alto Utilities – PV Partners; Glendale Water & Power – Solar Solutions Program; IID Energy – PV Solutions Rebate Program; LADWP – Solar Incentive Program; Pasadena Water and Power – Solar Power Installation Rebate; Redding Electric – Earth Vantage Renewable Energy RebateProgram; Riverside Public Utilities – Energy Efficiency Construction Incentive; Riverside Public Utilities – Residential PhotovoltaicIncentive Program; Roseville Electric – PV Buy Down Program; SMUD Commercial/Industrial PV Rebate; SMUD – PV Pioneers Residential Buy-Down; SMUD – Solar Water Heater ProgramRebate; Ukiah Utilities – PV Buy-Down Program
Marin County – Solar Rebate Program; San Diego – ResidentialSolar Electric Incentive for Homes Destroyed in Wildfires
Santa Monica – Green Building Grant Program; SMUD – Solar Water Heater Loan Program;
Supplemental Energy Payments (SEPs)
CO Utility PV Rebate; Holy Cross Energy WE CARE Rebates
Aspen Solar Pioneer Program - Solar Hot Water Rebate; Gunnison County Electric - Renewable Energy Resource Loan; Aspen Solar Pioneer Program - Zero-Interest Loan
Colorado - Aspen - Grid-Tied Micro Hydro Production Incentive CT Local Option for Property Tax Residential Solar PV Rebate Program; Connecticut - Commercial,
Industrial, Institutional PV Grant Program; Connecticut - NewEnergy Technology Program; Energy Conservation Loan; Operational Demonstration Program; Renewable Energy Projects in Pre-Development Program
DE Green Energy Program Rebates; Research and Development Grants; Technology and Demonstration Grants
DC District of Columbia Renewable Demonstration Project FL Solar Energy Equipment
Exemption Florida - Gainesville Regional Utilities - Solar Rebate Program; Florida - JEA - Solar Incentive Program
GA
138

State Tax Incentives Grants, Loans, Rebates and Other Incentives HI Residential Solar and Wind
Energy Credit; Corporate Solar and Wind Energy Credit
HECO, MECO, HELCO - Energy $olutions Solar Water Heater Rebate; Kaua'i Island Utility Cooperative - Commercial Solar Water Heating Program; Oahu - Energy $olutions Honolulu Solar Roofs Initiative Loan Program; Kauai County - Solar Water Heating Loan Program; Maui County - Maui Solar Roofs Initiative Loan Program for Solar Water Heating
ID Solar, Wind, and GeothermalDeduction (Personal)
Renewable Energy Equipment Sales Tax Refund; BEF - Renewable Energy Grant; BEF – Solar 4R Schools; Low-Interest Loans for Renewable Energy Resource Program
IL Special Assessment forRenewable Energy Systems
Illinois Clean Energy Community Foundation Grants
IN Renewable Energy Systems Exemption
Alternative Power & Energy Grant Program; Distributed GenerationGrant Program (DGGP); Energy Education and Demonstration Grant Program; Energy Efficiency and Renewable Energy (EERE) Set-Aside
IA Renewable Energy ProductionTax Credit (Personal); Renewable Energy Production Tax Credit (Corporate); Wind EnergyEquipment Exemption; Local Option Special Assessment ofWind Energy Devices; Methane Gas Conversion Property TaxExemption; Property TaxExemption for Renewable EnergySystems
Grants for Energy Efficiency and Renewable Energy Research; Alternate Energy Revolving Loan Program; Iowa Building EnergyManagement Program (Iowa Energy Bank)
KS Renewable Energy Property TaxExemption
State Energy Program Grants
KY Solar Water Heater Loan Program LA Solar Energy System Exemption ME Solar Rebate Program; Renewable Resources Matching Fund
Program MD Personal Income Tax Credit for
Green Buildings; Corporate Income Tax Credit for Green Buildings; Wood Heating Fuel Exemption; Local Option - Corporate Property Tax Credit; Special Property Assessment
Solar Energy Grant Program; Community Energy Loan Program; State Agency Loan Program; Montgomery County – Clean EnergyRewards Program
MA Alternative Energy and EnergyConservation Patent Exemption (Personal); Renewable EnergyState Income Tax Credit; Alternative Energy and EnergyConservation Patent Exemption (Corporate); Solar and WindEnergy System Deduction; Solar and Wind Power Systems Excise Tax Exemption; Renewable Energy Equipment Sales TaxExemption; Local Property TaxExemption
Commercial, Industrial, & Institutional Initiative Grants; Small Renewables Initiative Rebate; Matching Grants for Communities
MI Alternative – Energy Personal Property Tax Exemption;
Community Energy Project Grants; Energy Efficiency Grants; Large-Scale PV Demonstration Project Grants; Michigan Biomass EnergyProgram Grants; Solar Domestic Hot Water System Rebate Program; Small Business P2 Loan Program
MN Solar-Electric (PV) Sales TaxExemption; Wind Sales TaxExemption; Wind and Solar-
State of Minnesota Solar-Electric (PV) Rebate Program; Great River Energy - Solar-Electric (PV) Rebate Program; Minnesota Power Solar-Electric (PV) Rebate Program; Renewable Development Fund
139
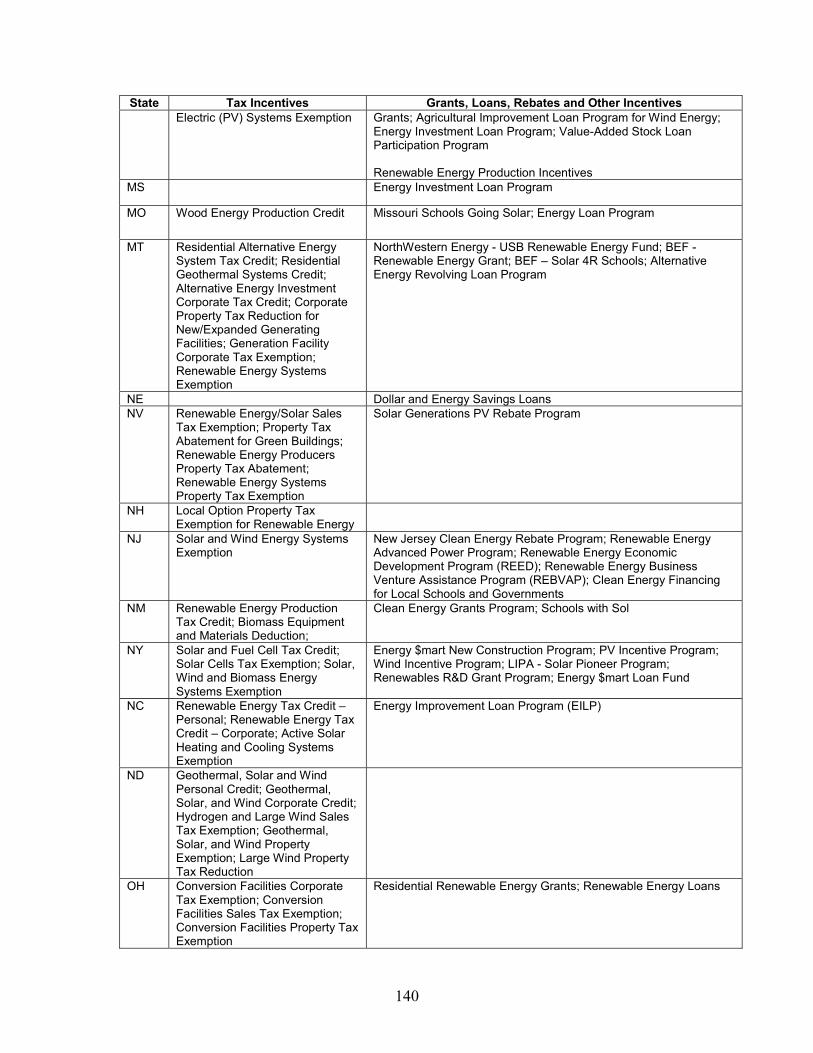
State Tax Incentives Grants, Loans, Rebates and Other Incentives Electric (PV) Systems Exemption Grants; Agricultural Improvement Loan Program for Wind Energy;
Energy Investment Loan Program; Value-Added Stock Loan Participation Program
Renewable Energy Production Incentives MS Energy Investment Loan Program
MO Wood Energy Production Credit Missouri Schools Going Solar; Energy Loan Program
MT Residential Alternative EnergySystem Tax Credit; Residential Geothermal Systems Credit; Alternative Energy InvestmentCorporate Tax Credit; Corporate Property Tax Reduction for New/Expanded GeneratingFacilities; Generation FacilityCorporate Tax Exemption; Renewable Energy Systems Exemption
NorthWestern Energy - USB Renewable Energy Fund; BEF -Renewable Energy Grant; BEF – Solar 4R Schools; Alternative Energy Revolving Loan Program
NE Dollar and Energy Savings Loans NV Renewable Energy/Solar Sales
Tax Exemption; Property TaxAbatement for Green Buildings; Renewable Energy ProducersProperty Tax Abatement; Renewable Energy Systems Property Tax Exemption
Solar Generations PV Rebate Program
NH Local Option Property TaxExemption for Renewable Energy
NJ Solar and Wind Energy Systems Exemption
New Jersey Clean Energy Rebate Program; Renewable EnergyAdvanced Power Program; Renewable Energy EconomicDevelopment Program (REED); Renewable Energy BusinessVenture Assistance Program (REBVAP); Clean Energy Financing for Local Schools and Governments
NM Renewable Energy ProductionTax Credit; Biomass Equipment and Materials Deduction;
Clean Energy Grants Program; Schools with Sol
NY Solar and Fuel Cell Tax Credit; Solar Cells Tax Exemption; Solar, Wind and Biomass EnergySystems Exemption
Energy $mart New Construction Program; PV Incentive Program; Wind Incentive Program; LIPA - Solar Pioneer Program; Renewables R&D Grant Program; Energy $mart Loan Fund
NC Renewable Energy Tax Credit – Personal; Renewable Energy TaxCredit – Corporate; Active Solar Heating and Cooling Systems Exemption
Energy Improvement Loan Program (EILP)
ND Geothermal, Solar and Wind Personal Credit; Geothermal,Solar, and Wind Corporate Credit; Hydrogen and Large Wind Sales Tax Exemption; Geothermal,Solar, and Wind PropertyExemption; Large Wind PropertyTax Reduction
OH Conversion Facilities Corporate Tax Exemption; Conversion Facilities Sales Tax Exemption;Conversion Facilities Property TaxExemption
Residential Renewable Energy Grants; Renewable Energy Loans
140

State Tax Incentives Grants, Loans, Rebates and Other Incentives OK Zero-Emission Facilities
Production Tax Credit OR Residential Energy Tax Credit;
Business Energy Tax Credit; Renewable Energy Systems Exemption
Energy Trust Solar Electric Buy-Down Program; Energy Trust Solar Water Heating Buy-Down Program; Ashland - Solar ElectricProgram; Ashland Electric Utility - The Bright Way to Heat Water Rebate; EPUD - Solar Water Heater Program Rebate; EWEB - Energy Management Services Rebate; EWEB - The Bright Way ToHeat Water Rebate; OTEC - Photovoltaic Rebate Program; EnergyTrust Open Solicitation Program; BEF - Renewable Energy Grant; BEF – Solar 4R Schools; Small Scale Energy Loan Program (SELP); Ashland Electric Utility - The Bright Way to Heat Water Loan; EPUD - Solar Water Heater Program Loan; EWEB - EnergyManagement Services Loan; EWEB - The Bright Way To Heat Water Loan
PA Sustainable Development Fund Solar PV Grant Program (PECO Territory); Pennsylvania Energy Harvest Grant Program; Metropolitan Edison Company SEF Grants (FirstEnergy Territory); Penelec SEF of the Community Foundation for the Alleghenies Grant Program (FirstEnergy Territory); SEF of Central Eastern Pennsylvania Grant Program (PP&L Territory); Sustainable Development Fund Grant Program (PECO Territory); West Penn Power SEF Grant Program; Metropolitan Edison Company SEF Loans (FirstEnergy Territory); Penelec SEF of the CommunityFoundation for the Alleghenies Loan Program (FirstEnergyTerritory); SEF of Central Eastern Pennsylvania Loan Program (PP&L Territory); Sustainable Development Fund Commercial Financing Program (PECO Territory); West Penn Power SEF Commercial Loan Program
RI Residential Renewable EnergyTax Credit; Renewable EnergySales Tax Exemption; Solar Property Tax Exemption
PV & Wind Rebate Program; Small Customer Incentive Program for Green Power Marketers; RFP for Purchase/Sale of Renewable Electricity to Large Customers
Renewable Generation Supply Incentive SC Residential Solar Initiative for EarthCraft Homes Rebate SD Renewable Energy Systems
Exemption; Wind Energy PropertyTax Exemption
TN Wind Energy Systems Exemption Small Business Energy Loan Program
TX Solar Energy Device Franchise Tax Deduction; RenewableEnergy Systems Property TaxExemption
Austin Energy - Home Energy Air Conditioning and Appliance Rebates; Austin Energy - Solar Rebate Program
UT Renewable Energy Systems TaxCredit – Personal; Renewable Energy Systems Tax Credit – Corporate; Renewable EnergySales Tax Exemption
VT Sales Tax Exemption Solar & Small Wind Incentive Program; CVPS Biomass GrantsVA Local Option Property Tax
Exemption for Solar Virginia Small Wind Incentives Program (VSWIP)
WA Sales and Use Tax Exemption Clallam County PUD - Solar Rebate Program; Clark Public Utilities– Solar Water Heater Rebate Program; Grays Harbor PUD - Solar Water Heating Rebate; Klickitat PUD – Solar Rebate; Orcas Power & Light - Photovoltaic Rebate; Puget Sound Energy - Solar PVSystem Rebate; Franklin PUD – Photovoltaic and Solar Water Heating Rebate;
WV Tax Exemption for Wind EnergyGeneration; Special Assessment for Wind Energy Systems
141

State Tax Incentives Grants, Loans, Rebates and Other Incentives WI Solar and Wind Energy
Equipment Exemption Focus on Energy - Cash-Back Reward; Wisconsin Public Power, Inc. – Residential Renewable Energy Rebate; Focus on Energy - Grant Programs; Focus on Energy – Zero-Interest Loans; Wisconsin Public Power, Inc. – Residential Renewable Energy Loan
WY Renewable Energy Sales TaxExemption
Photovoltaic Incentive Program
Source: North Carolina Solar Center, Database of State Incentives for Renewable Energy,http://www.dsireusa.org/summarytables/financial.cfm?&CurrentPageID=7, November 2005.
142

Table 4.1 – Projections of Renewable Electricity Net Capacity(Gigawatts)
Data Sources Projections Renewable Energy 2006 2010 2015 2020 2025 2030 Geothermal AEO2006 - Reference Case 2.23 2.56 3.19 4.61 6.02 6.64
AEO2006 - High Renewables 2.80 6.19 9.14 EERE GPRA FY07 2.21 2.61 3.53 4.88
Wind AEO2006 - Reference Case 11.56 16.27 17.71 18.81 19.80 20.10 AEO2006 - High Renewables 16.27 18.87 22.63 EERE GPRA FY07 8.91 18.98 77.66 135.85
Solar1 AEO2006 - Reference Case 0.67 1.17 1.31 1.47 1.71 2.62 AEO2006 - High Renewables 1.17 1.47 2.87 EERE GPRA FY07 1.97 6.27 31.16 68.86
Hydroelectric AEO2006 - Reference Case 78.31 78.32 78.37 78.53 78.53 78.53 AEO2006 - High Renewables 78.33 78.41 78.76 EERE GPRA FY07 79.21 79.21 79.21 79.21
Biomass/Wood (excludes cogen) AEO2006 - Reference Case 2.09 2.15 2.15 2.46 3.45 4.63
AEO2006 - High Renewables 2.20 3.96 10.55 EERE GPRA FY07 1.83 2.01 2.62 4.57
MSW and LFG AEO2006 - Reference Case 3.55 3.78 3.92 4.02 4.11 4.14 AEO2006 - High Renewables 3.79 4.03 4.14 EERE GPRA FY072 3.83 3.84 3.92 3.93
Total Renewable Energy AEO2006 - Reference Case 102.92 109.26 112.12 115.93 120.21 123.95 AEO2006 - High Renewables 109.82 119.81 137.09 EERE GPRA FY073 98.54 115.53 196.25 225.38
Sources: EIA Annual Energy Outlook 2006, DOE/EIA-0383 (2006) (Washington, D.C., February 2006), Tables A16 and D7. Total Renewable Capacity GPRA projections provided by OnLocation, February 2006. Notes: OnLocation GPRA07 benefits estimates do not estimate any programmatic influence on biomass power, because the Biomass Program has been redirected away from biomass power to integrated biorefinery technologies. “Total” represents portfolio case values, while individual program values represent each program case. The portfolio case accounts for program interactions and micro-price feedback effects. The GPRA FY07 modeling effort uses the NEMS model, which uses the EIA AEO 2005 as the baseline for its analysis. 1 Solar-thermal and photovoltaic energy. 2 EERE does not have an R&D program for biomass, LFG/MSW, so they are not included in GPRA projections. 3 Biomass, MSW, and LFG are not included in the portfolio value. The portfolio values do not equal the summed values of the individual programs, as the portfolio analysis accounts for program interactions and micro-price feedback effects. Total includes biomass combined heat and power and on-site electricity-only plants for industrial and commercial sectors not detailed above.
143

Table 4.2 – Projections of Renewable Electricity Net Generation (Billion Kilowatthours)
Renewable Energy Geothermal
Data Sources
AEO2006 - Reference Case 2006
14.91 2010
17.51
Projections 2015 2020
22.84 34.01 2025
46.74 2030
52.70 AEO2006 - High Renewables EERE GPRA FY07
19.16 12.30 15.60
47.91 23.50 35.00
73.01
Wind AEO2006 - Reference Case 35.25 50.87 55.98 59.82 63.48 64.51 AEO2006 - High Renewables 50.87 59.97 73.90 EERE GPRA FY07 25.80 64.60 309.40 558.60
Solar1 AEO2006 - Reference Case 1.19 2.35 2.69 3.10 3.68 5.71 AEO2006 - High Renewables 2.36 3.10 6.25 EERE GPRA FY07 3.90 12.80 63.10 151.10
Hydroelectric AEO2006 - Reference Case 293.13 301.40 301.82 302.87 303.06 303.27 AEO2006 - High Renewables 301.40 302.15 304.46 EERE GPRA FY07 303.60 303.70 304.00 304.30
Biomass/Wood (without cogeneration) AEO2006 - Reference Case 18.87 44.67 44.80 48.59 51.30 57.83
AEO2006 - High Renewables 45.45 59.94 95.96 EERE GPRA FY07 27.20 29.60 32.10 39.30
MSW and LFG AEO2006 - Reference Case 25.29 27.13 28.20 29.06 29.75 30.03 AEO2006 - High Renewables 27.13 29.08 30.04 EERE GPRA FY072 27.70 27.80 28.50 28.60
Total Renewable Energy AEO2006 - Reference Case 417.45 475.75 490.86 515.15 539.06 559.14 AEO2006 - High Renewables 479.65 544.91 638.67 EERE GPRA FY073 400.70 454.70 742.60 927.90
Sources: EIA Annual Energy Outlook 2006, DOE/EIA-0383 (2006) (Washington, D.C., February 2006), Tables A16 and D7. Renewable generation GPRA projections provided by OnLocation, February 2006. Notes: OnLocation GPRA07 benefits estimates do not estimate any programmatic influence on biomass power, because the Biomass Program has been redirected away from biomass power to integrated biorefinery technologies. “Total” represents portfolio case values, while individual program values represent each program case. The portfolio case accounts for program interactions and micro-price feedback effects. The GPRA FY07 modeling effort uses the NEMS model, which uses the EIA AEO 2005 as the baseline for its analysis. 1 Solar-thermal and photovoltaic energy. 2 EERE does not have an R&D program for biomass, LFG/MSW, so they are not included in GPRA projections. 3 Biomass, MSW, and LFG are not included in the portfolio value. The portfolio values do not equal the summed values of the individual programs, as the portfolio analysis accounts for program interactions and micro-price feedback effects.
144

Table 4.3 – Projections of Renewable Electricity Carbon Dioxide Emissions Savings (Million Metric Tons Carbon Equivalent per Year)
Data Sources Projections 2006 2010 2015 2020 2025 2030
Renewable Energy Geothermal AEO2006 - Reference Case 2.87 3.48 4.22 5.59 7.17 6.88
AEO2006 - High Renewables 3.81 7.87 9.53 EERE GPRA FY07 2.44 2.88 3.86 5.37
Wind AEO2006 - Reference Case 6.79 10.10 10.34 9.83 9.74 8.42 AEO2006 - High Renewables 10.10 9.85 9.65 EERE GPRA FY07 5.12 11.93 50.84 85.69
Solar1 AEO2006 - Reference Case 0.23 0.47 0.50 0.51 0.56 0.75 AEO2006 - High Renewables 0.47 0.51 0.82 EERE GPRA FY07 0.77 2.36 10.37 23.18
Hydroelectric AEO2006 - Reference Case 56.43 59.86 55.75 49.77 46.49 39.60 AEO2006 - High Renewables 59.86 49.65 39.75 EERE GPRA FY07 60.30 56.10 49.96 46.68
Biomass/Wood AEO2006 - Reference Case 3.63 8.87 8.27 7.98 7.87 7.55 AEO2006 - High Renewables 9.03 9.85 12.53 EERE GPRA FY07 5.40 5.47 5.27 6.03
MSW and LFG AEO2006 - Reference Case 4.87 5.39 5.21 4.78 4.56 3.92 AEO2006 - High Renewables 5.39 4.78 3.92 EERE GPRA FY072 5.50 5.13 4.68 4.39
Total Renewable Energy AEO2006 - Reference Case 80.36 94.49 90.67 84.65 82.69 73.00 AEO2006 - High Renewables 95.27 89.54 83.39 EERE GPRA FY073 79.59 83.99 122.03 142.34
Heat Rate Btu/kWh 10,796 10,593 9,019 8,266 7,891 6,872
Carbon Coefficient MMTCE/Tbtu 0.01783 0.01875 0.02048 0.01988 0.01944 0.01900
Sources: Generation data: EIA Annual Energy Outlook 2006, DOE/EIA-0383 (06) (Washington, D.C., February 2006), Tables A16 and F8. Renewable generation GPRA projections provided by OnLocation, February 2006. Heat Rate and Carbon Coefficienct data based on GPRA 2003 Data Call. Carbon emission coefficients and heat rates for 2006-2025: U.S. Department of Energy, GPRA2003 Data Call, Appendix B, pages B-13 and B-16, (September 14, 2001). 2030 values are NREL estimates based on trend.
145

Notes: Carbon emissions savings based on calculation: (10^9 kWh) * (Btu/kWh) * (TBtu/10^12 Btu) * (MMTCE/TBtu)
1 Solar-thermal and photovoltaic energy. 2 EERE does not have an R&D program for LFG/MSW, so they are not included in GPRA projections 3 Biomass, MSW, and LFG are not included in the portfolio value. The portfolio values do not equal the summed values of the individual programs, as the portfolio analysis accounts for program interactions and micro-price feedback effects.
146

Table 5.1 – U.S. Total and Delivered Energy (Overview) (Quadrillion Btu per year)
1980 1990 2000 2001 2002 2003 2004 7 2010 2015 2020 2025 2030
Total Consumption by Source 1
Petroleum 2 34.20 33.55 38.26 38.19 38.23 38.81 39.83 43.14 45.69 48.14 50.57 53.58 Natural Gas 20.39 19.74 23.91 22.90 23.62 23.07 22.98 24.04 26.67 27.70 27.78 27.66 Coal3 15.39 19.58 23.54 22.91 23.10 23.48 23.66 25.09 25.66 27.65 30.89 34.49 Nuclear 2.74 6.10 7.86 8.03 8.14 7.96 8.23 8.44 8.66 9.09 9.09 9.09 Renewable4 5.49 6.13 6.16 5.33 5.84 6.08 6.12 7.08 7.43 8.00 8.61 9.02 Other 5 0.07 -0.03 0.06 -0.02 -0.01 -0.07 0.04 0.07 0.08 0.05 0.05 0.05 Total Primary 78.29 84.71 98.96 96.47 97.87 98.31 99.73 107.87 114.18 120.63 126.99 133.88 Total Consumption by Sector Residential 15.85 17.06 20.53 20.29 20.91 21.20 21.18 22.99 24.07 25.17 25.88 26.64 Commercial 10.59 13.32 17.18 17.37 17.58 17.45 17.51 19.51 21.23 23.02 24.82 26.73 Industrial 32.15 31.90 34.70 32.53 32.53 32.56 33.25 34.46 35.60 36.95 38.77 40.58 Transportation 19.70 22.42 26.55 26.28 26.85 27.10 27.79 30.90 33.29 35.50 37.52 39.93 Total Primary6 78.29 84.71 98.96 96.47 97.87 98.31 99.73 107.87 114.18 120.63 126.99 133.88 Delivered Consumption by Sector Residential 7.50 6.60 7.20 6.91 6.89 7.19 7.02 12.25 12.81 13.31 13.64 14.04 Commercial 4.10 3.85 4.22 4.04 4.10 4.26 4.07 9.00 9.85 10.66 11.50 12.44 Industrial 22.67 21.21 22.80 21.80 21.77 21.48 22.08 26.67 27.72 28.91 30.58 32.19 Transportation 19.66 22.37 26.49 26.22 26.79 27.03 27.71 30.70 33.09 35.30 37.31 39.72 Total Delivered6 53.93 54.03 60.72 58.96 59.54 59.95 60.88 78.62 83.46 88.19 93.04 98.40
Sources: EIA, Annual Energy Outlook 2006, DOE/EIA-0383(2006) (Washington, D.C., February 2006), Tables A1 and A2; EIA, Annual Energy Review 2004, DOE/EIA-0384(2004) (Washington, D.C., August 2005), Tables 2.1a-f.
Notes: 1 For historical figures, these values include the electric-power sector's consumption. 2 Includes natural gas plant liquids, crude oil consumed as a fuel, and nonpetroleum-based liquids for blending, such as ethanol. 3 Includes coal in all sectors, as well as net imports of coal coke in the industrial sector. 4 Includes grid-connected electricity from conventional hydroelectric; wood and wood waste; landfill gas; municipal solid waste; other biomass; wind;photovoltaic and solar-thermal sources; nonelectric energy from renewable sources, such as active and passive solar systems, and wood forresidential heating; and both the ethanol and gasoline components of E85 (which, due to seasonal adjustments in mix, is E74, on average), but not lower percentage blends of ethanol (e.g. E10). Excludes electricity imports using renewable sources and nonmarketed renewable energy.

7
5 For historical figures, this value includes hydroelectric pumped storage and electricity net imports – except in 2004, where it only shows electricitynet imports (AER 2004 no longer includes hydroelectric pumped storage). For forecasted figures, this value includes net electricity imports, methanol,and liquid hydrogen. 6 For historical figures, this value does not include the electric-power sector's consumption. All 2004 figures are preliminary.

Table 5.2 – Electricity Flow Diagram (Quadrillion Btu)
Source: EIA, Annual Energy Review 2004, DOE/EIA-0384(2004) (Washington, D.C., August 2005), Diagram 5. Notes: a Blast furnace gas, propane gas, and other manufactured e Electric energy used in the operation of power plants, estimated as 5% of gross and waste gases derived from fossil fuels. generation. b Batteries, chemicals, hydrogen, pitch, purchased steam, f Transmission and distribution losses (electricity losses that occur between the sulfur and miscellaneous technologies. point of generation and delivery to the customer) are estimated as 9% of gross
generation.

c Estimated as net generation divided by 0.95. g Use of electricity that is 1) self-generated, 2) produced by either the same entity that consumes the power or an affiliate, and 3) used in direct support of a service or industrial process located within the same facility or group of facilities that house the generating equipment. Direct use is exclusive of station use.
d Data collection frame differences and sampling error.Totals may not equal sum of components, due to independent rounding.

Table 5.3 – Electricity Overview(Billion Kilowatthours, unless otherwise noted)
1980 1990 2000 2001 2002 2003 2004 7 2010 2015 2020 2025 2030
Electric-Power Sector Generation1 2,286 2,901 3,638 3,580 3,698 3,721 3,794 4,196 4,501 4,827 5,121 5,497 End-Use Sector Generation 3 137 164 157 160 162 160 192 226 280 370 429 Total Generation 2,290 3,038 3,802 3,737 3,858 3,883 3,953 4,388 4,727 5,108 5,491 5,926
Capability (gigawatts) Electric-Power Sector2 579 710 782 819 876 919 938 988 965 1,027 1,098 1,186 End-Use Sector3 NA 24 30 29 29 30 30 32 37 44 56 64 Total Capability 579 734 812 848 905 949 968 1,021 1,002 1,072 1,154 1,250
Imports from Canada/Mexico 25 18 49 39 36 30 34 42 41 29 28 27 Exports to Canada/Mexico 4 16 15 16 14 24 22 21 18 15 13 13 Loss and Unaccounted for4 216 203 243 226 253 233 248 NA NA NA NA NA
Retail Sales 5 2,094 2,713 3,421 3,370 3,463 3,488 3,551 3,978 4,300 4,629 4,956 5,341 Direct Use 6 NA 125 171 163 166 168 166 177 192 214 252 278 Total Use 2,094 2,838 3,592 3,533 3,629 3,656 3,717 4,155 4,491 4,844 5,208 5,619
Sources: EIA, Annual Energy Outlook 2006, DOE/EIA-0383(2006) (Washington, D.C., February 2005), Tables A8, A9, and A10; EIA, Annual Energy Review 2004, DOE/EIA-0384(2004) (Washington, D.C., August 2005), Tables 8.1, 8.11a, 8.11b, and 8.11d. Notes: 1 Electricity-only and combined-heat-and-power (CHP) plants within the NAICS 22 category whose primary business is to sell electricity – orelectricity and heat – to the public.Through 1988, data are for electric utilities only; beginning in 1989, data are for electric utilities and independent power producers.2 Through 1988, data are for net summer capacity at electric utilities only. Beginning in 1989, data also include net summer capacity at independent power producers. All data after 1989 include electric-sector combined-heat-and-power (CHP) plants.3 Commercial and industrial combined-heat-and-power (CHP) and electricity-only plants; and small on-site generating systems in the residential,commercial, and industrial sectors used primarily for own-use generation, but which may also sell some power to the grid. Data begins in 1989. 4 Electricity losses that occur between the point of generation and delivery to the customer, and data collection frame differences and nonsampling error.5 Electricity retail sales to ultimate customers reported by electric utilities and other energy-service providers.6 Commercial and industrial facility use of on-site net electricity generation; and electricity sales among adjacent or colocated facilities for which revenue information is not available. NA = not available

Table 5.4 – Consumption of Fossil Fuels by Electric Generators 1980 1990 2000 2001 2002 2003 2004 8 2010 2015 2020 2025 2030
Coal (million short tons) 1 569 781 983 962 975 1,003 1,013 1,140 1,161 1,235 1,354 1,502 Distillate Fuel Oil (million barrels) 2 29 16 30 29 22 27 18 40 40 41 44 46 Residual Fuel Oil (million barrels) 3 391 183 138 159 105 137 141 117 116 117 118 128 Petroleum Coke (million short tons) 0.2 1.0 3.2 3.3 5.7 5.7 6.8 NA NA NA NA NA Other Liquids (million barrels) 4 NA 0.02 0.4 0.4 1.2 1.9 2.0 NA NA NA NA NA Total Petroleum (million barrels) 5 421 205 184 205 156 195 195 157 156 158 162 173 Natural Gas (billion cubic feet) 3,682 3,147 5,014 5,142 5,408 4,909 5,217 5,509 7,142 7,459 7,052 6,381 Stocks of Coal and Petroleum (end of year) 6
Coal (million short tons) 183 156 102 138 142 122 107 NA NA NA NA NA Petroleum (million barrels) 7 136 84 41 57 52 53 50 NA NA NA NA NA Sources: EIA, Annual Energy Outlook 2006, DOE/EIA-0383(2006) (Washington, D.C., February 2006), Tables A2, A13, and A15; EIA, Annual Energy Review 2004, DOE/EIA-0384(2004) (Washington, D.C., August 2005), Table 8.5b and 8.8. Notes: Data is for electric-power sector consumption only. Data include fuel consumption to produce electricity by combined-heat-and-power plants. Through 1988, consumption data are for electric utilities only. Beginning in 1989, consumption data also include independent power producers. 1 Anthracite, bituminous coal, subbituminous coal, lignite, waste coal, and synthetic coal. 2 Light fuel oil (Nos. 1, 2, and 4). For 1949-1979, data are for gas turbine and internal combustion plant use of petroleum. For 1980-2000, electric utility data also include small amounts of kerosene and jet fuel. Forecast values calculated from quadrillion Btu using conversion factor 5.825 MMBtu/barrel. 3 Heavy fuel oil (Nos. 5 and 6). For 1949-1979, data are for steam plant use of petroleum. For 1980-2000, electric utility data alsoinclude a small amount of fuel oil No. 4. Forecast values calculated from quadrillion Btu using conversion factor 6.287 MMBtu/barrel.4 Jet fuel, kerosene, other petroleum liquids, and waste oil. 5 Petroleum coke is converted from short tons to barrels by multiplying by 5.In forecasted values, total petroleum is calculated sum.6 Through 1998, data are for electric utilities only. Beginning in 1999, data are for electric utilities and independent power producers.7 Includes distillate fuel oil, residual fuel oil, other liquids, and petroleum coke. 8 All 2004 figures are preliminaryNA = not available

Table 5.5 – Electric-Power Sector Energy Consumption (Trillion Btu)
1980 1990 2000 2001 2002 2003 2004 5
Coal 12,123 16,235 20,185 19,494 19,733 20,137 20,227 Natural Gas 3,810 3,224 5,120 5,271 5,522 5,009 5,351 Petroleum 2,634 1,281 1,145 1,270 955 1,199 1,196 Other Gas 1 NA 6 19 9 25 30 30 Total Fossil Fuels 18,567 20,746 26,470 26,044 26,235 26,374 26,804 Nuclear Electric Power 2,739 6,104 7,862 8,033 8,143 7,959 8,232 Hydroelectric Pumped Storage 2 --- -36 -57 -90 -88 -88 -- 6
Conventional Hydroelectric 2,867 3,014 2,768 2,209 2,650 2,781 2,673 Wood 3 106 126 116 141 156 158 Waste 2 180 294 314 353 337 334 Geothermal 110 326 296 289 305 303 302 Solar 3 NA 4 5 6 6 5 6 Wind NA 29 57 70 105 115 143 Total Renewable Energy 2,982 3,658 3,547 3,003 3,560 3,697 3,616 Electricity Imports 71 8 115 75 78 22 39 Other 4 NA 0.08 1.28 0.00 6.96 15.57 0.09
Total Primary Consumption 24,359 30,517 37,995 37,154 38,022 38,068 38,692
2010 2015 2020 2025 2030
22,919 23,352 25,018 27,542 30,742 5,647 7,320 7,645 7,228 6,541
971 960 972 998 1,068 NA NA NA NA NA
29,537 31,633 33,635 35,768 38,351 8,442 8,659 9,089 9,089 9,088
NA NA NA NA NA 2,983 2,985 2,994 2,994 2,994
518 522 566 584 633 335 349 360 369 372 393 567 918 1,333 1,538
10 13 15 18 21 524 577 616 654 665
4,763 5,013 5,470 5,953 6,223 74 79 49 50 48 NA NA NA NA NA
42,817 45,383 48,244 50,860 53,710 Sources: EIA, Annual Energy Review 2004, DOE/EIA-0384(2004) (Washington, D.C., August 2005), Table 8.4b; and EIA, Annual Energy Outlook 2006, DOE/EIA-0383(2006) (Washington, D.C., February 2006), Tables A2 and A17. Notes: Data are for fuels consumed to produce electricity at both electricity-only and at combined-heat-and-power plants. Through 1988, data are for consumption at electric utilities only. Beginning in 1989, data also include consumption at independent power producers. 1 Blast furnace gas, propane gas, and other manufactured and waste gases derived from fossil fuels.2 Pumped storage facility production minus energy used for pumping. 1980 data included in Conventional Hydroelectric. 3 Solar-thermal and photovoltaic energy. 4 Batteries, chemicals, hydrogen, pitch, purchased steam, sulfur, and miscellaneous technologies. 5 All 2004 figures are preliminary

6 Starting with AER 2004 (August 2005), energy consumed by hydroelectric pumped storage plants is no longer included. According to EIA, the change was made because most of the electricity used to pump water into elevated storage reservoirs is generated by plants other than pumped-storage plants; thus, the associated energy is already accounted for in other data columns in the tables (such as conventional hydroelectric power, coal, and natural gas). The data book has kept historical record of pumped storage hydroelectric pumped storage plants, because the information is useful to some analysts. NA = not available

Table 5.6 – Fossil-Fuel Generation by Age of Generating Units (Megawatts)
1980 1990 1999 2000 2001 2002 2003 2004 2005
0-5 6-10 11-20 21-30 31-40 41-50 >50 Total:
91,001 136,236 145,618 99,223 21,042 4,023 4,232
501,376
39,870 54,270
224,879 143,868 93,450 14,701
2,566 573,603
34,466 42,215
102,855 226,166 128,613
80,859 8,291
623,465
54,274 44,042 92,854
221,690 141,055
86,582 11,634
652,129
90,877 42,164 87,057
210,982 155,292
91,321 15,259
692,952
155,534 37,735 82,977
196,464 172,139
94,204 18,161
757,214
204,504 33,121 83,140
175,461 188,274
95,560 24,487
804,546
218,854 33,234 81,085
156,694 205,136
93,156 33,967
822,128
233,119 33,976 81,465
156,078 204,382
89,731 31,676
830,427
Source: PowerDat, © 2005, Platts, a division of the McGraw-Hill companies.
Notes: Total MW does not equal fossil-fuel generation capacity cited in Table 6.1. Capacity reported in this table is nameplate capacity.

Table 5.7 – Nuclear Generation by Age of Generating Units (Megawatts)
1980 1990 1999 2000 2001 2002 2003 2004 2005
0-5 16,289 30,408 1,270 1,270 0 0 0 0 0 6-10 33,989 25,628 4,810 1,215 2,485 2,485 1,270 1,270 1,270 11-20 6,413 48,929 54,432 56,036 51,537 49,189 47,200 40,278 31,435 21-30 309 6,073 44,558 44,597 46,859 43,105 41,420 39,315 40,533 31-40 0 0 2,143 4,095 6,332 12,435 17,324 26,351 32,940 Total 57,000 111,039 107,214 107,214 107,214 107,214 107,214 107,214 106,177
Source: PowerDat, © 2005, Platts, a division of the McGraw-Hill companies.
Notes: Total MW does not equal nuclear-generation capacity cited in Table 6.1. Capacity reported in this table is nameplate capacity.

Table 5.8 – Operational Renewable Energy Generating Capacity (Megawatts)
1980 1990 2000 2001 2002 2003 1
Agricultural Residues2 40 165 373 373 373 373 BioGas3 18 361 933 999 1,030 1,053 Municipal Solid Waste4 263 2,172 2,970 2,970 2,970 3,000 Timber Residues5 3,576 6,305 7,447 7,458 7,497 7,497 Bioenergy Total 6 3,897 9,003 11,722 11,800 11,869 11,922
Geothermal 802 2,540 2,779 2,779 2,779 2,779 Photovoltaic 7 0.025 4.170 27.645 38.452 59.703 67.710 Solar Thermal 0 274 354 354 354 354 Hydro 8 80,491 90,955 94,324 94,335 94,335 94,356 Wind 0.06 1,569 2,780 4,623 5,078 5,090 Total 85,190 104,344 111,987 113,930 114,475 114,569
Source: Renewable Electric Plant Information System (REPiS Database), Version 7, National Renewable Energy Laboratory, 2003, http://www.nrel.gov/analysis/repis/. Notes: Totals do not equal renewable generation capacity cited in Table 6.1.12003 data is preliminary; it is not verified at time of data book release 2Agricultural residues, cannery wastes, nut hulls, fruit pits, nut shells3Biogas, alcohol (includes butahol, ethanol, and methanol), bagasse, hydrogen, landfill gas, livestock manure, wood gas (from wood gasifier)4Municipal solid waste (includes industrial and medical), hazardous waste, scrap tires, wastewater sludge, refused-derived fuel 5Timber and logging residues (Includes tree bark, wood chips, saw dust, pulping liquor, peat, tree pitch, wood or wood waste)6 There are an additional 65.45 MW of ag waste, 5.445 MW of bio gas, and 483.31 MW of wood residues that are not accounted for here, because they have no specific online date. 7 There are an additional 3.4 MW of photovoltaic capacity that are not accounted for here, because they have no specific online date. 8 There are an additional 24 MW of hydroelectric capacity that are not accounted for here, because they have no specific online date.

Table 5.9 – Number of Utilities by Class of Ownership and Nonutilities
1980 1990 1999 2000 2001 2002 2003 2004
Investor-Owned Utilities 240 266 238 240 232 230 223 220 Federally Owned Utilities 41 10 9 9 9 9 9 9 Cooperatively Owned Utilities1 936 951 901 894 889 882 885 884 Other Publicly Owned Utilities 1,753 2,010 2,012 2,013 2,015 2,012 2,015 2,015 Total Number of Utilities 2,970 3,237 3,160 3,156 3,145 3,120 3,154 3,150
Nonutilities NA NA 381 446 1,380 1,500 1,538 1,150 Power Marketers NA NA 155 134 127 136 147 153
Sources: EIA, The Changing Structure of the Electric Power Industry 2000: An Update (historical); EIA 861 report (1999+ for utilities) - http://www.eia.doe.gov/cneaf/electricity/page/eia861.html; and Form EIA-906 and EIA-920 databases (2001+ for IPPs) - http://www.eia.doe.gov/cneaf/electricity/page/eia906_920.html Notes: 1 Co-ops operate in all states except Connecticut, Hawaii, Rhode Island, and the District of Columbia
NA = not available 1999 and 2000 for nonutilities exclude commercial and industrial generators, while 2001-2004 include commercial and industrial generators.

Table 5.10 – Top 10 U.S. Investor-Owned Utilities & Power Marketers 2001 1990 2000 2002 2003 2004
Rank Million kWh Rank Million kWh Rank Million kWh Utility by Sales (Million kWh) Rank Million kWh Rank Million kWh Rank Million kWh
Florida Power & Light Co. 5 65,222 2 88,128 2 90,495 1 95,543 1 99,339 1 99,144
Georgia Power Co. 8 53,953 4 74,434 5 72,545 3 75,432 3 75,018 2 77,904
Duke Energy Corp 7 58,359 9 53,726 4 72,977 4 75,362 4 73,763 3 75,775
Virginia Electric & Power Co. 9 52,122 8 65,294 7 67,858 6 71,477 5 72,197 4 75,141 TXU Electric Co.1 1 78,340 1 100,885 1 102,526 2 90,522 2 79,050 5 71,544
Commonwealth Edison Co. 2 70,852 3 77,176 3 76,918 5 73,835 6 68,384 6 66,419
Alabama Power Co. 12 38,081 10 52,068 9 49,338 8 52,073 8 52,208 7 54,244
Pacific Gas & Electric Co. 3 70,597 7 72,121 12 46,680 9 49,830 10 47,881 8 53,897
Southern California Edison Co. 4 70,063 6 73,686 8 52,034 7 54,391 7 52,229 9 49,123
PacifiCorp 10 40,288 43 18,859 11 47,708 1 In 2002, electric industry restructuring commenced in Texas and both TXU and Reliant became Power Marketers
11 47,030 9 48,339 10 48,816
2001 1990 2000 2002 2003 2004 Rank Million $ Rank Million $ Rank Utility by Revenue (Million $) Rank Million $ Rank Million $ Rank Million $
Florida Power & Light Co. 4 4,803 4 6,065 3 7,302 2 7,028 1 7,952 1 8,342
Pacific Gas & Electric Co. 2 6,513 2 6,988 4 7,171 3 6,821 4 6,369 2 6,738 TXU Electric Co.1 6 4,200 3 6,433 2 7,748 4 6,520 3 6,437 3 6,434
Southern California Edison Co. 1 6,767 1 7,416 1 7,782 1 7,848 2 6,845 4 5,648
Consolidated Edison Co-NY Inc 5 4,385 6 5,286 6 5,622 6 4,874 5 5,380 5 5,154
Commonwealth Edison Co. 3 5,668 5 5,723 5 5,703 5 5,457 6 5,123 6 5,028
Virginia Electric & Power Co. 10 3,299 9 4,022 7 4,340 7 4,611 7 4,665 7 5,015
Georgia Power Co. 9 3,426 8 4,283 8 4,305 9 4,288 9 4,310 8 4,777
Duke Energy Corp 7 3,681 12 3,151 9 4,159 8 4,345 8 4,335 9 4,502 Reliant Energy HL&P1 8 3,436 7 4,743 10 5,622 14 2,898 11 3,437 10 3,915 1 In 2002, electric industry restructuring commenced in Texas and both TXU and Reliant became Power Marketers Source: EIA, Electric Sales and Revenue , DOE/EIA -0540 (00) (Washington, D.C., December 2005), Table 10 (2005) and Table 17 (previous years)

Table 5.11 – Top 10 Independent Power Producers Worldwide (Megawatts)
Company
SUEZ Energy International (formerly Tractebel Electricity & Gas Int'l) AES ENEL SpA. Calpine Dominion Generation Entergy Wholesale Operations Reliant Mirant NRG Energy Edison Mission Energy1
2002 Capacity (MW)
50,000 55,660 46,456 19,319 23,830 21,323 22,349 22,100 20,954 18,688
2003 Capacity (MW)
48,317 44,917 45,744 29,891 24,408 30,000 19,442 23,254 21,200 18,733
2004 Capacity (MW)
46,841 44,000 42,000 32,149 28,146 27,086 18,737 17,889 15,400 8,834
1 In 2004, Edison Mission Energy sold most of its international power-generating assets.
Source: Company 10K SEC filings at http://www.sec.gov/ accessed 2/06

Table 5.12 – Utility Mergers and Acquisitions
1988 1989 1990 1991 1992 1993 1994 1995 1996 1997 1998 1999 2000 2001 2002 2003 20043
Mergers/Acquisitions IOU-IO U 4 1 2 1 7 4 1 3 1 5 10 4 10 3 7 2 3 Co-op-Co-op 4 3 2 2 7 2 1 4 2 13 15 15 3 3 2 IOU-Co-op 1 2 1 1 1 IOU-Gas 1 1 5 4 3 6 1 Muni-Muni 1 2 1 Muni-Co-op 1 1 Power Authority-IOU 1 Nonutility-IOU 6 1 3 1 Nonutility-Muni 1 TransCo-IOU T assets 2 Foreign-IOU 2 2 1 3 1 Total 8 4 4 4 16 6 2 9 4 25 30 26 27 11 9 9 6
Related Activities Name Changes 5 2 7 11 1 4 6 3 2 New Holding Company 1 5 4 2 3 4 3 Moved Headquarters 1 Ceased Operations 1 1
Source: Calculated from Electrical World, Directory of Electric Power Producers, The McGraw-Hill Companies
Notes: 1 Gas local distribution company, pipeline, or developer 2 Excludes Canadian mergers and acquisitions. Includes foreign acquisition of U.S. companies 3 Includes pending mergers and acquisitions

Table 5.13a – North American Electric Reliability Council Map for the United States
ECAR NPCCECAR East Central Area Reliability Coordination Agreement
Northeast Power Coordinating Council
ERCOT Electric Reliability Council of Texas SERC Southeastern Electric Reliability Council FRCC Florida Reliability Coordinating Council SPP Southwest Power Pool MAAC Mid-Atlantic Area Council WECC Western Electricity Coordinating Council MAIN Mid-Atlantic Interconnected Network ASCC Alaskan Systems Coordinating Council MAPP Mid-Continent Area Power Pool
Source: North American Electric Reliability Council, www.nerc.com

Table 5.13b – Census Regions
Source: U.S. Department of Commerce, Bureau of the Census, www.census.gov


Table 6.1 – Electric Net Summer Capability (All Sectors) (Gigawatts)
1980 1990 2000 2001 2002 2003 2004 2010 2015 2020 2025 2030
Coal1 NA 307.4 315.1 314.2 315.4 313.0 313.3 322.8 325.5 355.4 409.3 481.0 Petroleum/Natural Gas2 NA 220.4 283.8 320.7 374.2 418.2 436.9 466.1 437.9 468.6 491.8 509.8 Total Fossil Energy 444.1 527.8 598.9 634.9 689.5 731.2 750.2 788.9 763.4 824.0 901.1 990.8 Nuclear 51.8 99.6 97.9 98.2 98.7 99.2 99.6 100.9 104.0 108.8 108.8 108.8 Hydroelectric Pumped Storage3 NA 19.5 19.5 19.1 20.4 20.5 20.5 20.8 20.8 20.8 20.8 20.8 Conventional Hydroelectric 81.7 73.9 79.4 79.5 79.4 78.7 78.7 78.3 78.4 78.5 78.5 78.5 Geothermal 0.9 2.7 2.8 2.2 2.3 2.1 2.1 2.6 3.2 4.6 6.0 6.6
Wood 4 0.1 5.5 6.1 5.9 5.8 5.9 5.9 7.2 7.6 8.5 10.1 11.9 Waste 5 NA 2.5 3.9 3.8 3.8 3.8 3.8 3.8 3.9 4.0 4.1 4.1
Solar Thermal and Photovoltaic NA 0.3 0.4 0.4 0.4 0.4 0.4 1.2 1.3 1.5 1.7 2.6 Wind NA 1.8 2.4 3.9 4.4 6.0 6.2 16.3 17.7 18.8 19.8 20.1
Total Renewable Energy 82.7 86.8 94.9 95.7 96.1 96.9 97.1 109.3 112.1 115.9 120.2 123.9 Other 6 NA 0.5 0.5 0.4 0.6 0.6 0.6 0.7 0.7 0.7 0.7 0.7 Total Electric Capability 578.6 734.1 811.7 848.3 905.3 948.4 968.1 1020.6 1001.1 1070.2 1151.6 1245.0
Sources: EIA, Annual Energy Outlook 2006 DOE/EIA-0383 (2006) (Washington, D.C., February 2006), Tables A9, A16; EIA, Annual Energy Review 2004, DOE/EIA-0384(2004) (Washington, D.C., August 2005), Table 8.11a. Notes: Data include electricity-only and combined-heat-and-power (CHP) plants whose primary business is to sell electricity – or electricity and heat – to the public. Through 1988, data are for net summer capacity at electric utilities only. Beginning in 1989, data also include net summer capacity at independent power producers and the commercial and industrial (end-use) sectors. 1 Anthracite, bituminous coal, subbituminous coal, lignite, waste coal, and synthetic coal. 2 Petroleum, natural gas, distillate fuel oil, residual fuel oil, petroleum coke, jet fuel, kerosene, other petroleum, waste oil, supplemental gaseous fuels,blast furnace gas, propane gas, and other manufactured and waste gases derived from fossil fuels. Includes natural gas-fired distributed generation. 3 Pumped storage included in Conventional Hydro prior to 1989.4 Wood, black liquor, and other wood waste. Includes projections for energy crops after 2010. Includes other biomass in projections. 5 Municipal solid waste, landfill gas, sludge waste, tires, agricultural byproducts, and other biomass. Waste included in Wood prior to 1985. 6 Includes batteries, chemicals, hydrogen, pitch, sulfur, purchased steam, fuel cells, and miscellaneous technologies. NA = not available

Table 6.2 – Electricity-Only Plant Net Summer Capability (Gigawatts)
1980 1990 2000 2001 2002 2003 2004 2010 2015 2020 2025 2030
Coal 2 NA 299.9 305.2 305.2 305.8 303.0 303.4 313.7 315.0 340.9 385.7 453.1 Petroleum/Natural Gas 3 NA 198.7 243.9 279.4 325.1 362.9 378.9 409.4 379.1 407.3 428.1 443.9 Total Fossil Energy NA 498.6 549.0 584.5 630.9 665.9 682.2 723.1 694.1 748.2 813.8 897.0 Nuclear NA 99.6 97.9 98.2 98.7 99.2 99.6 100.9 104.0 108.8 108.8 108.8 Hydroelectric Pumped Storage 4 NA 19.5 19.5 19.1 20.4 20.5 20.5 20.8 20.8 20.8 20.8 20.8 Conventional Hydroelectric NA 73.3 78.2 78.4 78.3 77.9 77.9 77.7 77.8 77.9 77.9 77.9 Geothermal NA 2.7 2.8 2.2 2.3 2.1 2.1 2.6 3.2 4.6 6.0 6.6
Wood 5 NA 1.0 1.5 1.5 1.4 1.4 1.4 2.2 2.2 2.5 3.5 4.6 Waste 6 NA 1.9 2.8 3.0 3.0 2.8 2.9 3.5 3.7 3.8 3.8 3.9
Solar Thermal and Photovoltaic NA 0.3 0.4 0.4 0.4 0.4 0.4 0.5 0.6 0.7 0.8 0.9 Wind NA 1.8 2.4 3.6 4.4 6.0 6.0 16.3 17.7 18.8 19.8 20.1
Total Renewable Energy NA 80.9 88.1 89.1 89.7 90.6 90.7 102.7 105.1 108.2 111.8 114.1 Other NA 0.0 0.0 0.0 0.0 0.0 0.0 0.0 0.0 0.0 0.0 0.0 Total Electric Capability 7 NA 698.6 754.5 790.8 839.2 876.3 893.1 947.5 924.0 986.0 1055.2 1140.7
Sources: EIA, Annual Energy Outlook 2006 DOE/EIA-0383 (2006) (Washington, D.C., February 2006), Tables A9, A16; EIA, Annual Energy Review 2003, DOE/EIA-0384(2003) (Washington, D.C., September 2004), Table 8.11c. Notes: Data are for electricity-only plants in the electric-power sector, whose primary business is to sell electricity to the public. Through 1988, data are for net summer capacity at electric utilities only. Beginning in 1989, data also include net summer capacity at independent power producers. 1 Anthracite, bituminous coal, subbituminous coal, lignite, waste coal, and synthetic coal. 2 Petroleum, natural gas, distillate fuel oil, residual fuel oil, petroleum coke, jet fuel, kerosene, other petroleum, waste oil, supplemental gaseous fuels, blast furnace gas, propane gas, and other manufactured and waste gases derived from fossil fuels. Includes natural gas-fired distributed generation. 3 Pumped storage included in Conventional Hydro prior to 1989. 4 Wood, black liquor, and other wood waste. Includes projections for energy crops after 2010. Includes other biomass in projections. 5 Municipal solid waste, landfill gas, sludge waste, tires, agricultural byproducts, and other biomass. Waste included in Wood prior to 1985. 6 Includes batteries, chemicals, hydrogen, pitch, sulfur, purchased steam, fuel cells, and miscellaneous technologies. NA = not available

Table 6.3 – Combined-Heat-and-Power Plant Net Summer Capability (Gigawatts)
1980 1990 2000 2001 2002 2003 2004 2010 2015 2020 2025 2030
Coal 2 NA 7.5 10.0 9.1 9.5 10.0 9.9 9.1 10.5 14.5 23.6 27.9 Petroleum/Natural Gas 3 NA 21.7 39.9 41.3 49.1 55.3 58.0 56.7 58.7 61.4 63.7 65.9 Total Fossil Energy NA 29.2 49.9 50.4 58.6 65.3 67.9 65.8 69.3 75.9 87.3 93.8 Nuclear NA 0.0 0.0 0.0 0.0 0.0 0.0 0.0 0.0 0.0 0.0 0.0 Hydroelectric Pumped Storage NA 0.0 0.0 0.0 0.0 0.0 0.0 0.0 0.0 0.0 0.0 0.0 Conventional Hydroelectric NA 0.6 1.1 1.1 1.1 0.8 0.8 0.7 0.7 0.7 0.7 0.7 Geothermal NA 0.0 0.0 0.0 0.0 0.0 0.0 0.0 0.0 0.0 0.0 0.0
Wood 4 NA 4.6 4.9 4.6 4.7 4.7 4.8 5.0 5.5 6.0 6.6 7.3 Waste 5 NA 0.4 0.6 0.5 0.5 0.5 0.5 0.3 0.3 0.3 0.3 0.3
Solar Thermal and Photovoltaic NA 0.0 0.0 0.0 0.0 0.0 0.0 0.6 0.7 0.8 0.9 1.7 Wind NA 0.0 0.0 0.3 0.0 0.0 0.0 0.0 0.0 0.0 0.0 0.0
Total Renewable Energy NA 5.3 6.1 5.8 5.8 5.6 5.6 7.0 7.5 8.1 8.8 10.3 Other NA 0.5 0.5 0.4 0.6 0.6 0.6 0.7 0.7 0.7 0.7 0.7 Total Electric Capability 6 NA 35.5 57.2 57.4 65.6 72.1 75.0 73.4 77.5 84.7 96.8 104.8
Sources: EIA, Annual Energy Outlook 2006 DOE/EIA-0383 (2006) (Washington, D.C., February 2006), Tables A9, A16; EIA, Annual Energy Review 2004, DOE/EIA-0384(2004) (Washington, D.C., August 2005), Table 8.11c. Notes:
Includes combined-heat-and-power (CHP) plants whose primary business is to sell electricity and heat to the public. Includes electric utility CHP plants. Also includes commercial and industrial CHP and a small number of commercial electricity-only plants. 1 Anthracite, bituminous coal, subbituminous coal, lignite, waste coal, and synthetic coal.2 Petroleum, natural gas, distillate fuel oil, residual fuel oil, petroleum coke, jet fuel, kerosene, other petroleum, waste oil, supplemental gaseousfuels, blast furnace gas, propane gas, and other manufactured and waste gases derived from fossil fuels. Includes natural gas fired distributedgeneration. 3 Pumped storage included in Conventional Hydro prior to 1989. 4 Wood, black liquor, and other wood waste. Includes projections for energy crops after 2010. Includes other biomass in projections. 5 Municipal solid waste, landfill gas, sludge waste, tires, agricultural byproducts, and other biomass. Waste included in Wood prior to 1985. 6 Includes batteries, chemicals, hydrogen, pitch, sulfur, purchased steam, fuel cells, and miscellaneous technologies. NA = not available

Table 6.4 – Regional Noncoincident 1 Peak Loads and Capacity Margin (Megawatts, except as noted)
North American Electric Reliability Council Regions 1990 2000 2001 2002 2003 2004
Summer Peak ECAR 79,258 92,033 100,235 102,996 98,487 102,423 ERCOT 42,737 57,606 55,201 56,248 59,996 61,432 FRCC NA 37,194 39,062 40,696 40,475 42,705 MAAC 42,613 49,477 54,015 55,569 53,566 56,886 MAIN 40,740 52,552 56,344 56,396 56,988 57,868 MAPP (U.S.) 24,994 28,605 28,321 29,119 28,831 29,244 NPCC (U.S.) 44,116 50,057 55,949 56,012 55,018 57,535 SERC 121,943 156,088 149,293 158,767 153,110 157,961 SPP 52,541 40,199 40,273 39,688 40,367 40,089 WECC2 (U.S.) 97,389 114,602 109,119 119,074 122,537 122,870 Contiguous U.S. 546,331 678,413 687,812 714,565 709,375 729,013 ASCC (Alaska) 463 NF NF NF NF NF Hawaii NF NF NF NF NF NF U.S. Total 546,794 678,413 687,812 714,565 717,652 729,013 Capacity Margin (%) 3 21.6 15.7 14.5 16.4 18.6 19.2
1990 2000 2001 2002 2003 2004 Winter Peak
67,097 84,546 85,485 87,300 86,332 87,972 35,815 44,641 44,015 45,414 42,702 43,556
NA 38,606 40,922 45,635 36,841 45,418 36,551 43,256 39,458 46,551 45,625 45,471 32,461 41,943 40,529 42,412 41,719 42,409 21,113 24,536 21,815 23,645 24,134 24,628 40,545 43,852 42,670 46,009 48,079 47,986
117,448 139,146 135,182 141,882 137,972 141,176 38,949 30,576 29,614 30,187 28,450 28,469 94,252 97,324 96,622 95,951 102,020 104,393
484,231 588,426 576,312 604,986 593,874 611,478 613 NF NF NF NF NF NF NF NF NF NF NF
484,844 588,426 576,312 604,986 608,729 611,478 NA 29.5 28.9 29.4 33.5 33.4
Source: EIA, Annual Energy Review 2003, DOE/EIA-0384(2003) (Washington, D.C., September 2004), Table 8.12. Notes: NF = data not filed, NA = not available 2003 data are forecast estimates.1 Noncoincident peak load is the sum of two or more peak loads on individual systems that do not occur at the same time interval. 2 Renamed from WSCC in 20023 The percent by which planned generating capacity resources are expected to be greater (or less) than estimated net internal demand at the time of expected peak summer (or winter) demand. Net internal demand does not include estimated demand for direct control load management and customers with interruptible service agreements.

Table 6.5 – Electric-Generator Cumulative Additions and Retirements (Gigawatts) 1
2010 2015 2020 2025 2030
Cumulative Planned Additions Coal Steam 8.3 9.3 9.3 9.3 9.3 Other Fossil Steam 2 0.1 0.1 0.1 0.1 0.1 Combined Cycle 25.7 25.7 25.7 25.7 25.7 Combustion Turbine/Diesel 5.3 5.3 5.3 5.3 5.3 Nuclear 0.0 0.0 0.0 0.0 0.0 Pumped Storage 0.0 0.0 0.0 0.0 0.0 Fuel Cells 0.0 0.0 0.0 0.0 0.0 Renewable Sources 3 10.0 11.0 11.1 11.2 11.4 Distributed Generation 4 0.0 0.0 0.0 0.0 0.0 Total Planned Additions 49.4 51.5 51.6 51.7 51.8
Cumulative Unplanned Additions Coal Steam 3.4 7.0 32.9 77.7 145.1 Other Fossil Steam 2 0.0 0.0 0.0 0.0 0.0 Combined Cycle 0.0 5.5 29.9 41.9 46.8 Combustion Turbine/Diesel 4.7 11.6 21.5 31.3 46.2 Nuclear 0.0 2.2 6.0 6.0 6.0 Pumped Storage 0.0 0.0 0.0 0.0 0.0 Fuel Cells 0.0 0.0 0.0 0.0 0.0 Renewable Sources 3 0.4 1.7 4.8 8.3 10.4 Distributed Generation 4 0.2 0.6 1.4 2.4 5.5 Total Unplanned Additions 8.8 28.6 96.5 167.7 260.0
Cumulative Retirements Coal Steam 3.0 6.8 6.8 6.8 6.8 Other Fossil Steam 2 2.0 37.9 44.0 45.1 49.0 Combined Cycle 0.6 0.6 0.6 0.6 0.6 Combustion Turbine/Diesel 1.4 8.2 8.2 8.2 8.2 Nuclear 0.0 0.0 0.0 0.0 0.0 Pumped Storage 0.0 0.0 0.0 0.0 0.0 Fuel Cells 0.0 0.0 0.0 0.0 0.0 Renewable Sources 3 0.1 0.1 0.1 0.1 0.1 Total Retirements 7.1 53.6 59.8 60.8 64.7
Sources: EIA, Annual Energy Outlook 2006, DOE/EIA-0383 (2006) (Washington, D.C., February 2006), Table A9. Notes: 1 Additions and retirements since December 31, 2001.2 Includes oil-, gas-, and dual-fired capability.3 Includes conventional hydroelectric, geothermal, wood, wood waste, municipal solid waste, landfill gas, other biomass, solar, and wind power.4 Primarily peak load capacity fueled by natural gas.

Table 6.6 – Transmission and Distribution Circuit Miles (Miles) 1
Voltage (kilovolts) 1980 1990 1999 2000 2 2001 2 2002 2 2003 2 2004 2
230 NA 70,511 76,762 76,437 80,515 81,252 82,238 81,992 345 NA 47,948 49,250 51,025 53,855 54,827 54,195 55,429 500 NA 23,958 26,038 25,000 27,343 27,587 27,407 28,011 765 NA 2,428 2,453 2,426 2,518 2,560 2,560 2,560 Total NA 144,845 154,503 154,888 164,231 166,226 166,400 167,992
Sources: EIA, Electricity Transmission Fact Sheets, http://www.eia.doe.gov/cneaf/electricity/page/fact_sheets/transmission.html; NERC, Electricity Supply and Demand Database, 2005, http://www.nerc.com/~esd/Brochure.pdf Notes: 1 Circuit miles of AC lines 230 kV and above. 2 Data includes both existing and planned transmission lines

Table 7.1 – Electricity Net Generation (Billion Kilowatthours)
1980 1990 2000 2001 2002 2003 2004 2010 2015 2020 2025 2030
Coal 1 1,162 1,594 1,966 1,904 1,933 1,974 1,976 2,218 2,277 2,505 2,896 3,381 Petroleum 2 246 127 111 125 95 119 118 105 104 107 108 115 Natural Gas 3 346 373 601 639 691 650 700 774 1,018 1,102 1,069 990 Other Gases 4 NA 10 14 9 11 16 15 12 12 12 12 12 Total Fossil Energy 1,754 2,104 2,692 2,677 2,730 2,759 2,809 3,108 3,411 3,725 4,085 4,497 Nuclear 251 577 754 769 780 764 789 809 829 871 871 871 Hydroelectric Pumped Storage5 NA -4 -6 -9 -9 -9 -8 -9 -9 -9 -9 -9 Conventional Hydroelectric 6 279 293 276 217 264 276 270 301 302 303 303 303 Geothermal 5 15 14 14 14 14 14 18 23 34 47 53 Wood 7 0 33 38 35 39 38 37 76 79 86 103 103 Waste 8 0 13 23 22 23 24 23 27 28 29 30 30 Solar Thermal and Photovoltaic NA 0 0 1 1 1 1 2 3 3 4 6 Wind NA 3 6 7 10 11 14 51 56 60 63 65 Total Renewable Energy 285 357 356 295 351 363 359 476 491 515 549 559 Generation for Own Use 9 NA NA NA NA NA NA NA -177 -192 -214 -252 -278 Other 10 NA 4 5 5 6 6 6 12 12 12 12 12 Total Electricity Generation 2,290 3,038 3,802 3,737 3,858 3,883 3,953 4,388 4,727 5,108 5,491 5,926
Sources: EIA, Annual Energy Review 2004, DOE/EIA-0384(2004) (Washington, D.C., August 2005), Table 8.2a; and EIA, Annual Energy Outlook 2006, DOE/EIA-0383(2006) (Washington, D.C., February 2006), Tables A8 and A16.
Notes: Data include electricity-only and combined-heat-and-power (CHP) plants, whose primary business is to sell electricity – or electricity and heat – to the
public. Through 1988, data are for generation at electric utilities only. Beginning in 1989, data also include generation at independent power producers and the commercial and industrial (end-use) sectors.1 Anthracite, bituminous coal, subbituminous coal, lignite, waste coal, and synthetic coal. 2 Distillate fuel oil, residual fuel oil, petroleum coke, jet fuel, kerosene, other petroleum, and waste oil. 3 Natural gas, including a small amount of supplemental gaseous fuels. Forecast data include electricity generation from fuel cells. 4 Blast furnace gas, propane gas, and other manufactured and waste gases derived from fossil fuels (including refinery and still gas). 5 Pumped-storage facility production, minus energy used for pumping. Data for 1980 included in conventional hydroelectric power. 6 Hydroelectric data through 1988 are for generation at electric utilities and industrial plants only; beginning in 1989, data also include generation at independent power producers and commercial plants.7 Wood, black liquor, and other wood waste. 8 Municipal solid waste, landfill gas, sludge waste, tires, agricultural byproducts, and other biomass. 9 Includes nonutility and end-use sector generation for own use.10 Batteries, chemicals, hydrogen, pitch, purchased steam, sulfur, and miscellaneous technologies.
NA = not available

Table 7.2 – Net Generation at Electricity-Only Plants (Billion Kilowatthours)
1980 1990 2000 2001 2002 2003 2004 2010 2015 2020 2025 2030
Coal 1 1,162 1,560 1,911 1,852 1,881 1,916 1,916 2,164 2,209 2,405 2,728 3,178 Petroleum 2 246 118 98 113 83 109 108 90 89 90 93 99 Natural Gas 3 346 265 399 427 457 421 486 533 743 814 775 691 Other Gases 4 NA 0 0 0 0 0 0 NA NA NA NA NA Total Fossil Energy 1,754 1,942 2,408 2,392 2,422 2,446 2,510 2,787 3,041 3,310 3,596 3,968 Nuclear 251 577 754 769 780 764 789 809 829 871 871 871 Hydroelectric Pumped Storage5 NA -4 -6 -9 -9 -9 -8 -9 -9 -9 -9 -9 Conventional Hydroelectric 6 276 290 271 214 260 272 264 297 297 298 299 299 Geothermal 5 15 14 14 14 14 14 18 23 34 47 53 Wood 7 0.3 6 7 7 7 7 7 45 45 49 51 58 Waste 8 0.2 10 18 17 17 18 18 25 26 27 28 28 Solar Thermal and Photovoltaic NA 0.4 0.5 0.5 0.6 0.5 0.6 1 1 1 2 2 Wind NA 3 6 7 10 11 14 51 56 60 63 65 Total Renewable Energy 282 324 316 259 311 323 319 436 448 469 489 504 Other 10 0 0 0 0 1 1 3 NA NA NA NA NA Total Electricity Generation 2,286 2,840 3,473 3,411 3,505 3,525 3,611 4,020 4,306 4,638 4,945 5,332
Sources: EIA, Annual Energy Review 2004, DOE/EIA-0384(2004) (Washington, D.C., August 2005),Table 8.2c; and EIA, Annual Energy Outlook 2006, DOE/EIA-0383(2006) (Washington, D.C., February 2006), Tables A8 and A16.
Notes:
Data are for electricity-only plants in the electric-power sector whose primary business is to sell electricity to the public. Through 1988, data are forgeneration at electric utilities only. Beginning in 1989, data also include generation at independent power producers.1 Anthracite, bituminous coal, subbituminous coal, lignite, waste coal, and synthetic coal. 2 Distillate fuel oil, residual fuel oil, petroleum coke, jet fuel, kerosene, other petroleum, and waste oil. 3 Natural gas, including a small amount of supplemental gaseous fuels. Forecast data include electricity generation from fuel cells. 4 Blast furnace gas, propane gas, and other manufactured and waste gases derived from fossil fuels (including refinery and still gas).5 Pumped-storage facility production, minus energy used for pumping. Data for 1980 included in conventional hydroelectric power.6 Hydroelectric data through 1988 are for generation at electric utilities and industrial plants only; beginning in 1989, data also include generation atindependent power producers and commercial plants.7 Wood, black liquor, and other wood waste. 8 Municipal solid waste, landfill gas, sludge waste, tires, agricultural byproducts, and other biomass.9 Includes nonutility and end-use sector generation for own use.10 Batteries, chemicals, hydrogen, pitch, purchased steam, sulfur, and miscellaneous technologies. NA = not available

Table 7.3 – Electricity Generation at Combined-Heat-and-Power Plants (Billion Kilowatthours)
1980 1990 2000 2001 2002 2003 2004 2010 2015 2020 2025 2030
Coal 1 NA 34 56 52 52 58 61 53 68 99 168 203
Petroleum 2 NA 9 13 12 11 11 10 15 15 17 15 16
Natural Gas 3 NA 108 202 212 234 229 213 241 275 288 294 299
Other Gases 4 NA 10 14 9 11 15 15 4 4 5 5 5Total Fossil Energy NA 161 284 285 309 313 299 313 363 408 482 522Nucl ear NA 0 0 0 0 0 0 0 0 0 0 0
Hydroelectric Pumped Storage5 NA 0 0 0 0 0 0 0 0 0 0 0
Conventional Hydroelectric 6 NA 3 4 3 4 4 5 4 4 4 4 4 Geothermal NA 0 0 0 0 0 0 0 0 0 0 0
Wood 7 NA 27 30 29 31 30 30 32 35 38 51 45
Waste 8 NA 3 6 5 5 6 5 2 2 2 2 2 Solar Thermal and Photovolt aic NA 0 0 0 0 0 0 1 1 2 2 4 Wind NA 0 0 0 0 0 0 0 0 0 0 0 Total Renewable Energy NA 33 40 36 41 40 40 40 43 46 50 55
Other 9 NA 4 5 5 4 5 3 12 12 12 12 12 Total Electricity Generation NA 198 329 326 354 358 342 364 417 466 543 589
Sources: EIA, Annual Energy Review 2004, DOE/EIA-0384(2004) (Washington, D.C., August 2005),Table 8.2c and 8.2d; and EIA, Annual Energy Outlook 2006, DOE/EIA-0383(2006) (Washington, D.C., February 2006), Tables A8 and A16. Notes:
Includes combined-heat-and-power (CHP) plants, whose primary business is to sell electricity and heat to the public. Includes electric utility CHP plants. Also includes commercial and industrial CHP and a small number of commercial and industrial (end-use sectors) electricity-only plants. 1 Anthracite, bituminous coal, subbituminous coal, lignite, waste coal, and synthetic coal. 2 Distillate fuel oil, residual fuel oil, petroleum coke, jet fuel, kerosene, other petroleum, and waste oil. 3 Natural gas, plus a small amount of supplemental gaseous fuels that cannot be identified separately. Forecast data include electricitygeneration from fuel cells. 4 Blast furnace gas, propane gas, and other manufactured and waste gases derived from fossil fuels (including refinery and still gas).5 Pumped-storage facility production, minus energy used for pumping. 6 Includes CHP plants that use multiple sources of energy, including hydropower. 7Wood, black liquor, and other wood waste. 8 Municipal solid waste, landfill gas, sludge waste, tires, agricultural byproducts, and other biomass. 9 Batteries, chemicals, hydrogen, pitch, purchased steam, sulfur, and miscellaneous technologies. NA = not available

Table 7.4 – Generation and Transmission/Distribution Losses(Billion kWh)
1980 1990 2000 2001 2002 2003 2004 2010 2015 2020 2025 2030
Net Generation Delivered 2,290 3,038 3,802 3,737 3,858 3,883 3,953 4,211 4,536 4,893 5,240 5,648 Generation Losses 1 4,859 6,316 7,809 7,617 7,798 7,756 8,006 8,339 8,764 9,232 9,652 10,094 Transmission and Distribution Losses 2 NA 219 258 243 266 257 271 251 254 274 294 317
Sources: Calculated from EIA, Annual Energy Review 2004, DOE/EIA-0384(2004) (Washington, D.C., August 2005), Tables 8.1, 8.2a, and 8.4a; and EIA, Annual Energy Outlook 2006, DOE/EIA-0383(2006) (Washington, D.C., February 2006), Tables A2 and A8.
Notes: 1 Generation Losses for all years are calculated by calculating a Gross Generation value in billion kWh by multiplying the energy input in trillion Btu by (1000/3412) and subtracting the Net Generation in billion kWh from the Gross Generation estimate. 2 Transmission and Distribution Losses= Electricity Needed to be Transmitted- Electricity Sales, where Electricity Needed to be Transmitted = Total Generation from Electric Generators + Cogenerators + Net Imports - Generation for Own Use. Represents energy losses that occur between the point of generation and delivery to the customer, and data collection frame differences and nonsampling error. NA = not available

Table 7.5 – Electricity Trade (Billion Kilowatthours)
1980 1990 2000 2001 2002 2003 2004 2010 2015 2020 2025 2030
Interregional Electricity Trade Gross Domestic Firm Power Trade NA NA NA 143 139 137 142 105 82 51 38 38 Gross Domestic Economy Trade NA NA NA 182 174 215 233 231 200 168 165 158 Gross Domestic Trade NA NA NA 325 313 352 376 337 283 219 203 196
International Electricity Trade Firm Power Imports from Mexico and Canada NA NA NA 12 10 11 12 3 2 1 0 0 Economy Imports from Mexico and Canada NA NA NA 26 27 19 22 40 39 29 27 26 Gross Imports from Mexico and Canada 25 18 49 39 36 30 34 42 41 29 28 27
Firm Power Exports to Mexico and Canada NA NA NA 7 6 5 7 1 1 0 0 0 Economy Exports to Mexico and Canada NA NA NA 10 9 19 16 20 17 15 13 13 Gross Exports to Canada and Mexico 4 16 15 16 14 24 23 21 18 15 13 13
Sources: EIA, Annual Energy Review 2004, DOE/EIA-0384(2004) (Washington, D.C., August 2005), Table 8.1; and EIA, Annual Energy Outlook 2006, DOE/EIA-0383(2006) (Washington, D.C., February 2006), Table A10.
Notes: All data are from EIA AEO except Gross Imports and Exports for 1980-2004. NA = not available

Table 8.1 – Electricity Sales (Billion Kilowatthours)
1980 1990 2000 2001 2002 2003 2004 2010 2015 2020 2025 2030 Electricity Sales by Sector1
Residential 717 924 1,192 1,203 1,267 1,273 1,293 1,461 1,576 1,691 1,787 1,897 Commercial 559 838 1,159 1,197 1,218 1,200 1,229 1,430 1,592 1,762 1,944 2,151 Industrial 815 946 1,064 964 972 1,008 1,021 1,060 1,103 1,147 1,195 1,262 Transportation/Other 2 3 5 5 5 6 7 8 26 28 29 30 31 Total Sales 2,094 2,713 3,421 3,370 3,463 3,488 3,551 3,978 4,300 4,629 4,956 5,341 Direct Use 3 NA 125 171 163 166 168 166 177 192 214 252 278 Total 2,094 2,837 3,592 3,532 3,629 3,656 3,717 4,155 4,491 4,844 5,208 5,619
Sources: 2010-2030 - EIA, Annual Energy Outlook 2006, DOE/EIA-0383(2006) (Washington, D.C., February 2006), Table A8; 1980-2004 - EIA, Annual Energy Review 2004, DOE/EIA-0384(2004) (Washington, D.C., August 2005), Table 8.9. Notes: 1 Electricity retail sales to ultimate customers reported by electric utilities and other energy-service providers. 2 “Other” includes public street and highway lighting, other sales to public authorities, sales to railroads and railways, and interdepartmental sales through 2002. Transportation-sector sales reported starting in 2010. 3 Commercial and industrial facility use of on-site net electricity generation; and electricity sales among adjacent or colocated facilities for which revenue information is not available.

Table 8.2 – Demand-Side Management 1980 1990 2000 2001 2002 2003 2004
Load Management Peak Load Reductions (MW)1 NA NA 10,027 11,928 9,516 9,323 9,260 Energy Efficiency Peak Load Reductions (MW)2 NA NA 12,873 13,027 13,420 13,581 14,272 Total Peak Load Reductions (MW) NA 13,704 22,901 24,955 22,936 22,904 23,532 Energy Savings (Million kWh) Costs (Million 2004$)3
NA NA
20,458 1,562
53,701 1,694
54,762 1,723
54,075 1,690
50,265 1,325
54,710 1,557
Sources: 1980-2003 - EIA, Annual Energy Review 2004, DOE/EIA-0384(2004) (Washington, D.C., August 2005), Table 8.13; 2004 - EIA, Electric Power Annual 2004 Tables, (Washington, D.C., December 2005), Table 9.1, 9.2, 9.4, 9.6, and 9.7 http://www.eia.doe.gov/cneaf/electricity/epa/epat9p1.html Notes: The actual reduction in peak load reflects the change in demand for electricity that results from a utility demand-side management program that is in effect at the time that the utility experiences its actual peak load, as opposed to the potential installed peak load reduction capability. Differences between actual and potential peak reduction result from changes in weather, economic activity, and other variable conditions.1 Load management includes programs such as direct load control and interruptible load control; and, beginning in 1997, "other types" of demand-side management programs. "Other types" are programs that limit or shift peak loads from on-peak to off-peak time periods, such as space heating and water heating storage systems.2 Energy efficiency refers to programs that are aimed at reducing the energy used by specific end-use devices and systems, typically without affecting the services provided. From 1989 to 1996, energy efficiency includes "other types" of demand-side management programs. Beginning in 1997, these programs are included under load management. 3 Historical data converted to 2004 dollars using EIA Annual Energy Review 2004, Appendix D.

Table 8.3 – Electricity Sales, Revenue, and Consumption by Census Division and State, 2004 Average Electricity Average Electricity
Census Division Revenue Revenue Consumption Census Division Revenue Revenue Consumption and State Sales (MWh) (million $) (¢/kWh) (kWh/person) and State Sales (MWh) (million $) (¢/kWh) (kWh/person)
New England 125,249 13,284 10.6 8,796 East South Central 319,085 18,618 5.8 18,114 Connecticut 32,215 3,305 10.3 9,177 Alabama 86,871 5,278 6.1 19,060 Maine 12,368 1,198 9.7 9,359 Kentucky 86,521 4,004 4.6 20,732 Massachusetts 56,142 6,045 10.8 8,774 Mississippi 46,033 3,221 7.0 15,759 New Hampshire 10,973 1,248 11.4 8,377 Tennessee 99,661 6,115 6.1 16,713 Rhode Island 7,888 865 11.0 7,329 West South Central 494,966 36,952 7.5 14,683 Vermont 5,664 624 11.0 9,090 Arkansas 43,672 2,475 5.7 15,714 Middle Atlantic 366,176 37,679 10.3 9,063 Louisiana 79,737 5,682 7.1 17,627 New Jersey 77,593 7,984 10.3 8,900 Oklahoma 50,942 3,313 6.5 14,358 New York 145,082 18,209 12.6 7,535 Texas 320,615 25,482 7.9 14,025 Pennsylvania 143,501 11,486 8.0 11,545 Mountain 237,632 16,306 6.9 11,711 East North Central 571,151 37,920 6.6 12,374 Arizona 66,933 4,985 7.4 11,270 Illinois 139,254 9,465 6.8 10,910 Colorado 46,724 3,247 6.9 10,015 Indiana 103,094 5,749 5.6 16,437 Idaho 21,809 1,085 5.0 15,260 Michigan 106,606 7,401 6.9 10,533 Montana 12,957 830 6.4 13,848 Ohio 154,221 10,629 6.9 13,453 Nevada 31,312 2,681 8.6 12,967 Wisconsin 67,976 4,677 6.9 12,278 New Mexico 19,846 1,409 7.1 10,291 West North Central 261,030 16,095 6.2 13,173 Utah 24,512 1,395 5.7 9,925 Iowa 40,903 2,619 6.4 13,789 Wyoming 13,540 674 5.0 26,585 Kansas 37,127 2,364 6.4 13,527 Pacific Contiguous 378,382 36,407 9.6 8,215 Minnesota 63,340 3,950 6.2 12,340 California 252,764 28,935 11.4 6,996 Missouri 74,054 4,494 6.1 12,767 Oregon 45,636 2,833 6.2 12,534 Nebraska 25,876 1,475 5.7 14,712 Washington 79,982 4,638 5.8 12,720
Pacific North Dakota 10,516 599 5.7 16,518 Noncontiguous 16,520 2,321 14.0 2,832 South Dakota 9,214 594 6.4 11,875 Alaska 5,788 636 11.0 1,270

South Atlantic 778,026 54,874 7.1 13,973 Hawaii 10,732 1,685 15.7 8,416 Delaware 11,761 885 7.5 13,943 U.S. Total 3,548,218 270,456 7.6 11,971 District of Columbia 11,415 852 7.5 225,943 Florida 218,584 17,835 8.2 12,287 Georgia 129,466 8,525 6.6 14,270 Maryland 66,892 4,785 7.2 11,944 North Carolina 125,657 8,756 7.0 14,471 South Carolina 79,908 4,972 6.2 18,780 Virginia 105,424 6,780 6.4 13,931 West Virginia 28,919 1,483 5.1 15,917
Sources: EIA, Electric Sales and Revenue 2004 Spreadsheets, Data Tables, http://www.eia.doe.gov/cneaf/electricity/esr/esr_sum.html Tables 1b, 1c, 1d, and U.S. Census Bureau, Annual Estimates of the Population for the United States and States, and for Puerto Rico: April 1, 2000 to July 1, 2005 (NST-EST2004-01) - State Population Estimates 2005, http://www.census.gov/popest/states/tables/NST-EST2005-01.xls
Notes: Revenue in 2004 dollars. Includes bundled and unbundled consumers

Table 9.1 – Price of Fuels Delivered to Electric Generators(2004 Dollars per Million Btu) 1
1980 1993 2000 2001 2002 2003 2004 2010 2015 2020 2025 2030
Distillate Fuel NA NA NA NA NA 6.65 9.23 9.04 9.02 9.62 10.05 10.28 Residual Fuel 2 NA 2.88 4.48 3.87 3.44 4.40 4.29 5.70 5.72 6.02 6.43 6.73 Natural Gas 3 NA 3.11 4.61 4.70 3.67 5.46 5.96 5.46 5.08 5.40 5.87 6.26 Steam Coal 4 NA 1.69 1.29 1.29 1.29 1.29 1.36 1.48 1.40 1.39 1.44 1.51 Fossil Fuel Average 5 NA 1.93 1.86 1.81 1.56 2.31 2.57 2.41 2.41 2.46 2.50 2.49
Sources: EIA, Annual Energy Outlook 2006, DOE/EIA-0383(2006) (Washington, D.C., February 2006), Table A3; and EIA, Electric Power Annual 2004, DOE/EIA-0348(2004) (Washington, D.C., November 2005), Table 4.5. Notes: Includes electricity-only and combined-heat-and-power plants whose primary business is to sell electricity - or electricity and heat - to the public. Data are for steam-electric plants with a generator nameplate capacity of 50 or more megawatts. Beginning in 2002, data from the Form EIA-423, "Monthly Cost and Quality of Fuels for Electric Plants Report" for independent power producers and combined-heat-and-power producers are included in this data dissemination. Prior to 2002, these data were not collected; the data for 2001 and previousyears include only data collected from electric utilities via the FERC Form 423. 1 Historical data converted to 2003$/MMBtu using EIA Annual Energy Review 2003, Appendix D. 2 1990-2003 data are for distillate fuel oil (all diesel and No. 1, No. 2, and No. 4 fuel oils), residual fuel oil (No. 5 and No. 6 fuel oils and bunker C fuel oil), jet fuel, kerosene, petroleum coke (converted to liquid petroleum), and waste oil. 3 Natural gas, including a small amount of supplemental gaseous fuels that cannot be identified separately.4 Anthracite, bituminous coal, subbituminous coal, lignite, waste coal, and synthetic coal.5 Weighted average price.
NA = not available

Table 9.2 – Electricity Retail Sales (Billion Kilowatthours)
1980 1990 2000 2001 2002 2003 2004 2010 2015 2020 2025 2030 Retail Sales 1
Residential 717 924 1,192 1,203 1,267 1,273 1,293 1,461 1,576 1,691 1,787 1,897 Commercial 2 559 838 1,159 1,197 1,218 1,200 1,229 1,430 1,592 1,762 1,944 2,151 Industrial 3 815 946 1,064 964 972 1,008 1,021 1,060 1,103 1,147 1,195 1,262 Transportation 4 3 5 5 5 6 7 8 26 28 29 30 31 Total 5 2,094 2,713 3,421 3,370 3,463 3,488 3,551 4,155 4,491 4,844 5,208 5,619
Sources: EIA, Annual Energy Outlook 2006, DOE/EIA-0383 (2006), (Washington, D.C., February 2006), Table A8; and EIA, Annual Energy Review 2004, DOE/EIA-0384(2004) (Washington, D.C., September 2005), Table 8.9.
Notes: 1 Electricity retail sales to ultimate customers reported by electric utilities and, beginning in 1996, other energy-service providers.2 Commercial sector, including public street and highway lighting, interdepartmental sales, and other sales to public authorities. 3Industrial sector. Through 2002, excludes agriculture and irrigation; beginning in 2003, includes agriculture and irrigation.4Transportation sector, including sales to railroads and railways. 5The sum of "Residential," "Commercial," "Industrial," and "Transportation."
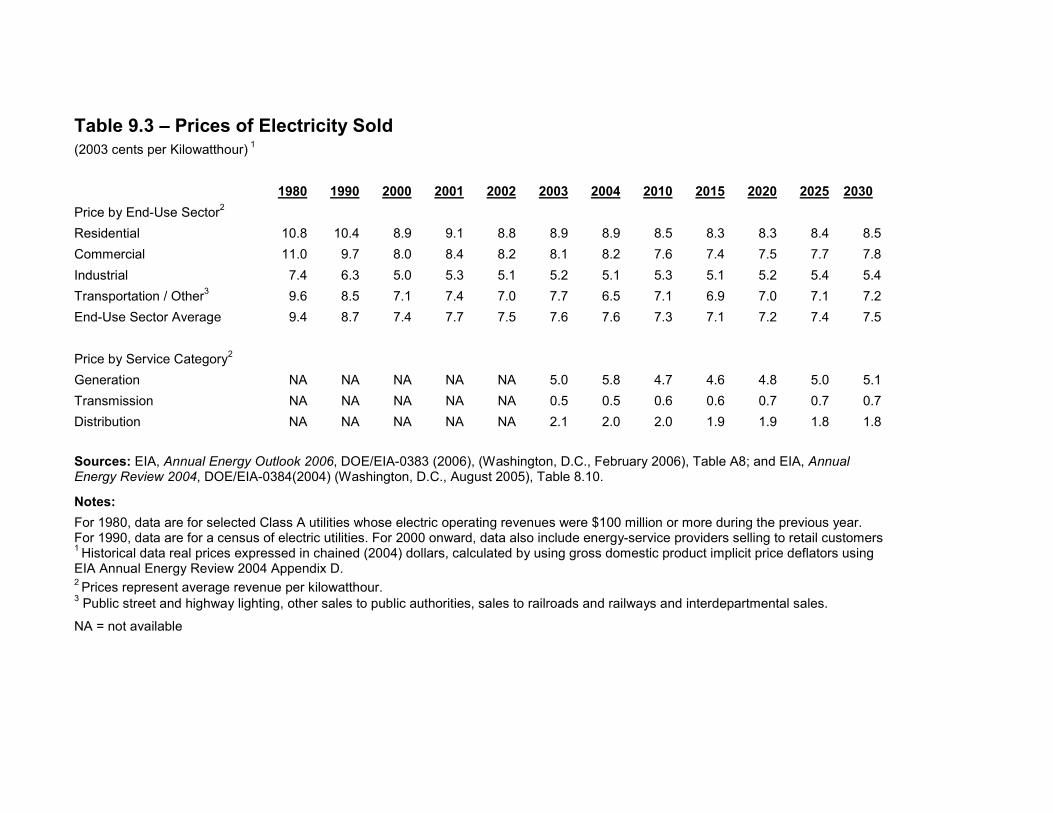
Table 9.3 – Prices of Electricity Sold (2003 cents per Kilowatthour) 1
1980 1990 2000 2001 2002 2003 2004 2010 2015 2020 2025 2030 Price by End-Use Sector2
Residential 10.8 10.4 8.9 9.1 8.8 8.9 8.9 8.5 8.3 8.3 8.4 8.5 Commercial 11.0 9.7 8.0 8.4 8.2 8.1 8.2 7.6 7.4 7.5 7.7 7.8 Industrial 7.4 6.3 5.0 5.3 5.1 5.2 5.1 5.3 5.1 5.2 5.4 5.4 Transportation / Other3 9.6 8.5 7.1 7.4 7.0 7.7 6.5 7.1 6.9 7.0 7.1 7.2 End-Use Sector Average 9.4 8.7 7.4 7.7 7.5 7.6 7.6 7.3 7.1 7.2 7.4 7.5
Price by Service Category2
Generation NA NA NA NA NA 5.0 5.8 4.7 4.6 4.8 5.0 5.1 Transmission NA NA NA NA NA 0.5 0.5 0.6 0.6 0.7 0.7 0.7 Distribution NA NA NA NA NA 2.1 2.0 2.0 1.9 1.9 1.8 1.8
Sources: EIA, Annual Energy Outlook 2006, DOE/EIA-0383 (2006), (Washington, D.C., February 2006), Table A8; and EIA, Annual Energy Review 2004, DOE/EIA-0384(2004) (Washington, D.C., August 2005), Table 8.10.
Notes: For 1980, data are for selected Class A utilities whose electric operating revenues were $100 million or more during the previous year.For 1990, data are for a census of electric utilities. For 2000 onward, data also include energy-service providers selling to retail customers1 Historical data real prices expressed in chained (2004) dollars, calculated by using gross domestic product implicit price deflators usingEIA Annual Energy Review 2004 Appendix D. 2 Prices represent average revenue per kilowatthour. 3 Public street and highway lighting, other sales to public authorities, sales to railroads and railways and interdepartmental sales.
NA = not available

Table 9.4 – Revenue from Electric-Utility Retail Sales by Sector (Millions of 2004 Dollars)
1980 1990 2000 2001 2002 2003 2004 2010 2015 2020 2025 2030
Residential 77,598 95,980 106,351 109,579 111,453 113,090 115,594 124,185 130,808 140,353 150,108 161,245 Commercial 61,537 81,624 93,235 100,369 99,536 97,760 100,369 108,680 117,808 132,150 149,688 167,778 Industrial 60,399 59,455 53,448 51,368 49,331 52,803 52,173 56,180 56,259 59,658 64,533 68,165 Transportation/Other 1 289 424 355 372 420 542 519 1,846 1,932 2,030 2,130 All Sectors 2 197,153 236,419 252,190 260,731 259,589 264,291 268,811 303,315 318,865 348,741 385,392 421,425
Sources: Calculated from EIA, Annual Energy Outlook 2006, DOE/EIA-0383 (2006), (Washington, D.C., February 2006), Table A8; EIA, Annual Energy Review 2004, DOE/EIA-0384 (2004) (Washington, D.C., August 2005), Tables 8.9 and 8.10. Notes: 1 “Other” includes public street and highway lighting, other sales to public authorities, sales to railroads and railways, and interdepartmental sales through 2003.Transportation-sector revenue reported starting in 2010. 2 For 1980, data are for selected Class A utilities whose electric operating revenues were $100 million or more during the previous year. For 1990, data are for a census of electric utilities. For 2000 onward, data also include energy-service providers selling to retail customers

Table 9.5 – Revenue from Sales to Ultimate Consumers by Sector, Census Division, and State, 2004 (Millions of 2004 Dollars)
Census Division/ Residen- Commer- Census Division/ Residen- Commer-State tial cial Industrial Other1 All Sectors 2 State tial cial Industrial Other1 All Sectors 2
New England 5,560 5,696 1,995 33 13,284 East South Central 7,934 5,551 5,134 0 18,618 Connecticut 1,537 1,332 423 14 3,305 Alabama 2,295 1,506 1,477 0 5,278 Maine 527 428 244 - 1,198 Kentucky 1,538 1,034 1,432 0 4,004 Massachusetts 2,323 2,858 844 19 6,045 Mississippi 1,444 1,019 759 0 3,221 New Hampshire 535 480 233 - 1,248 Tennessee 2,657 1,992 1,466 0 6,115 Rhode Island 366 373 126 - 865 West South Central 16,701 11,299 8,945 7 36,952 Vermont 273 226 126 - 624 Arkansas 1,150 605 720 0 2,475 Middle Atlantic 14,890 17,221 5,266 302 37,679 Louisiana 2,324 1,710 1,646 1 5,682 New Jersey 3,148 3,793 1,012 32 7,984 Oklahoma 1,520 1,116 677 0 3,313 New York 6,890 9,654 1,455 210 18,209 Texas 11,707 7,867 5,902 6 25,482 Pennsylvania 4,853 3,774 2,799 60 11,486 Mountain 6,732 5,975 3,596 3 16,306 East North Central 14,847 12,855 10,187 32 37,920 Arizona 2,447 1,901 637 0 4,985 Illinois 3,638 3,570 2,232 25 9,465 Colorado 1,307 1,343 596 1 3,247 Indiana 2,277 1,448 2,022 1 5,749 Idaho 446 294 344 0 1,085 Michigan 2,759 2,925 1,717 0 7,401 Montana 319 321 190 0 830 Ohio 4,251 3,510 2,864 5 10,629 Nevada 1,034 752 895 0 2,681 Wisconsin 1,922 1,401 1,353 - 4,677 New Mexico 488 609 312 0 1,409 West North Central 7,044 5,505 3,544 1 16,095 Utah 528 551 314 2 1,395 Iowa 1,132 731 756 - 2,619 Wyoming 163 203 308 0 674 Kansas 962 893 510 - 2,364 Pacific Contiguous 13,990 16,307 6,063 46 36,407 Minnesota 1,624 1,287 1,038 1 3,950 California 10,628 13,554 4,710 43 28,935 Missouri 2,185 1,648 661 0 4,494 Oregon 1,293 1,010 529 1 2,833 Nebraska 610 497 369 - 1,475 Washington 2,069 1,742 825 3 4,638

Pacific North Dakota 249 225 124 - 599 Noncontiguous 828 874 619 0 2,321 South Dakota 283 224 87 - 594 Alaska 256 286 94 0 636 South Atlantic 27,510 18,973 8,310 80 54,874 Hawaii 571 588 526 0 1,685 Delaware 378 300 207 - 885 U.S. Total 116,037 100,255 53,661 504 270,456 District of Columbia 147 670 13 22 852 Florida 10,086 6,601 1,140 7 17,835 Georgia 4,016 2,912 1,587 9 8,525 Maryland 2,181 1,304 1,269 31 4,785 North Carolina 4,369 2,871 1,516 - 8,756 South Carolina 2,267 1,390 1,315 - 4,972 Virginia 3,397 2,530 843 10 6,780 West Virginia 670 394 419 0 1,483
Source: EIA, Electric Sales and Revenue 2004 Spreadsheets, Data Tables, http://www.eia.doe.gov/cneaf/electricity/esr/esr_tabs.html, Table 1c. Notes: 1 Includes sales for public street and highway lighting, to public authorities, railroads and railways, and interdepartmental sales. 2 Includes bundled and unbundled consumers.

Table 9.6 – Production, Operation, and Maintenance Expenses for Major U.S. Investor-Owned and Publicly Owned Utilities (Million of Nominal Dollars)
Production Expenses Cost of Fuel Purchased Power Other Production Expenses Total Production Expenses2
Operation and Maintenance Expenses Transmission Expenses Distribution Expenses Customer Accounts Expenses Customer Service and Information Expenses Sales Expenses Administrative and General Expenses Total Electric Operation and Maintenance Expenses
Investor-Owned Utilities Publicly Owned Utilities1,3
1990 1995 2000 2002 2003 2004 1990 1995 2000 2002 2003
32,635 29,122 32,555 24,132 26,476 28,678 5,276 5,664 7,702 9,348 10,37820,341 29,981 61,969 58,828 62,173 67,354 10,542 11,988 16,481 24,446 26,0789,526 9,880 12,828 7,688 7,532 8,256 155 212 225 1,647 1,285
62,502 68,983 107,352 90,649 96,181 104,288 15,973 17,863 24,398 36,188 38,526
1,130 1,425 2,699 3,494 3,585 4,519 604 663 845 951 9772,444 2,561 3,115 3,113 3,185 3,301 950 630 854 1,000 1,0443,247 3,613 4,246 4,165 4,180 4,087 375 448 662 700 7541,181 1,922 1,839 1,821 1,893 2,012 75 120 233 354 311
212 348 403 261 234 238 29 30 82 84 9510,371 13,028 13,009 12,872 13,466 13,519 1,619 2,127 2,097 2,594 2,742 18,585 22,897 25,311 25,726 26,543 27,676 3,653 4,018 4,772 5,683 5,923
Source: EIA, Electric Power Annual 2004, DOE/EIA-0348(2004) (Washington, D.C., November 2005), Tables 8.1, 8.3, and 8.4; and EIA, Electric Power Annual 2001, DOE/EIA-0348(2001) (Washington, D.C., December 2002), Table 8.1; EIA, Financial Statistics of Major US Publicly Owned Electric Utilities 1994, DOE/EIA-0437(94)/2 (Washington, D.C., December 1995), Table 8 and Table 17; EIA, Financial Statistics of Major US Publicly Owned Electric Utilities 1999, DOE/EIA-0437(99)/2 (Washington, D.C., November 2000), Table 10 and Table 21; EIA, Financial Statistics of Major US Publicly Owned Electric Utilities 2000, DOE/EIA-0437(00)/2 (Washington, D.C., November 2001), Table 10 and Table 21.; EIA, Public Electric Utility Database (Form EIA-412) 2002 and 2003. Notes: 1 Publicly Owned Utilities include generator and nongenerator electric utilities. 2 Totals may not equal sum of components, because of independent rounding. 3 Collection of Form EIA-412 has been suspended, data for 2004 not available.


Table 9.6a – Operation and Maintenance Expenses for Major U.S. Investor-Owned Electric Utilities (Million of Nominal Dollars, unless otherwise indicated)
1990 1995 2000 2002 2003 2004
Utility Operating Expenses 142,471 165,321 210,324 188,745 197,459 207,161 Electric Utility 127,901 150,599 191,329 171,291 175,473 182,337 Operation 81,086 91,881 132,662 116,374 122,723 131,962 Production 62,501 68,983 107,352 90,649 96,181 104,287 Cost of Fuel 32,635 29,122 32,555 24,132 26,476 28,678 Purchased Power 20,341 29,981 61,969 58,828 62,173 67,354 Other 9,526 9,880 12,828 7,688 7,532 8,256 Transmission 1,130 1,425 2,699 3,494 3,585 4,519 Distribution 2,444 2,561 3,115 3,113 3,185 3,301 Customer Accounts 3,247 3,613 4,246 4,165 4,180 4,087 Customer Service 1,181 1,922 1,839 1,821 1,893 2,012 Sales 212 348 403 261 234 238 Administrative and General 10,371 13,028 13,009 12,872 13,466 13,519 Maintenance 11,779 11,767 12,185 10,843 11,141 11,774 Depreciation 14,889 19,885 22,761 17,319 16,962 16,373 Taxes and Other 20,146 27,065 23,721 26,755 24,648 22,228 Other Utility 14,571 14,722 18,995 17,454 21,986 24,823
Operation (Mills per Kilowatthour) 1
Nuclear 10.04 9.43 8.41 8.54 8.86 8.3 Fossil Steam 2.21 2.38 2.31 2.54 2.50 2.68 Hydroelectric and Pumped Storage 3.35 3.69 4.74 5.07 4.50 5.05 Gas Turbine and Small Scale 2 8.76 3.57 4.57 2.72 2.76 2.73
Maintenance (Mills per Kilowatthour) 1
Nuclear 5.68 5.21 4.93 5.04 5.23 5.38 Fossil Steam 2.97 2.65 2.45 2.68 2.73 2.96 Hydroelectric and Pumped Storage 2.58 2.19 2.99 3.58 3.01 3.64 Gas Turbine and Small Scale 2 12.23 4.28 3.50 2.38 2.26 2.16 Source: EIA, Electric Power Annual 2004, DOE/EIA-0348(2004) (Washington, D.C., November 2005), Tables 8.1 and 8.2; and EIA, Electric Power Annual 2001, Tables 8.1 and 8.2. Notes: 1 Operation and maintenance expenses are averages, weighed by net generation. 2Includes gas turbine, internal combustion, photovoltaic, and wind plants.

Table 9.6b – Operation and Maintenance Expenses for Major U.S. Publicly Owned Generator and Nongenerator Electric Utilities (Million of Nominal Dollars, except employees)
1990 1995 2000 2002 2003 Production Expenses Steam Power Generation 3,742 3,895 5,420 6,558 7,539 Nuclear Power Generation 1,133 1,277 1,347 1,646 1,739 Hydraulic Power Generation 205 261 332 746 785 Other Power Generation 196 231 603 1,144 1,100 Purchased Power 10,542 11,988 16,481 24,446 26,078 Other Production Expenses 155 212 225 1,647 1,285 Total Production Expenses1 15,973 17,863 24,398 36,188 38,526
Operation and Maintenance Expenses Transmission Expenses 604 663 845 951 977 Distribution Expenses 950 630 854 1,000 1,044 Customer Accounts Expenses 375 448 662 700 754 Customer Service and Information Expenses 75 120 233 354 311 Sales Expenses 29 30 82 84 95 Administrative and General Expenses 1,619 2,127 2,097 2,594 2,742 Total Electric Operation and Maintenance Expenses 3,653 4,018 4,772 5,683 5,923
Total Production and Operation and Maintenance Expenses 19,626 22,651 30,100 44,813 47,165
Fuel Expenses in Operation Steam Power Generation 2,395 2,163 4,150 4,818 5,624 Nuclear Power Generation 242 222 316 433 398 Other Power Generation 113 101 373 754 771
Total Electric Department Employees2 N/A 73,172 71,353 93,520 92,752
Source: EIA, Financial Statistics of Major US Publicly Owned Electric Utilities 1994, DOE/EIA-0437(94)/2 (Washington, D.C., December 1995), Table 8 and Table 17; EIA, Financial Statistics of Major U.S. Publicly Owned Electric Utilities 1999, DOE/EIA-0437(99)/2 (Washington, D.C., November 2000), Table 10 and Table 21; EIA,Financial Statistics of Major U.S. Publicly Owned Electric Utilities 2000, DOE/EIA-0437(00)/2 (Washington, D.C., November 2001), Table 10 and Table 21; EIA, Public Electric Utility Database (Form EIA-412) 2002 and 2003; EIA, Electric Power Annual 2003, DOE/EIA-0348(2003) (Washington, D.C., December 2004), Tables 8.3 and 8.4Notes: EIA suspended collection of this dataset in 2004.1 Totals may not equal sum of components, because of independent rounding.2 Number of employees was not submitted by some publicly owned electric utilities, because the number of electricutility employees could not be separated from the other municipal employees, or the electric utility outsourced much of the work. NA = not available
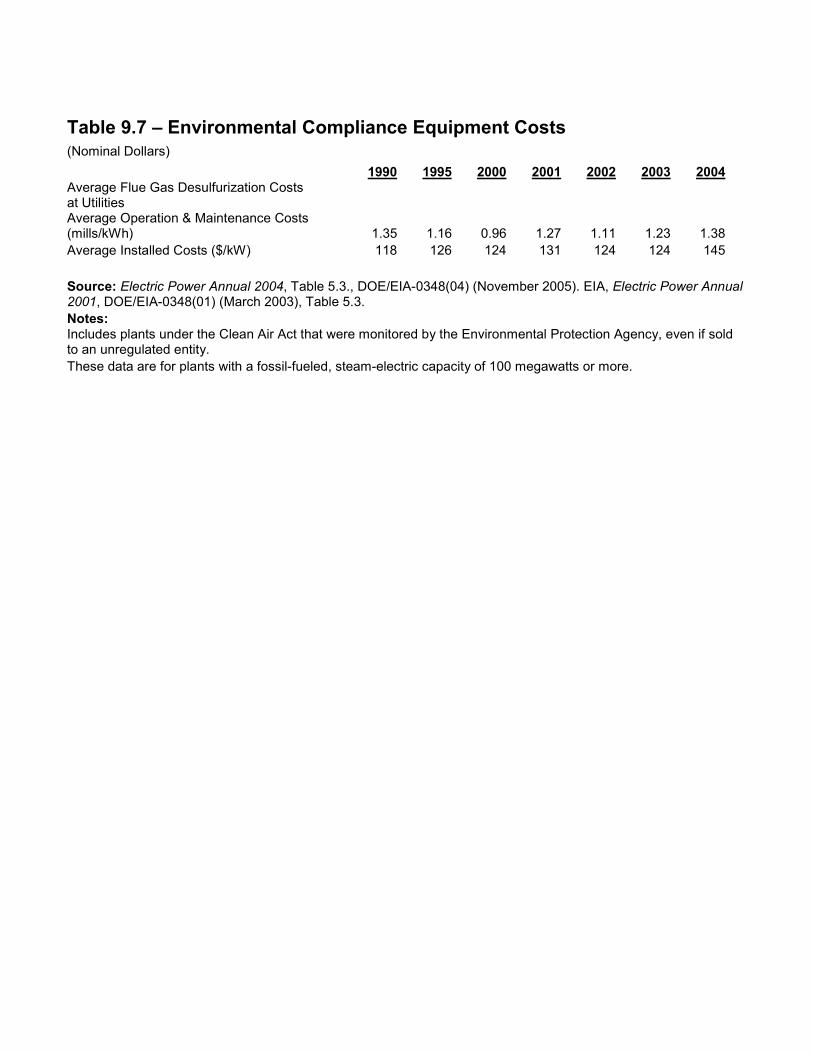
Table 9.7 – Environmental Compliance Equipment Costs(Nominal Dollars)
1990 1995 2000 2001 2002 2003 2004 Average Flue Gas Desulfurization Costs at Utilities Average Operation & Maintenance Costs (mills/kWh) 1.35 1.16 0.96 1.27 1.11 1.23 1.38 Average Installed Costs ($/kW) 118 126 124 131 124 124 145
Source: Electric Power Annual 2004, Table 5.3., DOE/EIA-0348(04) (November 2005). EIA, Electric Power Annual 2001, DOE/EIA-0348(01) (March 2003), Table 5.3. Notes: Includes plants under the Clean Air Act that were monitored by the Environmental Protection Agency, even if sold to an unregulated entity. These data are for plants with a fossil-fueled, steam-electric capacity of 100 megawatts or more.

Table 10.1 – Consumer Price Estimates for Energy Purchases (2004 Dollars, per Million Btu)1
1970 1980 1990 2000 2005 2010 2015 2020 2025 2030
Coal 1.49 2.92 1.98 1.34 1.52 1.51 1.43 1.42 1.46 1.53 Natural Gas 2.32 5.73 5.07 6.08 9.60 7.19 6.60 6.93 7.47 7.98 Distillate Fuel 4.56 13.42 10.19 10.67 15.28 13.30 13.72 14.07 14.52 15.04 Jet Fuel 2.87 12.74 7.54 7.14 12.64 9.67 9.87 10.49 10.92 11.53 Liquified Petroleum Gases 5.74 11.30 8.97 11.03 18.04 13.39 13.19 14.38 15.66 16.90 Motor Gasoline 11.20 19.71 12.10 13.00 18.60 16.52 16.34 17.02 17.49 17.92 Residual Fuel 1.65 7.77 4.21 4.68 6.79 6.07 6.03 6.31 6.75 7.12
Other 2 5.42 14.10 7.72 7.54 NA NA NA NA NA NA Petroleum Total 6.76 14.82 9.91 10.73 15.28 13.30 13.72 14.07 14.52 15.04 Nuclear Fuel 0.71 0.86 0.89 0.50 N/A N/A N/A N/A N/A N/A Wood and Waste 5.07 4.53 1.72 1.73 N/A N/A N/A N/A N/A N/A Primary Energy Total 3 4.25 9.15 5.90 6.18 13.61 11.52 11.40 11.89 12.35 12.86
Electric Utility Fuel 1.26 3.52 1.95 1.78 NA NA NA NA NA NA Electricity Purchased by End Users 19.58 27.94 25.64 21.69 24.44 21.43 20.87 21.23 21.69 22.00
Total Energy 3 6.49 13.80 10.94 11.18 15.57 13.32 13.16 13.66 14.14 14.64 1.49 2.92 1.98 1.34 1.52 1.51 1.43 1.42 1.46 1.53
Sources: EIA, Annual Energy Outlook 2006, DOE/EIA-0383 (2006), (Washington, D.C., February 2006), Table A3; and EIA, Annual Energy Review 2004, DOE/EIA-0384 (2004) (Washington, D.C., August 2005), Table 3.3. Notes: 1 Historical data converted to 2004$/MMBtu using GDP deflators from EIA, Annual Energy Review 2004, DOE/EIA-0384(2004) (Washington, D.C., September 2005), Table D.1. 2 Consumption-weighted average price for asphalt and road oil, aviation gasoline, kerosene, lubricants, petrochemical feedstocks, petroleum coke, special naphthas, waxes, and miscellaneous petroleum products. 3 The "Primary Energy Total" and "Total Energy" prices include consumption-weighted average prices for coal coke imports and coal coke exports that are not shown in the other columns.NA = not available

Table 10.2 – Economy-Wide Indicators (Billions of 2000 Chain Weighted Dollars, unless otherwise noted)
1980 1990 2000 2004 2010 2015 2020 2025 2030
GDP Chain Type Price Index (2000 = 1.000) 0.541 0.816 1.000 1.091 1.235 1.398 1.597 1.818 2.048
Real Gross Domestic Product 5,162 7,113 9,817 10,756 13,043 15,082 17,541 20,123 23,112 Real Consumption 3,374 4,770 6,739 7,589 9,128 10,373 11,916 13,555 15,352 Real Investment 645 895 1,736 1,810 2,259 2,713 3,293 4,025 4,985 Real Government Spending 1,115 1,530 1,722 1,952 2,150 2,296 2,464 2,631 2,838 Real Exports 324 553 1,096 1,118 1,831 2,671 3,776 5,083 6,833 Real Imports 311 607 1,476 1,719 2,295 2,857 3,659 4,734 6,156
Real Disposable Personal Income 3,858 5,324 7,194 8,004 9,622 11,058 13,057 15,182 17,562 Consumer Price Index (2002 = 1.000) 0.824 1.307 1.722 1.889 2.153 2.464 2.862 3.310 3.783 Unemployment Rate (percent) 7.1 5.6 4.0 5.5 4.7 4.6 4.4 4.8 4.9 Housing Starts (millions) 1.3 1.2 1.6 2.1 2.0 2.0 1.9 1.8 1.8
Gross Output Total Industrial 5,643 6,355 7,036 7,778 8,589 9,578 Non-Manufacturing 1,439 1,572 1,689 1,808 1,926 2,069 Manufacturing 4,204 4,783 5,347 5,969 6,664 7,509 Energy-Intensive Manufacturing 1,161 1,265 1,350 1,441 1,529 1,627 Non-Energy-Intensive Manufacturing 3,044 3,518 3,997 4,528 5,135 5,882
Population (all ages, millions) 226.5 248.8 281.4 294.1 310.1 323.5 337.0 350.6 364.8 Employment Non-Agriculture (millions) 95.9 115.6 134.4 131.4 142.1 147.6 156.2 164.2 173.6 Employment Manufacturing (millions) 20.4 19.2 17.5 14.3 14.0 13.5 13.3 12.9 12.6 Sources: EIA, Annual Energy Outlook 2006, DOE/EIA-0383(2006) (Washington, D.C., February 2006), Table A19; EIA, Annual Energy Review 2003, DOE/EIA-0384(2003) (Washington, D.C., October 2004), Table D1, Bureau Of Economic Analysis, National Income and Products Accounts Tables (NIPA), Tables 1.1.4, 1.1.6, 2.1, and 6.4 B-D, http://www.bea.doc.gov/bea/dn/nipaweb/NIPATableIndex.asp, Department of Labor, Bureau of Labor Statistics, Current Population Survey, Current Population Survey, Household Data Annual Averages, http://www.bls.gov/cps/cpsa2003.pdf, National Association of Home Builders, http://www.nahb.org/generic.aspx?sectionID=130&genericContentID=554.

Table 10.3 – Composite Statements of Income for Major U.S. Publicly Owned Generator and Investor-Owned Electric Utilities, 2004 (Million 2004 Dollars)
Investor-Owned Publicly Owned Generator Cooperative Borrower Electric Utilities Electric Utilities 1, 2 Owned Electric Utilities
Operating Revenue - Electric 213,539 46,360 30,650 Operating Expenses - Electric 182,337 41,118 27,828 Operation Including Fuel 131,962 32,737 25,420 Production 104,287 26,813 20,752 Transmission 4,519 977 665 Distribution 3,301 1,044 1,860 Customer Accounts 4,180 754 595 Customer Service 2,012 311 141 Sales 238 95 80 Administrative and General 13,519 2,742 1,327 Maintenance 11,774 2,504 NA Depreciation and Amortization 16,373 4,555 2,182 Taxes and Tax Equivalents 22,228 1,323 226 Net Electric Operating Income 33,158 5,242 2,822
Source: EIA, Electric Power Annual 2004, DOE/EIA-0348(2003), (Washington, D.C., November 2005), Tables 8.1, 8.3, 8.4, and 8.6. Note: 1 The data represent those utilities meeting a threshold of 150 million kilowatthours of customer sales or resale for the two previous years. 2 Values for 2003. In 2004, Form EIA-412 has been suspended until further notice. Includes utilities with and without generating facilities. NA= not available
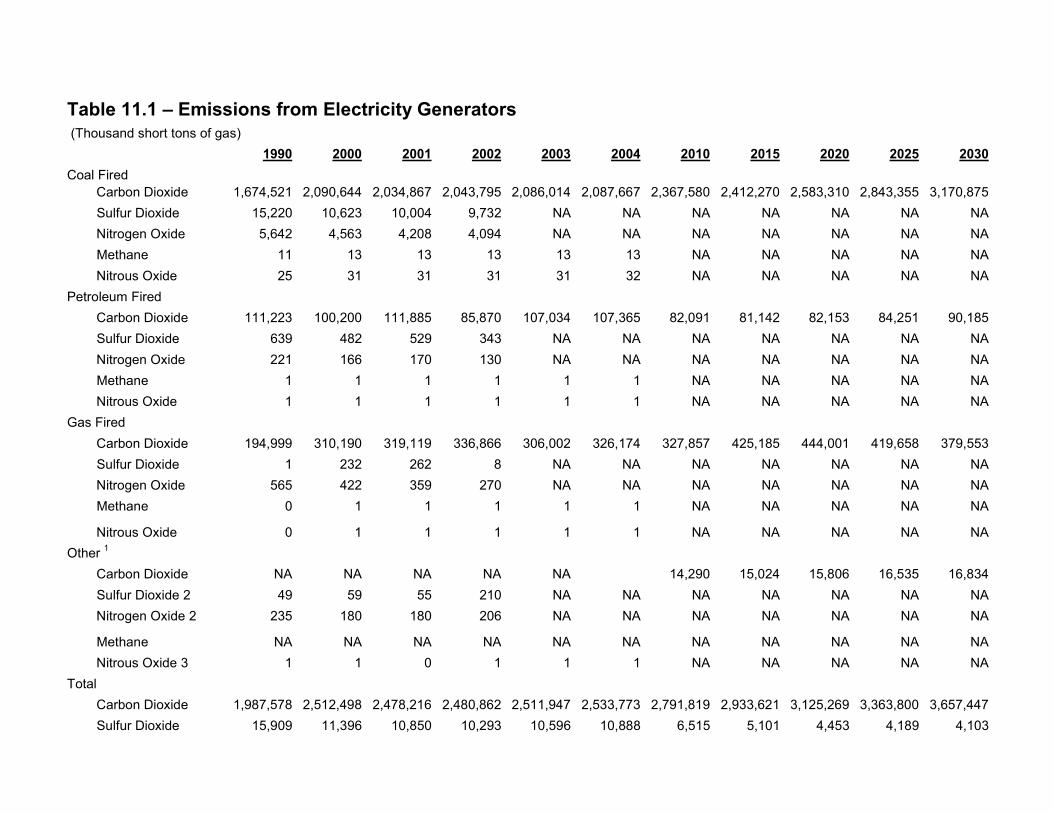
Table 11.1 – Emissions from Electricity Generators (Thousand short tons of gas)
1990 2000 2001 2002 2003 2004 2010 2015 2020 2025 2030 Coal Fired Carbon Dioxide 1,674,521 2,090,644 2,034,867 2,043,795 2,086,014 2,087,667 2,367,580 2,412,270 2,583,310 2,843,355 3,170,875
Sulfur Dioxide 15,220 10,623 10,004 9,732 NA NA NA NA NA NA NA Nitrogen Oxide 5,642 4,563 4,208 4,094 NA NA NA NA NA NA NA
Methane 11 13 13 13 13 13 NA NA NA NA NA Nitrous Oxide 25 31 31 31 31 32 NA NA NA NA NA Petroleum Fired Carbon Dioxide 111,223 100,200 111,885 85,870 107,034 107,365 82,091 81,142 82,153 84,251 90,185
Sulfur Dioxide 639 482 529 343 NA NA NA NA NA NA NA Nitrogen Oxide 221 166 170 130 NA NA NA NA NA NA NA
Methane 1 1 1 1 1 1 NA NA NA NA NA Nitrous Oxide 1 1 1 1 1 1 NA NA NA NA NA Gas Fired Carbon Dioxide 194,999 310,190 319,119 336,866 306,002 326,174 327,857 425,185 444,001 419,658 379,553
Sulfur Dioxide 1 232 262 8 NA NA NA NA NA NA NA Nitrogen Oxide 565 422 359 270 NA NA NA NA NA NA NA
Methane 0 1 1 1 1 1 NA NA NA NA NA
Nitrous Oxide 0 1 1 1 1 1 NA NA NA NA NA Other 1
Carbon Dioxide NA NA NA NA NA 14,290 15,024 15,806 16,535 16,834 Sulfur Dioxide 2 49 59 55 210 NA NA NA NA NA NA NA
Nitrogen Oxide 2 235 180 180 206 NA NA NA NA NA NA NA
Methane NA NA NA NA NA NA NA NA NA NA NA Nitrous Oxide 3 1 1 0 1 1 1 NA NA NA NA NA Total Carbon Dioxide 1,987,578 2,512,498 2,478,216 2,480,862 2,511,947 2,533,773 2,791,819 2,933,621 3,125,269 3,363,800 3,657,447
Sulfur Dioxide 15,909 11,396 10,850 10,293 10,596 10,888 6,515 5,101 4,453 4,189 4,103

Nitrogen Oxide 6,663 5,330 4,917 4,699 4,119 3,742 2,585 2,312 2,345 2,379 2,390 Mercury NA NA NA 50,081 50,695 53,306 41,595 26,503 20,653 18,283 16,872 Methane 12 14 14 14 14 14 NA NA NA NA NA
Nitrous Oxide 26 33 33 33 33 33 NA NA NA NA NA Sulfur Hexafluoride 4 2 1 1 1 1 1 NA NA NA NA NA
Sources: EIA, Annual Energy Outlook 2006, DOE/EIA-0383 (2005) (Washington, D.C., February 2006), Tables A8 and A18; EIA, Emissions of Greenhouse Gases in the United States 2004, DOE/EIA-0573(2003) (Washington, D.C., November 2005) Tables 10, 17, 25, 29; and EPA, National Emission Inventory -Air Pollutant Emission Trends, “Average Annual Emissions, All Criteria Pollutants,” August 2004, http://www.epa.gov/ttn/chief/trends/index.html. Notes: Emissions from electric-power sector only.1 Emissions total less than 500 tons. 2 Emissions from plants fired by other fuels; includes internal-combustion generators.3 Emissions from wood-burning plants.4 Sulfur hexafluoride (SF6) is a colorless, odorless, nontoxic, and nonflammable gas used as an insulator in electric T&D equipment. SF6 has a 100-yearglobal warming potential that is 22,200 times that of carbon dioxide and has an atmospheric lifetime of 3,200 years.NA = not available

Table 11.2 – Installed Nameplate Capacity of Utility Steam-Electric Generators With Environmental Equipment (Megawatts)
1990 2000 2001 2002 2003 2004 Coal Fired
Particulate Collectors 315,681 321,636 329,187 329,459 328,587 NA Cooling Towers 134,199 146,093 154,747 154,750 155,158 NA
Scrubbers 69,057 89,675 97,804 98,363 99,257 NA Total1 317,522 328,741 329,187 329,459 328,587 NA
Petroleum and Gas Fired Particulate Collectors 33,639 31,090 31,575 29,879 29,422 NA
Cooling Towers 28,359 29,427 34,649 45,747 55,770 NA Scrubbers 65 0 184 310 310 NA
Total1 59,372 57,697 61,634 71,709 81,493 NA
Total Particulate Collectors 349,319 352,727 360,762 359,338 358,009 355,782
Cooling Towers 162,557 175,520 189,396 200,497 210,928 214,989 Scrubbers 69,122 89,675 97,988 98,673 99,567 101,492
Total1 376,894 386,438 390,821 401,168 409,954 409,769
Source: EIA, Annual Energy Review 2004, DOE/EIA-0384(2004) (Washington, D.C., September 2005), Table 12.8. 2004 Total Data: EIA Electric Power Annual. DOE/EIA-0348(2004), http://www.eia.doe.gov/cneaf/electricity/epa/epat5p2.html, Table 5.2. Notes: 1Components are not additive, because some generators are included in more than one category.Through 2000, data are for electric utilities with fossil-fueled, steam-electric capacity of 100 megawatts or greater. Beginning in 2001,data are for electric utilities and unregulated generating plants (independent power producers, commercial plants, and industrial plants) with fossil-fueled or combustible renewable steam-electric capacity of 100 megawatts or greater. NA = not available

Table 11.3 – EPA-Forecasted Nitrogen Oxide, Sulfur Dioxide, and Mercury Emissions from Electric Generators
2007 EPA Base Case 2004
2010 2015 2020
SO2 (Thousand Tons) NOx (Thousand Tons) CO2 (Thousand Tons)
10,374 3,665 2,391
9,908 3,679 2,470
9,084 3,721 2,599
8,876 3,758 2,796
EPA CAIR Case 2004 2007 2010 2015 2020
7,733 6,351 5,227 4,480 3,600 2,453 2,212 2,231 2,365 2,452 2,571 2,776
Source: Environmental Protection Agency (EPA), Runs Table for EPA Modeling Applications 2004, using IPM http://www.epa.gov/airmarkets/epa-ipm/iaqr.html, EPA Base Case for 2004 Analyses http://www.epa.gov/airmarkets/epa-ipm/iaqr/basecase2004.zip, and 2004 CAIR Case Final 2004 http://www.epa.gov/airmarkets/epa-ipm/iaqr/cair2004_final.zip Notes: Analytical Framework of IPM • EPA uses the Integrated Planning Model (IPM) to analyze the projected impact of environmental policies on the electric-power sector in the 48 contiguous states and the District of Columbia. Developed by ICF Resources Incorporated, and used to support public and private-sector clients, IPM is a multiregional, dynamic, deterministic linear programming model of the U.S. electric-power sector. • The model provides forecasts of least-cost capacity expansion, electricity dispatch, and emission-control strategies for meeting energy demand and environmental, transmission, dispatch, and reliability constraints. IPM can be used to evaluate the cost and emissions impacts of proposed policies to limit emissions of sulfur dioxide (SO2), nitrogen oxides (NOx), carbon dioxide (CO2), and mercury (Hg) from the electric-power sector

Table 11.4 – Origin of 2004 Allowable SO2 Emissions Levels
Number of SO2 Allowances
Type of Allowance Allocation Explanation of Allowance Allocation Type
Initial Allocation 9,191,897 Initial allocation is the number of allowances granted to units, based on the product of their historic utilization and emissions rates specified in the Clean Air Act.
Allowance Auctions 250,000 The allowance auction provides allowances to the market that were set aside in a Special Allowance Reserve when the initial allowance allocation was made.
Opt-in Allowances 99,188 Opt-in Allowances are provided to units entering the program voluntarily. There were 11 opt-in units in 2004.
TOTAL 2004 ALLOCATION 9,541,085
Banked Allowances 8,646,818 Banked Allowances are those allowances accrued in a unit's account from previous years, which can be used for compliance in 2004 or any future year.
TOTAL 2004 ALLOWABLE 18,187,903 Source: EPA, Acid Rain Program 2004 Progress Report, Document EPA-430-R-05-011, November 2005, Figure 4. http://www.epa.gov/airmarkets/cmprpt/arp04/2004report.pdf

Table 12.1 – Renewable Energy Impacts Calculation
Conversion Formula: Step 1 Capacity (A) x Capacity Factor (B) x Annual Hours (C) = Annual Electricity Generation (D)Step 2 Annual Electricity Generation (D) x Competing Heat Rate (E) = Annual Output (F)Step 3 Annual Output (F) x Emissions Coefficient (G) = Annual Emissions Displaced (H)
Technology Wind Geothermal Biomass Hydropower PV Solar Thermal(A) Capacity (kW) 11,558,205 2,232,495 6,594,096 78,312,583 280,355 388,893 (B) Capacity Factor (%) 36.0% 90.0% 80.0% 44.2% 22.5% 24.4% (C) Annual Hours 8,760 8,760 8,760 8,760 8,760 8,760 (D) Annual Electricity Generation (kWh) 36,449,954,187 17,600,991,128 46,211,427,727 303,176,455,525 552,579,314 831,235,472 (E) Competing Heat Rate (Btu/kWh) 10,107 10,107 10,107 10,107 10,107 10,107 (F) Annual Output (Trillion Btu) 368 178 467 3,064 6 8 (G) Carbon Coefficient (MMTCB/Trillion Btu) 0.01783 0.01783 0.01783 0.01783 0.01783 0.01783 (H) Annual Carbon Displaced (MMTC) 6.569 3.172 8.328 54.635 0.100 0.128
Sources:Capacity: Projected values for the year 2006 from EIA, Annual Energy Outlook 2006, DOE/EIA-0383 (2006) (Washington, D.C., February 2006), Table A16, 2005.Capacity factors: Hydropower calculated from EIA, Annual Energy Outlook 2005, DOE/EIA-0383 (2005) (Washington, D.C., February 2005), Table A16. All others based on DOE, Renewable Energy Technology Characterizations, EPRI TR-109496, 1997, and program data.Heat Rate: EIA, Annual Energy Review 2004, DOE/EIA-0384(2004) (Washington, D.C., August 2005), Table A6.Carbon Coefficient: DOE, GPRA2003 Data Call, Appendix B, page B-16, 2003. Notes: For illustrative purposes only, displacement of fossil generation depends on power system generation portfolio and dispatch order. Capacity values exclude combined-heat-and-power (CHP) data, but include end-use sector (industrial and commercial) non-CHP data. Competing heat rate from Fossil-Fueled Steam-Electric Plants heat rate.
201

Table 12.2 – Number of Home Electricity Needs Met Calculation
Conversion Formula: Step 1 Capacity (A) x Capacity Factor (B) x Annual Hours (C) = Annual Electricity Generation (D)Step 2 Annual Electricity Generation (D) / Average Consumption (E) = Number of Households (F)
Technology Wind Geothermal Biomass Hydropower PV Solar Thermal(A) Capacity (kW) 11,558,205 2,232,495 6,594,096 78,312,583 280,355 388,893(B) Capacity Factor (%) 36.0% 90.0% 80.0% 44.2% 22.5% 24.4%(C) Annual Hours 8,760 8,760 8,760 8,760 8,760 8,760(D) Annual Electricity Generation (kWh) 36,449,954,187 17,600,991,128 46,211,427,727 303,176,455,525 552,579,314 831,235,472(E) Average Annual Household Electricity Consumption (kWh) 11,586 11,586 11,586 11,586 11,586 11,586(F) Number of Households 3,148,804 1,520,497 3,992,068 26,190,515 47,736 71,808
Sources: Capacity: Projected values for the year 2006 from EIA, Annual Energy Outlook 2006, DOE/EIA-0383 (2006) (Washington, D.C., February2006), Table A16, 2006. Capacity factors: Hydropower calculated from EIA, Annual Energy Outlook 2005, DOE/EIA-0383 (2005) (Washington, D.C., February 2005), Table A16. All others based on DOE, Renewable Energy Technology Characterizations, EPRI TR-109496, 1997, and program data. Household electricity consumption: Calculated from EIA, Annual Energy Outlook 2006, DOE/EIA-0383 (2006) (Washington, D.C., February), TablesA4 and A8, 2006. Notes: For illustrative purposes only.Capacity values exclude combined-heat-and-power (CHP) data, but include end-use sector (industrial and commercial) non-CHP data.
202

Table 12.3 – Coal-Displacement Calculation
Conversion Formula: Step 1 Capacity (A) x Capacity Factor (B) x Annual Hours (C) = Annual Electricity Generation (D)Step 2 Annual Electricity Generation (D) x Conversion Efficiency (E) = Total Output (F)Step 3 Total Output (F) / Fuel Heat Rate (G) = Quantity Fuel (H)
Technology Wind Geothermal Biomass Hydropower PV Solar Thermal(A) Capacity (kW) 11,558,205 2,232,495 6,594,096 78,312,583 280,355 388,893 (B) Capacity Factor(%) 36.0% 90.0% 80.0% 44.2% 22.5% 24.4% (C) Annual Hours 8,760 8,760 8,760 8,760 8,760 8,760 (D) Annual ElectricityGeneration (kWh) 36,449,954,187 17,600,991,128 46,211,427,727 303,176,455,525 552,579,314 831,235,472
(E) Competing HeatRate (Btu/kWh) 10,107 10,107 10,107 10,107 10,107 10,107 (F) Total Output(Million Btu) 368,399,686 177,893,217 467,058,900 3,064,204,435 5,584,919 8,401,296
(G) Coal Heat Rate (Btu per short ton) 20,411,000 20,411,000 20,411,000 20,411,000 20,411,000 20,411,000
(H) Coal (short tons) 18,049,076 8,715,556 22,882,705 150,125,150 273,623 411,606
Sources: Capacity: EIA, Annual Energy Outlook 2006, DOE/EIA-0383 (2006) (Washington, D.C., February 2006), Table A16, 2006.Capacity factors: Hydropower calculated from EIA, Annual Energy Outlook 2005, DOE/EIA-0383 (2005) (Washington, D.C., February 2005), Table A16. All others based on DOE, Renewable Energy Technology Characterizations, EPRI TR-109496, 1997 and Program data.Conversion Efficiency: EIA, Annual Energy Review 2004, DOE/EIA-0384(2003) (Washington, D.C., August 2005), Table A6. Heat Rate: Annual Energy Outlook 2006, DOE/EIA-0383 (2006) (Washington, D.C., February 2006), Table H1. Notes: For illustrative purposes only, displacement of fossil generation depends on power system generation portfolio and dispatch order. Capacity values exclude combined-heat-and-power (CHP) data, but include end-use sector (industrial and commercial) non-CHP data.
203

Table 12.4 – National SO2 and Heat Input Data
1980 1985 1990 1995 2000 2004
SO2 (lbs) 34,523,334,000 32,184,330,000 31,466,566,000 23,671,357,600 22,404,150,534 20,518,221,256SO2 Heat Factor (lb/MMBtu) 1.935 1.748 1.599 1.081 0.875 0.778NOx (lbs) - - - 11,682,226,600 12,024,262,800 10,209,031,650NOx Heat Factor (lb/MMBtu) - - - 0.534 0.470 0.387Heat (MMBtu) 17,838,745,941 18,414,433,865 19,684,094,492 21,889,662,875 25,606,076,726 26,358,516,161
Source: EPA, Clean Air Markets Web site - Data and Maps, Emissions section, http://cfpub.epa.gov/gdm/ accessed February 2006.
204
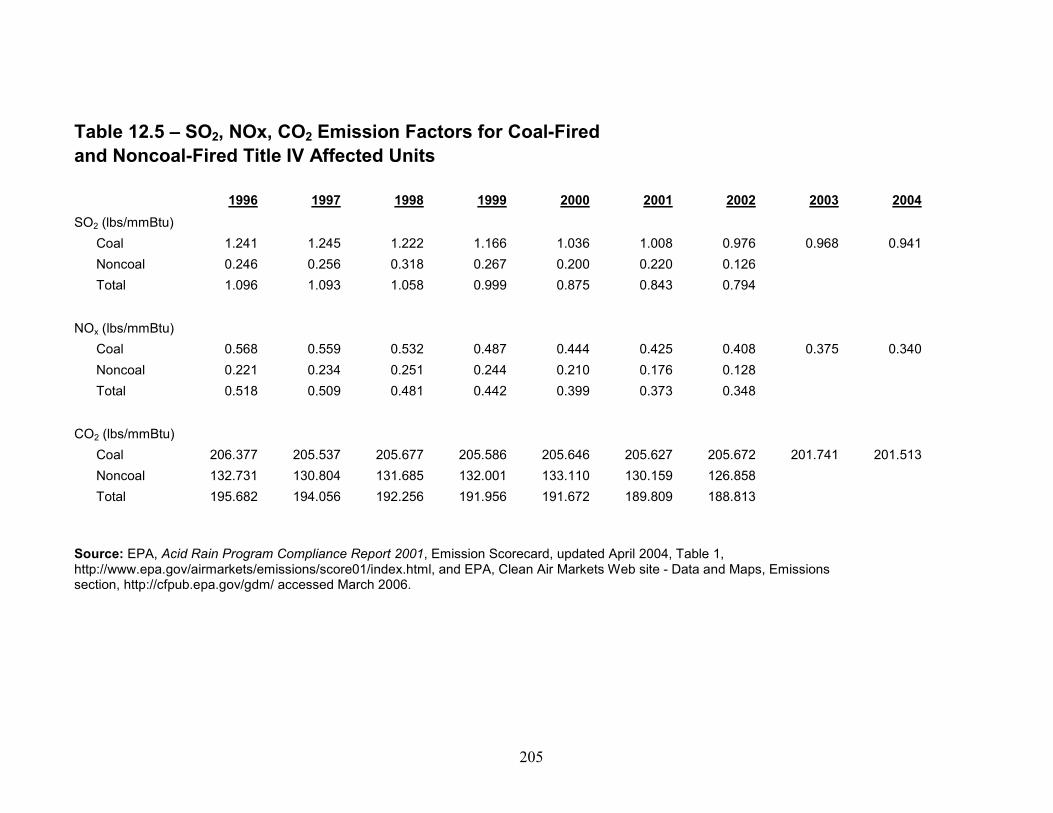
Table 12.5 – SO2, NOx, CO2 Emission Factors for Coal-Fired and Noncoal-Fired Title IV Affected Units
1996 1997 1998 1999 2000 2001 2002 2003 2004SO2 (lbs/mmBtu) Coal 1.241 1.245 1.222 1.166 1.036 1.008 0.976 0.968 0.941 Noncoal 0.246 0.256 0.318 0.267 0.200 0.220 0.126 Total 1.096 1.093 1.058 0.999 0.875 0.843 0.794
NOx (lbs/mmBtu) Coal 0.568 0.559 0.532 0.487 0.444 0.425 0.408 0.375 0.340 Noncoal 0.221 0.234 0.251 0.244 0.210 0.176 0.128 Total 0.518 0.509 0.481 0.442 0.399 0.373 0.348
CO2 (lbs/mmBtu) Coal 206.377 205.537 205.677 205.586 205.646 205.627 205.672 201.741 201.513 Noncoal 132.731 130.804 131.685 132.001 133.110 130.159 126.858 Total 195.682 194.056 192.256 191.956 191.672 189.809 188.813
Source: EPA, Acid Rain Program Compliance Report 2001, Emission Scorecard, updated April 2004, Table 1, http://www.epa.gov/airmarkets/emissions/score01/index.html, and EPA, Clean Air Markets Web site - Data and Maps, Emissionssection, http://cfpub.epa.gov/gdm/ accessed March 2006.
205

Boiler Type/Firing Configuration
Fuel Emissions Units1 CycloneFluidized
Bed Opposed
Firing Spreader
Stoker Tangential All OtherAgricultural Byproducts Lbs per ton 0.08 0.01 0.08 0.08 0.08 0.08Blast Furnace Gas Lbs per MMCF 3.5 0.35 3.5 3.5 3.5 3.5Bituminous Coal* Lbs per ton 38 3.1 38 38 38 38Black L Lbs per toDistillate Fuel Oil* Lbs per MG 142 14.2 142 142 142 142
Jet Fuel* Lbs per MG 142 14.2 142 142 142 142Kerosene* Lbs per MG 142 14.2 142 142 142 142Landfill Gas Lbs per MMCF 3.5 0.35 3.5 3.5 3.5 3.5Lignite Coal* Lbs per ton 30 1 30 30 30 30Municipal Solid Waste Lbs per ton 1.7 0.17 1.7 1.7 1.7 1.7Natural Gas Lbs per MMCF 0.6 0.06 0.6 0.6 0.6 0.6 Other Biomass Gas Lbs per MMCF 3.5 0.35 3.5 3.5 3.5 3.5Other Biomass Liquids Lbs per MG 1.42 1.42 1.42 1.42 1.42 1.42Other Biomass Solids Lbs per ton 0.08 0.01 0.08 0.08 0.08 0.08
Other Gases Lbs per MMCF 3.5 0.35 3.5 3.5 3.5 3.5Other Lbs per MMCF 0.6 0.06 0.6 0.6 0.6 0.6Petroleum Coke* Lbs per ton 39 3.9 39 39 39 39Propane Gas Lbs per MMCF 0.6 0.06 0.6 0.6 0.6 0.6Residual Fuel Oil* Lbs per MG 157 15.7 157 157 157 157Synthetic Coal* Lbs per ton 38 3.1 38 38 38 38Sludge Waste Lbs per ton 2.8 0.28 2.8 2.8 2.8 2.8Subbituminous Coal* Lbs per ton *** 35 3.1 35 38 35 35Tire Derived Fuel* Lbs per ton 38 3.8 38 38 38 38Waste Coal* Lbs per ton 38 3.1 38 38 38 38Wood Waste Liquids Lbs per MG 1.42 1.42 1.42 1.42 1.42 1.42Wood Waste Solids Lbs per ton 0.08 0.01 0.08 0.08 0.08 0.08Waste Oil* Lbs per MG 147 14.7 147 147 147 147
Table 12.6a – Sulfur Dioxide Uncontrolled Emission Factors, Electricity Generators
iquor n *** 7 0.7 7 7 7 7
206

Source: EIA, Electric Power Annual 2004, DOE/EIA-0348(2004) November 2005, Table A1.
Notes:1 Lbs = pounds, MMCF = million cubic feet, MG = thousand gallons. * For these fuels, emissions are estimated by multiplying the emissions factor by the physical volume of fuel and the sulfur percentage of the fuel (other fuels do not require the sulfur percentage in the calculation). Note that EIA data do not provide a sulfur content for TDF. The value used (1.56 percent) is from http://www.epa.gov/appcdwww/aptb/EPA-600-R-01-109A.pdf, Table A-11. ** Source is EPA emission factors reported in http://www.epa.gov/ttn/chief/ap42/ and http://www.epa.gov/ttn/chief/software/fire/index.html. *** Although SLW and BLQ consist substantially of liquids, these fuels are measured and reported to EIA in tons.
207

Boiler Type/Firing Configuration1
Fuel Emissions Units2 CycloneFluidized
Bed Opposed
Firing Spreader
Stoker Tangential All OtherAgricultural Byproducts Lbs per ton 1.20 1.20 1.20 1.20 1.20 1.20Blast Furnace Gas Lbs per MMCF 15.40 15.40 15.40 15.40 15.40 15.40
Bituminous Coal Lbs per ton 33.00 5.00 22.00 11.00 15.0 [14.0] 22.0 [31.0]
Black Liquor Lbs per ton *** 1.50 1.50 1.50 1.50 1.50 1.50
Distillate Fuel Oil Lbs per MG 24.00 24.00 24.00 24.00 24.00 24.00
Jet Fuel Lbs per MG 24.00 24.00 24.00 24.00 24.00 24.00
Kerosene Lbs per MG 24.00 24.00 24.00 24.00 24.00 24.00
Landfill Gas Lbs per MMCF 72.40 72.40 72.40 72.40 72.40 72.40
Lignite Coal Lbs per ton 15.00 3.60 13.00 5.80 7.10 7.1 [13.0]
Municipal Solid Waste Lbs per ton 5.90 5.90 5.90 5.90 5.90 5.90
Natural Gas Lbs per MMCF 280.00 280.00 280.00 280.00 170.00 280.00
Other Biomass Gas Lbs per MMCF 72.40 72.40 72.40 72.40 72.40 72.40
Other Biomass Liquids Lbs per MG 1.66 1.66 1.66 1.66 1.66 1.66
Other Biomass Solids Lbs per ton 1.20 1.20 1.20 1.20 1.20 1.20
Other Gases Lbs per MMCF 14.90 14.90 14.90 14.90 14.90 14.90
Other Lbs per MMCF 1.50 1.50 1.50 1.50 1.50 1.50
Petroleum Coke Lbs per ton 21.00 21.00 21.00 21.00 21.00 21.00
Propane Gas Lbs per MMCF 19.00 19.00 19.00 19.00 19.00 19.00
Residual Fuel Oil Lbs per MG 47.00 47.00 47.00 47.00 32.00 47.00
Synthetic Coal Lbs per ton 33.00 5.00 22.00 11.00 15.00 22.00
Sludge Waste Lbs per ton 5.00 5.00 5.00 5.00 5.00 5.00
Subbituminous Coal Lbs per ton *** 17.00 5.00 12.00 8.80 8.40 12.0 [24.0]
Table 12.6b – Nitrogen Oxide Uncontrolled Emissions Factors, Electricity Generators
208
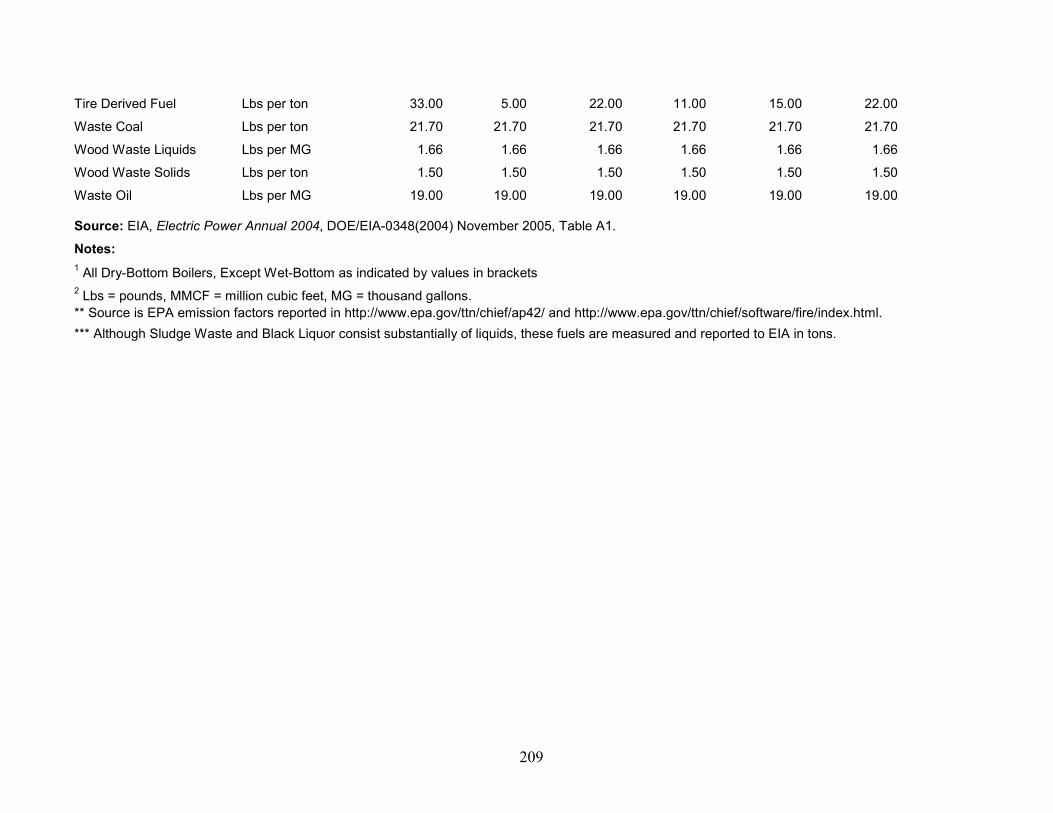
Tire Derived Fuel Lbs per ton 33.00 5.00 22.00 11.00 15.00 22.00
Waste Coal Lbs per ton 21.70 21.70 21.70 21.70 21.70 21.70
Wood Waste Liquids Lbs per MG 1.66 1.66 1.66 1.66 1.66 1.66
Wood Waste Solids Lbs per ton 1.50 1.50 1.50 1.50 1.50 1.50
Waste Oil Lbs per MG 19.00 19.00 19.00 19.00 19.00 19.00
*** Although Sludge Waste and Black Liquor consist substantially of liquids, these fuels are measured and reported to EIA in tons.
Source: EIA, Electric Power Annual 2004, DOE/EIA-0348(2004) November 2005, Table A1.
Notes:1 All Dry-Bottom Boilers, Except Wet-Bottom as indicated by values in brackets2 Lbs = pounds, MMCF = million cubic feet, MG = thousand gallons. ** Source is EPA emission factors reported in http://www.epa.gov/ttn/chief/ap42/ and http://www.epa.gov/ttn/chief/software/fire/index.html.
209

Fuel Factor
(lbs of CO2 per MMBtu)*
Blast Furnace Gas 116.97Bituminous Coal 205.45Distillate Fuel Oil 161.27Geothermal 0.34Jet Fuel 159.41Kerosene 159.41Landfill Gas 115.12Lignite Coal 215.53Municipal Solid Waste 14.63Natural Gas 116.97Other Biomass Gas 115.11Other Gases 141.54Petroleum Coke 225.13Propane Gas 139.04Residual Fuel Oil 173.72Synthetic Coal 205.45Subbituminous Coal 212.58Waste Coal 205.16Waste Oil 163.61
Table 12.6c – Uncontrolled Carbon Dioxide Emissions Factors,Electricity Generators
Source: EIA, Electric Power Annual 2004, DOE/EIA-0348(2004), November 2005, Table A1.* CO2 factors do not vary by boiler type or firing configuration.
210
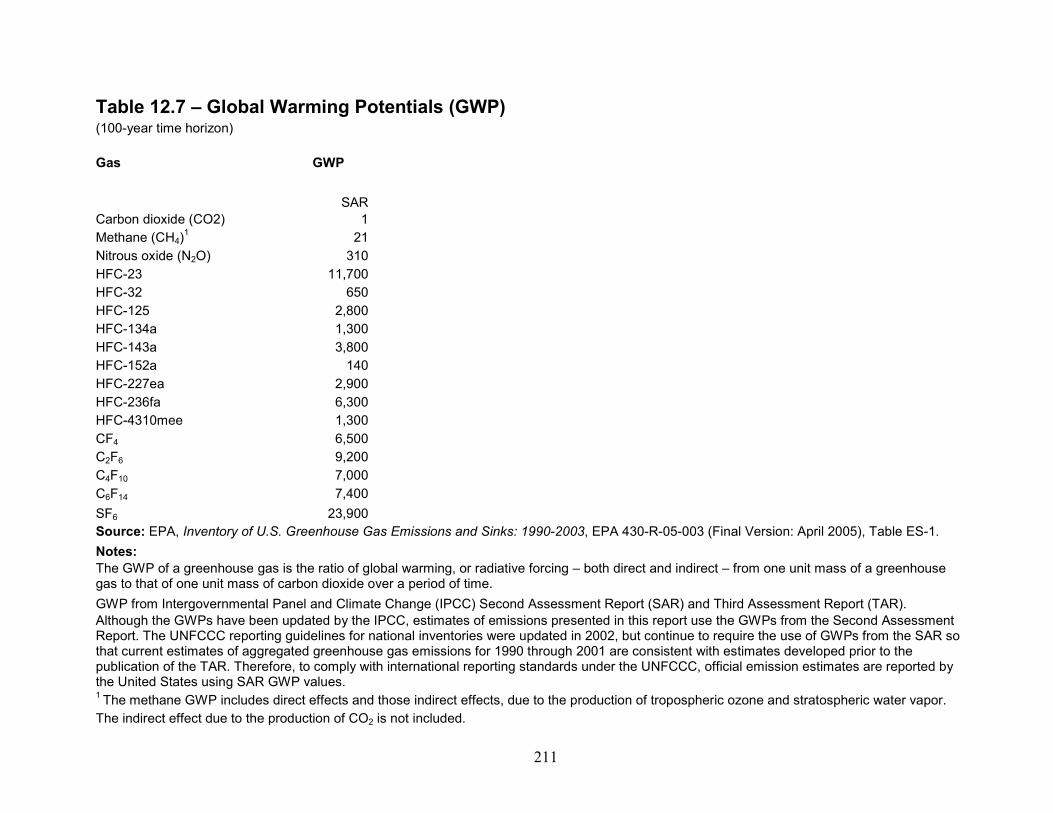
Table 12.7 – Global Warming Potentials (GWP)(100-year time horizon)
Gas GWP
Carbon dioxide (CO2) 1Methane (CH4)1 21Nitrous oxide (N2O) 310HFC-23 11,700HFC-32 650HFC-125 2,800HFC-134a 1,300HFC-143a 3,800HFC-152a 140HFC-227ea 2,900HFC-236fa 6,300HFC-4310mee 1,300CF4 6,500C2F6 9,200C4F10 7,000C6F14 7,400SF6 23,Source: EPA, Inventory of U.S. Greenhouse Gas Emissions and Sinks: 1990-2003, EPA 430-R-05-003 (Final Version: April 2005), Table ES-1.Notes:The GWP of a greenhouse gas is the ratio of global warming, or radiative forcing – both direct and indirect – from one unit mass of a greenhousegas to that of one unit mass of carbon dioxide over a period of time. GWP from Intergovernmental Panel and Climate Change (IPCC) Second Assessment Report (SAR) and Third Assessment Report (TAR).Although the GWPs have been updated by the IPCC, estimates of emissions presented in this report use the GWPs from the Second AssessmentReport. The UNFCCC reporting guidelines for national inventories were updated in 2002, but continue to require the use of GWPs from the SAR sothat current estimates of aggregated greenhouse gas emissions for 1990 through 2001 are consistent with estimates developed prior to the publication of the TAR. Therefore, to comply with international reporting standards under the UNFCCC, official emission estimates are reported bythe United States using SAR GWP values. 1 The methane GWP includes direct effects and those indirect effects, due to the production of tropospheric ozone and stratospheric water vapor.The indirect effect due to the production of CO2 is not included.
SAR
900
211

Fossil Fuels 1
Residual Oil (million Btu per barrel) 6.287Distillate Oil (million Btu per barrel) 5.799Natural Gas (Btu per million cubic ft) 1,027Coal (million Btu per Short Ton) 20.411
Biomass Materials 2
Switchgrass Btu per pound 7,341Bagasse, Btu per pound 6,065Rice Hulls, Btu per pound 6,575Poultry Litter, Btu per pound 6,187Solid wood waste, Btu per pound 6,000-8,000
Sources:
Table 12.8 – Approximate Heat Content of Selected Fuels for Electric-Power Generation
1. EIA, Annual Energy Outlook 2006, DOE/EIA-0383 (2006) (Washington, D.C., February 2006), Table G1. 2. Animal Waste Screening Study, Electrotek Concepts Inc., Arlington, VA. June 2001.
212

1980 1990 2000 2001 2002 2003 2004
Fossil-Fueled Steam-Electric Plants1, 2 10,388 10,402 10,201 10,146 10,119 10,107 10,107Nuclear Steam-Electric Plants3 10,908 10,582 10,429 10,448 10,439 10,439 10,439Geothermal Energy Plants4 21,639 21,096 21,017 21,017 21,017 21,017 21,017
3 Used as the thermal-conversion factor for nuclear electricity net generation.
Table 12.9 – Approximate Heat Rates for Electricity(Btu per Kilowatthour)
Source: EIA, Annual Energy Review 2004, DOE/EIA-0384 (2004) (Washington, D.C., August 2005), Table A6Notes:1 Through 2000, used as the thermal conversion factor for wood and waste electricity net generation at electric utilities. For all years, used asthe thermal conversion factor for hydro, solar, and wind electricity net generation. 2 Through 2000, heat rates are for fossil-fueled steam-electric plants at electric utilities. Beginning in 2001, heat rates are for all fossil-fueled plants at electric utilities and independent power producers.
4 Used as the thermal-conversion factor for geothermal electricity net generation.
213

1980 1990 2000 2001 2002 2003 2004 Normal1
January 887 728 886 935 778 944 957 917February 831 655 643 725 670 801 769 732March 680 535 494 669 624 572 487 593April 338 321 341 302 282 344 302 345May 142 184 115 115 185 165 105 159June 49 29 29 29 23 41 28 39July 5 6 12 8 3 4 5 9August 10 10 12 6 8 5 16 15September 54 56 69 71 38 62 42 77October 316 246 244 267 299 261 241 282November 564 457 610 400 561 477 484 539December 831 789 1,005 696 813 784 788 817Total 4,707 4,016 4,460 4,223 4,284 4,460 4,224 4,524
Table 12.10 – Heating Degree-Days by Month
Source: EIA, Annual Energy Review 2004, DOE/EIA-0384(2004) (Washington, D.C., August 2005), Table 1.7
Notes:1 Based on calculations of data from 1971-2000• This table excludes Alaska and Hawaii. • Degree-days are relative measurements of outdoor air temperature. Heating degree-days are deviations below the mean daily temperature of 65° F. For example, a weather station recording a mean daily temperature of 40° F would report 25 heating degree-days. • Temperature information recorded by weather stations is used to calculate statewide degree-day averagesbased on resident state population. Beginning in 2002, data are weighted by the estimated 2000 population. The population-weighted statefigures are aggregated into Census divisions and the national average. Web Pages: • For data not shown for 1951-1969, see http://www.eia.doe.gov/emeu/aer/overview.html.• For current data, see http://www.eia.doe.gov/emeu/mer/overview.html. Sources: • 1949-2003 and Normals—U.S. Department of Commerce, National Oceanic and Atmospheric Administration (NOAA), National Climatic DataCenter, Asheville, North Carolina, Historical Climatology Series 5-1. • 2004—Energy Information Administration, Monthly Energy Review, February 2004-January 2005 issues, Table 1.10, which reports data from NOAA, National Weather Service Climate Prediction Center, Camp Springs, Maryland.
214

1980 1990 2000 2001 2002 2003 2004 Normal1
January 9 15 10 9Febru 8March 13 21 25 11 17 24 26 18April 23 29 28 37 53 30 41 30May 95 86 131 114 92 110 140 97June 199 234 221 220 242 187 208 213July 374 316 284 302 369 336 310 321August 347 291 302 333 331 345 254 290September 192 172 156 138 202 156 178 155October 42 57 50 46 57 65 69 53November 10 16 8 18 11 21 17 15Decemb 8Total 1,313 1,260 1,229 1,245 1,393 1,281 1,260 1,215
Source: EIA, Annual Energy Review 2004, DOE/EIA-0384(2004) (Washington, D.C., August 2005), Table 1.8
Table 12.11 – Cooling Degree-Days by Month
Notes:1 Based on calculations of data from 1971-2000• This table excludes Alaska and Hawaii. • Degree-days are relative measurements of outdoor air temperature. Cooling degree-days are deviations above the mean daily temperature of 65° F. For example, a weather station recording a mean daily temperature of 78° F would report 13 cooling degree-days. • Temperature information recorded by weather stations is used to calculate statewide degree-day averages based on resident state population. Beginning in 2002, data are weighted by the estimated 2000 population. The population-weighted state figures are aggregated into Censusdivisions and the national average. Web Pages: • For data not shown for 1951-1969, see http://www.eia.doe.gov/emeu/aer/overview.html. • For currentdata, see http://www.eia.doe.gov/emeu/mer/overview.html. Sources: • 1949-2003 and Normals—U.S. Department of Commerce, National Oceanic and Atmospheric Administration (NOAA), National Climatic Data Center, Asheville, North Carolina, Historical Climatology Series 5-2. • 2004—EnergyInformation Administration, Monthly Energy Review, February 2004-January 2005 issues, Table 1.11, which reports data from NOAA, NationalWeather Service Climate Prediction Center, Camp Springs, Maryland.
3 8 5 5ary 4 14 10 12 6 7 5
er 5 9 4 11 5 4 6
215

13.1 – Geographic Information System (GIS) Maps
A Geographical Information System (GIS) is a computer-based system used to manipulate, manage, and analyze multidisciplinary geographic and related attribute data. The GIS system is composed of hardware, software, data, and expertise. A GIS system allows the user to perform several tasks, including data capture, data management, data manipulation, data analysis, and presentation of results in graphic or report forms.
All information in GIS is linked to a spatial reference used to store and access data. GIS data layers can be recombined or manipulated, and analyzed with other layers of information. The GIS allows identification of relationships between features, within a common layer or across layers – and data can be queried or manipulated based on the tabular and/or the spatial characteristics.
One set of maps (Figures 13.1, 13.3, 13.5, and 13.7) illustrates the natural renewable resource for the United States by quality of the resource. The transmission grid and the major load centers are overlaid on the resource maps. The major load centers represent the areas in the United States where the vast majority of electricity demand exists (large metropolitan areas). The maps featured here are simplified to make them easier to read. Higher-resolution resource maps are available online (see Online Resources later in this chapter.
One of the challenges facing renewable energy is that, in many cases, areas with excellent renewable energy resources have little demand for electricity – while many major load centers are far from areas with good renewable resources.
The other set of maps (Figures 13.2, 13.4, 13.6, and 13.8) shows the installed generating capacity from 1996 through 2005 by state. A number in the state shows generating capacity in MW, and a bar chart in the state shows the generating capacity over time.
Biomass Biomass power utilizes biomass such as wood, agricultural waste, and yard waste through combustion. The biomass fuel is either directly combusted in a boiler, or gasified and then combusted, or turned into a liquid fuel that can be combusted (see the Biomass section of Chapter 2 for more detail on biomass technologies).
Natural Resource The majority of biomass resources exist east of the Continental Divide (Figure 13.1). Biomass resources are derived from the vegetation. Because the western part of the United States has sparse vegetation, the biomass resource in the Western states is generally poor. The Eastern states have much higher-quality resources; and many major load centers in Eastern states are near areas with excellent biomass resources. Alaska has limited biomass resources, while Hawaii has excellent biomass resources on some of the islands.

Installed Capacity Biomass-generating capacity was nearly level during the past decade, with a slight decline in the past few years (Figure 13.2). The largest states, in terms of generating capacity, are Florida (1,051 MW), California (799 MW), and Maine (788 MW).
Geothermal Geothermal technologies for power generation utilize heat from underground sources to generate electricity. Plants are currently operating in the Western United States (see the Geothermal section of Chapter 2 for more details on geothermal technologies).
Natural Resource The majority of high-quality geothermal resources exist in the western part of the United States – and, in particular, the Southwest (Figure 13.3). Most of the major load areas in the Eastern states are not near any high-quality geothermal resources. The Western states are more promising, as several of the major load centers are in – or close to – high-quality geothermal resources. A good supply of high-quality geothermal resources exists in sparsely populated areas in the West. Alaska and Hawaii both have some areas with excellent geothermal resources.
Installed Capacity Geothermal generation is currently located in three Western states (Figure 13.4). California is by far the largest (2,802 MW), followed by Nevada (272 MW) and Utah (38MW).
Solar The two most commonly deployed solar power technologies are photovoltaic (PV) and concentrating solar thermal power (CSP) (see the Solar section of Chapter 2 for more information on solar technologies).
Natural Resource The southern parts of the United States, and especially the southwest, have the greatest potential for solar energy (Figure 13.5). This is determined largely by latitude and weather patterns. Solar resources generally decline in quality, moving east and north from the Southwest. The Northeast, as a whole, generally has moderate-quality solar resources. Alaska has moderate solar resources, while Hawaii has good – to very good – solar resources.
Installed Capacity This map features concentrating solar thermal power (CSP) generating capacity (Figure 13.6). Total CSP-generating capacity is virtually unchanged over the past decade. California has the most CSP generating capacity, by far (418 MW), followed by Arizona (10 MW), New York (0.5 MW), Nevada (0.3 MW), and Pennsylvania (0.3 MW).

Wind Wind power utilizes naturally occurring wind patterns to drive turbines that generate electricity (see the Wind section of Chapter 2 for more information on wind power technologies).
Natural Resource The wind resources of the United States fall into two major categories: 1) onshore, and 2) offshore. So far, most of the wind resource assessments focused on onshore wind. Most of the best onshore wind resource is in the Midwestern states (Figure 13.7). Many of the major load centers in the Eastern states are not located near good wind resources, while some Western load centers are located close to high-quality wind resources.
Installed Capacity Wind power is the most consistently growing renewable energy technology among those featured in this chapter (Figure 13.8). California is the largest state, in terms of capacity (2,150 MW), with Texas close behind (1,995 MW). Iowa, the third-largest state (836 MW), has less than half the capacity of the largest states. Wind-generating capacity is growing rapidly in many states.
Online Resources For more GIS information, including dynamic maps, GIS data, and analysis tools – as well as downloadable high-resolution maps – please see the NREL GIS Web site at http://www.nrel.gov/gis

. Figure 13.1. Biomass Resources, Transmission, and Load Centers

Figure 13.2. Installed Biomass Generating Capacity

Figure 13.3. Geothermal Resources, Transmission, and Load Centers

Figure 13.4. Installed Geothermal Generating Capacity

Figure 13.5. Direct Normal Solar Resources, Transmission, and Load Centers

Figure 13.6. Installed CSP Generating Capacity
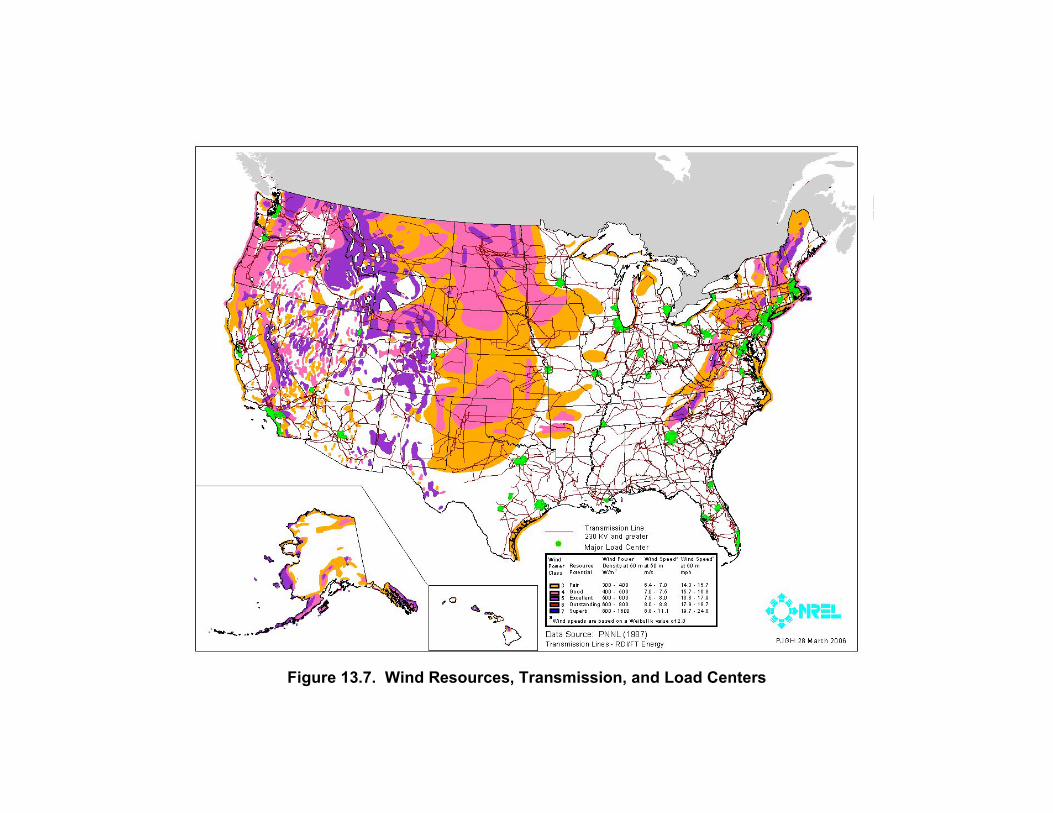
Figure 13.7. Wind Resources, Transmission, and Load Centers
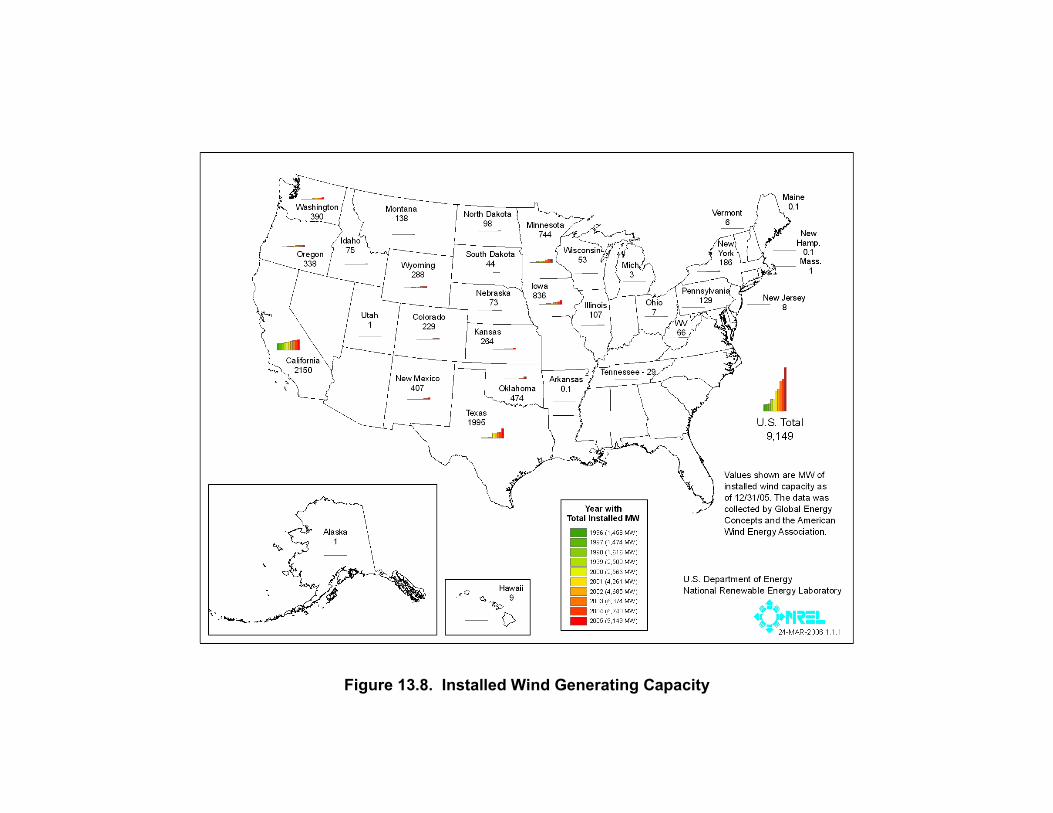
Figure 13.8. Installed Wind Generating Capacity

REPORT DOCUMENTATION PAGE Form Approved OMB No. 0704-0188
The public reporting burden for this collection of information is estimated to average 1 hour per response, including the time for reviewing instructions, searching existing data sources,gathering and maintaining the data needed, and completing and reviewing the collection of information. Send comments regarding this burden estimate or any other aspect of this collection of information, including suggestions for reducing the burden, to Department of Defense, Executive Services and Communications Directorate (0704-0188). Respondents should be aware that notwithstanding any other provision of law, no person shall be subject to any penalty for failing to comply with a collection of information if it does not display acurrently valid OMB control number. PLEASE DO NOT RETURN YOUR FORM TO THE ABOVE ORGANIZATION. 1. REPORT DATE (DD-MM-YYYY)
August 2006 2. REPORT TYPE
Technical Report 3. DATES COVERED (From - To)
4. TITLE AND SUBTITLE Power Technologies Energy Data Book—Fourth Edition
5a. CONTRACT NUMBER DE-AC36-99-GO10337
5b. GRANT NUMBER
5c. PROGRAM ELEMENT NUMBER
6. AUTHOR(S) Compiled by Jørn Aabakken
5d. PROJECT NUMBER NREL/TP-620-39728
5e. TASK NUMBER WUA3.1000
5f. WORK UNIT NUMBER
7. PERFORMING ORGANIZATION NAME(S) AND ADDRESS(ES) National Renewable Energy Laboratory 1617 Cole Blvd. Golden, CO 80401-3393
8. PERFORMING ORGANIZATION REPORT NUMBER NREL/TP-620-39728
9. SPONSORING/MONITORING AGENCY NAME(S) AND ADDRESS(ES) 10. SPONSOR/MONITOR'S ACRONYM(S) NREL
11. SPONSORING/MONITORING AGENCY REPORT NUMBER
12. DISTRIBUTION AVAILABILITY STATEMENT National Technical Information Service U.S. Department of Commerce 5285 Port Royal Road Springfield, VA 22161
13. SUPPLEMENTARY NOTES
14. ABSTRACT (Maximum 200 Words) This report, prepared by NREL’s Strategic Energy Analysis Center, includes up-to-date information on power technologies, including complete technology profiles. The data book also contains charts on electricity restructuring, power technology forecasts, electricity supply, electricity capability, electricity generation, electricity demand, prices, economic indicators, environmental indicators, and conversion factors.
15. SUBJECT TERMS data book; power technologies; electricity restructuring; power technology forecasts and comparisons; electricity supply; electricity capability; electricity generation; electricity demand; prices; economic indicators; environmental indicators; conversion factors; Jørn Aabakken
16. SECURITY CLASSIFICATION OF: 17. LIMITATION OF ABSTRACT
UL
18. NUMBER OF PAGES
19a. NAME OF RESPONSIBLE PERSON
a. REPORT Unclassified
b. ABSTRACT Unclassified
c. THIS PAGE Unclassified 19b. TELEPHONE NUMBER (Include area code)
Standard Form 298 (Rev. 8/98) Prescribed by ANSI Std. Z39.18
F1147-E(12/2004)