power to methanol solutions for flexible , k.-c. tran
TRANSCRIPT

www.eu.mhps.com www.carbonrecycling.is 1/18
Carbon Recycling
International
Power to Methanol Solutions for Flexible and
Sustainable Operations in the Power and Process Industries
C. Bergins, K.-C. Tran et al. POWER-GEN Europe 2015
Power to Methanol Solutions for Flexible
and Sustainable Operations in
Power and Process Industries
C. Bergins#+
, K.-C. Tran*,
E.-I. Koytsoumpa#, E. Kakaras
#,
T. Buddenberg#, Ó. Sigurbjörnsson*
#Mitsubishi Hitachi Power Systems Europe
GmbH, Germany
*Carbon Recycling International, Iceland +presenting author
Contacts: [email protected]; [email protected]
1 Abstract
The rising global energy demand, the sustainability need, energy security, and
energy cost competitiveness have led to step changes in energy policies around the
world. Over the past decade, the penetration of electricity from renewable energy
sources (RES) in the grid has become more pronounced, especially in Europe and in
California. The intermittent nature and the feed-in regulations of RES require
solutions for balancing the grid and harmonizing with coal power generation.

www.eu.mhps.com www.carbonrecycling.is 2/18
Carbon Recycling
International
Power to Methanol Solutions for Flexible and
Sustainable Operations in the Power and Process Industries
C. Bergins, K.-C. Tran et al. POWER-GEN Europe 2015
The paper presents a novel approach of power to methanol which leverages
intermittency and low carbon foot print of RES to overcome the challenges in energy
transition.
The approach is to use surplus electricity deriving from the mismatch of supply and
demand to produce low carbon methanol for use in the transport and chemical
industries. The underlined sustainability and economic benefits are in enabling
“dispatchable” power plants and the process plants to operate at higher capacity and
higher profitability by avoiding new transmission lines, installing electric batteries, and
producing low carbon fuel.
The approach of power to methanol is compared to other pathways for storing energy
and producing methanol to highlight its competitive advantages.
2 Introduction
Increasing dependency on imported fuels coupled with the political will to reduce CO2
emissions for climate protection have led to energy policy changes in countries
around the world. The major actions have been in the following:
1. Transitioning to renewable energy and fuels
2. Reducing energy demand by increasing efficiency for use and conversion of
energy
3. Focusing on domestic resources
The actions on climate protection and the resulting reduction of CO2 emissions have
led to the increase in use of renewable energies. Today, in the EU and California and
some other parts of the world, electricity from renewable energy sources (RES) plays
an important role in the supply of electricity.
3 Renewable Electricity Challenge
The effects from the rapid increase of renewable electricity driven by feed-in tariffs
(FIT) can be summarized as follows:
The cost of electricity from renewable energy has been reduced to less than
25% of the starting point over 15 years, and still the floor price of renewable
energy is double or triple the market price of electricity from the conventional
sources.
Significant amounts of subsidies were earmarked to increase use of
renewable electricity. In Germany, 25% of market demand is met by
renewable electricity. The penetration is attributed to continuous subsidies
which eventually will reach, from the beginning and over the next 20 years,
400 billion €.

www.eu.mhps.com www.carbonrecycling.is 3/18
Carbon Recycling
International
Power to Methanol Solutions for Flexible and
Sustainable Operations in the Power and Process Industries
C. Bergins, K.-C. Tran et al. POWER-GEN Europe 2015
By having reached a point where the peak capacity of renewables installed
can cover the whole demand for electricity intermittently throughout the year, a
critical situation for grid stability is emerging.
Around Europe, policy makers discuss the challenges of the “energy trilemma”. The
original basis for the roadmap of EU energy policy was to balance the following
priorities:
1. Environmental protection
2. Competitiveness
3. Security of supply
During the time when environmental policy took precedence, Europe was less
competitive and vulnerable in energy supply.
For the on-going energy transition, in which economic, technical, and political
priorities have emerged, the choice for any measures to stabilize the electric grid
must be balanced:
Curtailment of renewables and availability of conventional power to avoid
overload and achieve frequency control of the grid – the consequence is acute
energy and financial loss, compounded by FIT payments for curtailed
megawatthours.
Refurbishment of the electric grid at all levels – the public opposes
transmission lines crossing land and it is very capital intensive. It is also
inefficient to transport electricity long distances where there is up to 30%
energy losses. [1].
Installation of electricity storage at different levels of the grid (locally/centrally)
– technologies for electricity storage are either limited to specific geographies
and opposed by the local public (mature pumped hydro or compressed air
energy storage at efficiencies in the range of 50-75%) or limited by high cost
and small scale (with batteries and capacitors at efficiencies higher than 90%).
Recognizing the shortcomings of each measure, a sensible grid stability policy is to
combine selective grid improvement and capacity flexibility solutions. Curtailment of
energy is wasteful.
The capacity flexibility challenge or the surplus electricity utilization can be solved by
the direct conversion of electricity to transport fuels. The available surplus of
electricity in the grid or off grid can be used economically as fuel for transport either
through direct charging for electric vehicles, or conversion to liquid fuel for existing
internal combustion engine vehicles. Therefore, grid stability can be achieved in
conjunction with production of fuel for transport and the resulting reduction of
imported fuels.

www.eu.mhps.com www.carbonrecycling.is 4/18
Carbon Recycling
International
Power to Methanol Solutions for Flexible and
Sustainable Operations in the Power and Process Industries
C. Bergins, K.-C. Tran et al. POWER-GEN Europe 2015
3.1 Power Generation Flexibility
The advent of renewable electricity, driven by the basis of “zero-marginal cost”,
caused the downdraft for demand of conventional electricity in the competitive market
for “electricity trading”. It has caused an overcapacity of power generation.
Operators of power plants, incurring mounting losses, mothballed or dismantled
efficient Combined Cycle Gas Turbine (CCGT) power plants and coal power plants.
Photovoltaic (PV) power generation captures the profitable demand peaks during
60% of the year and keeps the overall electricity prices low, holding down the
operating hours of the CCGT and Open Cycle Gas Turbine (GT) power plants.
However, PV and wind generation are intermittent and conventional thermal power
generation is likely necessary for decades to provide security of supply [2]. In
response, operators of thermal power plants advocate for “capacity payments” to
compensate for the losses. However, the solution for the surplus capacity and FIT is
not in increasing electricity prices to industries and consumers. The solution is in
enabling flexibility of coal power plants. Flexibility or “product flexibility” is achieved by
enabling the coal power plants to operate at economical capacity, driven by a variety
of electrical loads for electricity, and to produce power, heat, and methanol
responsively to the markets. By applying the power to methanol technology, the
growing surplus capacity can be converted to fuel for transport.
3.2 Coal Use Sustainability
Europe has been producing electricity for over 100 years from coal because of its
cost advantages and local availability. Its advantage is moderated by the policy of
decarbonisation. Current prices of CO2 emission certificates reinforce the economic
strength of coal as an energy source. A switch from coal to natural gas (NG) for
economic reasons could only be justifiable in the most extreme conditions as follows:
NG parity with coal, if prices of NG are halved and CO2 costs are
eliminated
NG parity with coal, if costs of CO2 appreciated 10 times
European electricity prices would double or triple if the costs of CO2 appreciated 10
times. One the other hand it is more than unlikely that NG prices will be reduced in
future.
Therefore, the continuous operability of the existing and new coal fired power plants
is critical to meeting the priorities in the energy transition. The synergy of coal and
RES can be exploited by increasing the flexibility of the coal fired plants. The surplus
of capacity of thermal power plants is an economic advantage, enabling security of
supply of both power and transportation fuel.
www.eu.mhps.com www.carbonrecycling.is 5/18
Carbon Recycling
International
Power to Methanol Solutions for Flexible and
Sustainable Operations in the Power and Process Industries
C. Bergins, K.-C. Tran et al. POWER-GEN Europe 2015
The coal power plants operate most efficiently and at the lowest carbon dioxide
emission rate at full loads. The use of the surplus of capacity coupled with carbon
capture and use (CCU) by power to methanol would reduce the possible increase of
emission because of low load operation of thermal power plants.
New coal power plants can reduce emission by 30 percent by burning less coal for
equivalent output. In combination with high efficient coal generation technology and
replacement of older power plants, the application of carbon capture storage/use
(CCS and CCU) is more financially beneficial (CO2 reduction per unit capital
invested) compared with the investment in renewable energy feed-in (10 to 20 times
in favour of CCS/CCU) for emission management [2, own calculation]. Power to
methanol is one of the most competitive carbon technologies for capture and use
(CCU).
3.3 Energy Vectors Dimensions
A successful energy transition requires balancing the priorities to achieve the overall
economic benefits. The strategy to reach the objectives of RES in 2020 is to integrate
RES and coal power generation by the application of power to methanol technology.
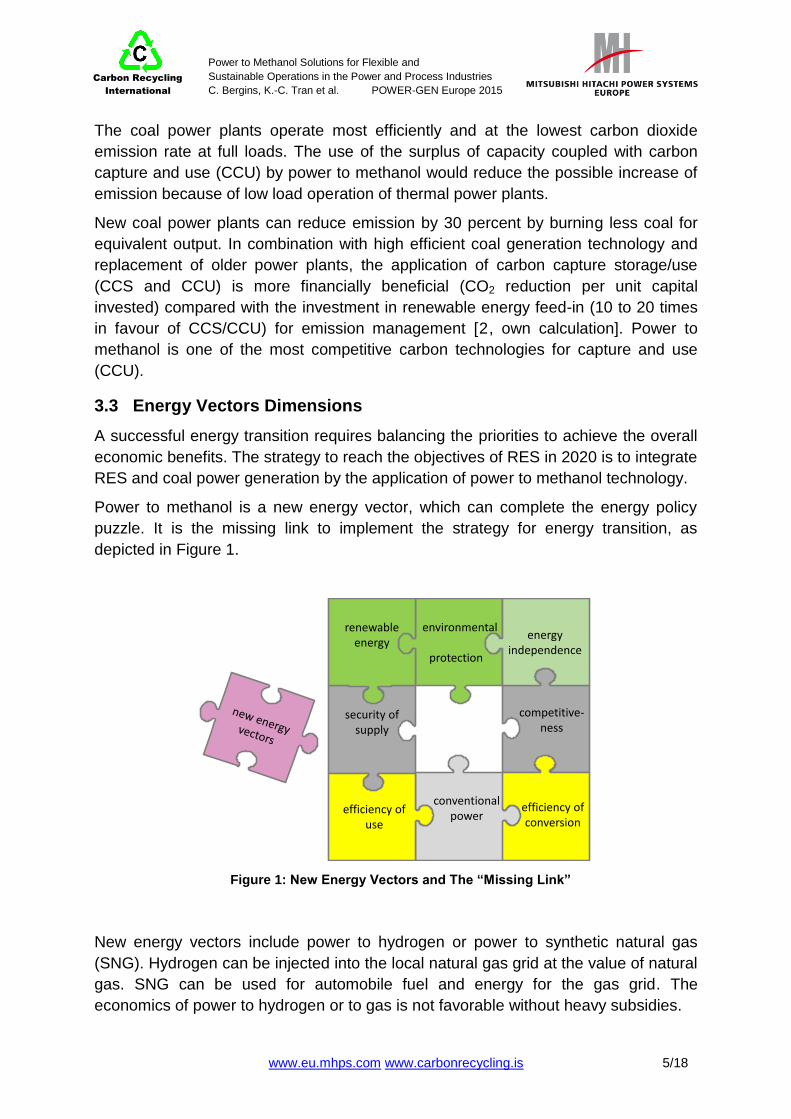
Power to methanol is a new energy vector, which can complete the energy policy
puzzle. It is the missing link to implement the strategy for energy transition, as
depicted in Figure 1.
Figure 1: New Energy Vectors and The “Missing Link”
New energy vectors include power to hydrogen or power to synthetic natural gas
(SNG). Hydrogen can be injected into the local natural gas grid at the value of natural
gas. SNG can be used for automobile fuel and energy for the gas grid. The
economics of power to hydrogen or to gas is not favorable without heavy subsidies.
security of supply
competitive-ness
conventional power
environmental
protection
renewable energy
efficiency of use
energy independence
efficiency ofconversion

www.eu.mhps.com www.carbonrecycling.is 6/18
Carbon Recycling
International
Power to Methanol Solutions for Flexible and
Sustainable Operations in the Power and Process Industries
C. Bergins, K.-C. Tran et al. POWER-GEN Europe 2015
Figure 2: Profitability Analysis of Power to Methanol and Power to Synthetic Natural Gas
In 2013, at the European Energy Exchange (EEX) price of NG of 30 EUR per MWhth
and the maximum allowed marginal cost of production of SNG of 20 EUR per MWhth
by power to gas at the nominal conversion efficiency of 65%, there are less than
1000 hours of profitable operation. For power to methanol, at the price of methanol of
72 EUR per MWhth in 2013 [3] and the maximum allowed marginal cost of production
of 45 EUR per MWhth at the nominal conversion efficiency of 65%, there are more
than 6500 hours of profitable hours. Figure 2 depicted the profitability analysis of
power to methanol and power to synthetic natural gas.
3.4 Surplus Electricity Solution
The growth of renewable electricity is rising in parallel with the increase of coal power
generation. A successful energy transition requires a systematic integration of coal
and renewable power generations. However, the dual system of coal energy for base
load and of renewable energy for de-carbonization results in surplus electricity.
However, a triple system of coal energy, renewable energy, and power to methanol
would balance the energy vectors and energy “trilemma”, and would resolve the
surplus electricity challenges.
Power to methanol is the new energy vector which enables energy transition and
vehicle innovation. An alternative use of the surplus electricity is converting power to
synthetic natural gas. However, the energy economy only supports power to
methanol, as demonstrated in Figure 2. Methanol and its derivatives, dimethylether,
methyl-tert-butylether, and oxymethylenether have higher economic value than
synthetic natural gas or hydrogen, making power to methanol a practical solution to
surplus electricity.
-100
-90
-80
-70
-60
-50
-40
-30
-20
-10
0
10
20
30
40
50
60
70
80
90
100
110
120
130
140
0 1000 2000 3000 4000 5000 6000 7000 8000
MeOH price 400€/t=72€/MWh (th)
Marginal cost allowed
for Power to MeOH
65%
More than 6500 full load
operation hours for MeOH
production
NG price 30€/MWh (th)
Marginal cost allowed
for Power to Gas
Less than 1000 full load
operation hours for SNG
production
65%
Electricty €/MWh
h
Without subsidies
not economically
feasible
Sufficient to reach
profitability already
today
Methane is too cheap!
MeOH production
is profitable!
Electricity price EEX 2013 MeOH=Methanol

www.eu.mhps.com www.carbonrecycling.is 7/18
Carbon Recycling
International
Power to Methanol Solutions for Flexible and
Sustainable Operations in the Power and Process Industries
C. Bergins, K.-C. Tran et al. POWER-GEN Europe 2015
4 Methanol Production Economy
Conventionally, methanol is produced from synthesis gas generated by steam
methane reformation (SMR) or coal gasification. The feedstocks are natural gas (NG)
and coal. The production model is a megascale plant of one million tons per year,
centrally located near the sources of primary energy. Methanol is shipped to the ports
of import by large tankers.
In contrast, the power to methanol production is a distributed model. A proposed
power to methanol plant is a modular design of 50 to 100 thousand tons per year and
is located near the sources of use. The feedstock consists of basic utility available at
a power plant or chemical plant which includes power, hydrogen surplus, and carbon
dioxide. Each plant is constructed to take advantage of the available infrastructure,
by-products, and waste heat. Carbon dioxide is captured and purified on site for use
as the main feedstock (1.5 ton of CO2 captured per ton of methanol produced). For
natural gas and coal to methanol plants, large amounts of carbon dioxide are emitted
(1 ton of CO2 per ton emitted per one ton of methanol produced by natural gas
methanol plants and 3 tons of CO2 per ton produced by coal methanol plants).
A natural gas based methanol plant is constructed to maximize economies of scale.
Each plant can reach the capacity of more than 5,000 tons of methanol per day
output. The production driven by reforming natural gas or gasification of coal is
reformed to make synthesis gas, a mixture of carbon monoxide and hydrogen, at the
rate of 1.5 GWth. Figure 3 depicts the process flow diagrams of the natural gas (A)
and coal (B) configurations. At the mega scale, the conversion of natural gas to
methanol can reach top efficiencies. The available waste heat provides the
necessary power on site which is primarily used for the operation of the air
separation unit (ASU).
The thermal efficiency of conversion for a natural gas or power methanol plant can
be expressed in terms of fuel chemical energy �̇�𝐹𝑢𝑒𝑙 , electric power 𝑃𝑒𝑙 , and the
chemical energy of methanol �̇�𝑀𝑒𝑂𝐻, based on the lower heating value (LHV). The
equations for efficiencies are expressed in the following forms:
𝜂𝑡ℎ/𝑡ℎ =�̇�𝑀𝑒𝑂𝐻
�̇�𝐹𝑢𝑒𝑙 + Δ�̇�=
�̇�𝑀𝑒𝑂𝐻𝐿𝐻𝑉𝑀𝑒𝑂𝐻
�̇�𝐹𝑢𝑒𝑙𝐿𝐻𝑉𝐹𝑢𝑒𝑙 + Δ�̇�
𝜂𝑒𝑙/𝑡ℎ =�̇�𝑀𝑒𝑂𝐻
𝑃𝑒𝑙 + Δ𝑃=
�̇�𝑀𝑒𝑂𝐻𝐿𝐻𝑉𝑀𝑒𝑂𝐻
𝑃𝑒𝑙 + Δ𝑃
Δ�̇� is the sum of all additional heat flow required. The electric power needed for
operation of the plant can be converted to heat by Δ�̇� = Δ𝑃/ 𝜂𝑃𝑃 , where 𝜂𝑃𝑃
represents the net efficiency of the power plant / power cycle. Heat needed from or
reintegrated in the power cycle can also be expressed as Δ𝑃 = Δ�̇� 𝜂, where 𝜂 is the
efficiency of heat to power.

www.eu.mhps.com www.carbonrecycling.is 8/18
Carbon Recycling
International
Power to Methanol Solutions for Flexible and
Sustainable Operations in the Power and Process Industries
C. Bergins, K.-C. Tran et al. POWER-GEN Europe 2015
The management of heat and power of a plant determines the operating efficiency of
the plant.
The carbon conversion efficiencies of a natural gas or coal plant can be at 80% or
33% respectively and (lower heating value based) energy conversion efficiencies at
67% and 45% respectively [4]. Hard coal energy conversion efficiency can reach up
to 55% [5].
Figure 3: Large Scale Methanol Production from Natural Gas (A) and Coal (B).
4.1 Power to Methanol Technology
An operation converting power, hydrogen, and carbon dioxide to methanol can be
bolt on to an existing power or a process plant. The design of the operation can be in
various configurations to adapt to the variability and availability of carbon dioxide,
power, and surplus hydrogen. Possible applications are in coal power plants and in
steel mills with blast furnace boilers and coke ovens.
The technology for power to methanol has been demonstrated at the George Olah
Plant at Carbon Recycling International in Iceland. The plant is the first power to
methanol plant in the world operating at 6 MWel, capturing 6,000 tons of carbon
dioxide and producing 4,000 tons of CO2 methanol per year. The integration with the
power generation plant Svartsengi of 75 MWel and 150 MWhth provides the
necessary power, carbon dioxide and steam.
The plant consists of modularized unit operations for carbon dioxide and synthesis
gas compression, post steam turbine carbon capture, electrolytic production of
hydrogen (water alkaline electrolyzer), direct CO2 to methanol synthesis and
distillation for methanol fuel. The modules were designed and fabricated in a
controlled manufacturing shop floor environment.
desulphari-sation
pre-reforming
steam reforming
autothermalreforming
methanol synthesis
methanol distillation
air separationO2
natural
gas
pure
methanol
commercial scale 5000t MeOH/d
hth-th~67%, MeOH output:1160MWth1730MWth NG
preparation,drying
gasificationdust removal, scrubbing
CO-conversion
methanol synthesis
methanol distillation
air separationO2
coal pure
methanol
CO2 & H2S - removal
CO2
CCGT plant electricity
commercial scale 5000t/d
hth-th~55%, MeOH output:1140MWth2060MWth coal
steam
(A)
(B)
www.eu.mhps.com www.carbonrecycling.is 9/18
Carbon Recycling
International
Power to Methanol Solutions for Flexible and
Sustainable Operations in the Power and Process Industries
C. Bergins, K.-C. Tran et al. POWER-GEN Europe 2015
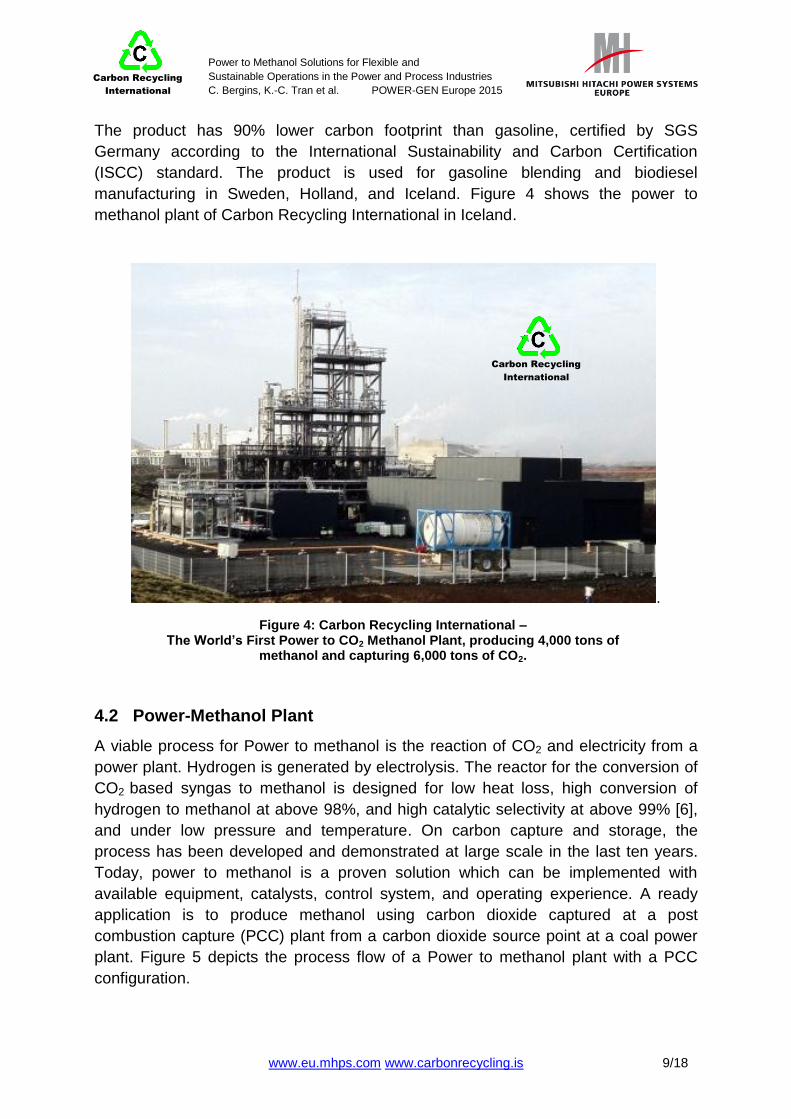
The product has 90% lower carbon footprint than gasoline, certified by SGS
Germany according to the International Sustainability and Carbon Certification
(ISCC) standard. The product is used for gasoline blending and biodiesel
manufacturing in Sweden, Holland, and Iceland. Figure 4 shows the power to
methanol plant of Carbon Recycling International in Iceland.
.
Figure 4: Carbon Recycling International – The World’s First Power to CO2 Methanol Plant, producing 4,000 tons of
methanol and capturing 6,000 tons of CO2.
4.2 Power-Methanol Plant
A viable process for Power to methanol is the reaction of CO2 and electricity from a
power plant. Hydrogen is generated by electrolysis. The reactor for the conversion of
CO2 based syngas to methanol is designed for low heat loss, high conversion of
hydrogen to methanol at above 98%, and high catalytic selectivity at above 99% [6],
and under low pressure and temperature. On carbon capture and storage, the
process has been developed and demonstrated at large scale in the last ten years.
Today, power to methanol is a proven solution which can be implemented with
available equipment, catalysts, control system, and operating experience. A ready
application is to produce methanol using carbon dioxide captured at a post
combustion capture (PCC) plant from a carbon dioxide source point at a coal power
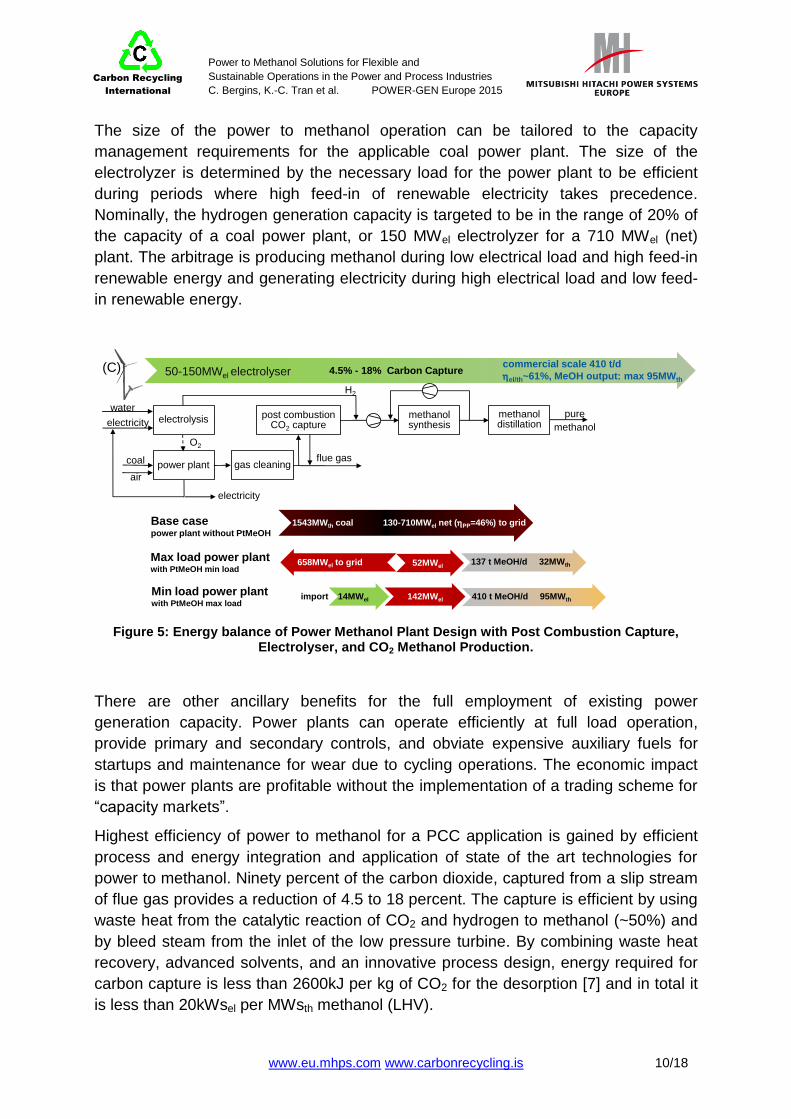
plant. Figure 5 depicts the process flow of a Power to methanol plant with a PCC
configuration.
Carbon Recycling
International
www.eu.mhps.com www.carbonrecycling.is 10/18
Carbon Recycling
International
Power to Methanol Solutions for Flexible and
Sustainable Operations in the Power and Process Industries
C. Bergins, K.-C. Tran et al. POWER-GEN Europe 2015
The size of the power to methanol operation can be tailored to the capacity
management requirements for the applicable coal power plant. The size of the
electrolyzer is determined by the necessary load for the power plant to be efficient
during periods where high feed-in of renewable electricity takes precedence.
Nominally, the hydrogen generation capacity is targeted to be in the range of 20% of
the capacity of a coal power plant, or 150 MWel electrolyzer for a 710 MWel (net)
plant. The arbitrage is producing methanol during low electrical load and high feed-in
renewable energy and generating electricity during high electrical load and low feed-
in renewable energy.
Figure 5: Energy balance of Power Methanol Plant Design with Post Combustion Capture, Electrolyser, and CO2 Methanol Production.
There are other ancillary benefits for the full employment of existing power
generation capacity. Power plants can operate efficiently at full load operation,
provide primary and secondary controls, and obviate expensive auxiliary fuels for
startups and maintenance for wear due to cycling operations. The economic impact
is that power plants are profitable without the implementation of a trading scheme for
“capacity markets”.
Highest efficiency of power to methanol for a PCC application is gained by efficient
process and energy integration and application of state of the art technologies for
power to methanol. Ninety percent of the carbon dioxide, captured from a slip stream
of flue gas provides a reduction of 4.5 to 18 percent. The capture is efficient by using
waste heat from the catalytic reaction of CO2 and hydrogen to methanol (~50%) and
by bleed steam from the inlet of the low pressure turbine. By combining waste heat
recovery, advanced solvents, and an innovative process design, energy required for
carbon capture is less than 2600kJ per kg of CO2 for the desorption [7] and in total it
is less than 20kWsel per MWsth methanol (LHV).
power plant gas cleaning
methanol synthesis
methanol distillation
electrolysis
O2
coal
pure
methanol
electricity
H2
water
electricitypost combustion
CO2 capture
air
flue gas
commercial scale 410 t/d
hel/th~61%, MeOH output: max 95MWth50-150MWel electrolyser 4.5% - 18% Carbon Capture
1543MWth coal 130-710MWel net (hPP=46%) to gridBase case power plant without PtMeOH
658MWel to gridMax load power plantwith PtMeOH min load
137 t MeOH/d 32MWth
Min load power plantwith PtMeOH max load
410 t MeOH/d 95MWth
52MWel
142MWelimport 14MWel
(C)

www.eu.mhps.com www.carbonrecycling.is 11/18
Carbon Recycling
International
Power to Methanol Solutions for Flexible and
Sustainable Operations in the Power and Process Industries
C. Bergins, K.-C. Tran et al. POWER-GEN Europe 2015
An optimized electrolyser consumes 4.0 kWhel per Nm³ of hydrogen produced and is
fed by direct current from a rectifier with an efficiency of 97%.
The compression units, comprised of the main and recycling syngas compressors of
the methanol loop, consume 42 kWsel per MWsth methanol. Heat loss is primarily
from the operation of the electrolyser.
Heat recovery from the CO2 and hydrogen reaction is used for the distillation of crude
methanol and for carbon capture. Material loss is minimized by a hydrogen recovery
unit at the outlet of the purge system. The resulting thermal efficiency of a power to
methanol operation is in the range of 61% (electric energy to LHV of methanol).
Figure 5 shows the possible operation range of the power plant of 710 MWel and
associated MWel / MWth MeOH with and without the power to methanol operation of
410 tons per day of methanol.
Figure 6: Actual Operational Load of a Coal Power Plant of 150 MWel Plant in Germany (Left ) and Possible Increase of Operational Load by Power to Methanol for
Efficient Operation (Right)
The energy output of a coal fired power plant in Germany can have a very ragged
power profile caused by feed-in of renewable energy and change of demand over 24
hours period as depicted on Figure 6. The actual operational data of a coal fired plant
of 150 MWel is displayed on the chart (left). The addition of power to methanol can
smooth out the power profile, as shown on the chart (right). The power-methanol
plant can generate at higher capacity and become more flexible for feed-in. The
proposed bolt on power to methanol plant has the capacity of 50 MWel, >75%
utilization factor and high turn down for load release during high electricity demand.
The application of power to methanol is a profitability and sustainability strategy for
the coal and renewable power generation.
0
20
40
60
80
100
120
140
160
MW
Time
Power-to-Methanol 6.6GWh Electricity to the grid 12.1GWh
0
20
40
60
80
100
120
140
160
MW
Time
Power Plant (load balancing mode, today) 12.9GWh
www.eu.mhps.com www.carbonrecycling.is 12/18
Carbon Recycling
International
Power to Methanol Solutions for Flexible and
Sustainable Operations in the Power and Process Industries
C. Bergins, K.-C. Tran et al. POWER-GEN Europe 2015
4.3 Steel-Methanol Plant
A viable process for power to methanol is the reaction of CO2 and hydrogen
recovered in an integrated steel mill. The application of power to methanol starts with
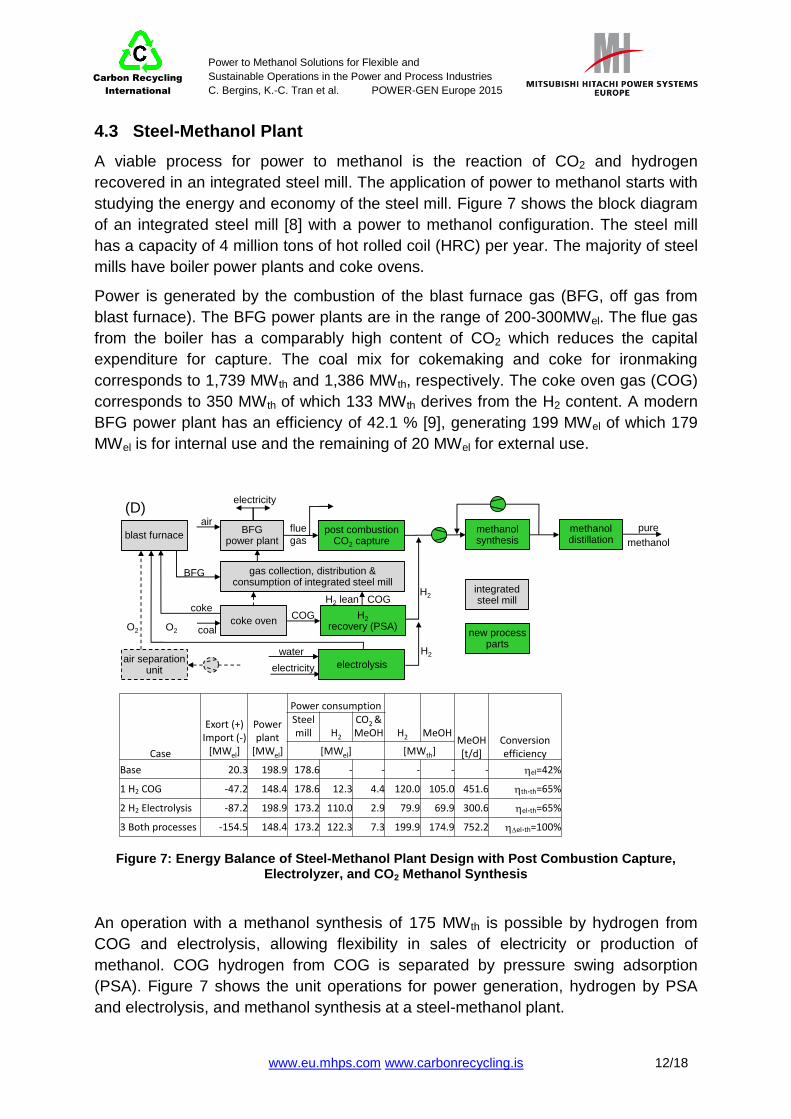
studying the energy and economy of the steel mill. Figure 7 shows the block diagram
of an integrated steel mill [8] with a power to methanol configuration. The steel mill
has a capacity of 4 million tons of hot rolled coil (HRC) per year. The majority of steel
mills have boiler power plants and coke ovens.
Power is generated by the combustion of the blast furnace gas (BFG, off gas from
blast furnace). The BFG power plants are in the range of 200-300MWel. The flue gas
from the boiler has a comparably high content of CO2 which reduces the capital
expenditure for capture. The coal mix for cokemaking and coke for ironmaking
corresponds to 1,739 MWth and 1,386 MWth, respectively. The coke oven gas (COG)
corresponds to 350 MWth of which 133 MWth derives from the H2 content. A modern
BFG power plant has an efficiency of 42.1 % [9], generating 199 MWel of which 179
MWel is for internal use and the remaining of 20 MWel for external use.
Figure 7: Energy Balance of Steel-Methanol Plant Design with Post Combustion Capture, Electrolyzer, and CO2 Methanol Synthesis
An operation with a methanol synthesis of 175 MWth is possible by hydrogen from
COG and electrolysis, allowing flexibility in sales of electricity or production of
methanol. COG hydrogen from COG is separated by pressure swing adsorption
(PSA). Figure 7 shows the unit operations for power generation, hydrogen by PSA
and electrolysis, and methanol synthesis at a steel-methanol plant.
BFGpower plant
methanol synthesis
methanol distillation
O2
coke
pure
methanol
H2
water
electricity
post combustion CO2 capture
airflue
gasblast furnace
H2
recovery (PSA)
electrolysisair separation
unit
O2
coke oven
BFG
COG
H2
coal
gas collection, distribution & consumption of integrated steel mill
H2 lean COG
electricity(D)
Case
Exort (+)Import (-)
[MWel]
Power plant
[MWel]
Power consumption
H2 MeOHMeOH[t/d]
Conversionefficiency
Steel mill H2
CO2 &MeOH
[MWel] [MWth]
Base 20.3 198.9 178.6 - - - - - hel=42%
1 H2 COG -47.2 148.4 178.6 12.3 4.4 120.0 105.0 451.6 hth.th=65%
2 H2 Electrolysis -87.2 198.9 173.2 110.0 2.9 79.9 69.9 300.6 hel.th=65%
3 Both processes -154.5 148.4 173.2 122.3 7.3 199.9 174.9 752.2 hDel.th=100%
integrated steel mill
new process parts

www.eu.mhps.com www.carbonrecycling.is 13/18
Carbon Recycling
International
Power to Methanol Solutions for Flexible and
Sustainable Operations in the Power and Process Industries
C. Bergins, K.-C. Tran et al. POWER-GEN Europe 2015
The use of COG hydrogen for the production of methanol reduces the thermal
capacity of the power plant which is equivalent to 50.5 MWel. Waste heat from the
methanol reaction and the steel mill is utilized for carbon capture and distillation of
crude methanol.
For the conversion of COG hydrogen, the efficiency (LHV of methanol to LHV of
hydrogen) is in the range of 65%. The calculation includes the electrical energy
consumption (in LHV of gas fired in the boiler power plant) of the compressors and
the pressure swing adsorption (PSA).
For the conversion of electrolytic hydrogen, the efficiency (LHV of methanol to
electricity) is in the range of 65%. The production of oxygen from electrolysis reduces
the load of the air separation unit (ASU) by 5.4 MWel.
The stand-alone steel mill plant exports 20.3 MWel. The steel methanol plant, using
COG and electrolytic hydrogen, imports 154.5 MWel. The net usage of electrical
energy is 175 MWel for the production of methanol of 174.9 MWth. For the conversion
of electrolytic and COG hydrogen, the efficiency (LHV of methanol to electricity) is
100%, Hydrogen converts to methanol (in theory at 87.5%, and in practice at 65%
with consideration of compression energy and other energy requirements) more
efficiently than combusts to make electricity (42% in the steel-methanol plant).
4.4 Applications in the Process Industries
Hydrogen is a by-product in several chemical production processes. At many
industrial (Verbund) sites, hydrogen is a downstream feedstock for chemical
productions. In the ammonia production, profitability depends on access to low cost
hydrogen. At other Verbund sites, hydrogen is often used for steam or electricity
production. Similarly to the application of power to methanol in the steel industry,
high purity hydrogen can be upgraded to methanol profitably. The conversion of
hydrogen energy in conjunction with the integration of heat and electricity to
methanol (LHV) is approximately 𝜂𝑡ℎ/𝑡ℎ ~70 %, because a PSA cleanup is not
necessary.
4.5 Methanol Energy Economics
Power and recovered hydrogen can be converted to hydrogen, synthetic natural gas,
and methanol energy vectors. The analysis unit for energy vector is EUR per MWh
(LHV). The factors for production of energy vectors are electricity, natural gas, and
coal. Costs of production of electricity, hydrogen, and methanol vary with the
efficiency of conversion. Price of the energy vector methanol depends on the served
markets of “gray methanol” and “green methanol”. Methanol is hereby reffered as
“gray” if the energy sources are NG and coal and as “green” if it is RES derived.
Figure 8 depicts the effect of energy cost on the profitability of power to methanol.
www.eu.mhps.com www.carbonrecycling.is 14/18
Carbon Recycling
International
Power to Methanol Solutions for Flexible and
Sustainable Operations in the Power and Process Industries
C. Bergins, K.-C. Tran et al. POWER-GEN Europe 2015
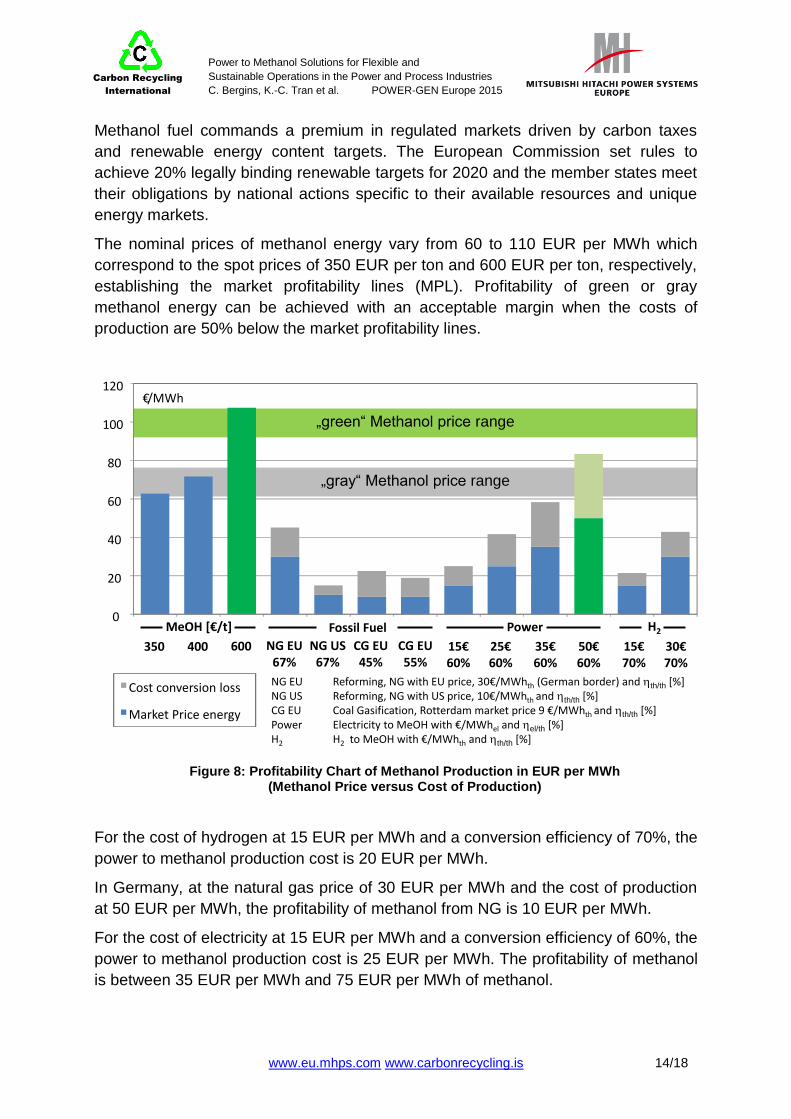
Methanol fuel commands a premium in regulated markets driven by carbon taxes
and renewable energy content targets. The European Commission set rules to
achieve 20% legally binding renewable targets for 2020 and the member states meet
their obligations by national actions specific to their available resources and unique
energy markets.
The nominal prices of methanol energy vary from 60 to 110 EUR per MWh which
correspond to the spot prices of 350 EUR per ton and 600 EUR per ton, respectively,
establishing the market profitability lines (MPL). Profitability of green or gray
methanol energy can be achieved with an acceptable margin when the costs of
production are 50% below the market profitability lines.
Figure 8: Profitability Chart of Methanol Production in EUR per MWh (Methanol Price versus Cost of Production)
For the cost of hydrogen at 15 EUR per MWh and a conversion efficiency of 70%, the
power to methanol production cost is 20 EUR per MWh.
In Germany, at the natural gas price of 30 EUR per MWh and the cost of production
at 50 EUR per MWh, the profitability of methanol from NG is 10 EUR per MWh.
For the cost of electricity at 15 EUR per MWh and a conversion efficiency of 60%, the
power to methanol production cost is 25 EUR per MWh. The profitability of methanol
is between 35 EUR per MWh and 75 EUR per MWh of methanol.
Cost conversion loss
Market Price energy
NG EU Reforming, NG with EU price, 30€/MWhth (German border) and hth/th [%]NG US Reforming, NG with US price, 10€/MWhth and hth/th [%]CG EU Coal Gasification, Rotterdam market price 9 €/MWhth and hth/th [%]Power Electricity to MeOH with €/MWhel and hel/th [%]H2 H2 to MeOH with €/MWhth and hth/th [%]
350 NG EU67%
15€60%
„green“ Methanol price range
„gray“ Methanol price range
0
20
40
60
80
100
120€/MWh
400 600 NG US67%
CG EU45%
CG EU55%
25€60%
35€60%
50€60%
15€70%
30€70%
Power H2Fossil FuelMeOH [€/t]

www.eu.mhps.com www.carbonrecycling.is 15/18
Carbon Recycling
International
Power to Methanol Solutions for Flexible and
Sustainable Operations in the Power and Process Industries
C. Bergins, K.-C. Tran et al. POWER-GEN Europe 2015
The profitability of a power to methanol operation depends on the electricity cost and
the green quality of the feedstock. Because “gray methanol” is in the range of
electricity cost of 25 EUR per MWh, and “green methanol” is in the range of
renewable electricity cost of 40 EUR per MWh, the implementation of power to gray
or green methanol is feasible today.
4.6 European Methanol Advantages
Methanol is commonly used in the chemical, packaging, and transport industries. It is
traded globally. The local production of CO2 methanol by power to methanol is cost
competitive in logistics. The specific gravity of methanol compared to water is 0.79
which is expensive to transport and ship in large volume. Seventy five percent of the
demand in Europe of 8.5 million tons is imported into major ports around Europe. The
proximity between the production and end use points is a competitive advantage for
power to methanol operations.
The leading demand growth for methanol is for energy and fuel for transport.
The demonstration of methanol fuel began in California in 1980’s in the wake of the
oil embargo. Methanol fuel proved to be efficient and environmentally friendly [10], in
particular, the low emission of particulate matter (PM). Today, China [ 11 ] is
introducing methanol in regular vehicles at fifteen percent of gasoline and is
manufacturing methanol vehicles for one hundred percent replacement of gasoline
[12,13]. Methanol can be a future fuel for China, the largest market of automobiles in
the world.
Synthetic natural gas (SNG) can be compressed to feed into the compressed natural
gas (CNG) fuel distribution infrastructure. However, CNG is not favored by
consumers over liquefied petroleum gas (LPG) in Germany, in spite of a decade of
tax incentive. In 2014, there are only 921 CNG fueling stations in contrast of 6,718
LPG stations serving 79,000 CNG car and 500,800 LPG cars. LPG fuel has higher
energy density and is similar to gasoline, resulting in its advantage over CNG.
Methanol is an alcohol which readily supplements bioethanol for blending with
gasoline. The combination of low carbon methanol and bioethanol lightens the
burden on land usage and facilitates meeting the 2020 targets of the EU’s renewable
energy and fuel quality directives. Methanol and ethanol can be blended to reach E5
and E10 for existing regular gasoline vehicles. For flexible fuel vehicles (E85),
methanol can be as high as 50% in the gasoline ethanol methanol blend (GEM).
Methanol is in use for the manufacturing of biodiesel at 12% by mass. There is no
technical limitation in the application of methanol fuel in vehicles.
Methanol produced by power to methanol has the advantages of home market, low
cost logistics, low carbon dioxide footprint, potential green premium, and local growth
in renewable fuel for transport.

www.eu.mhps.com www.carbonrecycling.is 16/18
Carbon Recycling
International
Power to Methanol Solutions for Flexible and
Sustainable Operations in the Power and Process Industries
C. Bergins, K.-C. Tran et al. POWER-GEN Europe 2015
4.7 Market for European Methanol
Today, EU consumes approximately 8.5 million tonnes/year or 47 TWh/year of
methanol. In 2012, the consumption of liquid petroleum gas (LPG), gasoline and
diesel in EU28 totalled 4,157 TWh/year, per Eurostat [14].
Also in 2012, the consumption of renewable electricity was 657 TWh against 2,138
TWh of thermal electricity. A utilization factor of thermal power plants of 42 % is
derived from the known installed capacity of 5,050 MWel of fossil and nuclear power
and the annual production. It results in 2,911 TWh of unused potential electricity. The
pie chart (right) in Figure 9 depicts the distribution of unused potential versus
renewable electricity. Even though the unused potential of electricity in the grey area
included the TWh of the mothballed CCGT plants and TWh of power plants in outage
for maintenance, the advancement of RES remained pronounced (decreasing the
orange area).
Figure 9: Potential Market for European Methanol by Power to Methanol Conversion
of Surplus Electricity and Hydrogen in the Power and Process Industries
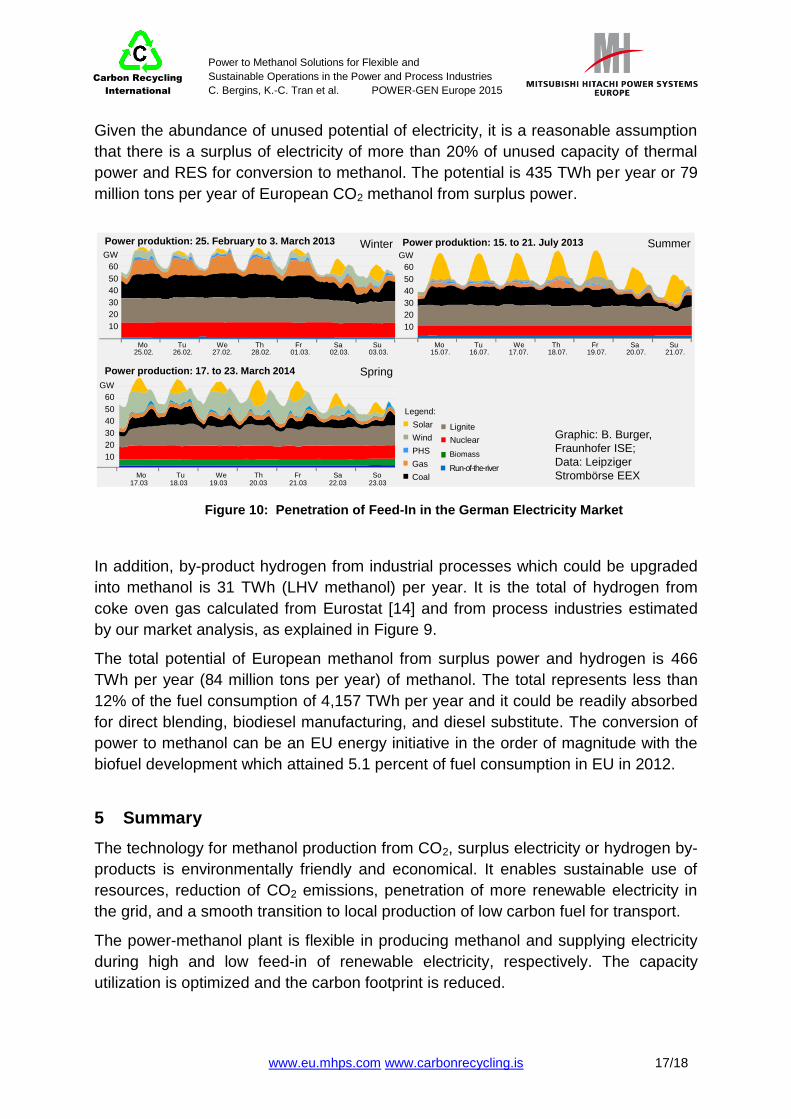
Even more pronounced, is the electricity market in Germany today. Figure 10 depicts
the evolution of the contribution of renewable electricity and coal electricity during the
period from 2013. More and more thermal capacities from hard coal, lignite and
nuclear plants are ramping down in favour of RES. In Germany, hard coal and
natural gas power plants are pulling back to adapt to the increase of the regional
RES. In France, nuclear power plants operate at lower than installed capacities.
209.7
2974.5
972.8
Fuel consumptionEU28 [TWh/a]
LPG
Diesel
Gasoline
Data: Eurostat 2012own calculations
ElectricityEU28 [TWh/a]
Conversion(MTG, MTBE) direct blending
DME as subsitute Use in Biodiesel
production
DME as subsitute
H2 from chemical plants (10 TWh/a)(own market review, estimates)H2 from coke oven gas (37 TWh/a)(based on coking coal and coke data)
(*) Assumed potential forpower to methanol
EU methanol market 2012 (8.5 MMt/a)
20% of excesscapacity (*)
thermalpowerh=61%
Methanol from H2
h=65% (COG)h=70% (chemical plants)
47
355
80
31
Industrial H2 sources[TWh/a] (examples)
2138
2329
582(20%)
657
131
Total „new market“ 514 TWh/a466TWh/a from new sourcesTotal:
4157 TWh/a
20% of REN (*)h=61%
Non-renewableelectricity EU28
Not used capacity(fossil and nuclear)
Renewableelectricity EU28
www.eu.mhps.com www.carbonrecycling.is 17/18
Carbon Recycling
International
Power to Methanol Solutions for Flexible and
Sustainable Operations in the Power and Process Industries
C. Bergins, K.-C. Tran et al. POWER-GEN Europe 2015
Given the abundance of unused potential of electricity, it is a reasonable assumption
that there is a surplus of electricity of more than 20% of unused capacity of thermal
power and RES for conversion to methanol. The potential is 435 TWh per year or 79
million tons per year of European CO2 methanol from surplus power.
Figure 10: Penetration of Feed-In in the German Electricity Market
In addition, by-product hydrogen from industrial processes which could be upgraded
into methanol is 31 TWh (LHV methanol) per year. It is the total of hydrogen from
coke oven gas calculated from Eurostat [14] and from process industries estimated
by our market analysis, as explained in Figure 9.
The total potential of European methanol from surplus power and hydrogen is 466
TWh per year (84 million tons per year) of methanol. The total represents less than
12% of the fuel consumption of 4,157 TWh per year and it could be readily absorbed
for direct blending, biodiesel manufacturing, and diesel substitute. The conversion of
power to methanol can be an EU energy initiative in the order of magnitude with the
biofuel development which attained 5.1 percent of fuel consumption in EU in 2012.
5 Summary
The technology for methanol production from CO2, surplus electricity or hydrogen by-
products is environmentally friendly and economical. It enables sustainable use of
resources, reduction of CO2 emissions, penetration of more renewable electricity in
the grid, and a smooth transition to local production of low carbon fuel for transport.
The power-methanol plant is flexible in producing methanol and supplying electricity
during high and low feed-in of renewable electricity, respectively. The capacity
utilization is optimized and the carbon footprint is reduced.
Mo25.02.
Tu26.02.
We27.02.
Th28.02.
Fr01.03.
Sa02.03.
Su03.03.
Power produktion: 25. February to 3. March 2013 Winter
Power production: 17. to 23. March 2014
23.03
Biomass
Mo Tu We Th Fr Sa So
Legend:
Nuclear
Lignite
Coal
GasRun-of-the-river
PHS
Wind
Solar
Spring
Mo15.07.
Tu16.07.
We17.07.
Th18.07.
Fr19.07.
Sa20.07.
Su21.07.
Power produktion: 15. to 21. July 2013 Summer
60
GW
50
40
30
20
10
Graphic: B. Burger,
Fraunhofer ISE;
Data: Leipziger
Strombörse EEX 22.0321.0320.0319.0318.0317.03
60
GW
50
40
30
20
10
60
GW
50
40
30
20
10

www.eu.mhps.com www.carbonrecycling.is 18/18
Carbon Recycling
International
Power to Methanol Solutions for Flexible and
Sustainable Operations in the Power and Process Industries
C. Bergins, K.-C. Tran et al. POWER-GEN Europe 2015
The steel-methanol plant is designed to replace the combustion of the coke oven gas
for heat or power generation with the conversion to a more valuable methanol.
The upgrade of coke oven gas to methanol makes the steel plant flexible with two
product streams. The profitability equation is optimized and carbon footprint is
reduced.
Power to methanol is applicable to industrial processes where hydrogen is used as a
feedstock for heat or power production. The economics is favorable to upgrading
hydrogen to methanol.
European CO2 methanol has home market advantages and has growth potential in
fuel for transport.
The power to methanol technology is demonstrated at industrial scale and is
available today. It provides a practical solution for a smooth energy transition and for
a low carbon fuel for transport.
References
1 Kurzgutachten zum Kostenvergleich Stromtransport, Hybridnetz (Power-to-Gas) vs. HGÜ-Leitung, Forschungsstelle für Energiewirtschaft e.V., 2014, http://www.ffe.de
2 THERMAL POWER IN 2030, Added Value For EU Energy Policy, EPPSA Study, http://www.eppsa.eu/tl_files/eppsa-files/Library/Thermal%20Power%20in%202030_LowRes.pdf
3 2013 Annual Report - Methanex Corporation, https://www.methanex.com/sites/default/files/667945_AR.pdf
4 P. Biedermann, T. Grube, B. Höhlein (Hrsg.): Methanol as an Energy Carrier, Schriften des Forschungszentrums Jülich, Reihe Energietechnik / Energy Technology, Volume 55, ISBN 3-89336-446-3
5 M. Sciazko, T. Chmielniak, Cost Estimates of Coal Gasification for Chemicals and Motor Fuels in Gasification for Practical Applications, Edited by Yongseung Yun, ISBN 978-953-51-0818-4, 2012
6 J. Toyir et al.: Sustainable process for the production of methanol from CO2 and H2 using Cu/ZnO-based multicomponent catalyst, Physics Procedia 2 (2009) 1075-1079
7 S. Wu, C. Bergins, H. Kikkawa, H. Kobyashi, T. Kawasaki: Technology options for clean Coal Power Generation with CO2 capture, 21st World Energy Congress in Montreal, Canada 11th - 16th September 2010
8 S. Santos: Assessing the Potential of Implementing CO2 Capture in an Integrated Steel Mill, Synthesis report, Volume I, IEA GHG Report, 2012
9 W. Sticher, Ch. Götte, E. Knizik: Wirkungsgradoptimiertes Industriekraftwerk mit Hochofengasfeuerung. VGB Powertech 12 (2003) p. 68/74
10 R. J. Nichols: The Methanol Story: A Sustainable Fuel for the Future, Journal of Scientific & Industrial Research, Vol. 62, January-February 2003, 97-105
11 C.-J. Yang, R. B. Jackson; China’s growing methanol economy and its implications for energy and the environment, Energy Policy 41 (2012) 878–884
12 L. Bromberg and W.K. Cheng. Methanol as an alternative transportation fuel in the US: Options for sustainable and/or energy-secure transportation; Massachusetts Institute of Technology, Final report UT-Battelle Subcontract Number: 4000096701, Prepared by the Sloan Automotive Laboratory Massachusetts Institute of Technology Cambridge MA, November 2010.
13 G. Dolan: Barriers and Opportunities for Moving Methanol to Energy MMSA Methanol Technology and Policy Congress, 3 December 2014, Frankfurt
14 Database of Eurostat, http://ec.europa.eu/eurostat/data/database