power train development and testing for a hydrogen fuel ... · pdf filefor a hydrogen fuel...
TRANSCRIPT

i
Power Train Development and Testing
for a Hydrogen Fuel Cell Powered Electric Hybrid
Neighborhood Electric Vehicle
An Undergraduate Thesis Presented By
Jeffrey Alan Marusiak
* * * * *
The Ohio State University
2007
Examination Committee: Dr. Yann Guezennec, Advisor Dr. James Schmiedeler
Approved by
Advisor Department of Mechanical Engineering

ii
Dedication
Dedicated to my family, who encourage me to be everything I can be, and support
me in all that I do. I love you all.

iii
Acknowledgements
Professor Yann Guezennec
Professor Giorgio Rizzoni
Gabriel Choi
Dan Choi
Don Williams
BJ Yurkovich
Inchul Choi
Students at CAR
CAR Staff

iv
Table of Contents Dedication....................................................................................................................................ii Acknowledgements..................................................................................................................... iii Table of Figures.......................................................................................................................... v Abstract ...................................................................................................................................... 1 Introduction................................................................................................................................. 2 Objectives................................................................................................................................... 4 Procedure ................................................................................................................................... 5
Planning .................................................................................................................................. 5 Architecture............................................................................................................................. 6 Simulation ............................................................................................................................. 10 Selection of Components ...................................................................................................... 13 Spatial Analysis..................................................................................................................... 17
Testing Plans and Setups ......................................................................................................... 35 Initial Vehicle Testing ............................................................................................................ 35 Bench Testing ....................................................................................................................... 36
Nexa System Polorization Curve Test ............................................................................... 36 DC to DC Converter Test................................................................................................... 38 Hydrogen Consumption Test ............................................................................................. 39
Final Testing ......................................................................................................................... 40 Realization................................................................................................................................ 41 Results........................................................................................................................................ 3
Simulation ............................................................................................................................... 3 Initial Vehicle Testing .............................................................................................................. 5 Bench Testing ....................................................................................................................... 11
Nexa System Polorization Curve Test ............................................................................... 11 DC to DC Converter Test................................................................................................... 12 Hydrogen Consumption Test ............................................................................................. 13
Conclusions .............................................................................................................................. 15 References ................................................................................................................................. 1

v
Table of Figures Figure 1: Global Electric Motorcar (GEM), 4 Passenger Model ................................................ 3 Figure 2: Basic Architecture for Hybridized NEV ...................................................................... 7 Figure 3: Preliminary Architecture for Power Train of NEV....................................................... 8 Figure 4: Speed Profile Taken from "Energy Analysis of a Fuel Cell Hybrid Electric Golf Cart"
by Gabriel Choi.................................................................................................................. 11 Figure 5: Speed vs Time for the New York City Urban Driving Cycle ..................................... 15 Figure 6: Stack, Auxiliary, and Net Fuel Cell Power for Three Consecutive NYCC Cycles..... 15 Figure 7: Ballard Nexa 1 kW Hydrogen Powered Fuel Cell .................................................... 16 Figure 8: Preliminary Model of GEMe2 .................................................................................. 18 Figure 9: Solid Model of Nexa Fuel Cell Stack ....................................................................... 19 Figure 10: Panasonic Battery Box Solid Model, by John Neal................................................ 20 Figure 11: Preliminary Design of Incorporating the Nexa Stacks into the GEM...................... 21 Figure 12: Interference of Nexa Stacks with Framing of GEM................................................ 22 Figure 13: Outer Casing for Nexa Stacks with Blowers and Control Boards Removed .......... 23 Figure 14: Nexa System Blowers Cut from Fuel Cell Stacks to Provide Ventilation ............... 24 Figure 15: Offset Blowers from Nexa Systems to Provide Ventilation for the Stacks.............. 25 Figure 16: New Nexa Casing with Intact Fuel Cell Stacks...................................................... 26 Figure 17: Industrial Q-Size Tanks Incorporated Underneath the Seat of the GEM ............... 27 Figure 18: Industrial Q-Size Hydrogen Tanks Incorporated Length-Wise on the GEM........... 28 Figure 19: Proposed Design for Nexa System Incorporation, Front Isometric View ............... 29 Figure 20: Proposed Design for Nexa System Incorporation, Side View ................................ 30 Figure 21: Proposed Design for Nexa System Incorporation, Back Isometric View................ 31 Figure 22: DyneCell Hydrogen Tank by Dynetek Industries...................................................... 32 Figure 23: Final Design of GEM Fuel Cell Electric Hybrid ...................................................... 33 Figure 24: Reverse View of Final Design for GEM.................................................................... 34 Figure 25: Garmin 16A Global Positioning System................................................................. 35 Figure 26: Experimental Setup for Nexa System Solo Bench Test......................................... 37 Figure 27: Wiring Diagram for DC to DC Converter Test........................................................ 39 Figure 28: Test Setup for Nexa System Hydrogen Consumption Test ................................... 40 Figure 29: Nexa System Trays ................................................................................................. 42 Figure 30: Nexa System Bolted into the Trays.......................................................................... 42 Figure 31: Plexiglas Box Built Around Nexa System................................................................... 1 Figure 32: Dynetek Hydrogen Tank on Board GEM.................................................................... 1 Figure 33: Simulation Results Table for Sizing Hardware Components ................................... 4

vi
Figure 34: Campus Driving Cycle for Initial and Final Vehicle Testing...................................... 6 Figure 35: Latitude and Longitude Garmin 16A Data for the Campus Area Driving Cycle........ 7 Figure 36: GPS Data Points Laid Over the Original Driving Cycle Map.................................... 7 Figure 37: Zoomed in View of the Campus Area Driving Cycle GPS Data Points Around the
Center for Automotive Research.......................................................................................... 8 Figure 38: Distance Profile of the Campus Area Driving Cycle................................................. 9 Figure 39: Current Data for Initial Testing of GEM.................................................................. 10 Figure 40: Voltage Data for Initial Testing of GEM ................................................................. 10 Figure 41: Polarization Curve for Nexa Fuel Cell System....................................................... 11 Figure 42: Power vs Efficiency Curve for the 5 kW DC to DC Converter................................ 13 Figure 43: Hydrogen Consumption Curve for Nexa System................................................... 14
1
Abstract
Neighborhood Electric Vehicles (NEVs), also known as low speed vehicles, are
a compact, efficient means of transportation for one to six passengers in urban settings.
Fully road-worthy and street-legal vehicles, NEVs are potentially a high-efficiency, zero
emission-mode of transportation for urban traffic. With diminishing oil supplies
available, not only to the United States but also to the world, there is a need to move
forward to alternative fuel systems and higher efficiency solutions for personal mobility.
Fuel cell technology is an accelerating choice of powering vehicles, especially low
speed vehicles with limited power demands. The Ohio State University, in conjunction
with a Korean partner, is diving into the field of fuel cell technology to develop a new
generation of NEV. The proposed project is to create a NEV powered by low power
hydrogen fuel cells hybridized with Nickel Metal Hydride (NiMH) batteries, with bi-
directional interconnection to the electrical grid. This would provide multiple modes
of usage, ranging from high-efficiency grid-independent (charge-sustaining) operation,
to grid-dependent (charge-depleting) personal transportation, to auxiliary power
generation for homes when the vehicle is not in use.
Although a part of a larger project, I seek to be a part of as many of the
individual tasks as possible, in particular the testing and validation of the vehicle. I

2
also plan on being the main contributor to the spatial analysis of the vehicle, and
supervise the physical realization of it as well. Weekly team meetings will provide a
good basis for acquiring knowledge of the project as a whole. Each team member will
be able to concentrate on their individual tasks while having a sense of the big picture of
the project.
Introduction
The concept of the fuel cell originated in Britain in 1839. Sir William Grove
developed the idea of using oxidation reduction equations to produce electricity (r9).
However, it was not until over a hundred years later that fuel cells were considered for
constructive applications. Fuel cells were used on space missions such as the Apollo
and Gemini projects, and were introduced to automotive applications in the mid 1960’s.
There are several different types of fuel cells, including Proton Exchange
Membrane (PEM), Alkaline Fuel Cells (AFC), Phosphoric Acid Fuel Cells (PAFC),
Molten Carbonate Fuel Cells (MCFC), and Solid Oxide Fuel Cells (SOFC) (r9). The
most common type used in automotive applications is PEM fuel cells. PEMs use a
hydrogen rich gas as fuel and oxygen from the air as an oxidizer, whose only byproduct
is water vapor (r4).
There are several advantages to using PEMFCs in the automotive industry.

3
Since the only byproduct of the fuel cell is water, there are no emissions. The only
liquid on board is water, eliminating all oil, and in turn all oil changes and leaks. Third,
the operating temperature of the fuel cell is fairly low, typically around 80-85˚ C.
Lower operating temperatures mean less “cold running” time, reducing inefficiencies of
short operating periods. Fourth, there is no combustion, so it is a much quieter ride.
Granted, the sound of an internal combustion engine (ICE) can be exhilarating, but
many companies are trying to reduce noise for those who are not power enthusiasts.
Combine all of the advantages of fuel cell power and automotive technology is moving
in the direction of NEVs.
Figure 1: Global Electric Motorcar (GEM), 4 Passenger Model
Neighborhood electric vehicles are designed for trips of short distances and slow
speeds, and have been approved by the National Highway Traffic Safety Administration
(NHTSA) to drive on roads with speed limits of 35 mph or less. The GEM (Global
4
Electric Motorcar) e4, as seen above, is a perfect example of a low speed, or
neighborhood electric vehicle (r6). Statistics of urban driving prove that NEVs are a
logical option for transportation. Eighty percent of all trips taken in a traditional
automobile are 10 miles or less in distance and fifty percent of all urban trips are 10
minutes or less in endurance (r9). Short distances and short traveling times combined
with lower speed urban driving, fit directly into the realm of low speed vehicles.
So why aren’t hydrogen powered NEVs common in urban areas? There are a
couple of reasons for this. First, hydrogen powered fuel cells run on… hydrogen, and
hydrogen refueling stations are not common. Right now, there are only around 100
hydrogen filling stations in the world (r3). There is no reason to buy a car if it cannot
be fueled. Second, production of fuel cells is expensive. Coolant channels must be
machined into the plates of the fuel cell stack, making it an expensive process (r4).
However, the process of making fuel cells will be greatly reduced over the next decade
with advances in precision forging and forming. What can be done in the meantime is
to optimize the implementation of the fuel cell, so that when the price of production
goes down, the research is already completed and progress can be made immediately.
Objectives
The objective of this research is to apply the methods of experimental

5
characterization of components and simulation to decide the optimum combination of
fuel cell, battery, motor, and controller, physically realize the vehicle, develop and
install the controller, and then collect data to verify our predictions of performance.
Verifying the data will not only show that the simulation is working properly, but will
help to achieve the maximized performance of the NEV. This project is a proof-of-
concept prototype to collect engineering data and examine the potential for such high-
efficiency clean vehicles.
Procedure
Planning
As with any successful project, proper planning is an important part of the
process. As mentioned in the objectives of the project, the vehicle is to run as
efficiently as possible. With this in mind, the team needs to make sure that the energy
being created and stored is done in the most efficient manner. Therefore, the fuel cells
should be running at the most efficient point as much as possible, all batteries within the
system should be charged and discharged as efficiently as possible, and any other
energy consumption should be done with a very conservative mindset.
Another important facet of the planning stage of a project is simulation.
Virtual testing, using prior information, is an important tool to help decide what type

6
and size of hardware to use. Gabriel Choi, a member of the NEV team, worked
extensively with MATLAB to create a simulator that calculates estimated performance
of the vehicle under variable driving conditions. The simulation process will be
discussed later.
Architecture
Gasoline internal combustion engine hybridized vehicles use an electric motor
as a means to initialize motion, and then when not able to sustain the desired
acceleration or speed, the engine takes over, operating similar to a conventional ICE
vehicle (r9). However, with the case of a NEV, the vehicle runs on an electric motor
all the time. This enables the team to create one source of power, one place to store
the power created, and have one source of consumption of the power.
To optimize the amount of energy that is created and stored, a simple
architecture is required. As more components are added into the system, it introduces
more inefficiency to the overall product. Since this project is a proof of concept, the
simplified structure helps eliminate the countless variables that go into the optimization
of the vehicle components.
The team developed a preliminary architecture for the hybridized NEV, as seen
in Figure 2 on the next page. Power is created by the fuel cells, as mentioned before,

7
by using hydrogen as a fuel and oxygen from the ambient air as an oxidizer. This
power can then be either diverted to charge the batteries, or directed towards the motor
for direct power consumption. Then, with correct circuitry, power can be used by both
the fuel cells and the battery pack at the same time when there is a higher power
demand from the electric motor. This would also incorporate the fuel cell in the most
efficient manner, enabling it to run at the most efficient point, providing low power to
charge the battery pack at a more constant rate, while the batteries would see the
majority of the fluctuating power demand from the motor.
Figure 2: Basic Architecture for Hybridized NEV

8
DC CONVERTER
FUEL CELL
DC/AC and AC/DCCONVERTER
Power Supply Lines
Hydrogen Tank
Input Sensory LinesOutput Controlling Lines
Ambient Conditions,Vehicle Speed,Etc.
ELECTRICMOTOR
NiMHBATTERIES
Accelerator
BrakeCONTROLLER
Figure 3: Preliminary Architecture for Power Train of NEV
A more detailed preliminary architecture for the power train of the vehicle can
be seen above in Figure 3. It provides more specific information on how the power
will be distributed as planned. The main component of the architecture is the
controller, receiving conditions of the vehicle from various components, determining
what needs to be done, and finally sending out signals to tell the vehicle components
what to do. The controller is essentially the brains of the NEV.
Since electric motors operate at a constant nominal voltage, it is necessary to
provide a battery pack and supply power voltage that is consistent. To achieve this, a
DC to DC converter is incorporated, enabling the power provided by the fuel cells to be
at any voltage, and remain constant. This fits in well with the proposed architecture
when considering the performance of fuel cells. Polarization curves, like the one

9
shown in Figure 42, show that fuel cells do not operate at a static state. As more
current is drawn from the fuel cell, the voltage provided depletes. With a simple signal
from the controller, the DC converter takes the lower voltage, higher current power and
transforms it to a higher voltage, lower current power flow. It is simply shown through
the equations below:
Pin = IinVin η IinVin= IoutVout = Pout
where η is the efficiency of the DC to DC converter. As mentioned before, with the
right circuitry, power can be directed towards the battery pack or towards the motor.
This is accomplished with slight variations of the output voltage of the DC to DC
converter.
Another component included in Figure 3 is the AC/DC converter. This will
accomplish the objectives provided in the project statement. The AC to DC
conversion capability will be able to charge the batteries by plugging the vehicle in with
an extension cord to a stand 110 V wall outlet. Working in the opposite direction, with
a DC to AC converter, energy provided by the fuel cells, and in turn the batteries, will
serve as a generator, to power AC electronic devices, such as a computer that may be on
board the vehicle

10
Simulation
Various components need to be selected for the NEV application, including
batteries, fuel cells, DC to DC converters, and a motor, so that the vehicle will run as
efficiently as possible. Pickup trucks would not be able to take on large payloads with
a small four cylinder engine, nor would compact cars would not be able to achieve the
gas mileage they do with eight cylinder diesel motors. Therefore, the selection of
hardware is critical to the performance of the vehicle, which leads into the simulation
phase of the project. Simulation is a vital part of the selection process for the GEM,
allowing the team to see how different components in combination will react with each
other under different driving conditions.
The simulation is built within MATLAB, a matrix based program which can
take complex formulas and mathematical concepts, and make millions of calculations in
just a few minutes’ time. Credit must be given to Gabriel Choi, a master’s student at
the Ohio State University, who created the simulation for the NEV project. The
simulation was adapted from a previous version created for the hydrogen powered golf
cart, an earlier project completed by the staff at the Center for Automotive Research (r1).
There are two main parts to the simulation: the driving cycle power requirement,
and the components that are being used. Different driving conditions result in different

11
characteristics required by the vehicle. For example, if the vehicle is put through very
rigorous driving conditions, it will need to accelerate and stop quickly, although the
average speed may not be high. However, if the vehicle were run at one constant
speed,
Figure 4: Speed Profile Taken from "Energy Analysis of a Fuel Cell Hybrid Electric Golf Cart"
by Gabriel Choi
which did not vary over a long period of time, there is very little acceleration and
deceleration, if any at all, requiring much less power from the automobile. Shown in
Figure 4 on the previous page is an example of a speed profile.
As seen in Figure 4, time varies over 500 seconds, and the instantaneous speed
varies from 0 to approximately 13 miles per hour. However, much of the 500 seconds

12
shown is spent idling, not traveling at all. On top of this, the vehicle only reaches its
top speed for a couple of seconds. Therefore, the average speed of the vehicle is only
about two or three miles per hour. This is a very good example of the benefits of the
architecture chosen for the NEV, because an average power provided for the fuel cells
would be relatively small, and the batteries would be able to provide the power to reach
peak speeds for a short period of time.
The second part of the simulation is the reaction of components to the power
demand profile. There are hundreds of possibilities to the combination of hardware
that can be used in the GEM. For example, if a smaller battery pack is being used,
there are several different types of batteries that are applicable, and within each type of
battery, the team can use different capacity of battery pack, based on the number of cells
selected. All of these possibilities for batteries can be combined with several choices
of fuel cell: two smaller stacks, one larger stack, Ballard brand fuel cells, or another
manufacturer. All of these products react differently when mixed, so the team has
created a tool to get a better idea of how these components will perform in combination.
The team has investigated the various options for hardware, and obtained performance
characteristics for each of these products. For example, capacity and nominal voltage
of batteries are considered, along with charging and discharging power. For fuel cells,

13
efficiency, output voltage and power are taken into account. These performance
characteristics are then incorporated into the simulation, and each combination is put
through a driving cycle simulation.
Selection of Components
With a Panasonic Electric Vehicles Motor already incorporated into the vehicle,
in conjunction with a complex motor controller, the team decided to keep the existing
electric motor on the vehicle. This would be the basis of the power train, and the other
components would be chosen to mesh with the 72 V electric motor.
For the choice of battery, previous experiments concluded that nickel metal
hydride batteries would be most effective and efficient for this application. With
frequent charging and discharging, NiMH batteries have sustained performance. A
battery pack similar to that on board the Toyota Prius was chosen, proven for hybrid
automotive applications. However, instead of using 38 modules of 7.2 volts
(nominally 275 volts) (r3) as in the Toyota Prius, this battery pack only uses ten
modules of 7.2 volts, giving a nominal voltage of 72 volts, matching the electric motor
already on the vehicle.
The fuel cells are what create the power being supplied to the batteries and
electric motor, so the selection of the fuel cells is critical. Many different variables

14
need to be accounted for when selecting the fuel cells. First, the peak efficiency of the
fuel cells is important. Next would be the amount of power that they are able to create.
Remember that there is no point in having the ability to create 100 hp if the vehicle will
never use more than 10. The fuel cells should only provide the average amount of
power required by the vehicle, while the batteries account for the transient activity.
With this in mind, then the fuel cells should be chosen with the power requirement in
mind. This in itself is a very complicated process, as traffic and road types vary
greatly, not only from day to day, but from minute to minute.
To get a better idea of the average power needed to run the vehicle, as
mentioned before, a simulation was created. The model involved using the New York
City Cycle (NYCC), which has been used extensively for showing city driving
conditions fuel consumption, and adapting it to the NEV.
Since the GEM does not use gasoline, a mpg rating is not possible, and needs to
be approximated by converting a gallon of gasoline into kW-h of electricity. The mass
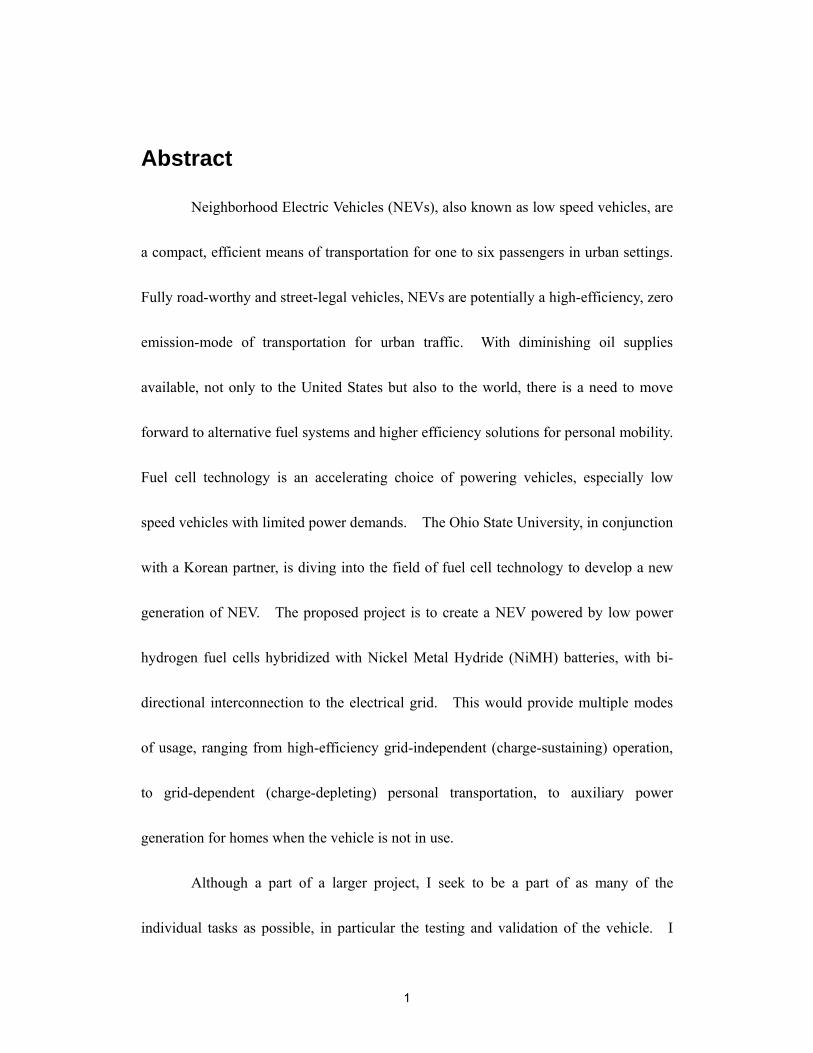
of the vehicle, along with instantaneous speed, as seen in Figure 5, and other operating
conditions are critical. The result is a determined amount of power to complete one
NYCC. Dividing that by the duration will give the average power required to finish
the driving cycle. This is the number that is critical to the selection of the fuel cells.
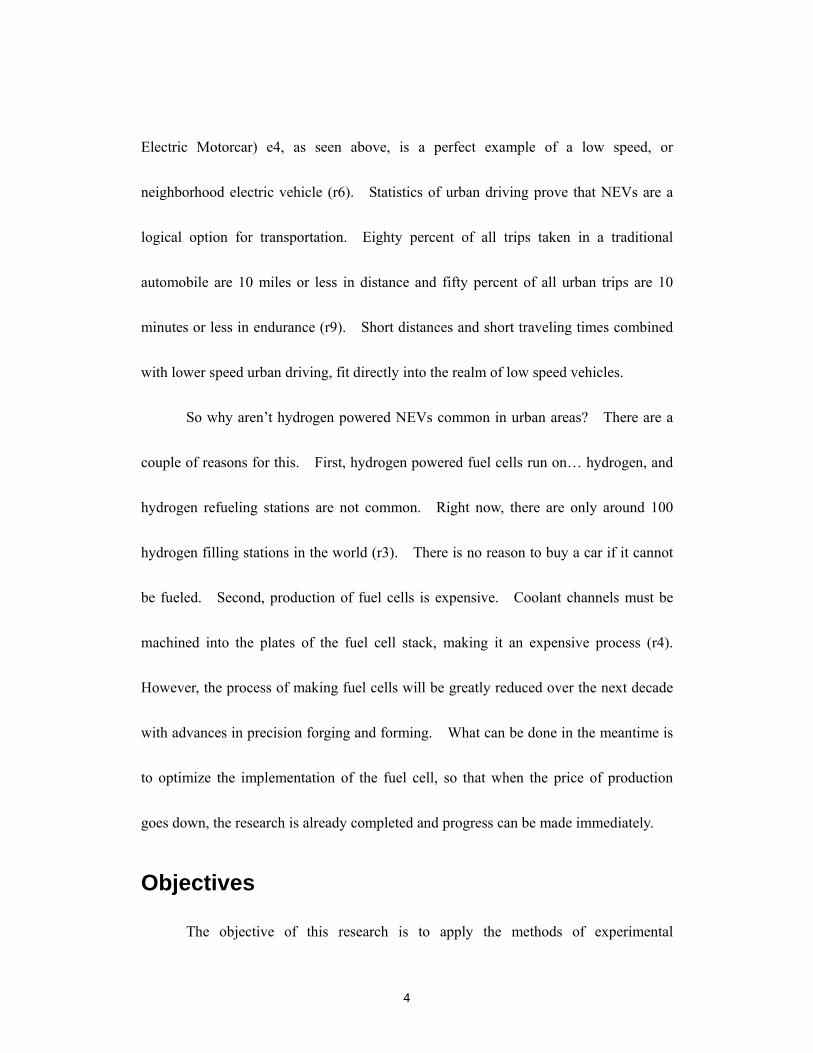
15
Based on Figure 6, as seen on the next page, and the extensive variation of simulations
completed, a nominal value of 2 kW has been selected for the fuel cell.
Figure 5: Speed vs Time for the New York City Urban Driving Cycle
Figure 6: Stack, Auxiliary, and Net Fuel Cell Power for Three Consecutive NYCC Cycles

16
Hydrogen powered fuel cells are not widespread in today’s market, so the
number of choices the team had were quite limited. To accommodate the nominal
value of two kilowatts, two Ballard Nexa 1 kW Fuel Cell Stacks have been chosen as a
means of power. Compact and lightweight, the Ballard Nexa system is a good choice
for this application. The compressor, control board, and cooling fan are all built into
the system in a space-saving manner. Only a hydrogen line and start-up and shut down
power is required to run the system, and the exhausts are a hydrogen purge line, cooling
air, and a moist air outlet. For more details on the performance, capabilities, or
requirements of the Nexa system, please refer to the owner’s manual (r5) included in the
appendix section of this report.
Figure 7: Ballard Nexa 1 kW Hydrogen Powered Fuel Cell
The DC to DC converter is an important choice of hardware, because as

17
mentioned before, efficiency is most valuable. Since efficiency is the number one
priority within the power train, it is also a priority driving the choice of DC to DC
converter. The performance and efficiency of DC to DC converters changes with
operation. As the power running through the DC to DC converter is increased, the
efficiency increases as well. Therefore, running low amounts of power through the
DC to DC converter is inefficient. This is a bit contradictory when compared with fuel
cells, because they run more efficiently at low power. So a compromise between two
inversely proportional efficiencies is needed, completed through an optimization
process. Since this facet of inefficiency in the DC to DC converter cannot be avoided,
the selection process is driven towards another characteristic of DC to DC converters.
As the power capacity of the DC to DC converter increases, the efficiency decreases.
Proper selection of the DC to DC converter, based on maximum power, can provide
better efficiency. With this in mind, along with reliability of product, a Zahn 15036F
DC to DC converter has been chosen.
Spatial Analysis
Once the preliminary architecture of the vehicle is chosen, the team can then
move forward with the planning stage of the project. Instead of having a black box
model of the architecture, actual component size can now be used to complete a spatial

18
analysis of the vehicle. This will allow the team to make sure that all of the hardware
will fit into the space that is available. To accomplish a spatial analysis of the vehicle
and the components being installed, it was decided that it would be most effective and
accurate to create solid models of both the space available and each piece of hardware.
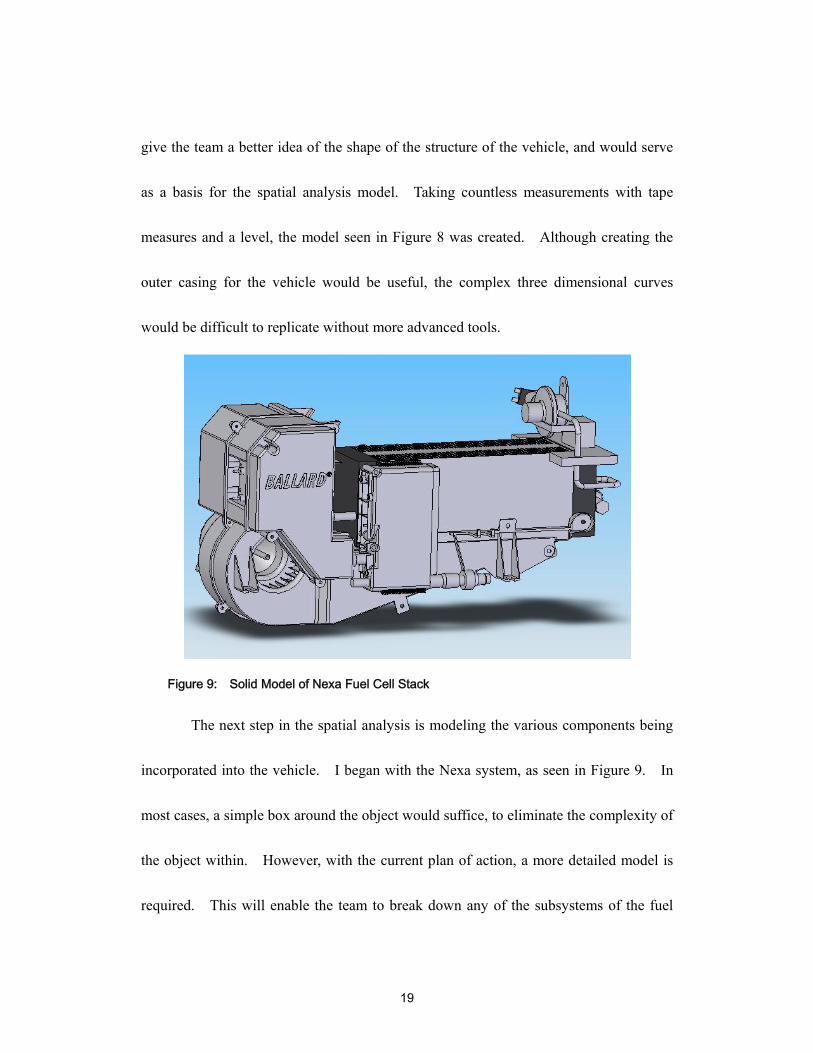
Figure 8: Preliminary Model of GEMe2
I started by creating a model of the framework of the GEMe2. This would
19
give the team a better idea of the shape of the structure of the vehicle, and would serve
as a basis for the spatial analysis model. Taking countless measurements with tape
measures and a level, the model seen in Figure 8 was created. Although creating the
outer casing for the vehicle would be useful, the complex three dimensional curves
would be difficult to replicate without more advanced tools.
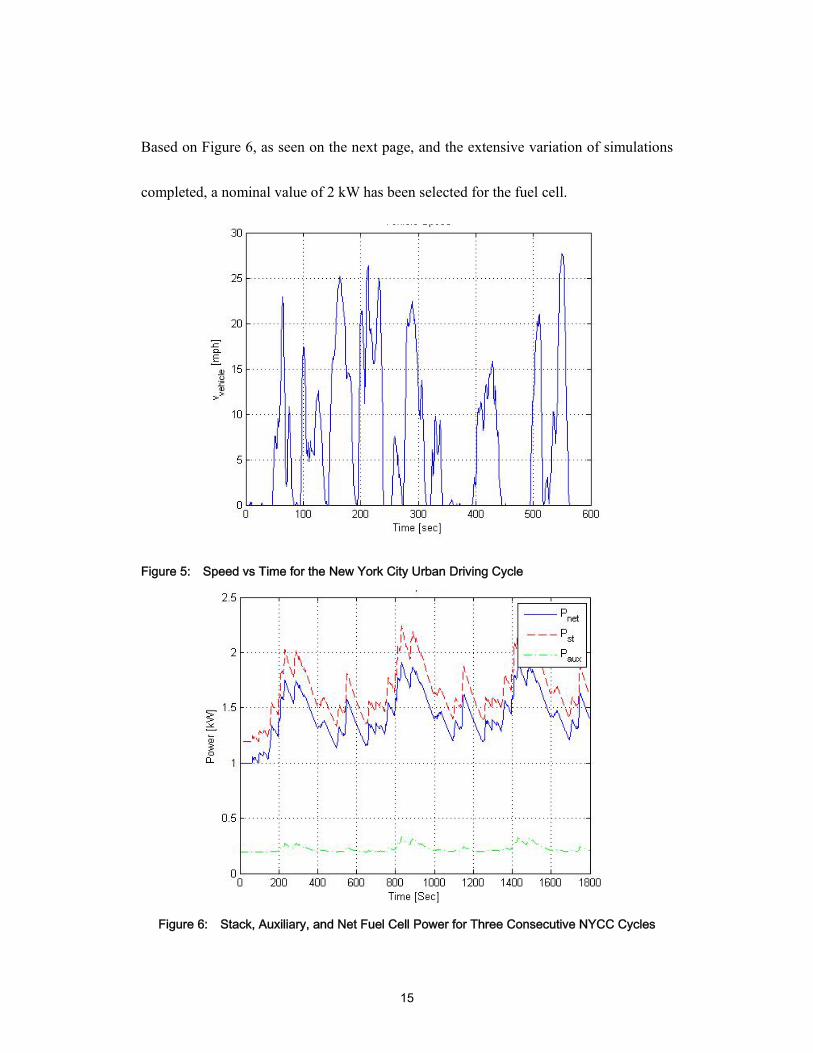
Figure 9: Solid Model of Nexa Fuel Cell Stack
The next step in the spatial analysis is modeling the various components being
incorporated into the vehicle. I began with the Nexa system, as seen in Figure 9. In
most cases, a simple box around the object would suffice, to eliminate the complexity of
the object within. However, with the current plan of action, a more detailed model is
required. This will enable the team to break down any of the subsystems of the fuel

20
cell stack, such as the compressor or the cooling fan, in the case that the team only uses
certain components from the stacks.
After modeling the fuel cell stack, the Panasonic battery box followed.
Although not critical to the spatial analysis, a detailed model of the Panasonic battery
pack, cut down from the Toyota Prius battery pack, has been constructed by John Neal,
a member of the NEV team, and can be seen in Figure 10 on the next page. The ten
Panasonic battery modules, along with the contactors (off white) and fuse (purple), are
included in the model.
With the individual components modeled, the team can then combine the
Figure 10: Panasonic Battery Box Solid Model, by John Neal

21
component forms with the framework model of the GEM e2. The resulting
SolidWorks model enabled the team to virtually assemble the various parts within the
allotted space. The team wants to keep the original shape of the vehicle as much as
possible, so it is desired to incorporate the fuel cells underneath the seat where the
factory lead acid batteries once were. The original intent was to fit the fuel cell stacks
between the box-bar supports near the rear of the vehicle, shown in Figure 11 below.
It is also desirable to keep the control board close to the stack, to keep the existing
wiring harnesses and avoid constructing an alternative.
Figure 11: Preliminary Design of Incorporating the Nexa Stacks into the GEM
22
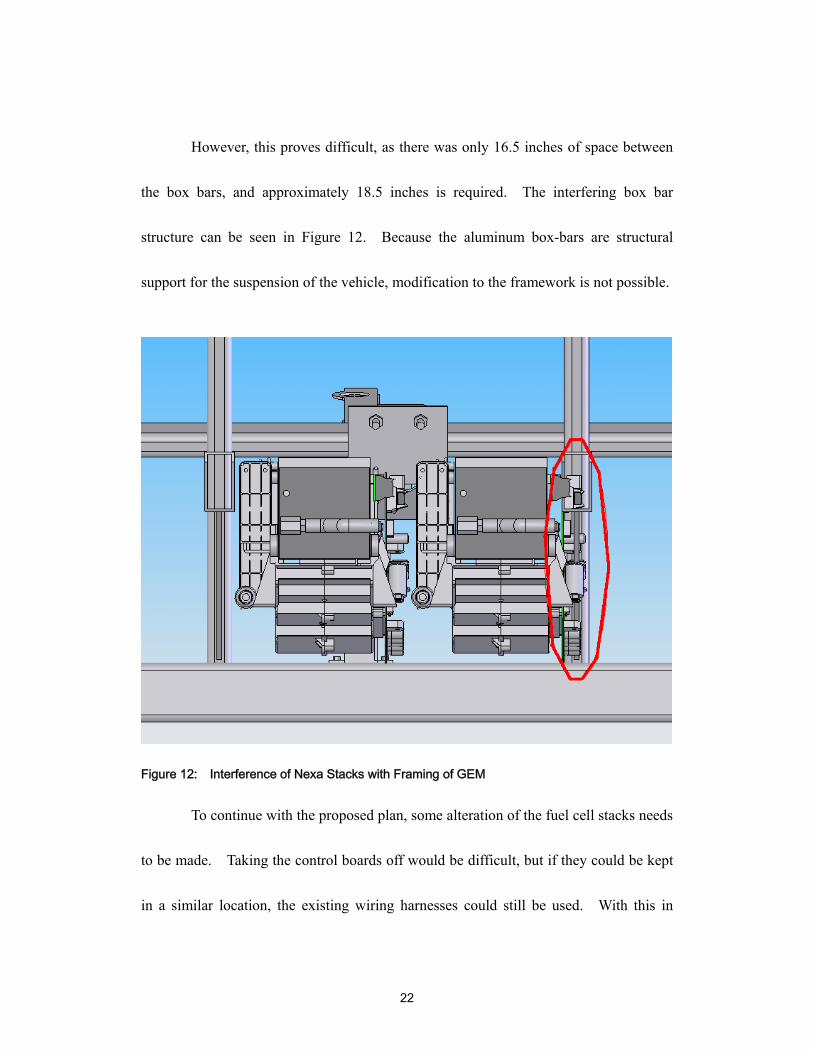
However, this proves difficult, as there was only 16.5 inches of space between
the box bars, and approximately 18.5 inches is required. The interfering box bar
structure can be seen in Figure 12. Because the aluminum box-bars are structural
support for the suspension of the vehicle, modification to the framework is not possible.
Figure 12: Interference of Nexa Stacks with Framing of GEM
To continue with the proposed plan, some alteration of the fuel cell stacks needs
to be made. Taking the control boards off would be difficult, but if they could be kept
in a similar location, the existing wiring harnesses could still be used. With this in

23
mind, another option was created. A casing will surround the fuel cell stacks, as seen
in Figure 13, with the blowers cut off and the control boards removed. With these
modifications, it is possible to fit inside 16.5 inches of space between the box-bar
supports. The shell around the fuel cell stacks would provide protection from the
elements and pollutants, and could also provide a simplified method of connecting and
disconnecting the fuel cells from the vehicle.
Figure 13: Outer Casing for Nexa Stacks with Blowers and Control Boards Removed
Although the casing is an improvement from the previous design, control board
location is critical, and ventilation for the stacks is necessary. If the control boards are
moved further from the stacks, new wiring harnesses will need to be constructed. The

24
main concern was the cooling air ventilation for the Nexa stacks, which leads toward
the following design options. Currently, the stacks are cooled by squirrel cage blowers.
It is desirable to use the manufactured parts for the stacks, so that the proper amount of
cooling air is supplied and the team would not have to run further tests to construct their
own blower.
With this option, the blowers would be removed from the system, inverted, and
placed in the front portion of the vehicle. Flexible ducting could then be used in order
to ventilate the stacks.
Figure 14: Nexa System Blowers Cut from Fuel Cell Stacks to Provide Ventilation

25
Once again, the spacing of the structure of the vehicle prevents this proposed
design option. Proper ventilation is needed for air to enter the blower, which then
cools the fuel cell stack. The blowers are entirely too close to each other, as seen in
Figure 14 above. They are also too close to the aluminum structure, and the team feels
that the blowers would not have the proper air flow to cool the stacks as needed.
Therefore, another option opens for ventilation of the stacks, consisting of
inversion of one of the blowers, so that the exit of both blowers are on the same plane,
but the air inlets are on different axes, as shown in Figure 15 below.
Figure 15: Offset Blowers from Nexa Systems to Provide Ventilation for the Stacks

26
The ducting is in the exact same exit location, but the motors are offset, giving
better clearance to allow air into the blowers. The horizontal clearance between parts
is still very tight, however, and would prove difficult for mounting purposes.
Using separate ducting and cutting the fuel cell stacks in half, the overall
projects becomes more and more complicated. A priority of the project is to keep it as
simple as possible, to avoid over complication. Another casing design was proposed,
in order to keep the fuel cell stacks intact and whole and can be seen in Figure 16 below.
Figure 16: New Nexa Casing with Intact Fuel Cell Stacks
There is only one place to mount the casing, which is on top of the aluminum

27
box-bar supports at the rear of the vehicle. Since this space was the originally
intended position for the hydrogen tanks, the Q-size industrial hydrogen tanks would
need to be relocated. The first design conceptualized involved placing the hydrogen
tanks below the seat, as shown below in Figure 17. Interference with the emergency
break assembly would require some small amount of modification to the vehicle.
However, it is very minor compared to modifying the framework of the vehicle.
Figure 17: Industrial Q-Size Tanks Incorporated Underneath the Seat of the GEM
The dilemma in this design would be how to replace or refill the tanks. Since
the industrial tanks that are used have a fairly small capacity, they would need to be
refilled or replaced after about 30 miles of driving. Replacing the Q-size tanks would
prove quite difficult. Refilling is an option, but would involve incorporation of a

28
refilling nozzle. This would need to be placed on the side of the vehicle, which
becomes a very vulnerable position for safety of the user. Therefore, placing the tanks
along the length of the vehicle became a more viable option.
Figure 18: Industrial Q-Size Hydrogen Tanks Incorporated Length-Wise on the GEM
Since the tanks run along the length of the vehicle, the two trays to each side of
the tanks would still be available for hybridizing components. The tanks protrude
from the back of the framing, which as mentioned before, makes the vehicle vulnerable
to impact. Additional support will then be required for safety purposes. However,
with a latched door or similar design, the tanks would easily slide out of the back of the
vehicle for replacement.
This brings the team to the next proposed option, of running the Q-size
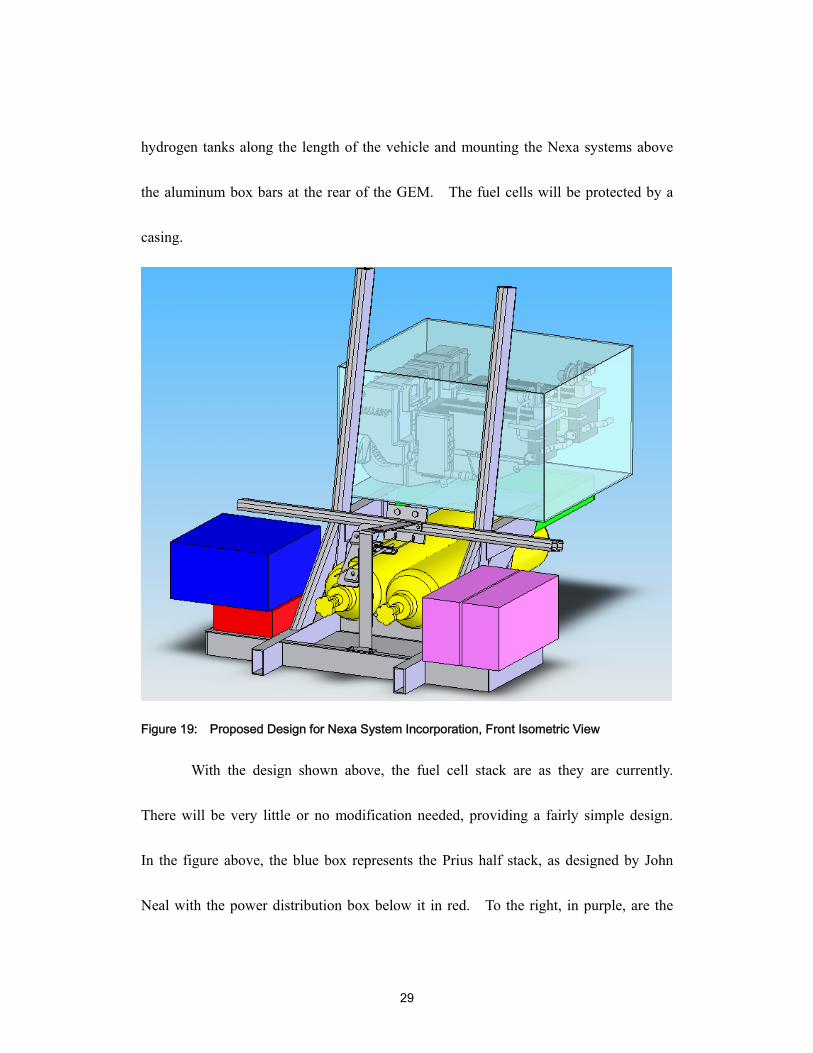
29
hydrogen tanks along the length of the vehicle and mounting the Nexa systems above
the aluminum box bars at the rear of the GEM. The fuel cells will be protected by a
casing.
Figure 19: Proposed Design for Nexa System Incorporation, Front Isometric View
With the design shown above, the fuel cell stack are as they are currently.
There will be very little or no modification needed, providing a fairly simple design.
In the figure above, the blue box represents the Prius half stack, as designed by John
Neal with the power distribution box below it in red. To the right, in purple, are the

30
NiMH batteries desired for wall-charging capabilities. The Q sized hydrogen tanks, as
shown in yellow, were directed toward the front of the vehicle for safety purposes, and
easy access to turn on when entering the vehicle. As shown below, the casing is 23 x
15.25 x 26 inches and is mounted onto the box-bar supports. Minor modifications
need to be made to provide ample inlet and outlet air passages for the fuel cells, along
with additional inlets and outlets for hydrogen and exhaust gases. Additional support,
showed in green, is welded onto the inside of the box-bar and provides not only safety
for the hydrogen tanks, but also extra support for the fuel cell case.
Figure 20: Proposed Design for Nexa System Incorporation, Side View

31
Figure 21: Proposed Design for Nexa System Incorporation, Back Isometric View
Shown above is one additional view of the proposed design. Additional
considerations need to be taken into account, such as the control box, to be designed by
Gabriel Choi, and any additional components required by the system.
While this is a viable option for the project, and could be realized, a new twist
has come into the planning stage of the project. There is now the opportunity of
acquiring an automotive hydrogen tank from the Ford Motor Company. The industrial
Q-size tanks that were being used only held a small amount of hydrogen. This
prevents the range of the vehicle from exceeding 30 miles. With a hydrogen tank
designed for automotive applications, the capacity of the vehicle’s hydrogen supply

32
would increase between 6 and 10 fold, and in turn, increasing the vehicle’s range 6 to 10
times.
Figure 22: DyneCell Hydrogen Tank by Dynetek Industries
The tanks that are being acquired through Ford are called DyneCells,
manufactured by Dynetek, as seen in Figure 22. These high pressure, high capacity,
hydrogen tanks are specifically designed to be used for automotive purposes. “The
DyneCell, lightweight composite cylinder is built from a seamless 'thin wall' aluminum
liner with a full carbon fibre overwrap” (r7). This means that the tank has the same
strength as conventional designs, but with the advantage of weight and size reduction.
Another improvement with the DyneCell is that a refilling nozzle could be incorporated
into the fuel system of the vehicle. Because the Center for Automotive Research now
has the only hydrogen refueling station in Ohio, the ability to refuel the vehicle as
opposed to having to replace the tank would greatly improve the feasibility of the

33
design.
While the DyneCell tank would be very beneficial to the performance of the
GEM fuel cell vehicle, the main concern is size. The Q-size tanks that are being used
are approximately 7 inches in diameter, while the smallest DyneCell is almost 12 inches
in diameter. Because of the limited space between the structural components of the
GEM, the team would need to come up with a different option for direct replacement of
the Q-size tanks.
Figure 23: Final Design of GEM Fuel Cell Electric Hybrid
The final design of the structure of the vehicle is seen in Figure 23 on the
previous page. The design incorporates a cascade alignment of the Nexa systems, in

34
separate enclosed boxes, with the hydrogen tank incorporated underneath the top fuel
cell and in front of the bottom fuel cell. This prevents exposure of the hydrogen tank
to the rear of the vehicle, help with a rear impact safety standpoint. The design also
allows the space underneath the seats to be used for other components, such as the
Panasonic Prius battery pack and the control board.
As seen in Figure 24, another view of the final design of the project, the fuel
cell stacks are easily accessible for maintenance. Also, as mentioned earlier, with the
Nexa systems intact, and no modification required, it simplifies the project. This
allows the team to keep the project timeline as short as possible and eliminate any
additional inefficiency that may be introduced through alteration of the fuel cells.
Figure 24: Reverse View of Final Design for GEM

35
Testing Plans and Setups
Initial Vehicle Testing
To prove that the vehicle has sustained performance once the modifications are
made, the team needs to test the GEM when it is acquired. All of the initial tests are
conducted at the same time. The main considerations are voltage and current relative
to speed of the vehicle. To achieve this, the team is using two main components, a
global positioning system, and a data acquisition board.
To acquire the speed of the vehicle, the team
has chosen a global positioning system made by Garmin.
The Garmin 16A has already been acquired by the
Center for Automotive Research, and used previously in
the hydrogen powered golf cart project. The accuracy
of this GPS is less than 15 meters, with an update rate of 5 Hz (r10). This serves well
for the GEM application, able to produce speed readings without overloading the team
with unnecessary data. Velocity can easily be determined by a simple calculation of
change in distance over time. Because every data point is approximately 0.2 seconds
apart, only the distance between each data needs to be calculated.
The second part of the initial testing is to determine the voltage and current
Figure 25: Garmin 16A
Global Positioning System

36
running from the manufacturer’s lead acid batteries. To accomplish this, the team has
chosen to use a National Instruments Data Acquisition System (r8). Current and
voltage readings are taken from a current sensor between the batteries and the motor
controller, and then voltage is taken from positive lead of the first battery. In this
manner, the team is able to monitor the voltage and current during operation, and
compare it to the speed of the vehicle. During times of strong acceleration, the current
should spike, and the voltage should drop, while the speed of the vehicle should
increase as well.
Bench Testing
With a concrete plan for the architecture of the GEM fuel cell electric hybrid,
the next stage of planning, bench testing, can ensue. All of the components have been
selected and ordered, so before installing them into the vehicle, the team wants to
confirm that the architecture will work.
Nexa System Polorization Curve Test
The first bench test to complete is that of the Nexa systems. Specifications for
the Nexa fuel cell stacks are given with the delivery, and can be seen in the Nexa User’s
Manual. However, with any manufactured product, the performance of the product,
when compared with the specified performance, varies slightly. To get the most

37
accurate information to incorporate into the simulator built by the NEV team, individual
tests should be done to confirm the performance of the fuel cell stacks. The setup for
the experiment can be seen in Figure 26 below. The hydrogen is connected to the fuel
cell stack. The exhaust lines are run to the bucket and hood, for the water vapor and
hydrogen purge lines, respectively. The fuel cell stack needs an independent power
source for startup and shutdown modes, so a plug-in power supply must be connected as
well. Last, the positive and negative leads to the fuel cell system are connected to the
2.5 kW electric load. For additional information on operating the Nexa system, refer
to the Nexa startup manual (created by Jeff Marusiak and Inchul Choi) (r2) and the
Nexa Power Module User’s Manual (r5).
Figure 26: Experimental Setup for Nexa System Solo Bench Test
As mentioned before, according to polarization curves, when current is drawn
from the fuel cell stack, the voltage provided diminishes. The first bench test monitors
38
this characteristic of the fuel cell stacks, taking current and voltage readings from the
electric load. The test is done with a constant current reading, current being the
independent variable. The current starts at no load (0 amps) and is increased in 5 amp
increments up to 40 amps and then backed down to no load.
DC to DC Converter Test
The second bench test includes the DC to DC converter, fuel cells, and electric
load. This test is more complicated than the last because it involves control of the DC
to DC converter from some external source. The purpose of this experiment is to
determine the functionality of the DC to DC converter in the existing architecture before
implementing it on the GEM. Second, the team will be able to verify the efficiency of
the DC to DC converter at different load demands, and will be able to make any
changes necessary in the control logic of the vehicle. The setup can be seen in Figure
27 on the next page.
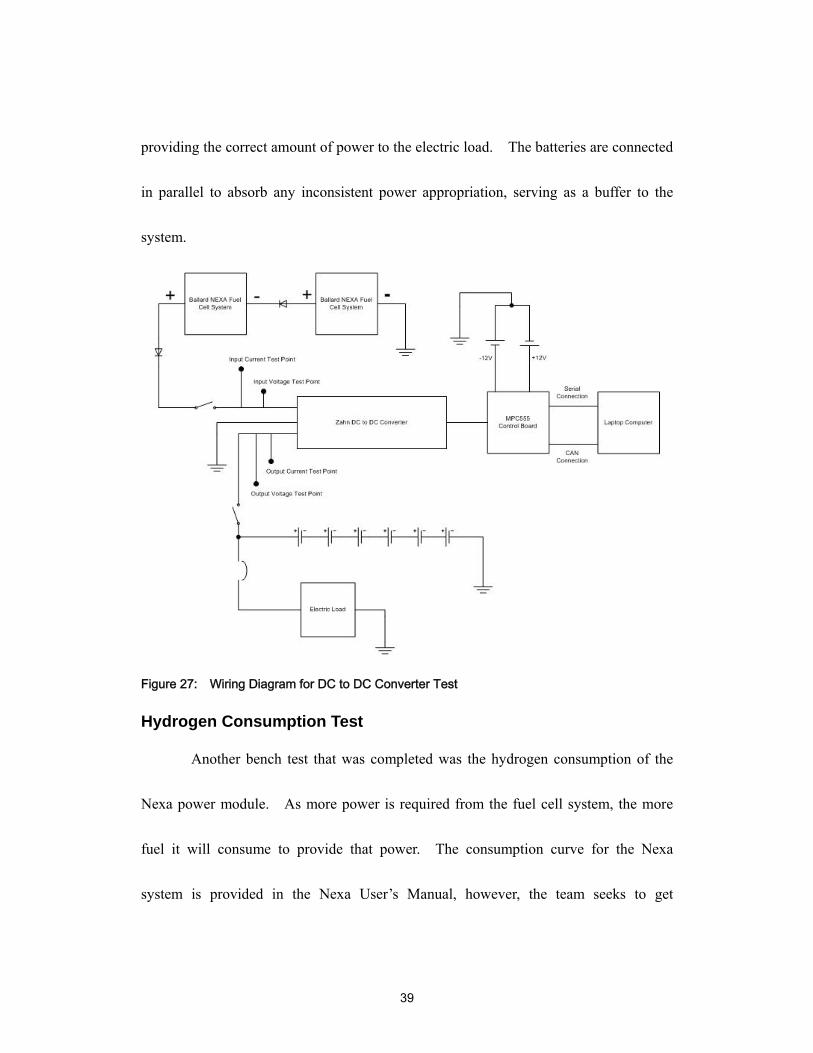
The Nexa system is connected similarly to the polarization curve test, but
instead of being directly connected to the electric load, it is connected to the DC to DC
converter. This will enable the DC to DC converter to regulate the voltage being sent
to the batteries and electric load. With proper control from the MPC555 circuit board,
the DC to DC converter will draw the correct amount of power from the fuel cell while
39
providing the correct amount of power to the electric load. The batteries are connected
in parallel to absorb any inconsistent power appropriation, serving as a buffer to the
system.
Figure 27: Wiring Diagram for DC to DC Converter Test
Hydrogen Consumption Test
Another bench test that was completed was the hydrogen consumption of the
Nexa power module. As more power is required from the fuel cell system, the more
fuel it will consume to provide that power. The consumption curve for the Nexa
system is provided in the Nexa User’s Manual, however, the team seeks to get
40
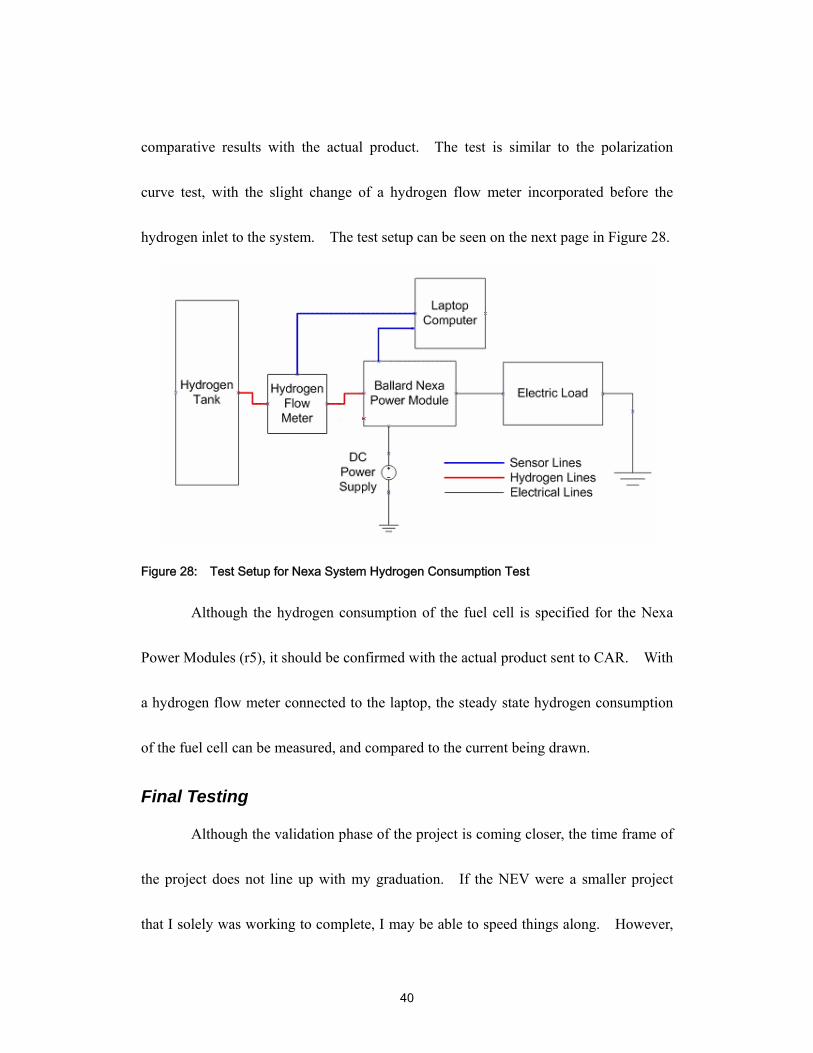
comparative results with the actual product. The test is similar to the polarization
curve test, with the slight change of a hydrogen flow meter incorporated before the
hydrogen inlet to the system. The test setup can be seen on the next page in Figure 28.
Figure 28: Test Setup for Nexa System Hydrogen Consumption Test
Although the hydrogen consumption of the fuel cell is specified for the Nexa
Power Modules (r5), it should be confirmed with the actual product sent to CAR. With
a hydrogen flow meter connected to the laptop, the steady state hydrogen consumption
of the fuel cell can be measured, and compared to the current being drawn.
Final Testing
Although the validation phase of the project is coming closer, the time frame of
the project does not line up with my graduation. If the NEV were a smaller project
that I solely was working to complete, I may be able to speed things along. However,

41
with the dependence of other group members on the assignment, I am not able to bring
complete closure to the development of the Hydrogen Powered Neighborhood Electric
Vehicle. However, an explanation of the final product is of order.
The main consideration for the final testing phase of the project is the ability to
log data from the vehicle after it has been in operation for some time. Many of the
same variables of the system will be logged on board the vehicle. Hydrogen
consumption of the vehicle can be logged with a hydrogen flow meter. Second,
voltage and current data from not only the batteries, but the fuel cell systems and DC to
DC converter as well, will be monitored using current sensors, voltage dividers, and a
data acquisition system similar to the bench tests. The Garmin GPS will be
incorporated once again onto the GEM to take similar position and speed readings of
the vehicle. This will assist the team in the post processing of the voltage and current
data. Finally, the NexaMon software included with the Ballard fuel cells can be used
for diagnostic testing of each individual fuel cell stack, while it is still on board the NEV.
Realization
With the design for the vehicle complete, the physical realization of the fuel cell
electric hybrid powered GEM can begin. Much of the credit for the construction can
be given to Don Williams, the machine shop expert at the Center for Automotive

42
Research. Although a plan for the framework and shelves for the fuel cells has been
developed, creation of these parts always varies slightly from the anticipated model.
The trays built for the fuel cells are built from aluminum box bar and aluminum
angle, as seen in Figure 29. They are attached to the frame of the vehicle, and either
welded or bolted on, giving each tray plenty of support. The trays then have aluminum
angle supporting the bottom plate of each tray. Holes are drilled into each of these
plates and spacers are incorporated to simulate the mounting points that the Nexa
systems require. This will provide almost identical mounting for the fuel cell systems
when compared to the trays provided from Ballard. One of the Nexa systems can be
seen incorporated into the vehicle in Figure 30 below.
Figure 30: Nexa System Bolted into the Trays
Figure 29: Nexa System Trays

1
With the fuel cells incorporated into the GEM, the next step of the realization
process can be initiated. Because fuel cells need to run in as clean of an environment
as possible, the team included protective boxes around the Nexa systems, to prevent
dirt, dust and other pollutants from entering the environment of the fuel cell stacks.
As seen in Figure 31, again to the credit of Don Williams, Plexiglas boxes have been
constructed to isolate the fuel cell systems from any unwanted elements such as rain,
dust, and dirt.
With the fuel cells installed and protected in the vehicle, the hydrogen tank can
be incorporated as well. The DyneCell can be seen in it’s allotted position in Figure
32 to the right. The connection between the DyneCell and the Nexa systems has been
chosen to be stainless steel piping. This will ensure secure and durable transfer of the
gaseous hydrogen from the tank to the fuel cell stacks.
Figure 32: Dynetek Hydrogen Tank on Board
GEM
Figure 31: Plexiglas Box Built Around Nexa
System
2
With a hydrogen source and the fuel cell stacks securely fastened to the
vehicle, the team can start the step by step process of complete installation of the
hardware. This consists of several steps, starting essentially with a bench test on the
vehicle, and working towards fully functioning fuel cells with everything they need on
board the vehicle.
The team will start by connecting the fuel cells to the hydrogen tank, regulated
at approximately 45 psi, similar to the laboratory setup. The exhaust and hydrogen
purge lines will exit the rear of the vehicle, because there is no need for the bucket and
hood anymore (water can drip to the ground and hydrogen can disperse into the
atmosphere freely). The fuel cells will still need an external power source for startup
and shutdown procedures, so plug-in power supplies will be used in the same manner
as in the lab. The electric load will be used also, to simulate the electric motor. The
Panasonic batteries will be connected in parallel with the fuel cells and the electric load.
This will again confirm the functionality of the architecture of the vehicle, testing the
control strategy and logic created and run through the MPC555.
The gradual process toward a self sustaining vehicle starts with the power
supplies. Previously the fuel cells were started and shut down with external power
supplies, providing 20V (the suggested voltage was between 18 and 24V). The team
3
has incorporated a small lead acid battery, similar to a motorcycle battery, in order to
provide the startup and shutdown power for the Nexa systems. This will be recharged
through the control system of the vehicle, such that when the state of charge of the
battery becomes too low, the MPC555 will direct power to the lead acid battery.
With the fuel cells functioning without external power supplies, the electric
load is replaced by the electric motor. This is, in the end, the true load of the power
train. The GEM is placed on a jack stand, to enable the team to keep the vehicle
stationary for testing, and prevent any extraneous load being placed on the system.
The purpose of this test is to confirm that the components of the system cooperate with
the electric motor, not to test the performance of the vehicle. Therefore, no load is
placed on the wheels.
When the initial architecture of the system is completed and incorporated into
the GEM, the vehicle will be ready for testing of end functionality and performance.
Results
Simulation
As mentioned earlier, simulation is a very important part of the project.
Using the number crunching capabilities of MATLAB and Simulink, the team is able
process many different combinations of hardware to determine which work the best

4
together. Shown on the next page, in Figure 33, is part of an excel spreadsheet with
many different combinations of hardware. Inputs are assumed at the top of the
spreadsheet, such as vehicle weight, weight of the hydrogen tank, and weight of the
passengers. Then the hardware combinations can be analyzed. Shown in the figure
is only for a 2 kW fuel cell stack. One variable that can be seen changing is the
number of batteries, in column D. As the number of batteries changes, so does the
Curve Weight of the vehicle, shown in column F.
Figure 33: Simulation Results Table for Sizing Hardware Components
Then, from the simulation, many variables are put out, such as minimum state
of charge and maximum output current. The rows that are highlighted red are rated as
“bad.” In this case, the performance of the vehicle does not meet the standards that
5
the team has set forth. From red, ratings increase to orange, yellow, and then green,
improving respectively. One aspect, however, that the simulation does not take into
account is the amount of space that the different components require.
Results of the simulation itself can be seen in Figures 5 and 6 in the planning
stage of the project. However, what is important to note here is that all of the results
from many runs of simulation can be seen above in Figure 33. It is a good
comparison tool when dealing with large amounts of simulation data.
Initial Vehicle Testing
The team has chosen to create several “standardized” driving cycles around
the campus and Upper Arlington area. These results will go into detail of one of the
driving cycles created, and explain the acquisition and post-processing procedures.
Credit must be given to BJ Yurkovich, who created the data acquisition program run
through MATLAB. With the work of BJ, the team was able to acquire the data and
process it in a timely manner.
One of the driving cycles created for the GEM project can be seen below in
Figure 34. It contains approximately 8.5 km of driving distance around the Ohio
State University’s campus, and depending on traffic and other variables, takes about 20
to 25 minutes.
Two passengers are typically taken on these trips; one person can operate the

6
vehicle while the other can monitor the laptop computer on board. As the vehicle is
driven, the laptop computer acquires data through MATLAB from the Garmin GPS
and the National Instruments Data Acquisition System. As the data is acquired, the
GPS latitude and longitude is plotted on the laptop to track the vehicle’s path.
Figure 34: Campus Driving Cycle for Initial and Final Vehicle Testing
If the MATLAB plot, as shown in Figure 35, is then laid overtop of the
original driving cycle map, the results show the accuracy of the GPS data. The
overlain plot can be seen in Figure 36. The GPS data points match almost identically
to the original driving cycle.
7
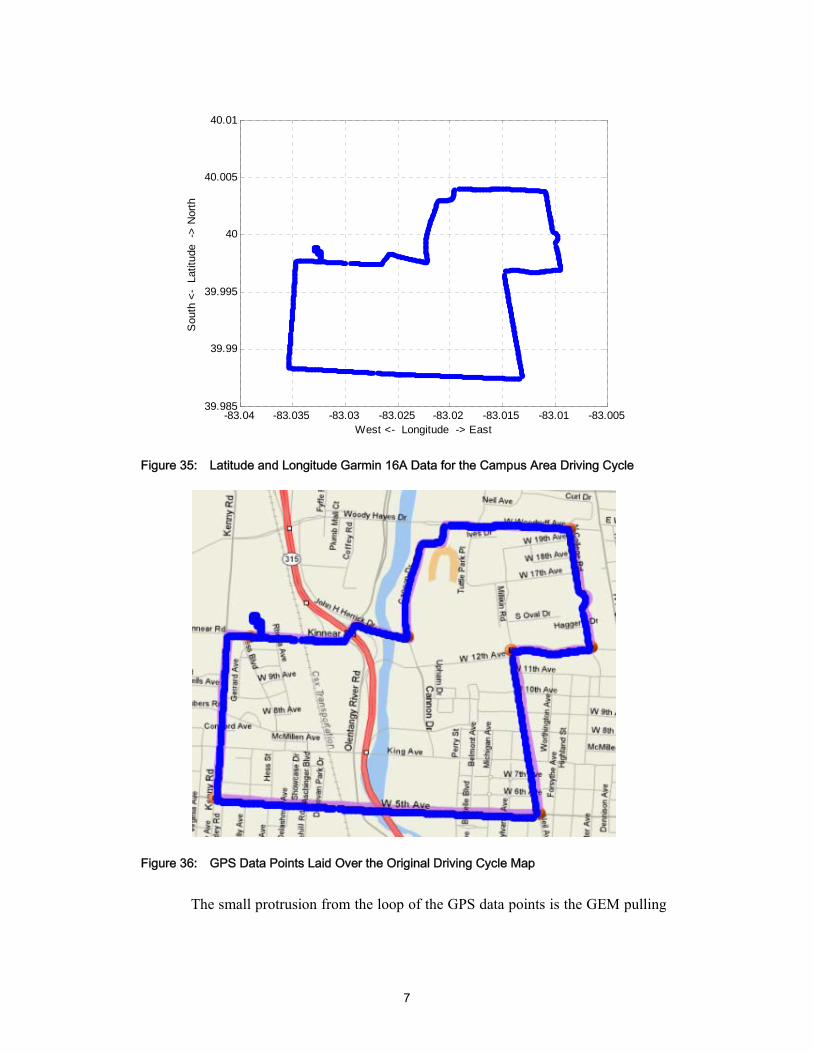
Figure 35: Latitude and Longitude Garmin 16A Data for the Campus Area Driving Cycle
Figure 36: GPS Data Points Laid Over the Original Driving Cycle Map
The small protrusion from the loop of the GPS data points is the GEM pulling
-83.04 -83.035 -83.03 -83.025 -83.02 -83.015 -83.01 -83.00539.985
39.99
39.995
40
40.005
40.01
West <- Longitude -> East
Sou
th <
- La
titud
e ->
Nor
th

8
from the high bay garage at the Center for Automotive Research, and can be seen close
up in Figure 37 below. This also gives a good representation that the speed of the
vehicle can be estimated from the 2-dimensional plot. Because the data points are
fixed-time incremented, the velocity of the vehicle determines the space between the
points, and vice versa.
Figure 37: Zoomed in View of the Campus Area Driving Cycle GPS Data Points Around the
Center for Automotive Research
The GPS data can then be integrated over time to get total distance traveled.
The data processing portion of the MATLAB program created by BJ takes the data
points and calculates the distance between them. Adding up all of the distances will
get a total distance traveled so far. The results of this can be seen in Figure 38 below.

9
Figure 38: Distance Profile of the Campus Area Driving Cycle
The distance profile is an always increasing function. Unless the driver
decided to drive backwards, this would hold true, but the MATLAB program only adds
the distances between two consecutive data points, and does not take into account
whether the GEM is going forward or is in reverse.
Shown on the next page, in Figures 39 and 40, is voltage and current data
taken from the National Instruments data acquisition board (NIDAQ). The important
information to take from these figures is that when looking at the graph, the user can
tell the periods of high power demand, along with those in which the vehicle is at rest.
0 200 400 600 800 1000 1200 14000
1000
2000
3000
4000
5000
6000
7000
8000
9000
Time [sec]
Dis
tanc
e [m
]

10
200 220 240 260 280 300 320 340 360 380 400-150
-100
-50
0
50
100
150
200
I bus [A
]
Time [s]
Figure 39: Current Data for Initial Testing of GEM
200 220 240 260 280 300 320 340 360 380 40064
66
68
70
72
74
76
Vbu
s [V]
Time [s]
Figure 40: Voltage Data for Initial Testing of GEM
High power demand requires large amounts of current, which in turn, the

11
voltage decreases, characteristic of batteries. When compared to fuel cells, the open
circuit voltage does not drop as much. However, batteries also have changing
performance, depending on the state of charge and the current that is being drawn from
them. While this will not be discussed in further detail here, there are many resources
at the Center for Automotive Research which can.
Bench Testing
Nexa System Polorization Curve Test
The first experiment was to create a polarization curve for the Nexa fuel cell
systems. The polarization curve can be seen below in Figure 41.
0 5 10 15 20 25 30 35 40 450
5
10
15
20
25
30
35
40
Current (Amps)
Vol
tage
(V)
Increasing CurrentDecreasing Current
Figure 41: Polarization Curve for Nexa Fuel Cell System
As predicted, the voltage provided by the fuel cell decreases with

12
increasing current being drawn from the stack. One important aspect to note is that as
the current is increasing, the voltage values are different when compared to decreasing
current. The voltage for decreasing current is slightly higher than when the current is
increasing. This could be attributed to the concept of a “warmed-up” engine. As the
fuel cell has not been strained, the stack is in a calmer state of operation, more like an
idling process. As higher and higher current is drawn, the stack then warms up.
Then, as the stack is cooling down, it operates at a higher efficiency, able to produce
higher voltages while supplying the same amount of current.
DC to DC Converter Test
The second bench test was to confirm the operation of and efficiency of the
DC to DC converter. The test was not able to be completed by the time this thesis
was finished, so the actual results cannot be seen. What can be seen, in Figure 42
below, are results of a similar previous test completed by Gabriel Choi. Figure 42
shows the efficiency and power curve for a 5 kW DC to DC converter, giving the
reader a general idea of the performance of a DC to DC converter with respect to
power. As expected, when the power is increased, the converter becomes more
efficient. Because this converter is rated at 5 kW and not 2 kW like the Zahn DC to
DC converter, the efficiency will be not be as high for the NEV application. The
optimum piece of hardware would operate at its most efficient point at all times. This

13
is not possible with a variable load, but the team is able to operate as efficiently as
possible with the converter, while still having the capacity to put 2 kW through (for
performance of the vehicle).
Figure 42: Power vs Efficiency Curve for the 5 kW DC to DC Converter
Hydrogen Consumption Test
The results from the hydrogen consumption test can be seen in Figure 43
below. The hydrogen consumption follows a linear response to the current being
drawn from the stack.

14
0 10 20 30 40 50 60-5
0
5
10
15
20
25
Current [Amps]
Hyd
roge
n C
onsu
mpt
ion
[slp
m]
Regression CurveExperimental Data
Figure 43: Hydrogen Consumption Curve for Nexa System
It can be concluded that hydrogen consumption, defined as H2cons, can be
represented as a function of current.
H2cons = k I
One would think that with a simple substitution of hydrogen consumption for current
in P = I V that it would be easy to see that the power of the fuel cell stack depends on
the square of the hydrogen consumption. However, because the resistance of the fuel
cell stack changes as well, we cannot directly relate the two. Remember that the
voltage of the fuel cell drops as more current is being drawn, so it is not a simple linear
relation between the two. However, with the linear relation of current and hydrogen
(where k is a constant)

15
fuel consumption, it is easy to either determine hydrogen use from current, or vice
versa.
Conclusions
Based on the work that has been completed over the last eleven months, I have
learned a lot about fuel cells and their automotive applications. The hydrogen
powered Ballard fuel cell electric hybrid GEM is not only conceivable, but I believe
will be a success. Although the project was not completed by the time of my
graduation, I believe the time and effort that I have put forth is shown through this
paper. This research has opened my eyes to the world of alternative means of
transportation, and allowed me to conduct research and experience technology that I
could not anywhere else.

1
References (r1) “Driving Schedule, Powertrain Sizing and Simulation of Hybrid Fuel Cell Golf Cart” by Gabriel Choi. The Center for Automotive Research and Intelligent Transportation. November 29, 2005
(r2) “Nexa Startup Manual” by Jeff Marusiak and Inchul Choi (r3) www.fueleconomy.gov. February 7, 2007
(r4) “Experimental Validation of a PEM Fuel Cell Stack” by Chad J Allison. The Center for Automotive Research. February, 2005. (r5) “Nexa Power Module User’s Manual.” MAN5100078. Ballard Inc. 2005
(r6) “GEM 2005 Owner’s Manual.” Global Electric Motorcars, LLC. (r7) www.dynetek.com. January 14, 2007
(r8) www.ni.com/dataacquisition/ (r9) “GM TEP-155 Fuel Cells for Automotive Applications,” Yann Guezennec, Warren, MI 2003 (r10) www.garmin.com