power trends 2014: evolution of the grid - nyiso trends 2014 is printed on mohawk options 100% pc,...
TRANSCRIPT

POWER TRENDS 2014Evolution of the Grid
sm

Power Trends 2014 is printed on Mohawk Options 100% PC, which is made with 100% post-consumer recycled fiber, and manufactured entirely with Green-e certified wind-generated electricity.

The New York Independent System Operator (NYISO) is a not-for-profit corporation responsible for operating the state’s bulk electricity grid, administering New York’s competitive wholesale electricity markets, conducting comprehensive long-term planning for the state’s electric power system, and advancing the technological infrastructure of the electric system serving the Empire State.
Data used in Power Trends 2014, unless otherwise noted, are from the 2014 Load and Capacity Data Report (also known as the “Gold Book”).
Published annually by the NYISO, the “Gold Book” presents New York Control Area system, transmission and generation data and NYISO load forecasts for the 2014 – 2024 period. It includes forecasts of peak demand, energy requirements, energy efficiency, and emergency demand response; existing and proposed resource capacity; and existing and proposed transmission facilities.
The “Gold Book” and other NYISO publications are available on the NYISO website, www.nyiso.com.

Power Trends 2014 — By the Numbers
Power ResourcesGenerationTotal Generation -- 2014 ........................................................................................ 37,978 MWGeneration Added 2000 - 2014 ..............................................................................10,411 MW
TransmissionTotal Circuit Miles of Transmission -- 2014 ...........................................................11,056 milesTransmission Capability Added 2000 - 2014 .......................................................... 2,315 MW
Demand ResponseProjected Demand Response (Special Case Resources) -- Summer 2014 ............ 1,189 MW
Reliability RequirementsReliability Requirement -- Summer 2014 ............................................................ 39,389 MWTotal Resources Available -- Summer 2014 ........................................................ 41,298 MW
Renewable ResourcesTotal Renewable Resource Capacity -- 2014 ...................................................... 6,242 MWTotal Existing Wind Generation -- 2014 ............................................................... 1,730 MWProposed Wind Generation .................................................................................. 2,003 MWPercentage of Electric Energy from Renewables in 2013 ............................................. 23%
Power DemandsTotal Usage in 2013 ....................................................................................... 163,514 GWhTotal Usage in 2012 ....................................................................................... 162,840 GWhTotal Usage in 2011 ........................................................................................ 163,329 GWh
Forecast Peak Demand for 2014 ....................................................................... 33,666 MWAll-time Record Peak Demand (July 19, 2013) .................................................. 33,956 MW Prior Record Peak Demand (August 2, 2006) ................................................... 33,939 MWRecord Winter Peak Demand (January 7, 2014) ................................................ 25,738 MW Prior Record Winter Peak Demand (December 20, 2004) ................................ 25,541 MW
1
Executive Summary ............................................................................................................................... 3State of the Grid.................................................................................................................................. 13Demand Trends and Forecasts ........................................................................................................... 13
Record Summer Peak ..........................................................................................................................17Record Winter Peak ............................................................................................................................18
New York’s Power Resources ............................................................................................................. 19Generation .........................................................................................................................................20Transmission ......................................................................................................................................21Demand Response ...............................................................................................................................22
Resource Adequacy ............................................................................................................................ 23Planning for Emerging Reliability Needs ...........................................................................................25Planning for Public Policy Requirements .............................................................................................26
Grid Efficiency .................................................................................................................................. 27Transmission Congestion ....................................................................................................................28Upgrading Transmission .....................................................................................................................29
Resource Diversity ............................................................................................................................ 31Electricity Prices and Fuel Costs ..........................................................................................................33Gas-Electric Coordination and Fuel Assurance .................................................................................. 34
Future of the Grid ............................................................................................................................... 39Sustaining and Enhancing Power Resources .................................................................................. 39
Capacity Market Evolution ..............................................................................................................42Distributed Energy Resources ............................................................................................................44The Smarter, More Secure Grid ..........................................................................................................46Interregional Collaboration ..............................................................................................................50
Environmental Quality & Electric Reliability ................................................................................. 53Power Plant Emission Trends ...........................................................................................................53Renewable Resources ........................................................................................................................54The Future of Nuclear Power .............................................................................................................57Cumulative Impact of Environmental Regulations ............................................................................59
Conclusion .......................................................................................................................................... 61Markets and Grid Evolution ............................................................................................................ 61
Glossary ............................................................................................................................................... 63End Notes ........................................................................................................................................... 69
Table of Contents

Power Trends 2014: Evolution of the Grid2
List of Figures1. Electric Energy Demand Trends in New York State: 1996-2013
2. Annual Electric Energy Demand by Region: 2009-2013
3. Electric Energy Demand Trends in New York State – Actual & Forecast: 2000-2024
4. Electric Peak Demand Trends in New York State - Actual & Forecast: 2000-2024
5. Peak vs. Average Load in New York State: 1998-2013
6. New Generation in New York State: 2000-2013
7. New Transmission in New York State: 2000-2013
8. Demand Response Resources in New York State: Projected Capability of Special Case Resources Program - Summer 2014
9. Statewide Resource Availability: Summer 2014
10. Regional Load and Capacity in New York State
11. Transmission Congestion Corridors in New York State
12. Age of New York Transmission Facilities by Percentage of Circuit Mile
13. Generating Capability in New York State by Fuel Source – Statewide, New York City, and Long Island: 2014
14. Natural Gas Costs and Electric Energy Prices: 2000-2013
15. Electricity Demand and Electric Energy Prices: 2000-2013
16. Proposed Generation by Fuel Type: 2014
17. Generation Additions and Retirements in New York State: 2001-2014
18. Power Resources and Reliability Requirements: 2012-2014
19. New York Smart Grid Project Partners
20. Emission Rates from Electric Generation in New York State: 2000-2013
21. Wind Generation in New York State: Energy Produced - 2003-2013
22. Wind Generation in New York State: Nameplate Capacity - 2003-2014
23. Electric Energy Generated in New York State by Renewable Resources: 2000-2013
24. Summary of Environmental Regulations and Estimated Impact

3
EXECUTIVE SUMMARY
In the 1990s, the electric industry in New York began a period of transformation set in motion by significant changes in federal and state policies that restructured the electric system and established competitive wholesale electricity markets. With evolution and refinement of wholesale electricity
markets, emergence of new technologies, and the dynamics of public policy, the New York electric industry continues to change.The New York Independent System Operator (NYISO) was established to operate the bulk electricity grid, administer the wholesale electricity markets, provide comprehensive electric system planning, and advance the technologies serving the system. In collaboration with market participants, stakeholders, regulators, and policy makers the NYISO - as an independent source of information and technical expertise - addresses emerging and evolving challenges to the power grid and electricity markets.
The conditions that prompted electric industry restructuring and the changes made to reshape the electric system rest on the conviction that competitive wholesale electricity markets contribute to the economic vitality and energy security of New York State and its electricity consumers.
Power Trends 2014 provides data and analysis of major factors affecting New York’s electricity industry as part of the NYISO’s ongoing efforts to promote informed discussion of key energy issues.
Changing Patterns of Demand for Electricity
� Historic patterns of growth in electricity demand are changing – influenced by the economy, extreme weather events and emerging energy technologies.
� Trends in peak demand and day-to-day energy use are diverging – with implications for system planning, grid operations, wholesale electricity markets, and demand-side management programs.

Power Trends 2014: Evolution of the Grid4
Demand for electricity has historically increased with population increases, economic growth, and the expansion of electric-powered technologies. In New York and the nation, that pattern was affected by the 2008-2009 recession. Fundamental changes in the use of electricity are also serving to moderate or reduce growth as energy efficiency improves. Alternatives to grid-supplied power are emerging as well, with new distributed energy resources such as customer-sited solar photovoltaic systems.
In the U.S., electricity demand fell for the third consecutive year, dropping by 0.1 percent between 2012 and 2013. In New York, electricity demand increased slightly in 2013, but the state suffered extended outages related to Superstorm Sandy in 2012 that significantly affects the year-to-year comparison.
In addition to looking at annual electricity demand, which provides a measure of overall electric energy consumption, it is important to consider annual peak demand, which measures the maximum amount of electricity the system is called upon to deliver. While peak demand represents only a small fraction of a year’s overall power consumption, it is an important factor because reliability standards, such as reserve requirements, are based on projected peak demand. Significant investments are made to build and retain power resources that address peak requirements, although such resources may be used only a few days or hours each year.
In New York State, peak demand is forecast to grow at an annual average rate of 0.83 percent from 2014 through 2024. In contrast, overall electric energy use is forecast to grow at an average annual rate of 0.16 percent over the next decade. Simply put, the amount of power used during periods with the highest electricity demand is expected to increase at a faster rate than the amount of power used on a day-to-day basis.
The pattern of peak demand growing faster than overall electricity use is occurring throughout the nation. Evaluation of the trend by the U.S. Energy Information Administration (USEIA) suggests that it may be the result of factors such as climate controls becoming a larger portion of electricity consumption (e.g., air conditioning dominating power demands during heat waves).1

5
If growth in peak loads continues to outpace the growth in overall electricity consumption, the trend will affect the relative value of energy and capacity in wholesale markets. Energy efficiency programs and demand-side management efforts might need to be refined to address how effectively they are reducing overall demand, shifting demand from peak periods to off-peak times, or reducing demand during peak periods. In addition, capacity markets throughout the country are being reviewed to address emerging issues, and “energy-only” wholesale markets are considering the creation of capacity markets.
What Extreme Conditions Tell Us About the Grid
� Summer peak reinforced need to address congestion. � Winter peak highlighted gas/electric coordination issues. � Superstorm Sandy showcased the value of distributed energy resources.
Within a span of six months, New York State set two new seasonal records for peak electric load.2 A new overall record peak was reached during a summer heat wave in July 2013. A new record winter peak was set during the extreme cold that accompanied a polar vortex in January 2014. Such periods of peak demand serve as “stress tests” for the electric system, revealing both strengths and weaknesses. New York’s electric system successfully met the tests of the July 2013 heat wave and January 2014 cold snap by maintaining reliability without resorting to emergency measures that reduce or curtail electric service. Other episodes of stress to the system’s performance, such as Superstorm Sandy, likewise highlight the system’s fitness and illuminate its challenges.
Summer Peak and System Congestion
The summer peak conditions, which set an all-time record of 33,956 megawatts on Friday, July 19, were characterized by a weeklong heat wave that produced several extended periods with load exceeding 30,000 megawatts.
Market incentives produced strong generator response and near universal availability. Demand response programs to reduce energy use at peak times were activated throughout the week. Interregional collaboration among neighboring grid operators enabled power imports and exports to be efficiently scheduled to address individual regional needs.
Periods of resource scarcity during the heat wave produced price spikes and illustrated the challenges of serving historically-congested areas of the Lower Hudson Valley, New York City and Long Island. Demand response was targeted to those regions at the start of the heat wave. In the future, transmission upgrades into and/or development of generation and demand-side resources in those areas would alleviate congestion, help avoid future reliability problems, lower consumers’ energy costs, and enhance operational flexibility.

Power Trends 2014: Evolution of the Grid6
The transmission congestion challenges highlighted by the summer peak conditions reinforce the need for initiatives such as the New York Energy Highway and continued evolution of capacity markets to encourage resource investments where they are most needed.
Winter Peak and Electric-Gas Coordination
With extremely cold weather across large parts of the country in early 2014, New York set a new winter peak of 25,738 megawatts on January 7. The previous record for winter load, 25,541 megawatts, was set on December 20, 2004.
System reliability was successfully sustained during the January cold snap with effective regional cooperation and demand response, which was employed to address winter peak conditions for the first time in NYISO history. However, price spikes and operational challenges reflected the growing reliance of the electric system on natural gas.
The energy demands created by the winter cold also stressed the natural gas system, its pipelines, storage facilities, and local distribution companies. Demand for natural gas reached record levels and gas prices rose substantially. Nationwide, natural gas demand set a new daily record (137 billion cubic feet per day) in January 2014.3 While no widespread outage resulted from fuel supply shortages, soaring gas prices contributed to spikes in wholesale electricity prices.
During the winter cold snaps, there were periods during which the price of natural gas delivered to New York rose above the price of fuel oil, making oil-based generation more economic than gas for electric generation. These conditions highlighted the value of fuel diversity and dual-fuel capability. Reliance on natural gas to fuel power generation continues to expand in the Northeast and elsewhere in the nation. The challenges demonstrated by the winter peak conditions underscore the importance of enhancing communication and coordination between the electric and natural gas industries. Electric-gas coordination initiatives taking place at the Federal Energy Regulatory Commission, the New York State Public Service Commission, the NYISO, and among other regional grid operators/system planners are fundamental to the future of the electric system.
Superstorm Sandy and Distributed Energy Resources
The immediate aftermath of Superstorm Sandy, which struck New York in October 2012, included extended power outages in the New York metropolitan region. The devastation brought by the storm prompted extensive review of utility performance and a renewed focus on the resilience of the electric system.
While the storm produced power outages affecting more than 2 million utility customers in New York State, several hospitals, universities, and housing complexes employed distributed energy resources
7
capable of operating independently of the electric grid to keep power flowing to their facilities. New York University and New York-Presbyterian Hospital were among the institutions with combined heat and power installations that enabled them to keep the lights on in the wake of the storm.
Recognizing the potential of distributed energy resources to enhance the resilience of New York’s public infrastructure, Governor Cuomo announced a $40 million initiative aimed at developing community-based “microgrids,” independent electric distributions systems to provide power during extended outages due to future storms and disasters.4
Beyond the value that distributed resources may provide to system resilience, their deployment could affect the electric system in a variety of complex ways. For example, when combined with expanding energy efficiency, the use of distributed resource could dampen demand for electricity from the grid. In 2013, the NYISO forecasted average annual growth rate in peak demand to be 0.96 percent over the next ten years and projected overall electrical energy use to grow at an annual average of 0.47 percent. This year, the potential impact of energy efficiency programs and growth in customer-sited solar photovoltaic installations were among the factors that contributed to the NYISO’s lower forecasts for both annual peak growth (0.83 percent) and annual energy use (0.16 percent) over the next decade.
Sustaining and Enhancing Power Resources
� New York’s power resource margins remain positive, but are narrowing from more than 5,000 megawatts in 2012 to just over 1,900 megawatts in 2014.
� Gas-influenced power price volatility and the role of gas-fired generation in operational flexibility highlight the value of fuel diversity.
� Wind power continues to grow, with wind-generated electricity increasing 16% in 2013. � Distributed energy resources, while posing challenges to the traditional model of a centralized electric system, offer opportunities to enhance the efficiency and flexibility of grid operations.
Since 2000, the addition of new generation, expansion of interstate transmission, and development of peak-shaving demand response programs have contributed to a surplus of power resources, relieving concerns about a potential “generation gap” affecting New York’s electric system.
Over the past decade and a half, New York State has experienced a cycle of additions to capacity with the construction of new generating facilities and upgrades of existing power projects, as well as reductions in capacity resulting from power plant retirements. Generating capacity increased by more than 10,000 megawatts, while power plant retirements totaled nearly 6,000 megawatts.5 Added generation primarily came from wind-powered and gas-fueled facilities, while significant portions of New York’s coal generation fleet planned to retire.
Power Trends 2014: Evolution of the Grid8
In 2014, power resources available to serve New York State total 41,298 megawatts in combined capacity of power projects, demand response participation, and power import capability from neighboring electric systems. The total is 154 MW lower than last year, but it remains above the projected peak demand of 33,666 megawatts and in excess of reserve requirements.
This estimate of total resources measures the expected potential of those resources. However, unplanned outages of generating and transmission facilities and lower-than-expected participation of demand response can reduce the availability of resources at critical times.
The margin between available resources and reliability requirements has narrowed in recent years. In 2012, power resources totaled 43,686 megawatts, more than 5,000 megawatts greater than reliability requirements (peak forecast plus installed reserve margin). In 2014, the 41,298 megawatts of available resources are slightly more than 1,900 megawatts above the installed reserve margin requirements.
The NYISO’s most recent review of system reliability, the 2012 Comprehensive Reliability Plan, was published in March 2013. It concluded that certain proposed resource additions would meet resource adequacy requirements until 2019. A new reliability assessment by the NYISO is currently underway, examining the resource adequacy and transmission security components of system reliability.6
Planning for the future of the electric system is evolving. The NYISO and others are moving beyond traditional evaluations that focus on so-called “50/50” load forecast risk scenarios to include assessments that consider “90/10” scenarios that address less probable, but potentially higher risks to reliability of greater than expected load. These scenarios will help the NYISO account for the increases in system peak demand that can occur in extreme summer and winter patterns.
The Value of Fuel Diversity
The average wholesale electric energy price in 2013 was $59.13 per megawatt-hour, a 30 percent increase from a record low price the previous year. (At $45.28 per megawatt-hour, the 2012 price had marked the third straight decline in the average annual energy price.) The 2013 price was comparable to the average wholesale electric price in 2000, the first year of New York’s wholesale electricity markets and remained below the 14-year annual average of approximately $65 per megawatt-hour.
Wholesale electricity prices are directly influenced by the cost of the fuels used by power plants to meet the demand for electricity. Power plants fueled primarily by natural gas account for more than half the electric generating capacity in New York State. In 2013 and the winter of 2014, dramatic increases in the cost of natural gas produced spikes in power prices. During 2013, the average price for natural gas delivered in New York experienced a 58 percent increase over the historically low prices of 2012.7

9
The mix of fuels used to generate power affects the economics of electricity and the reliability of the power system. A balanced blend of fuels can assist the electric system in addressing issues such as price volatility, fuel availability, and public policy goals related to environmental quality and resource sustainability.
Compared to other parts of the country, New York State has a diverse mix of generation resources. However, much of New York’s current base of renewable power is provided by hydroelectric projects and wind farms located in western and northern localities, while the southeastern region hosts power plants fueled primarily by natural gas. Taking full advantage of statewide fuel diversity will require upgrades and enhancements of the transmission system, as noted by NYISO studies, the State Transmission Assessment and Reliability Study (STARS) conducted by the New York Transmission Owners, and Governor Cuomo’s New York Energy Highway initiative. These transmission enhancements will help move energy from upstate regions with a surplus of generating capacity to more populous areas, such as the Hudson Valley, New York City and Long Island, with higher power demands.
New York’s wind power resources continue to grow. Wind power capacity grew to 1,730 megawatts in 2014, a seven percent increase from 2013. While the pace of wind capacity additions moderated, electricity generated by wind grew by 16 percent to 3,541 gigawatt-hours last year. Wind also helped address power demand during recent peaks. While winds are often light during summer heat waves, more than 1,000 megawatts of wind power was generated on July 19, 2013, when the new all-time record peak demand was set. Wind also generated in excess of 1,000 megawatts on January 7, 2014, when a new record winter peak was established.
Distributed Energy Resources: Challenges and Opportunities
The NYISO and other grid operators continue to develop market designs and operational protocols that effectively integrate wind and other renewable resources. Similar evolution may be anticipated as distributed energy resources become a larger part of the electric system. While distributed energy resources include a wide range of technologies and systems, customer-sited photovoltaic appears to be among the fasting growing segments. In 2013, 4,751 megawatts of photovoltaic systems were added nationwide, a 41 percent increase from 2012. By the end of 2013, there were more than 440,000 operating solar photovoltaic arrays in the U.S. totaling over 12,000 megawatts of potential capacity, according to the Solar Energy Industries Association.8
New York State government’s “NY-Sun” Initiative reports that more than 300 megawatts of solar photovoltaic capacity were installed or had begun development over the past two years. The initiative calls for installation of 3,000 megawatts of solar capacity by 2023.
The proliferation of customer-installed solar photovoltaic systems, the development of community-level microgrids, the expansion of combined heat and power systems, and other distributed energy resources

Power Trends 2014: Evolution of the Grid10
present various complex challenges for the electric system. The interconnection of distributed resources – and their integration into grid operations – offer the opportunity to economically shape the load profile beyond today’s practice of responding to high periods of demand. This shift to a proactive integration model has significant potential to reduce peak demand periods and, with careful coordination between retail and wholesale markets, provide enhanced operational flexibility.
In April 2014, the New York State Public Service Commission initiated a “Reforming the Energy Vision” (REV) proceeding to “to improve system efficiency, empower customer choice, and encourage greater penetration of clean generation and energy efficiency technologies and practices.” That initiative is aimed at setting the stage for management and coordination of distributed energy resources as part of a broader grid modernization effort.10
Maximizing Resources and Regional Collaboration
� The Broader Regional Markets initiative is enhancing coordination among regional electric systems to optimize regional power resources, accelerate transactions, and provide savings.
� The Eastern Interconnection Planning Collaborative is engaged in studying gas-electric coordination issues across an array of electric systems serving the eastern U.S.
The evolution of the electric system also is being shaped by collaboration among the grid operators, market administrators, and electric system planners serving North America. While interconnected, each region historically developed its power system separately and their differences created seams in the overall fabric of the grid that can inhibit efficient coordination of grid operations and lead to market inefficiencies. Mending those seams and strengthening interregional planning enhances the availability of power system resources and enables more efficient use of collective power assets.
The Broader Regional Markets initiative is an effort by grid operators throughout the Northeast, Mid-Atlantic, and Midwest to reduce the need to use more expensive local power if less costly power is available from neighboring systems. The effort aims to shorten the time commitment for moving power across control area borders, allowing faster responses to changing conditions and providing increased efficiencies. The NYISO and PJM implemented a key component of the Broader Regional Markets initiative in early 2013 with the launch of Market-to-Market Congestion Relief Coordination. In its first year of operation, the initiative saved an estimated $4.7 million.11
Nationwide debates about the need for further expansion of interstate transmission prompted creation of the Eastern Interconnection Planning Collaborative (EIPC) in early 2009. Prior to the creation of the EIPC, which includes 24 electric system planning authorities, there was no single organization to conduct interconnection-wide planning analysis across the eastern portion of North America. With

11
federal funding from the U.S. Department of Energy (DOE), the EIPC developed and evaluated an array of future energy scenarios, and conducted detailed transmission analyses, production cost assessments and high-level cost estimates for the resources associated with each scenario. The EIPC is currently studying the region’s natural gas infrastructure and its ability to support the growing use of natural gas for electric power production.12
Markets and Grid Evolution
� Wholesale electricity markets structures are evolving through collaborative efforts by ISOs/RTOs and their stakeholders to address changing technology, economic conditions, and public policy.
� Markets address a key goal of restructuring by encouraging investment in power resources where they are most needed and by placing financial risk on investors, rather than on ratepayers.
The restructuring of the electric industry, called “one of the largest single industrial reorganizations in the history of the world,” 13 continues to be refined.
In the 1990s, frustration with “perceived shortcomings of traditional cost-based regulation” 14 contributed to the enactment of the Energy Policy Act of 1992 (EPAct92). Under authority granted by EPAct92, the FERC issued Order 88815 in 1996 to restructure the electric industry by requiring that transmission lines be open to competition. FERC also called for the unbundling, or functional separation, of services for generation and transmission and distribution and ordered the power pools in the Northeast to open their membership to other entities.
In developing its “competitive opportunities” for the electric system, New York State specifically “adopted a flexible approach which has allowed policies to be guided and shaped by the successes and challenges experienced in this and other states, and by continuously evolving market conditions.”15
Placing the financial risk of investments in power resources on investors and suppliers, rather than passing it on to rate-paying electricity customers, was among the goals of electric industry restructuring. The Draft 2014 New York State Energy Plan notes the incentives provided by New York’s wholesale electricity markets “to locate generation, transmission and demand response resources where they are most needed” and cites the value of markets in “putting the risk of those investments on investors rather than on ratepayers.”

Power Trends 2014: Evolution of the Grid12

13
STATE OF THE GRIDDemand Trends and Forecasts
In the last half of the 20th century, electricity demand in the United States increased every year, with the exception of 1982, when the effects of recession dampened power usage. However, the pace of growth in the demand for electricity has slowed in each decade since the 1950s, from a 9.8-percent annual rate of growth from 1949 to 1959 to only 0.7 percent per year in the first decade of the 21st century.16
Over the past 10 years, the average annual growth rate for electric energy demand in New York State was 0.23 percent.
Figure 1 - Electric Energy Demand Trends in New York State: 1996-2013
144,000
149,000
154,000
159,000
164,000
169,000
Dec-96
Jun-97
Dec-97
Jun-98
Dec-98
Jun-99
Dec-99
Jun-00
Dec-00
Jun-01
Dec-01
Jun-02
Dec-02
Jun-03
Dec-03
Jun-04
Dec-04
Jun-05
Dec-05
Jun-06
Dec-06
Jun-07
Dec-07
Jun-08
Dec-08
Jun-09
Dec-09
Jun-10
Dec-10
Jun-11
Dec-11
Jun-12
Dec-12
Jun-13
Dec-13
New York State Electric Energy Trends: 1996-2013
Actual Weather Normalized

Power Trends 2014: Evolution of the Grid14
Demand for electricity has tended to rise with population increases, economic growth, and the expansion of electric-powered technologies. In New York State and across the United States, the historical patterns of growth were affected by the 2008-2009 recession. Fundamental changes in the use of electricity also are serving to moderate or reduce growth, as energy efficiency programs improve. Alternatives to grid-supplied power are emerging, with new distributed energy resources such as customer-sited solar photovoltaic systems in use.
In the U.S, electricity demand fell for the third consecutive year, dropping by 0.1 percent between 2012 and 2013. In New York, electricity demand increased slightly in 2013, but the state suffered extended outages related to Superstorm Sandy in 2012 that significantly influence the year-to-year comparison.
Figure 2 - Annual Electric Energy Demand by Region: 2009-2013
21,892 22,922 22,704 22,302 22,114
53,100 55,114 54,059 53,487 53,316
64,982 65,852 67,314 68,084 68,929
18,80619,617 19,252 18,967 19,155
0
20,000
40,000
60,000
80,000
100,000
120,000
140,000
160,000
180,000
2009 2010 2011 2012 2013
Gig
awat
t Hou
rs
LI NYC Upstate Lower Hudson
-1.9%
-0.8% -1.8%
1.1%
-0.3%
1.0% -1.9% 4.3%
1.3% 2.2%
3.8%
4.7% -1.0%
-1.5%
-1.1%
1.2%
158,780 163,505 163,329 162,840 163,514 3.0%
-0.1% -0.3% 0.4%

15
Figure 3 - Electric Energy Demand Trends in New York State – Actual & Forecast: 2000-2024
In addition to looking at annual electric energy demand, which provides a measure of overall electricity consumption, it is important to consider annual peak demand, which measures the maximum amount of electricity the system is called upon to deliver. While peak demand represents only a small fraction of a year’s overall power consumption, it is a significant factor because reliability standards, such as reserve requirements, are based on projected peak demand.
During the past decade, the average annual growth rate for peak demand in New York was 1.99 percent. A new all-time record peak of 33,956 megawatts was established in 2013.
Peak demand in New York is forecast to grow at an annual average rate of 0.83 percent from 2014 through 2024. In contrast, overall electric energy use is forecast to grow at an average annual rate of 0.16 percent over the next decade. Simply put, the amount of power used during periods with the highest electricity demand is expected to increase at a faster rate than the amount of power used on a day-to-day basis. Comparison of the recent trends also offers evidence that peak demand is increasing as average demand remains relatively constant. For example, the new record peak set in 2013 is nearly 5,800 megawatts higher than the 1998 peak. In contrast, average demand in 2013 was approximately 1,500 megawatts above the 1998 average.
150,000
155,000
160,000
165,000
170,000
175,000
180,000
2000
2001
2002
2003
2004
2005
2006
2007
2008
2009
2010
2011
2012
2013
2014
2015
2016
2017
2018
2019
2020
2021
2022
2023
2024
GW
h
Actual Forecast with Energy Efficiency Forecast without Energy Efficiency

Power Trends 2014: Evolution of the Grid16
Figure 4 - Electric Peak Demand Trends in New York State – Actual & Forecast: 2000-2024
Figure 5 - Peak vs. Average Load in New York State: 1998-2013
25,000
27,000
29,000
31,000
33,000
35,000
37,000
39,000
41,000
2000
2001
2002
2003
2004
2005
2006
2007
2008
2009
2010
2011
2012
2013
2014
2015
2016
2017
2018
2019
2020
2021
2022
2023
2024
Megaw
atts
Actual Forecast without Energy Efficiency Forecast with Energy Efficiency
15,000
17,000
19,000
21,000
23,000
25,000
27,000
29,000
31,000
33,000
35,000
1998
1999
2000
2001
2002
2003
2004
2005
2006
2007
2008
2009
2010
2011
2012
2013
Meg
awat
ts
Peak Load Average Load

17
The pattern of peak demand growing faster than average electricity use is occurring throughout the nation. Evaluation of the trend by the U.S. Energy Information Administration (USEIA) suggests that it may be the result of factors such as climate controls becoming a larger portion of electricity consumption (e.g., air conditioning dominating power demands during heat wave).17
While the periods of extremely high demand represent only a small portion of overall power consumption, the electric system has to be constantly ready to meet that high level of demand. Consequently, a significant amount of generating capacity remains idle most of the time.
If growth in peak loads continues to outpace the growth in average electricity consumption, the trend will affect the relative value of energy and capacity in wholesale markets. Capacity markets throughout the country are being reviewed to address emerging issues, and “energy-only” wholesale markets are considering the creation of capacity markets.
Continued growth of peak demand may also require a refinement of energy efficiency programs and demand-side measures to address their relative impact on reducing overall demand, shifting demand from peak periods, or reducing demand during peak periods. The 2014 Draft State Energy Plan includes reduction of electric system peak demand among its metrics and recommends steps such as evaluation of demand-side programs to lessen system peaks.18
Within a span of six months, New York State set two new seasonal records for peak electric demand. In July 2013, an all-time record peak was set during a summer heat wave. In January 2014, a record winter peak was set during the extreme cold that accompanied a polar vortex. New York’s electric system met the tests of the July 2013 heat wave and January 2014 cold snap, maintaining reliability without resorting to emergency measures that reduce or curtail electric service to customers. Such periods of peak demand serve as “stress tests” for the electric system, revealing both strengths and weaknesses. Other episodes of stress to the system’s performance, such as Superstorm Sandy, likewise highlight the system’s fitness and illuminate its challenges.
Record Summer Peak - 2013
The July 2013 peak was set following a week of sweltering heat throughout New York State and much of the nation. In New York, there were several extended periods with load exceeding 30,000 megawatts throughout the week.19
Market incentives produced strong generator response and near universal availability. Demand response programs, which reduce energy use at peak times, were activated for the downstate region during the first three days and statewide for the two remaining
New record peak -- 33,956 megawatts --
July 19, 2013
Previous record set in 2006

Power Trends 2014: Evolution of the Grid18
days of the workweek. Interregional collaboration among neighboring grid operators enabled power imports and exports to address individual region needs. On the day the record peak was set, the NYISO was able to import power from the Ontario and the PJM regions. Power was also exported to assist ISO New England during the day.
On many days during extremely hot weather, winds are very light or non-existent. However, New York’s electric system had the benefit of more than 1,000 MW of wind power throughout much of the day the all-time peak was set. The variability of wind resources during peak demand periods illustrates its intermittent availability. It also highlights the value of a diverse portfolio of generation and other resources that may be required when wind power is unavailable.
Periods of resource scarcity during the heat wave produced price spikes that further illustrated the challenges of serving historically congested areas of the Lower Hudson Valley, New York City and Long Island. Transmission upgrades and/or development of generation and demand-side resources in the region would alleviate congestion, help to avoid future reliability problems, lower energy costs, and enhance operational flexibility. (See “Grid Efficiency” section for further discussion.)
The transmission congestion challenges highlighted by the summer peak conditions reinforce the need for initiatives such as the New York Energy Highway and continued evolution of capacity markets to encourage resource investments where they are most needed.
Record Winter Peak - 2014
With extremely cold weather producing challenging electric system conditions across large parts of the country, New York State set a new winter record peak demand for electricity of 25,738 megawatts on January 7, 2014. The previous record winter peak demand of 25,541 megawatts was set on December 20, 2004.
System reliability was successfully sustained during the January cold snap with effective regional cooperation. On the day the winter peak was set, the NYISO imported power from ISO New England and Ontario over the evening peak hours and exported power to assist the PJM region.
In addition, demand response was employed on January 7 to address winter peak conditions for the first time in NYISO history.
New winter record peak -- 25,738 megawatts --
January 7, 2014
Previous record set in 2004
NYISO’s first use of demand response in winter

19
Extremely cold temperatures can cause equipment problems on the electric system, including reduced pressure in high voltage circuit breakers, icing in rivers serving hydroelectric plants, frozen pipes and valves associated with outdoor fuel and auxiliary systems, and oil systems becoming more difficult to operate.
The energy demands created by the winter cold also stressed the natural gas system, its pipelines, storage facilities, and local distribution companies. Demand for natural gas reached record levels and gas prices rose commensurately. Nationwide, natural gas demand set a new daily record in January 2014.20 While no outages resulted from fuel supply shortages, soaring gas prices contributed to spikes in wholesale electricity prices.
During portions of the winter cold snaps, oil prices were lower than natural gas for electric generation, highlighting the value of fuel diversity and dual-fuel capability. The availability of fuel oil during periods of peak demand also showed its value as generator outages required the grid operators to call on alternative resources. The NYISO is evaluating the impact of fuel storage capability, inventories at generation facilities, and fuel availability and delivery issues in order to address concerns highlighted by this winter’s conditions.
The challenges demonstrated by the winter peak conditions underscore the importance of enhancing communication and coordination between the electric and natural gas industries, as reliance on natural gas to fuel power generation continues to expand. Electric-gas coordination initiatives taking place at the Federal Energy Regulatory Commission, the New York State Public Service Commission, the NYISO, and among gas industry participants and regional grid operators are critical to maintaining the reliability of the electric system now and in the future. (See “Gas-Electric Coordination & Fuel Assurance” section for further discussion.)
New York’s Power Resources
Successful management of recent record peaks demonstrates the ability of New York’s power resources and wholesale markets to sustain system reliability. The near-term outlook for New York’s electric system remains positive as a result of the generation, transmission, and demand-side resources developed since 2000. Combined with the moderation in the growth of electricity demand, this array of resources continues to provide a surplus of supply.
10,400 megawatts of generating capacity added
since 2000
2,300 megawatts of transmission capability added
since 2000

Power Trends 2014: Evolution of the Grid20
A211MW
117 MW
B
B
C796 MW
E
D
F3,055 MW
G
H
I
J3,692 MW K 1,401 MW
606 MW
Total Nameplate Capacity Added Since 2000
10,411 MW
459 MW
74 MW
“The competitive electricity market structure in New York is designed to provide transparent price signals for both energy and capacity. Such transparency encourages investors to locate generation, transmission, and demand response resources where they are most needed and encourages investment in more efficient resources that can compete and bid into the market at lower prices.” — 2014 Draft New York State Energy Plan21
Generation
Since 2000, private power producers and public power authorities have added more than 10,400 megawatts of generating capacity in New York State. Over 80 percent of the new generation is located in New York City, on Long Island and in the Lower Hudson Valley—the regions of New York State where power demand is greatest. Location-based pricing and the regional capacity requirements of New York’s wholesale electricity markets encourage investments in areas where the demand for electricity is the highest.
Figure 6 - New Generation in New York State: 2000-2013
21
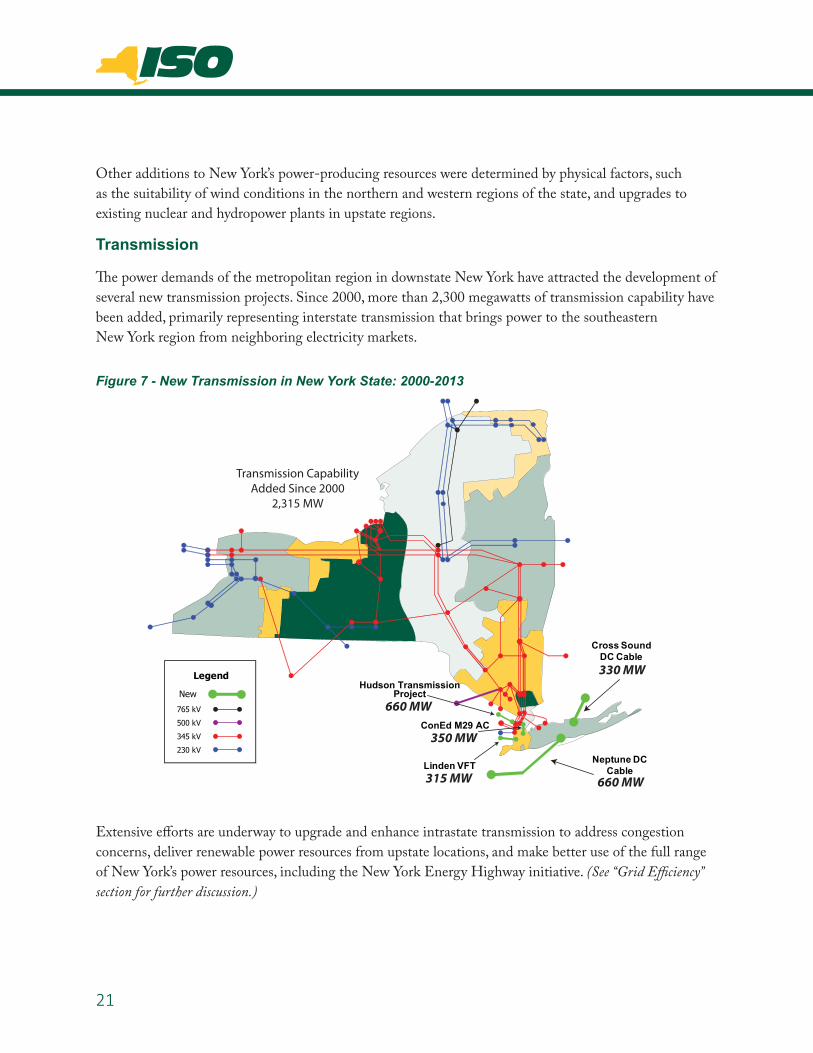
Other additions to New York’s power-producing resources were determined by physical factors, such as the suitability of wind conditions in the northern and western regions of the state, and upgrades to existing nuclear and hydropower plants in upstate regions.
Transmission
The power demands of the metropolitan region in downstate New York have attracted the development of several new transmission projects. Since 2000, more than 2,300 megawatts of transmission capability have been added, primarily representing interstate transmission that brings power to the southeastern New York region from neighboring electricity markets.
Figure 7 - New Transmission in New York State: 2000-2013
Extensive efforts are underway to upgrade and enhance intrastate transmission to address congestion concerns, deliver renewable power resources from upstate locations, and make better use of the full range of New York’s power resources, including the New York Energy Highway initiative. (See “Grid Efficiency” section for further discussion.)
Cross Sound DC Cable
Neptune DC Cable
Legend
New
345 kV
500 kV
230 kV
765 kV
Linden VFT
330 MW
315 MW 660 MW
ConEd M29 AC350 MW
Transmission CapabilityAdded Since 2000
2,315 MW
Hudson TransmissionProject
660 MW

Power Trends 2014: Evolution of the Grid22
A326
64 MW
B
B
C114 MW
E
D
F104 MW
G
H
I
J382 MW K
91 MW
9 MW
1,189 MW total
Special Case Resources (MW by NYISO Zone)
Summer 2014 Projected Capability
4 MW
25 MW
35 MW
35 MW
In March 2014, the New York Power Authority (NYPA) completed the Moses-Willis Circuit Separation project, recommended by the New York Energy Highway Blueprint. The project upgraded two 230-kilovolt power lines, which extend from NYPA’s St. Lawrence-Franklin D. Roosevelt Hydroelectric Power Plant to a substation in the Town of Chateaugay. Prior to the completion of the project, the transmission lines had shared the same tower structures, making them vulnerable to simultaneous failure in severe weather conditions and causing constraints on power delivery from that region that increased energy costs.22
Demand Response
Prior to the establishment of wholesale electricity markets, the electric system addressed growth in peak demand with comparable increases in generating capacity. Today, demand response resources can be used to shave the peak during periods of high demand. Large power customers and aggregated sets of smaller consumers participate in several demand response programs developed in the NYISO markets. The largest is the reliability-based Special Case Resource program. In 2013, the program involved more than 4,300 end-use locations providing over 1,175 megawatts of load reduction capacity.23 Participants in that program are expected to offer 1,189 megawatts of capacity in the summer of 2014.
Figure 8 - Demand Response Resources in New York State: Projected Capability of Special Case Resources Program - Summer 2014

23
Demand response capability had grown steadily since its inception in the early 2000s. While participation has moderated and declined as the programs have matured, these demand-side resources continue to play a significant role in grid operations during periods of peak demand. Two years ago, demand response resources were deployed on more days than in any previous year, with reliability-related programs activated on six separate days throughout the summer of 2012. During the heat wave of July 2013, demand response was deployed on all five days of the heat wave, with programs activated in downstate New York on the first three days and statewide on July 18-19, when a new all-time peak was recorded. On July 19, demand response programs helped to “shave” peak demand by nearly 1,000 megawatts.24
“Northeast RTOs (NYISO, PJM, ISO-NE) called upon their emergency demand response programs for a combined total of 13 days in 2013, more than in any of the last five years, underscoring the resource value of demand response during periods of tight supply conditions.” — FERC Office of Enforcement 2013 State of the Markets Report25
Looking ahead, the concept of demand response is evolving and expanding to include broader demand management capabilities. As increasingly sophisticated technology is deployed, the scope of consumer-controlled electricity demand is growing.
Similarly, the development of distributed energy resources that enable consumers to shift power supplies to on-site generation also offer to the ability to shave peak loads during periods of high demand.
The economics of demand-side resources are changing with the evolution of demand response programs in wholesale markets. FERC Order 745, which was approved in 2011, required that demand response be “compensated for the service it provides at the market price for energy.”26 In May 2014, the U.S. Court of Appeals for the District of Columbia invalidated the order as an infringement on state powers to regulate retail electricity sales.27 Pending final resolution of the matter by the courts and the FERC, the NYISO will continue to operate its demand response markets as prescribed by its tariffs.
Resource Adequacy
The NYISO’s most recent review of system reliability, the 2012 Comprehensive Reliability Plan, was published in March 2013. It concluded that certain proposed resource additions would meet resource adequacy requirements until 2019. A new reliability assessment by the NYISO is currently underway, examining the resource adequacy and transmission security components of system reliability. 28

Power Trends 2014: Evolution of the Grid24
For the summer of 2014, power resources available to serve New York State total 41,298 megawatts. These resources include the installed generating capacity of in-state power projects, projected levels of demand response participation, and power available for imports from neighboring electric systems. The total is 154 megawatts lower than last year, but it remains above the projected peak demand of 33,666 megawatts and in excess of reserve requirements.
Figure 9 - Statewide Resource Availability: Summer 2014
This estimate of total resources measures the maximum potential of resources. However, outages of generating and transmission facilities or lower-than-expected participation in demand response can reduce the availability of resources.
2014 power resources total 41,298 megawatts
More than 1,900 megawatts above reserve
requirements
30,000
31,000
32,000
33,000
34,000
35,000
36,000
37,000
38,000
39,000
40,000
41,000
42,000
1 2
Meg
awat
ts
Available Resources Required Resources
37,978 MW In-State Generation Resources
1,189 MW Demand Response Capability
2,130 MW Total Import Capability
33,666 MW Forecast Peak 2014
5,723 MW Installed Reserve Margin
New York State Resource Availability & Requirements: Summer 2014
39,389 MW
41,298 MW

25
The margin between available resources and reliability requirements has narrowed in recent years. In 2012, power resources totaled 43,686 megawatts, more than 5,000 megawatts greater than the 2012 reliability requirements (peak forecast plus installed reserve margin). In 2014, the 41,298 megawatts of available resources are slightly more than 1,900 megawatts above the reserve margin requirements.
The changes over the past two years are a consequence of declining resources and higher reserve requirements driven by increases in peak load. Available generating capacity dropped with power plant retirements. Demand response capacity also declined. The resources needed to meet reserve requirements increased as a result of higher peak demand forecasts and the larger installed reserve margin established by the New York State Reliability Council.
New York’s wholesale electricity markets are designed to achieve an economically efficient balance between supply and demand. When surplus generation is abundant, markets do not support new resources to enter the markets. As supplies grow scarcer, markets incent the development of new power resources.
Planning for Emerging Reliability Needs
The Comprehensive Reliability Plan is the product of the Comprehensive
RESERVE MARGIN
�A fundamental requirement of the reliable operation of an electric system is the availability of more supply than may be required by the highest anticipated level of demand for electricity. This reliability requirement is generally known as “reserve margin.”
� The not-for-profit New York State Reliability Council (NYSRC) develops and monitors compliance with reliability rules specifically established for New York State’s electric system. Those rules include an Installed Reserve Margin (IRM), established annually with approval from the Federal Energy Regulatory Commission (FERC) and the New York State Public Service Commission (PSC).
� The IRM represents the percentage of capacity (over 100% of capacity needed to serve forecasted peak load) required to be available for the bulk power system to operate reliably in the event that generators or transmission facilities are forced out of service.
� The IRM for the 2014/2015 Capability Year (May 1, 2014 through April 30, 2015) is 17 percent. Since the projected peak demand for electricity in New York State during 2014 is 33,666 megawatts, the IRM requires that New York’s electric system have 39,389 megawatts of capacity resources installed and available. (33,666 megawatts X 1.17 = 39,389 megawatts).

Power Trends 2014: Evolution of the Grid26
Reliability Planning Process conducted by the NYISO to provide an outline for meeting the reliability needs of the state’s bulk electricity grid over a 10-year planning horizon. The multi-phased process includes an assessment of reliability needs prior to the development of the reliability plan. To address those needs the NYISO requests solutions from all resources (generation, transmission, and demand response), with market-based solutions as the preferred means to meet future reliability needs and other regulated solutions available for implementation, if necessary. This approach seeks to keep the investment risk with private developers, rather than impose the cost of regulated solutions on rate-paying electricity consumers.
The NYISO monitors, evaluates, and reports on the viability and timeliness of all planned and proposed transmission system upgrades and submitted market-based solutions, and can trigger a gap solution to meet an imminent threat to reliability, or a regulated backstop solution, if necessary because market-based projects do not come to fruition, to ensure that system reliability is maintained. The impact of power plant retirements on the grid is also evaluated through a PSC requirement that generators provide advance notice of retirements. Working with the NYISO and the affected utility or power authority, the PSC assesses the impact of a proposed retirement and determines the steps needed to address potential reliability concerns.
Planning for the future of the electric system is also evolving. The NYISO and other electric system planning authorities are looking beyond traditional evaluations that focus on so-called “50/50” risk scenarios to include assessments that consider “90/10” scenarios that address less probable, but potentially higher-cost risks.
Planning for Public Policy Requirements
In 2011, FERC issued Order No. 1000 expanding upon previous orders related to transmission planning and cost allocation. The order is intended to reduce barriers to transmission system investment and provides important guidance in several key areas. Among its components, the order required that planning processes consider transmission needs driven by public policy requirements.
Transmission projects that fulfill such public policy requirements will be eligible for cost recovery through the NYISO’s tariff, if they are selected by the NYISO as the more efficient or cost-effective solution. The New York State PSC will identify the transmission needs that are driven by public policy requirements to be addressed in the NYISO planning studies. In March 2013, the PSC began a proceeding29 to establish the procedures that will identify transmission needs driven by public policy requirements and warrant referral to the NYISO. State and local approvals for siting, construction, and operation are still required for transmission projects. (See Interregional Collaboration section for discussion of FERC Order 1000 interregional planning provisions.)

27
Grid Efficiency
The southeastern region of New York State (Long Island, New York City, and the Lower Hudson Valley) accounts for approximately 65 percent of the state’s electricity demand. Yet only half of New York State’s generating capacity is located in the region. As a result, surplus generation from other regions of the state is transmitted to southeastern New York to meet demand.
Figure 10 - Regional Load and Capacity in New York State
While the NYISO system is designed to use the lowest cost power available to reliably serve demand, the physical limitations of the transmission system, such as thermal line ratings, may require higher-cost electricity resources to be used to serve areas affected by constraints at certain times, such as during periods of high electric demand. Physical transmission constraints limit the economically efficient dispatch of electricity and can cause “congestion” on the system that requires more local and more expensive generation to be operated to meet customers’ needs.
0
2,000
4,000
6,000
8,000
10,000
12,000
14,000
16,000
18,000
20,000
Upstate (Zones A-F)
Lower Hudson Valley (Zones G-I)
New York City (Zone J)
Long Island (Zone K)
Meg
awat
ts Load
Capacity
Electric Load = 2013 Peak Load Generating Capacity = 2014 Summer Generating Capability
Southeastern NY consumes nearly two-thirds of the
electricity in the state, but is capable of generating less than half the state’s power
Transmission constraints limit efficient dispatch of electricity
to Southeastern NY

Power Trends 2014: Evolution of the Grid28
Transmission Congestion
The NYISO addresses congestion as part of its planning processes with its Congestion Assessment and Resource Integration Study (CARIS). The study is an economic analysis of transmission congestion on the New York bulk power system and the potential costs and benefits of relieving transmission congestion. Solutions to congestion may include building or upgrading transmission lines and related facilities, building generation within constrained areas, or employing measures to reduce demand for electricity in the congested locales.
The most recent CARIS report, approved in November 2013, identified the most congested parts of the New York State bulk power system based upon historic data as well as estimates of future congestion. Those areas include all or parts of the high-voltage transmission path from Oneida County through the Capital Region and south to the Lower Hudson Valley. The CARIS process analyzed generic transmission, generation and demand response solutions in these regions that could ultimately yield savings for power consumers.30
Figure 11 - Transmission Congestion Corridors in New York State
Legend
345 kV
500 kV
230 kV
765 kV
Central East – New Scotland – Pleasant Valley
New Scotland – Pleasant Valley
Central East
SOURCE: 2013 Congestion Assessment and Resource Integration Study, New York Independent System Operator, Nov. 2013
29
The 2013 CARIS report projects lower levels of congestion than prior studies due to the extended operation of a Special Protection System (SPS) at a 1,080-megawatt power plant in the town of Athens, located 30 miles south of Albany. The SPS equipment was installed to allow bottled generation to be dispatched. In the future, this solution may be replaced by transmission additions or upgrades. Any evaluation of the economic benefits of proposed long-term transmission enhancements should take into account the short-term impact of the Athens SPS.
The NYISO’s federal tariff requires that New York system-wide production cost savings be the principal metric for the evaluation of the benefit-cost ratio for projects in the CARIS process. Under this tariff-prescribed process, a project’s expected benefits are compared to the cost of that project. The time-horizon over which project benefits are measured is limited to 10 years. As a result, the benefit-cost ratios presented in the 2013 CARIS report reflect some, but not all, of the potential benefits associated with transmission upgrades or other solutions to congestion.
Upgrading Transmission
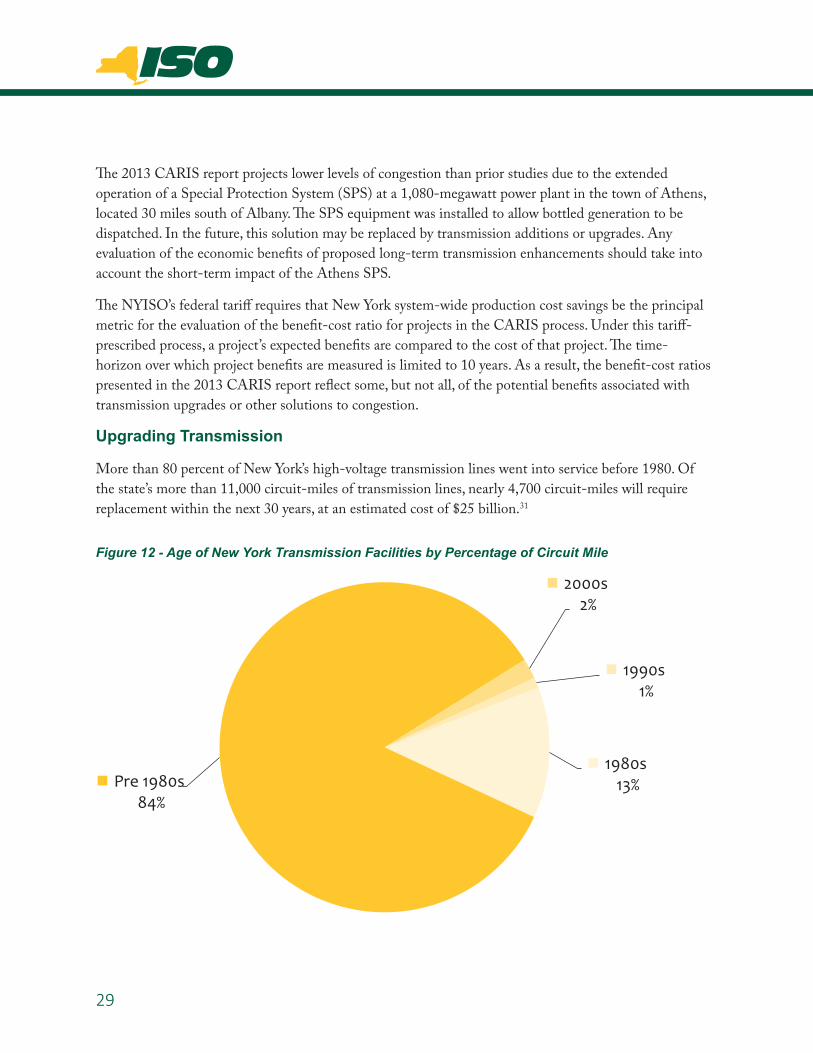
More than 80 percent of New York’s high-voltage transmission lines went into service before 1980. Of the state’s more than 11,000 circuit-miles of transmission lines, nearly 4,700 circuit-miles will require replacement within the next 30 years, at an estimated cost of $25 billion.31
Figure 12 - Age of New York Transmission Facilities by Percentage of Circuit Mile
2000s 2%
1990s 1%
1980s 13% Pre 1980s
84%
Power Trends 2014: Evolution of the Grid30
In 2012, the Energy Highway Blueprint recommended actions and policies for significant investments in New York State’s energy infrastructure. It called for 3,200 megawatts of new generation and transmission capacity funded by an investment of up to $5.7 billion in public and private funds.32
Transmission-related elements of the Blueprint focus on addressing the congested corridors identified by the CARIS and the State Transmission Assessment and Reliability Study (STARS) conducted by the owners of the interconnected electricity transmission facilities in New York State.33
The Blueprint estimated that cost-effective upgrades along congested corridors could provide 1,000 megawatts of additional transmission capacity between upstate and downstate New York. It also recommends “the upgrade of existing lines and the building of new lines following existing rights-of-way” and highlights the value of Alternating Current (AC) system developments, noting the AC system’s ability to allow “the interconnection of needed generation resources at multiple points on the system.” The New York State PSC initiated proceedings to expand AC transmission capacity and develop other resources consistent with the objectives of the Energy Highway Blueprint in 2012.34
Citing findings of the NYISO’s 2010 Growing Wind study,35 the Blueprint recommended upgrades to transmission serving northern New York to transport wind power produced in that region. As previously noted, NYPA has completed the Moses-Willis Circuit Separation project, which was among the upgrades recommended by the Blueprint. Such transmission upgrades can help to address fuel diversity concerns by facilitating the delivery of power produced by an array of upstate renewable power resources to the downstate New York region, where local generation runs predominantly on natural gas and fuel oil.
In 2013, the New York PSC initiated related proceedings to upgrade the transmission system and develop a “Reliability Contingency Plan” to address electric system operations in the event of the closure of the Indian Point Energy Center. (See “The Future of Nuclear Power” section for further discussion.)
In addition to transmission projects collectively named the Transmission Owner Transmission Solutions (TOTS), which were approved as part of the Indian Point contingency proceeding in November 2013, the New York PSC received proposals from four developers for AC transmission upgrades intended to ease upstate/downstate congestion. An expedited siting process, proposed by Governor Cuomo in the 2014 State of the State Address, is under development by the New York PSC. It is aimed at streamlining the process for the siting of transmission projects built on existing rights-of-way.

31
Resource Diversity
The array of fuels used to generate power affects both the reliability of the power system and the economics of electricity. A balanced mix of fuels helps the electric system address issues such as price volatility, fuel availability and the requirements of public policy.
Both market factors and policy considerations influence the mix of generation technologies and fuels used to produce power. Private investment is primarily driven by economic factors – the relative costs of fuel, operation and maintenance, as well as the initial costs of siting, permitting, and construction. For example, the current price advantage of natural gas is driving significant development of gas-fired generation.
New York and a number of other states have adopted renewable portfolio standards with the goal of having “green power” resources, such as solar and wind, provide a specified portion of generation. Policy goals and environmental regulatory requirements affect fuel mix through overall emission caps and targeted emissions standards, which require power plants burning fossil fuels to limit production and/or install pollution controls.
New York State has a relatively diverse mix of generation resources. At the regional level, however, the supply mix is less diverse. While a predominant portion of New York’s electric demand is situated downstate, much of the state’s power supplies (and particularly the sources that have historically had comparatively lower operating costs, such as hydroelectricity and nuclear power) are located upstate. A combination of stringent air quality regulations, transmission limitations, and reliability standards that require local generation in the downstate region has resulted in the power demands of New York City and Long Island being served with generation primarily fueled by natural gas. However, many of these units are also capable of using oil when necessary, which provides fuel diversity and reliability benefits to the system.
The mix of fuels used to generate electricity in New York has changed over the past decade and a half, with increases in generation fueled by natural gas and the emergence of wind-powered generation. The portion of New York State’s generating capacity from gas and dual fuel (gas and oil) facilities grew from 47 percent in 2000 to 55 percent in 2014. Wind power, virtually non-existent in 2000, has grown to 4 percent of New York State’s generating capability in 2014.
In contrast, the portion of New York’s generating capability from power plants using coal declined from 11 percent in 2000 to 4 percent in 2014. The segment of generating capability from power plants fueled solely by oil also dropped from 11 percent in 2000 to 7 percent in 2014. The shares of New York’s generating capability from nuclear power plants and hydroelectric facilities have remained relatively constant since 2000, with each accounting for approximately 15 percent of New York’s generating capability over the years.

Power Trends 2014: Evolution of the Grid32
Figure 13 - Generating Capability in New York State by Fuel Source – Statewide, New York City, and Long Island: 2014
Dual Fuel (Gas & Oil)
46%
Gas 9%
Oil 7%
Coal 4%
Nuclear 14%
Hydro 11%
Hydro Pumped Storage
4%
Wind 4%
Other Renewables
1%
Generating Capacity in New York State by Fuel Source - Statewide: 2014
SOURCE: 2014 Load and Capacity Report, New York Independent System Operator, April 2014 (Generating Capacity displayed is Summer Capacity.)
Gas 16%
Dual Fuel
(Gas & Oil) 79%
Oil 5%
Generating Capacity in New York State by Fuel Source - New York City: 2014
Dual Fuel (Gas & Oil)
68%
Gas 4%
Oil 25%
Renewables 3%
Generating Capacity in New York State by Fuel Source - Long Island: 2014

33
Electricity Prices and Fuel Costs
The average wholesale electric energy price in 2013 was $59.13 per megawatt-hour, a 30 percent increase from the 2012 record-low. (At $45.28 per megawatt-hour, the 2012 price marked the third straight decline in the average annual energy price.) The 2013 price remained below the 14-year annual average of approximately $65 per megawatt-hour.
Wholesale electricity prices are directly influenced by the cost of the fuels used by power plants to meet the demand for electricity. Power plants fueled primarily by natural gas account for more than half of the electric generating capacity in New York State. In 2013 and the winter of 2014, dramatic increases in the cost of natural gas produced spikes in power prices. During 2013, the average price for natural gas in New York experienced a 58 percent increase over the historically low prices of 2012.36
Figure 14 – Natural Gas Costs and Electric Energy Prices: 2000-2013
Generating capacity from natural gas and dual fuel (gas and oil)
power plants accounts for 55 percent of NY power
Projects using natural gas account for more than 70 percent
of all proposed generating capacity
$0.00
$2.00
$4.00
$6.00
$8.00
$10.00
$12.00
$10.00
$20.00
$30.00
$40.00
$50.00
$60.00
$70.00
$80.00
$90.00
$100.00
2000 2001 2002 2003 2004 2005 2006 2007 2008 2009 2010 2011 2012 2013
Avg. Annual Electric Energy Cost ($/MWh) Avg. Annual Natural Gas Cost ($/MMBtu) $/MWh $/MMBtu

Power Trends 2014: Evolution of the Grid34
In addition to reflecting the cost of fuels used to produce power, wholesale electricity prices also rise and fall with power demands. Lower demand for electricity allows a larger proportion of electricity to be generated by more efficient and less costly facilities, resulting in lower prices.
Figure 15 – Electricity Demand and Electric Energy Prices: 2000-2013
Gas-Electric Interaction and Fuel Assurance
The increased supply of natural gas is dramatically altering the energy landscape, including the electricity sector. The use of natural gas for electric generation in the U.S. increased 137 percent between 1997 and 2012, an average rate of increase of 6 percent annually. Due to an increase in natural gas prices in 2013 -- from the historically low gas prices of 2012 -- the nationwide share of electricity generated by natural gas in the U.S. fell slightly from 31 percent in 2012 to 28 percent in 2013. However, it remained well above the 22 percent share in 2007.37
In New York, electricity generated by natural gas grew from about 27,000 gigawatt-hours in 2004 to 53,000 gigawatt-hours in 2012, according to U.S. Energy Information Administration data. Moreover, natural gas has become the predominant fuel for new generation. The NYISO interconnection queue shows that projects using natural gas account for more than 70 percent of all proposed generating capacity.
$0.00
$20.00
$40.00
$60.00
$80.00
$100.00
$120.00
400
410
420
430
440
450
460
470
2000 2001 2002 2003 2004 2005 2006 2007 2008 2009 2010 2011 2012 2013
Avg. Daily Load (GWh) Avg. Electric Energy Cost ($/MWh)
GWh $/MWh

35
Figure 16 - Proposed Generation by Fuel Type: 2014
Nearly half of the generating capability of power plants in New York State is provided by dual fuel facilities capable of using either natural gas or oil. During periods of high usage, reliability rules require many of these plants to switch to burning oil. Outside of peak times, generators can choose to run on whichever fuel is less expensive. This operational flexibility provides both fuel diversity and reliability benefits.
The increasing dependence upon natural gas to produce power raises concerns regarding the potential impacts of gas availability on electric system reliability and power costs. Disruptions in natural gas supply and/or delivery can affect the ability of gas-fueled generation to provide power, which could impact electric system reliability. Likewise, power costs will be increasingly subject to volatility associated with natural gas prices. Consequently, the NYISO -- in collaboration with federal and state regulators, regional grid operators, and other stakeholders -- has launched several initiatives investigating these issues to avoid adverse consequences.
2,895 2,765
2,003
24 10 0
500
1,000
1,500
2,000
2,500
3,000
Natural Gas Dual Fuel Wind Biomass* Hydro
meg
awat
ts
*includes methane, wood and solid waste SOURCE: New York Independent System Operator Interconnection Study Queue, March 31, 2014

Power Trends 2014: Evolution of the Grid36
“This past winter has highlighted the critical and growing interdependence of natural gas pipelines and electricity markets.” — Cheryl LaFleur, Acting Chair, Federal Energy Regulatory Commission38
As previously noted, New York’s electricity demands reached a new winter peak on January 7, 2014 when extremely cold weather affected large parts of the nation.
System reliability was successfully sustained during the cold snaps despite record-breaking power demands. The NYISO met all reserve requirements throughout the winter operating period, despite unplanned generating capacity losses on some of the coldest days. Demand response resources were called upon and public appeals for customers to curtail or reduce non-essential electric power use were issued on January 7, the day of the record winter peak. The NYISO did not activate emergency operating procedures, such as voltage reductions, at any time during the winter operating period.
On several days during winter 2013-2014 the price of natural gas delivered to New York exceeded the price of oil. As a result, oil-fired generators, including dual-fuel generators running on oil, were more economic to dispatch than natural gas-fired generators.
Price spikes and operational challenges reflected the growing reliance of the electric system on natural gas. The energy demands created by the winter cold also stressed the natural gas system, its pipelines, storage facilities, and local distribution companies. Demand for natural gas reached record levels and gas prices rose commensurately. Nationwide, natural gas demand set a new daily record in January 2014.39
Natural gas is delivered to power plants and other customers through a network of pipelines. Power plants rely on instantaneous delivery of natural gas, as they have limited ability to store the fuel. Disruption to natural gas supplies can affect the ability of a given plant to produce power in the absence of the capability to use oil as an alternative fuel. Given that such circumstances could compromise electric system reliability, the value of dual fuel capability to electric system reliability is becoming increasingly apparent during winter and summer peak periods. The NYISO is evaluating the impact of fuel storage capability, fuel inventories at generation facilities, and fuel availability/delivery issues, as it moves to address these issues from market design, grid operations, and system planning perspectives.
The reliability rules for New York’s electric system include “minimum oil burn” requirements for summer peak electricity loads in New York City and Long Island. At certain load levels, dual fuel power plants are required to burn oil to guard against the possibility of a gas supply disruption causing electricity supply shortages. Moreover, in response to FERC rules adopted after a New England cold snap that threatened gas supply to key generators, the NYISO has implemented a communication protocol that designates critical generators in anticipation of a gas supply interruption.

37
In addition, power producers with natural gas-fueled generation have tended to procure much of their fuel supply using interruptible pipeline transportation services. Gas pipelines and local distribution companies give a higher priority to their residential, commercial, and industrial customers with firm gas supply and delivery contracts. Most power plants do not have firm gas supply and delivery contracts to meet their plants’ needs. This dynamic adds to the complexity of coordinating electric and gas system operations.
The NYISO established an Electric and Gas Coordination Working Group in January 2012 to address joint operational, planning and market design issues. The working group is engaged in extensive study and analysis of electric-gas issues. This includes research that assessed the cost of providing fuel assurance through dual-fuel capability and oil supply provisions, and compared the cost of dual-fuel capability to firm pipeline transportation under a range of scenarios.40
Beyond coordination of electric grid and gas pipeline operations, the opportunities to synchronize the electricity and gas industries may be found in evolving market designs that enable the marketplaces for both gas and electricity to better address their growing interrelationship.
Development of market designs that recognize the value of “fuel assurance” is intended to provide incentives for power producers to assure the availability of fuel supplies. Such market design changes allow developers and market participants to determine the most efficient ways to achieve that goal, whether through investment in dual-fuel facilities, gas transportation and storage infrastructure, new types of supply contracts, or other approaches. In March 2014, the Federal Energy Regulatory Commission (FERC) issued several orders to improve the coordination and scheduling of natural gas pipeline capacity with electricity markets. FERC proposed to revise the natural gas operating day and scheduling practices used by interstate pipelines to schedule natural gas transportation service. The regulatory agency also initiated review of the day-ahead scheduling practices of the regional transmission organizations and independent system operators as they relate to natural gas market schedules.41

Power Trends 2014: Evolution of the Grid38

39
Margins between available resources and reliability
requirements are positive, but narrowing
Surplus power totals 1,900 megawatts today, down
from more than 5,000 megawatts in 2012
The Future of the Grid
Sustaining and Enhancing Power Resources
New York’s generation fleet is changing. Nearly 60 percent of the generating capacity in New York State is at least 30 years old. Steam turbines fueled by natural gas and/or oil have an average age of more than 40 years, while combined cycle units fueled by natural gas have an average age of little more than a decade. Renewable power projects such as wind and solar units are among New York’s newest facilities. The average age of New York’s hydropower facilities is over 50 years, although the major hydropower projects owned and operated by the New York Power Authority have undergone life extension and modernization within the past decade.
As previously noted, over the past decade and a half, the addition of new generation, expansion of interstate transmission, and development of demand response programs have contributed to a surplus supply of power resources, relieving concerns about a potential “generation gap” affecting New York’s electric system in the early years of the 21st century.
However, the pattern of additions to resources has also been accompanied by reductions resulting from power plant retirements. Each year, new power plants are built and existing facilities are upgraded to expand generating capacity. At the same time, other power plants retire or suspend operation (so-called “mothballing”). Between 2001 and 2014, generating capacity increased by more than 10,000 megawatts, while power plant retirements totaled nearly 6,000 megawatts.42
Added generation primarily came from wind-powered and gas-fueled facilities, while significant portions of New York’s coal generation fleet planned to retire.

Power Trends 2014: Evolution of the Grid40
Figure 17 – Generation Additions and Retirements in New York State: 2001-2014
0 39 4 21
619
347 249
807
0
1,116
380 308
1,917
174
18
633 534
1,754
606
2,433
123
459
626
420
808
947
737
133
-
500
1,000
1,500
2,000
2,500
2001 2002 2003 2004 2005 2006 2007 2008 2009 2010 2011 2012 2013 2014
Meg
awat
ts
Retirements Additions NOTE: Annual data based on beginning of Summer Capability Period (May 1).
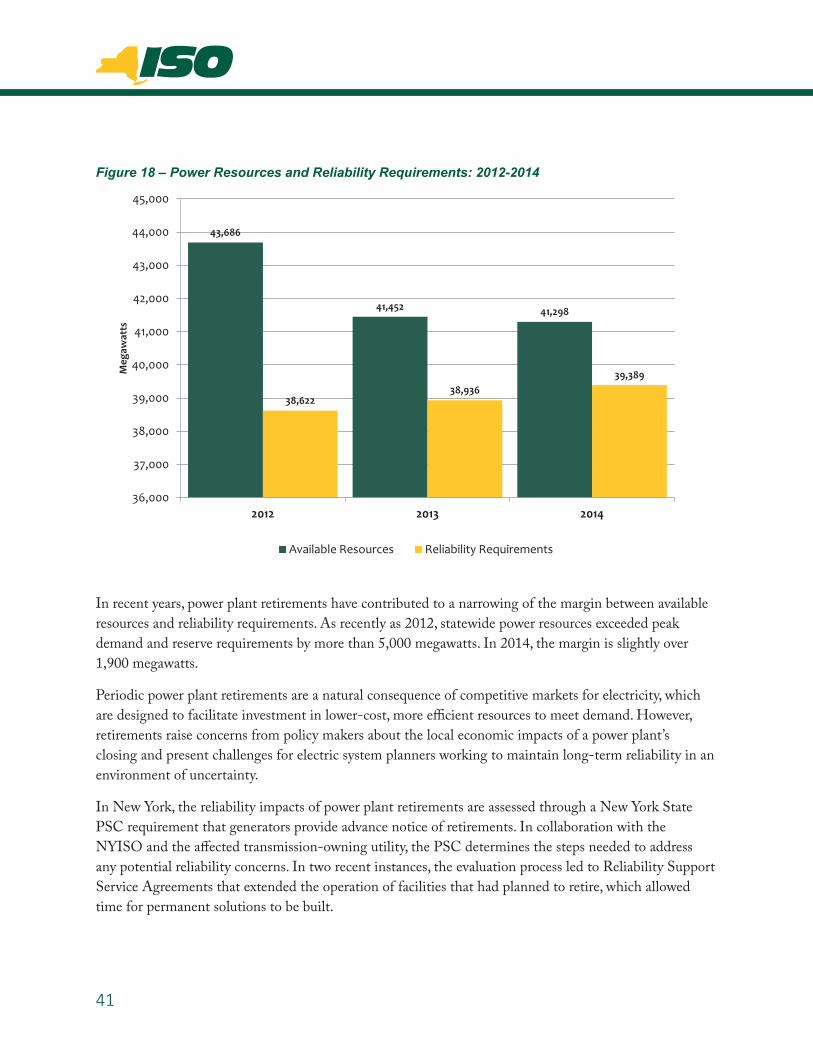
41
Figure 18 – Power Resources and Reliability Requirements: 2012-2014
In recent years, power plant retirements have contributed to a narrowing of the margin between available resources and reliability requirements. As recently as 2012, statewide power resources exceeded peak demand and reserve requirements by more than 5,000 megawatts. In 2014, the margin is slightly over 1,900 megawatts.
Periodic power plant retirements are a natural consequence of competitive markets for electricity, which are designed to facilitate investment in lower-cost, more efficient resources to meet demand. However, retirements raise concerns from policy makers about the local economic impacts of a power plant’s closing and present challenges for electric system planners working to maintain long-term reliability in an environment of uncertainty.
In New York, the reliability impacts of power plant retirements are assessed through a New York State PSC requirement that generators provide advance notice of retirements. In collaboration with the NYISO and the affected transmission-owning utility, the PSC determines the steps needed to address any potential reliability concerns. In two recent instances, the evaluation process led to Reliability Support Service Agreements that extended the operation of facilities that had planned to retire, which allowed time for permanent solutions to be built.
43,686
41,452 41,298
38,622 38,936
39,389
36,000
37,000
38,000
39,000
40,000
41,000
42,000
43,000
44,000
45,000
2012 2013 2014
Meg
awat
ts
Available Resources Reliability Requirements
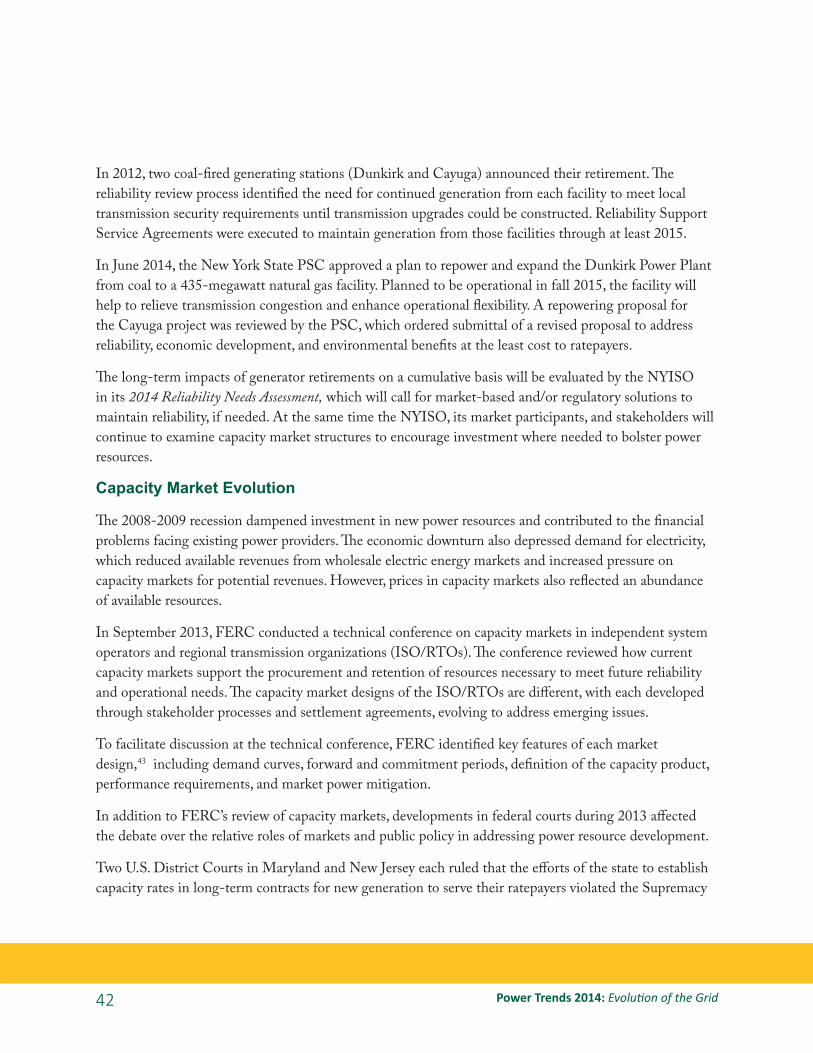
Power Trends 2014: Evolution of the Grid42
In 2012, two coal-fired generating stations (Dunkirk and Cayuga) announced their retirement. The reliability review process identified the need for continued generation from each facility to meet local transmission security requirements until transmission upgrades could be constructed. Reliability Support Service Agreements were executed to maintain generation from those facilities through at least 2015.
In June 2014, the New York State PSC approved a plan to repower and expand the Dunkirk Power Plant from coal to a 435-megawatt natural gas facility. Planned to be operational in fall 2015, the facility will help to relieve transmission congestion and enhance operational flexibility. A repowering proposal for the Cayuga project was reviewed by the PSC, which ordered submittal of a revised proposal to address reliability, economic development, and environmental benefits at the least cost to ratepayers.
The long-term impacts of generator retirements on a cumulative basis will be evaluated by the NYISO in its 2014 Reliability Needs Assessment, which will call for market-based and/or regulatory solutions to maintain reliability, if needed. At the same time the NYISO, its market participants, and stakeholders will continue to examine capacity market structures to encourage investment where needed to bolster power resources.
Capacity Market Evolution
The 2008-2009 recession dampened investment in new power resources and contributed to the financial problems facing existing power providers. The economic downturn also depressed demand for electricity, which reduced available revenues from wholesale electric energy markets and increased pressure on capacity markets for potential revenues. However, prices in capacity markets also reflected an abundance of available resources.
In September 2013, FERC conducted a technical conference on capacity markets in independent system operators and regional transmission organizations (ISO/RTOs). The conference reviewed how current capacity markets support the procurement and retention of resources necessary to meet future reliability and operational needs. The capacity market designs of the ISO/RTOs are different, with each developed through stakeholder processes and settlement agreements, evolving to address emerging issues.
To facilitate discussion at the technical conference, FERC identified key features of each market design,43 including demand curves, forward and commitment periods, definition of the capacity product, performance requirements, and market power mitigation.
In addition to FERC’s review of capacity markets, developments in federal courts during 2013 affected the debate over the relative roles of markets and public policy in addressing power resource development.
Two U.S. District Courts in Maryland and New Jersey each ruled that the efforts of the state to establish capacity rates in long-term contracts for new generation to serve their ratepayers violated the Supremacy

43
Clause of the U.S. Constitution. The courts agreed with plaintiffs in both cases that FERC’s creation of a capacity market within the PJM Interconnection preempted the state governments’ capacity contract rate determinations.44
In New York, the capacity market includes local capacity procurement requirements for specific regions. Previously, those requirements applied to three geographic areas or “zones,” New York City, Long Island, and the “Rest-of-State” (NYISO Zones A through I). In 2011, FERC ordered the NYISO to devise a process to create new capacity zones. The process, developed by NYISO stakeholders and approved by FERC, required a new capacity zone to be created if needed to address transmission constraints.
The NYISO’s independent Market Monitoring Unit, Potomac Economics, recommended creation of a new capacity zone. In its review of the NYISO’s 2012 Comprehensive Reliability Plan, the market monitor said, “…the Southeast New York (“SENY”) capacity zone will enable the NYISO to satisfy its resource adequacy criteria more efficiently over the next decade…” 45
As previously noted, many generation facilities in southeastern New York have retired or suspended operations. Transmission constraints and congestion hinder the economic supply of surplus power from resources in upstate regions to the high-demand areas of southeastern New York. Accordingly, a new zone was created to address the need for power resources to reliably serve southeastern New York covering the lower Hudson Valley and New York City (NYISO Zones G, H, I and J). NYISO developed the capacity zone through extensive and collaborative stakeholder deliberations, and FERC approved the zone in August 2013.
In January 2014, FERC partially approved the NYISO’s proposed Installed Capacity Demand Curve. That reset process defines the ICAP Demand Curves used in setting capacity spot market prices New York City, Long Island, the Lower Hudson Valley and the Rest of State for each of the next three years. The FERC Order approved NYISO’s proposal to establish demand curves using a type of gas turbine technology with significant fixed cost savings. However, requests by the NYISO and other parties to phase in the demand curve for the new zone, as a means to mitigate near-term consumer impacts, were denied. FERC concluded that “a phase-in would delay the capacity market’s ability to send more efficient price signals to attract and maintain sufficient capacity to meet local demand.”
Subsequent to the January Order, the NYISO and other parties asked FERC to reconsider and allow the proposed phase-in. In May, FERC ruled against the requested reconsideration and rehearing requests.46 The New York State Public Service Commission and other parties have petitioned the U.S. Court of Appeals to stay the new capacity zone, and to review FERC’s decisions approving the new capacity zone and the phase in. On June 4, 2014, the U.S. Court of Appeals denied the petitions to stay implementation of the capacity zone.
Power Trends 2014: Evolution of the Grid44
Across the competitive wholesale electricity market landscape, capacity markets are undergoing significant analysis and modification. Wholesale electricity markets that evolved with a single “energy market only” strategy are looking to capacity markets as a means to address emerging reliability needs. The NYISO will continue to work with stakeholders to further evolve its capacity markets to enhance predictability, responsiveness, and transparency, and encourage private investment in new resources and upgrades of existing resources to sustain reliability.
“The American electric system has been called one of the greatest machines ever invented. It is made up of vast and diverse assets owned by thousands of companies backed by countless investors, with their operations coordinated by grid operators with operational authority over the assets on those systems... Often we take for granted that investors will support the system that we want and need. But to sustain their interest, we need to make sure that the dollars and cents add up, as we hope for a system that evolves with the needs of the 21st century. Reforms in wholesale capacity markets should be part of the change.” — Susan F. Tierney, Ph.D.47
Distributed Energy Resources
The immediate aftermath of Superstorm Sandy, which struck New York in October 2012, included extended power outages in the New York metropolitan region. The devastation brought by the storm prompted extensive review of utility performance and a renewed focus on the resilience of the electric system.
While the storm produced power outages affecting more than 2 million utility customers in New York State, several hospitals, universities, and housing complexes employed distributed energy resources capable of operating independently of the electric grid, to keep power flowing to their facilities. New York University and New York-Presbyterian Hospital were among the institutions with combined heat and power installations that enabled them to keep the lights on in the wake of the storm.
Recognizing the potential of distributed energy resources to enhance the resilience of New York’s public infrastructure, Governor Cuomo launched a $40 million initiative aimed at developing community-based “microgrids,” independent electric distribution systems that provide power during extended outages due to future storms and disasters.48

45
“The increasing occurrence of devastating storms that result in widespread power outages highlights the critical need to ensure that our electric grid is made much more resilient. The introduction of system-wide, state-of-the-art distributed energy technologies will help safeguard the integrity of the electric transmission and distribution system, and it will help protect residential and business customers from outages.” — Audrey Zibelman, Chair, New York State Public Service Commission49
Beyond the value that distributed resources may provide to electric system resilience, their deployment will affect the electric system in a variety of complex ways.
In the traditional model of the centralized grid, electricity is said to flow “downhill” from large power plants to a wide array of customers. Today, the landscape for electricity is being leveled through the growth of distributed energy resources, such as customer-installed photovoltaic solar energy systems.
Net metering retail rate structures enable customers to provide power generated by their distributed energy system to their host utility in return for credits on their electric bill. In New York State, net metering was authorized by state law in 1997. Net metering is available on a first-come, first-served basis to customers of New York State’s major electric utilities, subject to technology, system size and aggregate capacity limitations. Technologies eligible to participate in the program include photovoltaics, wind, biomass, fuel cells, combined-heat-and-power/cogeneration, anaerobic waste digestion, small hydroelectric, and microturbines. The aggregate limit on net-metered generating capacity for each utility service territory is generally 3.0% of the utility’s 2005 peak electric demand.50
Customer-owned photovoltaic systems combined with expanding energy efficiency are expected to dampen demand for electricity from the grid. In 2013, the NYISO forecasted average annual growth rate in peak demand to be 0.96 percent over the next 10 years and projected overall electrical energy use to grow at an annual average of 0.47 percent. This year, the potential impact of energy efficiency programs and growth in customer-sited solar photovoltaic installations was among the factors that contributed to the NYISO’s lower forecasts for both annual peak growth (0.83 percent) and annual energy use (0.16 percent) over the next decade.
As the volume of wind-generated power grew, concerns were raised about the variable nature of its power output and the challenges such variability posed to the reliability of grid operations. The NYISO and other grid operators developed market designs and operational protocols that effectively integrated wind and other renewable resources. Similar evolution may be anticipated as distributed energy resources become a larger part of the electric system.
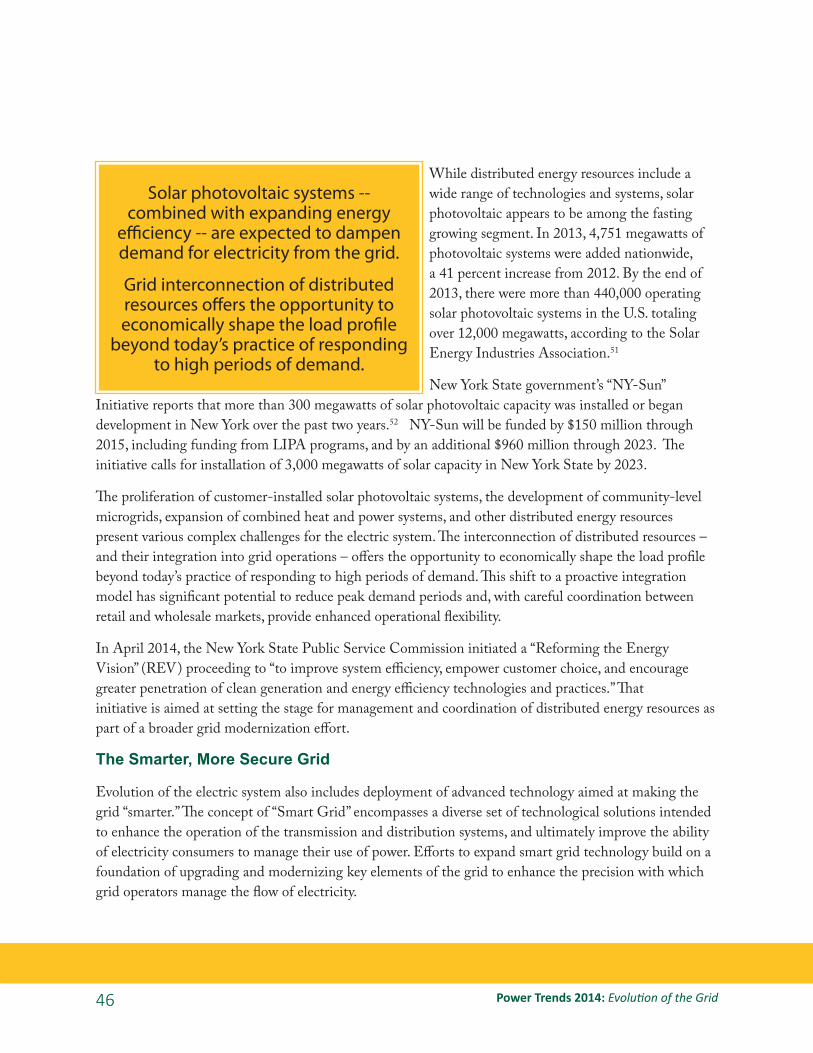
Power Trends 2014: Evolution of the Grid46
While distributed energy resources include a wide range of technologies and systems, solar photovoltaic appears to be among the fasting growing segment. In 2013, 4,751 megawatts of photovoltaic systems were added nationwide, a 41 percent increase from 2012. By the end of 2013, there were more than 440,000 operating solar photovoltaic systems in the U.S. totaling over 12,000 megawatts, according to the Solar Energy Industries Association.51
New York State government’s “NY-Sun” Initiative reports that more than 300 megawatts of solar photovoltaic capacity was installed or began development in New York over the past two years.52 NY-Sun will be funded by $150 million through 2015, including funding from LIPA programs, and by an additional $960 million through 2023. The initiative calls for installation of 3,000 megawatts of solar capacity in New York State by 2023.
The proliferation of customer-installed solar photovoltaic systems, the development of community-level microgrids, expansion of combined heat and power systems, and other distributed energy resources present various complex challenges for the electric system. The interconnection of distributed resources – and their integration into grid operations – offers the opportunity to economically shape the load profile beyond today’s practice of responding to high periods of demand. This shift to a proactive integration model has significant potential to reduce peak demand periods and, with careful coordination between retail and wholesale markets, provide enhanced operational flexibility.
In April 2014, the New York State Public Service Commission initiated a “Reforming the EnergyVision” (REV) proceeding to “to improve system efficiency, empower customer choice, and encouragegreater penetration of clean generation and energy efficiency technologies and practices.” Thatinitiative is aimed at setting the stage for management and coordination of distributed energy resources aspart of a broader grid modernization effort.
The Smarter, More Secure Grid
Evolution of the electric system also includes deployment of advanced technology aimed at making the grid “smarter.” The concept of “Smart Grid” encompasses a diverse set of technological solutions intended to enhance the operation of the transmission and distribution systems, and ultimately improve the ability of electricity consumers to manage their use of power. Efforts to expand smart grid technology build on a foundation of upgrading and modernizing key elements of the grid to enhance the precision with which grid operators manage the flow of electricity.
Solar photovoltaic systems -- combined with expanding energy
efficiency -- are expected to dampen demand for electricity from the grid.
Grid interconnection of distributed resources offers the opportunity to economically shape the load profile
beyond today’s practice of responding to high periods of demand.

47
Smart Grid Upgrades Enter Service
Under provisions of the American Reinvestment and Recovery Act of 2009, the U.S. Department of Energy (DOE) Smart Grid Investment Grant (SGIG) program provided funding to system operators, transmission companies, and utilities across the United States to install more than 800 networked phasor measurement units (PMUs) to help avoid major electric system disturbances like the 2003 blackout.
In New York, the NYISO and New York’s transmission-owning utilities and power authorities have completed power grid upgrades that are part of a statewide $75 million smart grid initiative, supported by $37.8 million in SGIG funds from DOE. The NYISO’s partners in the statewide smart grid initiative include: Consolidated Edison; National Grid; Orange and Rockland; Rochester Gas & Electric; Central Hudson Gas & Electric; New York State Electric & Gas; the New York Power Authority; and the Long Island Power Authority.
Figure 19 New York Smart Grid Project Partners.
Expanded deployment of smart grid technology such as phasor
measurement units is enhancing grid operators’ ability to detect
irregularities, predict problems, and take corrective action.

Power Trends 2014: Evolution of the Grid48
The project, completed in June 2013, deployed PMUs across the state to relay system electric conditions at a rate of 60 times per second—360 times faster than previously available. Connecting with networks in New England, the mid-Atlantic, and the Midwest will provide NYISO grid operators with broader situational awareness of grid conditions throughout the eastern United States. This regional interconnected PMU network will improve grid operators’ ability to more quickly detect irregularities, predict problems, and take corrective action to maintain reliability.
New York’s SGIG project also deployed new capacitor banks to improve the efficiency of the bulk transmission system by reducing the amount of electricity that is lost when carried over long distances.
New NYISO Power Control Center Commissioned
The smart grid project was conducted concurrently with the development of NYISO’s new state-of-the-art control center. The new facility replaces a power control center originally built in 1969 by NYISO’s predecessor, the New York Power Pool. The NYISO’s master infrastructure plans include upgrading the older facility to enable it to serve as a fully redundant, alternate control center.
The NYISO successfully transferred operational control of the New York Control Area to the new Control Center in December 2013. The new Control Center was constructed to provide a foundation for establishing a smarter, more reliable and resilient electric grid. Its state-of-the-art capabilities will assist to:
� Enhance situational awareness in system operations, employing greater volumes of data delivered faster than ever with the assistance of PMU network technology.
� Implement Broader Regional Markets initiatives involving an array of complex interactions with neighboring grid operators to enhance the use of power resources across system borders.
� Strengthen integration of renewable energy by expanding technical capabilities to meet the challenges posed by the variability of wind, solar and other renewable resources.
� Address the additional operational requirements of the expanded definition of the Bulk Electric System.
The Control Center’s video wall is the largest installation for the utility industry in North America. It displays more than 3,000 live status points representing line flows, line limits, transformer loading, voltages, generator output, and other electric system data.
Security: Cyber and Physical
Protecting the grid from threats, natural and man-made, has long been a key element of electric system reliability. As the systems that control and monitor the power grid become more technologically advanced and interconnected, the scope of cyber security concerns are expanding. Concurrently, heightened concern about terrorist threats to critical infrastructure, including the electric system, are also putting physical security issues in the national spotlight.

49
Mandatory federal reliability standards include Critical Infrastructure Protection (CIP) standards. Developed by the North American Electric Reliability Corporation (NERC) and approved by the Federal Energy Regulatory Commission (FERC), the standards cover both physical and cyber security. They address asset identification, security personnel and training, incident reporting, and response/recovery planning.
Congress is holding hearings on legislation aimed at protecting the nation’s critical infrastructure from cyber security threats but no consensus on a new law has been achieved to date. Identifying cyber security threats as “one of the most serious national security challenges we must confront,” President Barack Obama in February 2013 issued an Executive Order “to strengthen the cyber security of critical infrastructure by increasing information sharing and by jointly developing and implementing a framework of cybersecurity practices with our industry partners.”
Among its provisions, the Order directed the National Institute of Standards and Technology (NIST), which is part of the U.S. Department of Commerce, to develop a “Cybersecurity Framework” that includes a set of standards, methodologies, procedures, and processes aligning policy, business, and technological approaches to address cyber risks.
The Order created a voluntary partnership between owners and operators of critical infrastructure and the government to develop standards and enhance information sharing. The national ISO-RTO Council (IRC), of which the NYISO is a member, provided extensive information on electric industry cyber security standards and programs in response to a Request for Information issued by NIST. The Council recommends the NIST framework be built on the advanced security practices of the electric industry as a model for critical infrastructure industries nationally.
Mandatory CIP standards for owners and operators of the bulk electric system were developed by the North American Electric Reliability Corporation (NERC) and approved by FERC in 2008. Those standards undergo continuous updates as the nature and scope of threats change. The NYISO participated in the development of the standards and remains actively engaged in the updating process, collaborating with various government agencies, such as NIST, and other entities involved in maintaining rigorous cyber security protections.
Updated CIP standards use a new, tiered approach to identify and classify bulk electric system cyber assets according to their potential impact on electric system reliability. The plan includes requirements for electronic security perimeters, systems security management, incident reporting, response planning, recovery plans, configuration change management, and vulnerability assessments.
In March 2014, FERC directed NERC to develop standards to address potential physical security risks and vulnerabilities and NERC filed a proposed set of standards at the end of May.

Power Trends 2014: Evolution of the Grid50
Interregional Collaboration to Maximize Resources
Evolution of the grid is also being shaped by collaboration among the grid operators, market administrators and system planners of the interconnections serving North America. While interconnected, the power grids and wholesale electricity markets serving various regions of the United States and Canada were developed separately and reflect differences in geography, climate, reliability requirements, and available power resources. Where the regions interface, the differences create seams in the overall fabric of the grid that can lead to market inefficiencies and inhibit efficient coordination of grid operations. Mending those seams and strengthening interregional planning is enhancing the availability of resources for power systems and enabling more efficient use of collective power assets.
Removing barriers to the efficient flow of power between electric systems is a vital component of enhanced operational flexibility. The electric system has a long tradition of interconnected operations to bolster reliable operations across utility and regional boundaries, as well as mutual aid among utilities when recovering from major disasters. The changing dynamics of power resources will require increased operational flexibility to sustain reliability, as:
� renewable resources with variable output become an increasingly larger share of generating capacity
� distributed energy resources expand and require more sophisticated integration with the centralized grid; and,
� the need to enhance system resilience grows in the face of extreme weather conditions.
Expanded Interregional Planning
As previously noted, FERC issued Order No. 1000 in 2011 to reduce barriers to transmission system investment. Among its provisions, Order No. 1000 specifies that all transmission providers must have a regional transmission planning process in place that meets FERC’s previously established planning principles and includes reliability, economic and public policy planning.
Interregional collaboration is enhancing the availability of resources and enabling more efficient use of power assets
Broader Regional Market initiatives saved approximately
$5 million in 2013 and offer significantly increased savings in
the coming years

51
FERC directed all jurisdictional transmission providers, including ISOs and RTOs, to conduct planning on an interregional basis with their neighboring regions. In collaboration with its New England (ISO-NE) and Mid-Atlantic (PJM Interconnection) neighbors, the NYISO is building an expanded interregional planning process on the existing Northeast Coordinated Planning Protocol that has been in place for nearly 10 years. The expanded process includes a cost-allocation process for voluntarily sharing the expense of interregional projects that are contained in each region’s plan. The NYISO is also engaging in collaborative efforts with planning authorities across the entire Eastern Interconnection.
Nationwide debates about expansion of interstate transmission prompted creation of the Eastern Interconnection Planning Collaborative (EIPC) in early 2009. The Eastern Interconnection includes 40 states and several Canadian provinces from the Rocky Mountains to the Atlantic Ocean and from Canada south to the Gulf of Mexico. Prior to the creation of the EIPC, there was no single organization to conduct interconnection-wide planning analysis across the eastern portion of North America.
Consisting of 24 electric system planning authorities from the Eastern United States and Canada, the EIPC adopted a “bottom-up” approach, starting with a roll-up of the existing regional grid expansion plans. From 2010 through 2012, the EIPC (with the support of federal funding) identified and analyzed an array of resource expansion scenarios selected through a stakeholder process that includes representatives of various interest sectors across the entire interconnection. In addition to the EIPC, state governments formed the Eastern Interconnection States Planning Council (EISPC), which also was awarded federal funding to participate in the collaborative process.
The varied “energy futures” evaluated by the EIPC included a national renewable energy standard implemented on a regional basis, a nation-wide carbon emission reduction requirement implemented primarily via emission reductions in the electric utility sector, and a “business as usual” scenario reflecting current and expected environmental and renewable energy requirements. The analysis found that the reliability plans of electric system planners in the Eastern Interconnection integrate well to meet the reliability needs of interconnection. The EIPC provided detailed transmission analyses, production cost assessments, and high-level cost estimates for the resources and transmission facilities associated with each scenario to the U.S. Department of Energy in 2012.
The EIPC is currently studying the region’s natural gas infrastructure and its ability to support the growing use of natural gas for power production. Six participating planning authorities (NYISO, PJM, ISO-New England, the Midcontinent ISO, the Tennessee Valley Authority and Ontario’s Independent Electric System Operator) commissioned a multi-phased study of their ability to rely on gas-fuel power generation. In the study region, 41 percent of installed generating capacity can be fueled by natural gas.53
The Gas-Electric Interface Study work of the EIPC will provide comprehensive mapping of electric generation to gas pipeline, storage, and distribution infrastructure while assessing the gas-electric interfaces that may pose significant risk factors for electric system reliability in the study area.

Power Trends 2014: Evolution of the Grid52
Broader Regional Markets
The Broader Regional Markets initiative is an effort to enhance utilization of existing resources and reduce costs for power consumers. In addition to the NYISO, the regional initiative involves PJM Interconnection, ISO New England, Midcontinent ISO, Ontario’s Independent Electricity System Operator, and Hydro Québec.
The initiative is intended to reduce the need to use more expensive local power if less costly power is available from a neighboring grid operator and shorten the time commitment for moving power across control area borders, allowing faster responses to changing conditions.
The NYISO and PJM implemented a key component of the Broader Regional Markets initiative in early 2013, with the launch of Market-to-Market Congestion Relief Coordination enabling joint management of the transmission limits that occur near the borders of their control areas. Real-time coordination provides more efficient ways to manage transmission constraints that affect both markets. During 2013, the first year of implementation, the NYISO estimated the value of the market-to-market coordination with PJM at $4.7 million in savings.54
Reducing transaction scheduling from once every hour to once every 15 minutes lowers overall system operating costs, provides system operators with additional resource flexibility, and increases the efficiency of real-time markets. Another element of the Broader Regional Markets initiative, Enhanced Interregional Transaction Coordination, provides accelerated transaction scheduling. It was implemented by the NYISO with Hydro Québec in 2011 and with PJM in 2012.
Moving forward, the NYISO is focused on improving the 15-minute scheduling protocol with implementation of Coordinated Transaction Scheduling with both PJM and ISO-New England. Joint studies performed by the NYISO and PJM estimate potential annual production cost savings ranging from $9 million to $26 million.55 Annual production cost savings for the NYISO and ISO-New England have been estimated to range from $9 million to $11 million.56

53
Environmental Quality & Electric Reliability
Power Plant Emission Trends
Based on available emissions data from the U.S. Environmental Protection Agency, power plant emission rates generally continued to decline in New York State in 2013. Compared to 2012, the emission rates of nitrogen oxides (NOx) were down by 23 percent and carbon dioxide (CO2) declined by 5 percent. While the sulfur dioxide (SO2) emission rate increased by 4 percent in 2013, its emission rate reductions since 2000 remain the most significant of the three pollutants. From 2000 through 2013, the SO2 emissions rates dropped 94 percent. The emission rates for NOx and CO2 declined by 81 percent and 41 percent, respectively, during that period.
Figure 20 - Emission Rates from Electric Generation in New York State: 2000-2013
New York is part of the Regional Greenhouse Gas Initiative (RGGI), which is an agreement among nine eastern states designed to restrict carbon emissions from power plants. In 2013, the RGGI states agreed to set the cap at 91 million tons of emissions in 2014, declining by 2.5 percent per year through 2020. In
0
10
20
30
40
50
60
0
50
100
150
200
250
300
2000 2001 2002 2003 2004 2005 2006 2007 2008 2009 2010 2011 2012 2013
CO2
Mas
s (M
illio
n To
ns)
NO
X an
d SO
2 M
ass
(100
0 To
ns)
SO2 NOX CO2

Power Trends 2014: Evolution of the Grid54
addition to reducing the cap, the revisions are intended to sustain the CO2 reductions that have already occurred and yield an estimated 80-90 million tons of cumulative emission reductions by 2020. Compared to the original cap, annual emissions in 2020 are projected by RGGI to be approximately 14-20 million tons lower.57
Renewable Resources and Energy Efficiency
The energy policy goals of New York State include greater energy efficiency, reduced energy use and increased supply of electricity from renewable resources. The New York State PSC established a Renewable Portfolio Standard (RPS) in 2004, aimed at expanding the portion of renewable power consumed by New Yorkers to 25 percent. In 2009, the PSC increased the target to 30 percent of forecasted electricity consumption by 2015.
In 2008, the New York State PSC established an Energy Efficiency Portfolio Standard (EEPS) with a goal of reducing electricity use by 15 percent from forecasted levels by 2015, an approximately 26,900 gigawatt-hour reduction.
This goal equates to lowering statewide annual electricity consumption to a level below 157,000 gigawatt-hours by 2015. The NYISO’s current estimates of energy use in 2015, including the projected effects of state energy efficiency initiatives, range from 160,771 to 165,657 gigawatt-hours. EEPS program impacts from 2008 through 2013 also translate into about 1,400 MW of summer peak demand reductions. In 2013, the New York State PSC restructured the EEPS programs to reallocate uncommitted funds and to carry forward energy efficiency programs beyond 2015.
An estimated 47,100 gigawatt-hours of the electricity used by New Yorkers will need to be produced by renewable resources in 2015 to achieve the 30 percent renewable goal. In 2013, 32,226 gigawatt-hours of New York’s electricity was supplied by renewable resources, representing approximately 23 percent of New York’s electric generation. Under the NY-Sun Initiative, New York State will fund approximately $150 million annually for 2014 and 2015 for solar PV initiatives. The Customer-Sited Tier of the Renewable Portfolio Standard also includes funding for fuel cells, small wind, solar thermal and other renewable technologies.
Emissions from power plants have declined by double-digits
since 2000
Renewable resources supply approximately 23 percent of
NY electricity

55
The New York Green Bank is a $1 billion initiative proposed by Governor Cuomo to attract private sector financing for energy efficiency and clean energy projects. In 2013, the New York State PSC issued an order establishing the New York Green Bank as a division of the New York State Energy Research and Development Authority (NYSERDA). The PSC order provided initial capitalization in the amount of $165.6 million of uncommitted funds from existing clean energy surcharges on utility customers in New York State. Combined with $52.9 million in RGGI auction proceeds the Green Bank’s initial capitalization totals $218.5 million.58
Growth of renewable power resources is required to meet New York State’s clean energy goals. The wholesale electricity markets and open access to the grid provided by independent system operators, such as the NYISO, facilitate development of renewable resources. Open access enables any resource to interconnect to the grid and transmit power if it does not adversely affect system reliability.
The NYISO shared governance system, which guides market evolution, enables the full array of market participants and stakeholders to collaborate on market changes that address new technologies. In recent years, the design of New York’s wholesale electricity markets has been revised to address the unique characteristic of wind power by:
� Recognizing wind in 2006 as a “variable energy resource” and revising market rules to exempt it from undergeneration penalties that apply to conventional generation.
� Establishing a centralized wind forecasting system in 2008 to better utilize and accommodate wind energy by forecasting the availability and timing of wind-powered generation.
� Pioneering the economic dispatch of wind power in 2009 to fully balance the reliability requirements of the power system with the use of the least costly power available.
The variable nature of the power output from renewable resources also highlights the value of energy storage. In 2009, the NYISO became the first grid operator in the nation to establish market rules for a new category of energy storage resources, which provide frequency regulation service to balance supply and demand on the grid. Storage systems, such as flywheels and advanced batteries, can inject power in microseconds when needed.
While much of the solar power produced in New York is generated either off-grid or at the distribution level of interconnection, New York’s wholesale electricity markets have changed to integrate grid-scale solar. In 2012, provisions of NYISO market rules were adapted to address solar power as a variable energy resource.
As a result of these and other changes New York’s renewable resources, particularly wind power, continue to grow. The generating capacity of wind-powered projects in New York grew from 48 megawatts in 2005 to 1,730 megawatts in 2013. Electricity generated by wind power increased from 112 gigawatt-hours in 2004 to 3,541 gigawatt-hours in 2013.
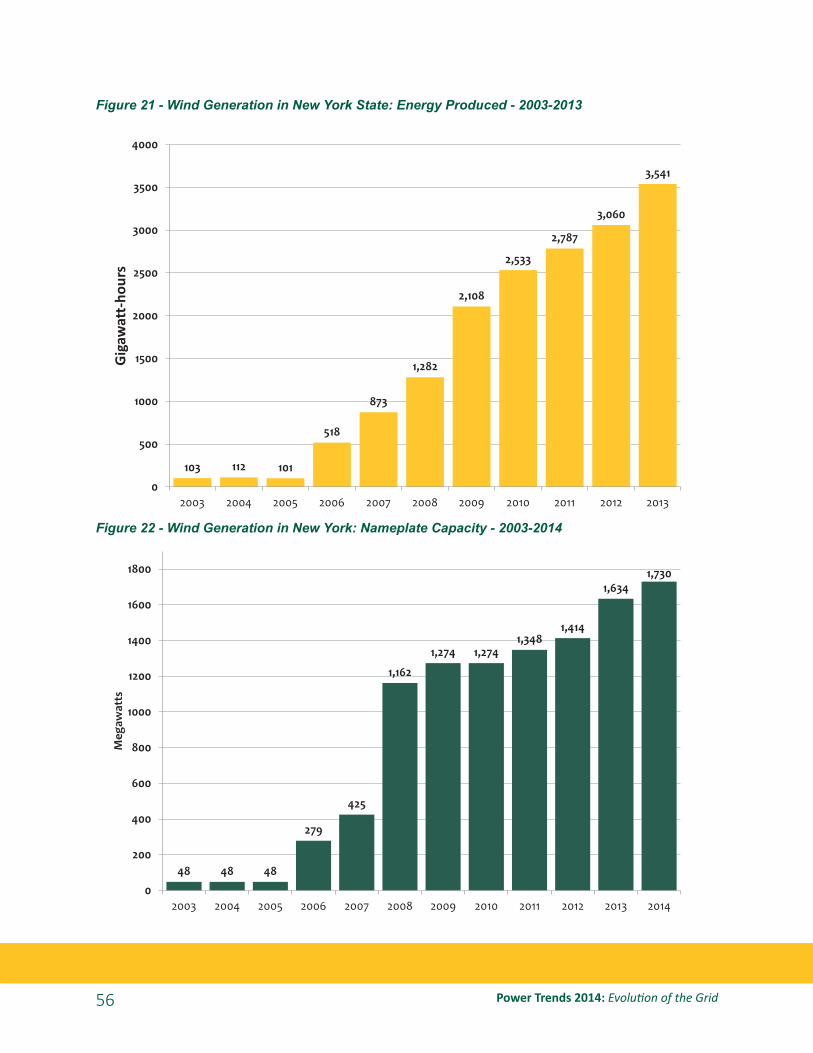
Power Trends 2014: Evolution of the Grid56
Figure 21 - Wind Generation in New York State: Energy Produced - 2003-2013
Figure 22 - Wind Generation in New York: Nameplate Capacity - 2003-2014
103 112 101
518
873
1,282
2,108
2,533
2,787
3,060
3,541
0
500
1000
1500
2000
2500
3000
3500
4000
2003 2004 2005 2006 2007 2008 2009 2010 2011 2012 2013
Gig
awat
t-ho
urs
48 48 48
279
425
1,162
1,274 1,274 1,348
1,414
1,634 1,730
0
200
400
600
800
1000
1200
1400
1600
1800
2003 2004 2005 2006 2007 2008 2009 2010 2011 2012 2013 2014
Meg
awat
ts

57
Figure 23 - Electric Energy Generated in New York State by Renewable Resources: 2000-2013
Wind also contributed to addressing power demand during recent peaks. While winds are often light during summer heat waves, more than 1,000 megawatts of wind power was generated on July 19, 2013, when the new all-time record peak demand was set. When a new record winter peak was set on January 7, 2014, wind supplied in excess of 1,000 megawatts. The variability of wind generation available during periods of peak consumption points to the importance of balancing wind and other renewable resources with sufficient peaking capability, demand response and other resources to instantaneously meet customer demand.
In addition, there are more than 2,000 megawatts of wind power proposed for future interconnection with the New York bulk electricity grid. Projects fueled by natural gas, dual-fuel (gas and oil) and wind projects represent nearly all the generating capacity proposed for grid-connection in New York State.
The Future of Nuclear Power
About one-fifth of the nation’s electricity is produced by the country’s 102 commercially operated nuclear power plants.59 In 2013, power from New York State’s six nuclear power projects supplied about one-third of the state’s electricity.60
0
5,000
10,000
15,000
20,000
25,000
30,000
35,000
2000 2001 2002 2003 2004 2005 2006 2007 2008 2009 2010 2011 2012 2013
Gig
awat
t-Hou
rs
Wind
Other
Hydro
*
*Includes Methane, Refuse, Solar & WoodSource: U.S. Energy Information Administration

Power Trends 2014: Evolution of the Grid58
However, increasing competition from lower-cost natural gas power plants, increased safety and security requirements, and the moderation of demand for electricity are negatively influencing the economics of nuclear power projects. Last year, the owners of several nuclear-powered generating projects announced plans to retire their facilities, including Dominion retiring its Kewaunee nuclear power station in Wisconsin approximately 20 years before the expiration of its operating license.61
In August 2013, the Entergy Corporation announced plans to close and decommission its Vermont Yankee Nuclear Power Station in southern Vermont. Among the reasons cited by the company for the closure decision were “a transformational shift” that has increased the supply and lowered the price of natural gas, leading to reduced wholesale electricity prices and the “financial impact of cumulative regulation” challenging single-plant nuclear units. Entergy also suggested that wholesale electricity markets “do not provide adequate compensation to merchant nuclear plants for the fuel diversity benefits they provide.” 62
As part of its comprehensive planning process, the NYISO identifies risk scenarios that could adversely affect reliability of the electric system. These risks include the unplanned retirement of large amounts of generation, such as a potential retirement of the Indian Point Energy Center, or the combined impact of environmental regulations on the continued operation of power plants in New York State.
The Indian Point Energy Center (IPEC), located in Westchester County, includes two nuclear power generating units capable of producing 2,060 megawatts. Entergy, which owns the units, has applied to the Nuclear Regulatory Commission for a 20-year renewal of the licenses. The federal operating license for Unit 2 of the Indian Point nuclear power project, originally scheduled to expire in September 2013, has been extended until the license renewal process is complete. The license for Unit 3 is scheduled to expire in December 2015. (Indian Point Unit 1 was shut down permanently in 1974.)
The State of New York is opposing the license renewals of Indian Point units 2 and 3 based on safety and environmental concerns.
To meet electric system reliability requirements, replacement resources have to be in place prior to a closure of the Indian Point Energy Center. Failure to do so would have serious reliability consequences.
In 2012, the New York State PSC asked Con Edison and the New York Power Authority to develop contingency plans so resources are in place by 2016 to address power supply needs in the event of Indian Point’s closure. In 2013, the New York State PSC approved plans that include three transmission projects capable of reducing capacity needs as well as a set of energy efficiency, demand response, and combined heat and power programs designed to reduce downstate electricity use.
59
The transmission projects, collectively named the Transmission Owner Transmission Solutions (TOTS), include Marcy-South Series Compensation and Fraser–Coopers Corners 345 kV line reconductoring; construction of a second Rock Tavern–Ramapo 345 kV line; reconfiguring substations to mitigate system contingencies; and enhanced cooling of underground transmission circuits from Staten Island to the rest of New York City.
The New York State PSC determined that the solutions “provide net benefits to customers even in the event IPEC continues operating beyond its current license term.” 63
Cumulative Impact of Environmental Regulations
New and proposed environmental regulations are estimated to affect more than 31,000 megawatts of generation, over 80 percent of New York State’s installed generating capacity. 64
Compliance costs associated with proposed state and federal environmental regulations – including control technology requirements for nitrogen oxides (NOx), mercury from coal plant emissions, interstate transportation of air emissions, and other emerging environmental standards – could result in unplanned plant retirements that may affect reliability.
Nationwide debate about the economic impact of the environmental regulations on power generation and electricity rates is expected to continue as the Obama administration moves forward with plans to curb carbon emissions from power plants. In early June 2014, the U.S. Environmental Protection Agency proposed a “Clean Power Plan” for regulating greenhouse gas emissions from existing power plants. It would require each state to submit a plan by 2016 to achieve a 30 percent emission reductions by 2030 (relative to 2005 emission levels).

Power Trends 2014: Evolution of the Grid60
Figure 24 –Summary of Environmental Regulations and Estimated Impact on New York Generation
Program Description Goal Status Compliance Deadline
Estimated Capacity
Affected (MW)
NOx RACT
Reasonably Available Control
Technology for Oxides of
Nitrogen
Limits emissions of nitrogen oxides (NOx)
from fossil-fueled power plants by establishing presumptive limits for
each type of fossil fueled generator and fuel used.
To reduce emissions from the affected generators
by 50%In effect July 2014 27,100
(221 units)
BART
Best Available Retrofit
Technology
Requires an analysis to determine the impact of certain affected unit’s
emissions. If the impacts are greater than a
prescribed minimum, then emission reductions must be made at the affected
unit.
To limit emissions that may impact visibility in
national parks. Emissions control of sulfur dioxide (SO2), nitrogen oxides (NOx) and particulate matter (PM) may be
necessary.
In effect January 2014 8,400 (15 Units)
MACT
Maximum Achievable
Control Technology
Establishes limits for Hazardous Air Pollutants (HAP). Will apply to coal and oil-fired generators.
To limit emissions, under the federal Clean Air Act,
of certain substances classified as hazardous air
pollutants.
In effect April 2015 10,300 (23 Units)
BTA
Best Technology Available
for Cooling Water Intake Structures
Would apply to power plants with design intake capacity greater than 20 million gallons/day and prescribes reductions in
fish mortality.
To establish performance goals for new and existing
cooling water intake structures, and the use of wet, closed-cycle cooling
systems.
In effect Upon Permit Renewal
16,400 (34 Units)
CSAPR
Cross State Air Pollution Rule
Limits Emissions of SO2 and NOx From Power Plants Greater Than 25 MW in 28 Eastern
States through the use of emission allowances with
limited trading.
Attain and maintain air quality consistent with
Nation Ambient Air Quality Standards.
Implementation is stayed while the rule is in
litigation. CAIR remains in
effect.
(See Status) 26,300 (160 Units)
RGGI Regional
Greenhouse Gas Initiative
Multi-state compact to limit CO2 emissions by power
plants.
The 2014 RGGI cap is 91 million tons of CO2, declining 2.5% annually
from 2015-2020.
In effect In effect 25,800 (154 Units)

61
Conclusion
Markets and Grid Evolution
The restructuring of the electric industry, called “one of the largest single industrial reorganizations in the history of the world,”65 continues to evolve.
In the 1990s, frustration with “perceived shortcomings of traditional cost-based regulation”66 contributed to the enactment of the Energy Policy Act of 1992 (EPAct92), which among other things removed the impediments to wholesale competition contained in the Public Utility Holding Company Act of 1935.
Under authority granted by EPAct 1992, the FERC issued Order 88867 in 1996 to restructure the electric industry by requiring that transmission lines be open to competition. The order also suggested formation of independent entities to manage the transmission facilities as a means to obtain such non-discriminatory treatment. FERC also called for the unbundling, or functional separation, of services for generation and transmission and distribution and ordered the power pools in the Northeast to open their membership to other entities.
In developing its “competitive opportunities” for the electric system, New York State specifically “adopted a flexible approach which has allowed policies to be guided and shaped by the successes and challenges experienced in this and other states, and by continuously evolving market conditions.”68
Placing the financial risk of power resource investments on investors and suppliers rather than on rate-paying customers was among the goals of electric industry restructuring. The Draft 2014 New York State Energy Plan notes the incentives provided by New York’s wholesale electricity markets “to locate generation, transmission and demand response resources where they are most needed” and cites the value of markets in “putting the risk of those investments on investors rather than on ratepayers.”69
While acknowledging the benefits of competitive electricity markets, the Draft 2014 New York State Energy Plan also states that markets do “not necessarily internalize all societal values. For example, it is likely that electricity prices do not currently reflect the full cost to society of related carbon [dioxide] emissions. The State still has a role to assure that societal goals are addressed in electricity and other energy markets.”

Power Trends 2014: Evolution of the Grid62
“Broadly speaking, competitive and transparent markets have been shown to work faster and better at delivering more product and more cheaply over time. But leaving all the outcomes to markets is unrealistic for a complex society based on consensus, so what we end up with in most of the world is a process rather than an outcome, a constant wrestling between the advantages of free markets and the shape-shifting nature of local, regional, national and international political considerations.” — Peter Gardett, Adjunct Fellow at the Center for a New American Security70

63
The following glossary offers definitions and explanations of terms and phrases used in Power Trends 2014 and others generally used in discussions of electric power systems and energy policy.
“50/50 and “90/10”: Load forecast scenarios used in transmission planning analyses to help account for increases in system peak demand that can occur in extreme weather. A 50/50 scenario means there is an equal probability of the actual peak load being higher or lower than the forecast value. A 90/10 scenario means there is a 90% chance the actual peak load will below the forecast and a 10% chance it will be above the forecast.
Adequate: A system is considered adequate if the probability of having sufficient transmission and generation resources to meet expected demand is greater than the minimum standard to avoid a blackout. A system has adequate resources under the standard if the probability of an involuntary loss of service is no greater than one occurrence in 10 years. This is known as the loss of load expectation (LOLE), which forms the basis of New York’s installed capacity (ICAP) requirement.
Behind the Meter Generation: A generation unit that supplies electric energy to an end user on-site without connecting to the bulk electric system or local electric distribution facilities. (An example is a rooftop solar photovoltaic system that only supplies electricity to the facility on which it is located.)
Broader Regional Markets (BRM): A set of coordinated changes to the regions bulk-electricity markets that will reduce the inefficiencies of moving power between markets. In addition to the NYISO, the regional initiative involves Ontario’s Independent Electricity System Operator, the Midwest Independent Transmission System Operator, PJM Interconnection, ISO New England, and Hydro Québec.
Bulk Electricity Grid: The transmission network via which electricity flows from suppliers to local distribution systems that serve customers. New York’s bulk electricity grid includes electricity generating plants, high voltage transmission lines, and interconnections with neighboring electric systems located in the New York Control Area (NYCA).
Capability Period: The Summer Capability Period lasts six months, from May 1 through October 31. The Winter Capability Period runs from November 1 through April 30 of the following year.
Capacitor Banks: These devices are used to improve the flow and the quality of the electrical supply and the efficient operation of the power system.
Comprehensive Reliability Plan (CRP): A study undertaken by the NYISO that evaluates projects offered to meet New York’s future electric power needs, as identified in the Reliability Needs Assessment (RNA). The CRP may trigger electric utilities to pursue regulated solutions to meet reliability needs if market-based solutions will not be available to supply needed resources. It is the second step in NYISO’s reliability planning process.
Glossary

Power Trends 2014: Evolution of the Grid64
Comprehensive System Planning Process (CSPP): The NYISO’s ongoing process that evaluates resource adequacy and transmission system security of the state’s bulk electricity grid over a 10-year period and evaluates solutions to meet those needs. The CSPP contains three major components -- local transmission planning, reliability planning, and economic planning. Each two-year planning cycle begins with the Local Transmission Plans of the New York transmission owners, followed by NYISO’s Reliability Needs Assessment and Comprehensive Reliability Plan. Finally, economic planning is conducted through the Congestion Assessment and Resource Integration Study.
Congestion: A situation where all available transmission lines between two locations are fully utilized. Congestion can be relieved by increasing transmission, generation or by reducing load.
Congestion Analysis and Resource Integration Study (CARIS): Part of the NYISO’s Comprehensive System Planning Process, CARIS evaluates the economic impact of proposed system changes. It consists of congestion studies developed with market participant input as well as additional studies that individual market participants may request and fund. The CARIS is based on the most recently approved CRP.
Day-Ahead Market (DAM): A NYISO-administered wholesale electricity market in which electricity, and ancillary services are auctioned and scheduled one day prior to use. The DAM sets prices based on a least-total cost methodology, based on generation and energy transaction bids offered in advance to the NYISO.
Day-Ahead Demand Response Program (DADRP): A NYISO demand response program to allow energy users to offer their load reductions into the day-ahead energy market. These resources are paid the same market clearing price per megawatt as generators.
Demand Response (DR) Programs: A series of programs designed by the NYISO to maintain the reliability of the bulk electricity grid by calling on electricity users to reduce consumption, usually in capacity shortage situations. The NYISO demand response programs include Day-Ahead Demand Response Program (DADRP), Demand Side Ancillary Services Program (DSASP), (Emergency Demand Response Program (EDRP), and Special Case Resources (SCR).
Demand Side Ancillary Services Program (DSASP): A NYISO demand response program to allow energy users to offer their load reductions into the ancillary services market to provide operating reserves and regulation service. These resources are paid the same ancillary service market clearing price as generators.
Distributed Generation: A small generator, typically 10 megawatts or smaller, attached to the distribution grid. Distributed generation can serve as a primary or backup energy source, and can use various technologies, including wind generators, combustion turbines, reciprocating engines, and fuel cells.
65
Distributed Energy Resource (DER): A broad category of resources that includes generation (See “Distributed Generation”), energy storage technologies, combined heat and power systems, and microgrids. DER is generally customer-sited and intended to serve the customer’s power needs.
Eastern Interconnection: The Eastern Interconnection is one of the three electric grid networks in North America. It includes electric systems serving most of the United States and Canada from the Rocky Mountains to the Atlantic coast. The other major interconnections are the Western Interconnection and the Texas Interconnection.
Emergency Demand Response Program (EDRP): A NYISO demand response program designed to reduce power usage through voluntary electricity consumption reduction by businesses and large power users. The companies are paid by the NYISO for reducing energy consumption upon NYISO request.
Energy Efficiency Portfolio Standard (EEPS): A proceeding initiated on May 16, 2007 by the New York State Public Service Commission (NYSPSC) to establish targets for energy efficiency, similar to the existing Renewable Portfolio Standard (RPS), and other programs intended to reverse the pattern of increasing energy use in New York. The NYSPSC determined that New York possesses sufficient potential energy efficiency resources to reduce electricity usage by 15 percent of projected levels by 2015.
Energy Highway Initiative: In the 2012 State of the State Address, New York Governor Andrew Cuomo proposed an “energy highway” to transport surplus power supplies in upstate New York and north of the border in Quebec to high-demand regions in downstate New York. The Energy Highway Task Force appointed by the Governor solicited proposals and produced an Energy Highway Blueprint that outlines plans for 3,200 MW of new generation and transmission funded by public/private investment of up to $5.7 billion.
Energy Independence and Security Act of 2007: A federal energy statute approved in December 2007. The stated purposes of the act are “to move the United States toward greater energy independence and security, to increase the production of clean renewable fuels, to protect consumers, to increase the efficiency of products, buildings, and vehicles, to promote research on and deploy greenhouse gas capture and storage options, and to improve the energy performance of the Federal Government, and other purposes.”
Energy Policy Act of 2005 (EPAct): An extensive energy statute approved in August 2005 that requires the adoption of mandatory electricity reliability standards and gave the Federal Energy Regulatory Commission (FERC) the authority to site major transmission lines under certain circumstances in National Interest Electric Transmission Corridors (NIETC) identified by the U.S. Department of Energy. The EPAct also made major changes to federal energy law concerning wholesale electricity markets, fuels, renewable resources, electricity reliability, and the energy infrastructure needs of the nation.

Power Trends 2014: Evolution of the Grid66
Federal Energy Regulatory Commission (FERC): The federal energy regulatory agency that approves the NYISO’s tariffs and regulates its operation of the bulk electricity grid, wholesale power markets, and planning and interconnection processes.
Gigawatt (GW): A unit of power equal to one billion watts.
Installed Capacity (ICAP): A qualifying generator or load facility that can supply and/or reduce demand as directed by the NYISO.
Installed Reserve Margin (IRM): The amount of installed electric generation capacity above 100 percent of the forecasted peak electricity consumption that is required to meet New York State Reliability Council (NYSRC) resource adequacy criteria.
Interconnection Queue: A queue of merchant transmission and generation projects that have submitted an Interconnection Request to the NYISO to be interconnected to the state’s bulk electricity grid. All projects must undergo three studies – a Feasibility Study (unless parties agree to forgo it), a System Reliability Impact Study (SRIS), and a Facilities Study – before interconnecting to the grid.
Load: A consumer of energy (an end-use device or customer) or the amount of energy (megawatt hour - MWh) or demand (megawatt - MW) consumed.
Locational Installed Capacity Requirement: A NYISO determination of that portion of the statewide installed capacity requirement that must be located electrically within a locality to provide that sufficient capacity is available there to meet the reliability standards. Locational Installed Capacity Requirements have been established for the New York City and Long Island capacity zones.
Loss of Load Expectation (LOLE): The amount of generation and demand-side resources needed (subject to the level of the availability of those resources, load uncertainty, available transmission system transfer capability and emergency operating procedures) to minimize the probability of an involuntary loss of firm electric load on the bulk electricity grid. The state’s bulk electricity grid is designed to meet LOLE that is not greater than one occurrence of an involuntary load disconnection in 10 years, expressed mathematically as 0.1 days per year.
Marcellus Shale: A black shale formation extending deep underground from Ohio and West Virginia northeast into Pennsylvania and southern New York. Geologists estimate that the entire Marcellus Shale formation may contain up to 489 trillion cubic feet of natural gas, although it is not yet known how much gas will be commercially recoverable from the Marcellus in New York.
Market-Based Solutions: Investor-proposed projects that are driven by market needs to meet future reliability requirements of the bulk electricity grid as outlined in the Reliability Needs Assessment. Those solutions can include generation, transmission and demand response programs. Market-based solutions are preferred by the NYISO’s planning process. The NYISO is responsible for evaluating all solutions to determine if they will meet the identified reliability needs in a timely manner.

67
Megawatt (MW): A measure of electricity that is the equivalent of 1 million watts. It is generally estimated that a megawatt provides enough electricity to supply the power needs of 800 to 1,000 homes.
New York Independent System Operator (NYISO): Formed in 1997 and commencing operations in 1999, the NYISO is a not-for-profit organization that manages New York’s bulk electricity grid, administers the state’s competitive wholesale electricity markets, provides system and resource planning for the state’s bulk power system, and works to advance the technology serving the power system. The organization is governed by an independent Board of Directors and a governance structure made up of committees with market participants and stakeholders as members.
New York Control Area (NYCA): The area under the electrical control of the NYISO. It includes the entire state of New York, divided into 11 load zones.
New York Power Pool (NYPP): Established July 21, 1966 in response to the Northeast Blackout of 1965, a voluntary collaboration of the state’s six investor-owned utilities plus New York’s two power authorities created to coordinate the operations of the New York State power grid. The NYISO assumed this responsibility in 1999.
Peak Demand: The maximum instantaneous power demand averaged over any designated interval of time and measured in megawatt hours (MWh). Peak demand, also known as peak load, is usually measured hourly.
Peaking: Description referring to power plants that generally run only when there is the highest consumption of, or peak demand for, electricity (See “Peak Demand.”)
Phasor Measurement Units (PMUs): These devices will provide near instantaneous measurement and observation of bulk power system phase angles at strategic locations across the system. PMUs are expected to increase the NYISO’s (and transmission owners’) interconnection-wide awareness of the system’s state and its vulnerabilities in real time.
Power NY Act: Energy legislation that encourages new investments in electric generating facilities across New York and creates the nation’s first statewide “on-bill” recovery program to increase energy efficiency for homeowners and businesses. Signed into law by Governor Andrew M. Cuomo on August 4, 2011.
Regional Greenhouse Gas Initiative (RGGI): The first market-based regulatory program in the United States to reduce greenhouse gas emissions. RGGI is a cooperative effort among the states of Connecticut, Delaware, Maine, Maryland, Massachusetts, New Hampshire, New York, Rhode Island, and Vermont.
Power Trends 2014: Evolution of the Grid68
Regulated Backstop Solutions: Proposals required of certain Transmission Owners to meet reliability needs as outlined in the Reliability Needs Assessment. Those solutions can include generation, transmission, or demand response. Non-Transmission Owner developers may also submit regulated solutions. The NYISO may call for a gap solution if neither market-based nor regulated backstop solutions meet reliability needs in a timely manner. To the extent possible, the gap solution should be temporary and strive to ensure that market-based solutions will not be economically harmed. The NYISO is responsible for evaluating all solutions to determine if they will meet identified reliability needs in a timely manner.
Reliability Needs Assessment (RNA): A report that evaluates resource adequacy and transmission system security over a 10-year planning horizon, and identifies future needs of the New York electricity grid. It is the first step in the NYISO’s reliability planning process.
Renewable Portfolio Standard (RPS): The New York State Public Service Commission (NYSPSC), in September 2004, issued its “Order Approving Renewable Portfolio Standard Policy” that calls for an increase in renewable energy used in New York State from the then current level of approximately 19 percent to 25 percent by the year 2013. In October 2008, the NYSPSC initiated a proceeding to increase the RPS goal to 30 percent and extend the target date to 2015.
Resource Adequacy: The ability of the electric system to supply aggregate electrical demand and energy requirements at all times, taking into account scheduled and unscheduled outages of system elements.
Special Case Resources (SCR): A NYISO demand response program designed to reduce power usage by businesses and large power users qualified to participate in the NYISO’s installed capacity (ICAP) market. Companies that sign up as SCRs are paid in advance for agreeing to cut power upon NYISO request during periods of system stress.
Transfer Capability: The amount of electricity that can flow on a transmission line at any given instant, respecting facility rating and reliability rules.
Transmission Constraints: Limitations on the ability of a transmission facility to transfer electricity during normal or emergency system conditions.
Transmission Security: The ability of the electric system to withstand disturbances such as electric short circuits or unanticipated loss of system elements.

69
1 Peak-to-average electricity demand ratio rising in New England and many other U.S. regions, Today in Energy, U.S. Energy Information Administration, February 18, 2014.2 Peak loads are measurements of the average total electric demand by consumers for a one-hour period. Peak demand usually occurs in the late afternoon or early evening in winter and summer. One megawatt of electricity is enough to power between 800 and 1,000 homes.3 2013 State of the Markets Report, Office of Enforcement, Federal Energy Regulatory Commission, March 20, 2014.4 Governor Cuomo Announces Broad Series of Innovative Protections; Vice President Biden Credits Governor Cuomo’s Storm Plan as A Model for Future Recovery Efforts, Press Release, Office of the Governor of New York State, January 7, 2014.5 Net capacity figures based on data for respective Summer Capability Periods (May 1- October 31).6 Resource adequacy is defined by the NYISO as “the ability of the electric system to supply the aggregate electrical demand and energy requirements at all times, taking into account scheduled and unscheduled outages of system elements.” Transmission security is defined as “the ability of the power system to withstand disturbances such as electric short circuits or the unanticipated loss of power system components without interruption of power delivery to the utility service areas.”7 Transco Z6 NY Average 2013 Spot Price was $5.05 per MMBtu, a 58% increase from 2012 (2013 State of the Markets Report, Office of Enforcement, Federal Energy Regulatory Commission, March 20, 2014.)8 Solar Market Insight: 2013 Year-in-Review, GTM Research and the Solar Energy Industries Association, March 2014.9 Case Number 14-M-0101, Proceeding on Motion of the Commission in Regard to Reforming the Energy Vision, New York State Public Service Commission (issued April 25, 2014).10 http://www.nyiso.com/public/webdocs/markets_operations/committees/mc/meeting_materials/2014-01-29/Operations_Report_201312.pdf 11 For more information about the Eastern Interconnection Planning Collaborative (EIPC) gas-electric study initiative, please visit the EIPC website (www.eipconline.com).12 Action Needed to Address Emerging Gaps in Federal Information Collection, General Accounting Office, June 30, 2003.13 Electric Energy Market Competition Task Force. Report to Congress on Competition in Wholesale and Retail Markets for Electric Energy, April 2007.14 United States of America Federal Energy Regulatory Commission 18 CFR Parts 35 and 385 [Docket Nos. RM95-8-000 and RM94-7-001] Promoting Wholesale Competition Through Open Access Non-discriminatory Transmission Services by Public Utilities; Recovery of Stranded Costs by Public Utilities and Transmitting Utilities Order No. 888 Final Rule (Issued April 24, 1996).15 Staff Report on the State of Competitive Energy Markets: Progress To Date and Future Opportunities, New York State Department of Public Service, March 2, 2006.16 Annual Energy Outlook 2013, U.S. Energy Information Administration, April 201317 Peak-to-average electricity demand ratio rising in New England and many other U.S. regions, Today in Energy, U.S. Energy Information Administration, February 18, 2014.18 Draft 2014 State Energy Plan: Volume 1, New York State Energy Planning Board, January 2014.19 The daily peak loads recorded in New York during the July 2013 heat wave were 32,703 MW (Monday, July 15), 32,361 MW (Tuesday, July 16), 33,254 MW (Wednesday, July 17), 33,450 MW (Thursday, July 18) and 33,956 MW (Friday, July 19). The previous record peak of 33,939 MW was set on August 2, 2006.20 2013 State of the Markets Report, Office of Enforcement, Federal Energy Regulatory Commission, March 20, 2014.21 Draft 2014 State Energy Plan: Volume 2 – Sources, New York State Energy Planning Board, January 2014.22 N.Y. Power Authority Announces Completion of Energy Highway Transmission Project to Harden the North Country Electric Grid, New York Power Authority News Release, March 3, 2014.23 NYISO 2013 Annual Report on Demand Response Programs, New York Independent System Operator, January 2014.24 NYISO 2013 Annual Report on Demand Response Programs, New York Independent System Operator, January 2014.
Endnotes

Power Trends 2014: Evolution of the Grid70
25 2013 State of the Markets Report, Office of Enforcement, Federal Energy Regulatory Commission, March 20, 2014.26 Demand Response Compensation in Organized Wholesale Energy Markets, Docket No. RM10-17-001, Order 745-A, Federal Energy Regulatory Commission, December 15, 2011.27 Electric Power Supply Association v. Federal Energy Regulatory Commission , U.S. Court of Appeals for the District of Columbia, May 23, 2014.28 Resource adequacy is defined by the NYISO as “the ability of the electric system to supply the aggregate electrical demand and energy requirements at all times, taking into account scheduled and unscheduled outages of system elements.” Transmission security is defined as “the ability of the power system to withstand disturbances such as electric short circuits or the unanticipated loss of power system components without interruption of power delivery to the utility service areas.”29 Case Number 14-E-0068, Proceeding on Motion of the Commission to Establish Policies and Procedures Regarding Transmission Planning for Public Policy Purposes, New York State Public Service Commission (issued March 27, 2014).30 2013 Congestion Assessment and Resource Integration Study (CARIS) Phase 1 Report, New York Independent System Operator, November 2013.31 New York’s State Transmission Assessment and Reliability Study Phase II Study Report, STARS Technical Working Group, March 30, 2012.32 New York Energy Highway Blueprint, New York Energy Highway Task Force, October 2012.33 New York’s State Transmission Assessment and Reliability Study Phase II Study Report, STARS Technical Working Group, March 30, 2012.34 Case 12-T-0502, Proceeding on Motion of the Commission to Examine Alternating Current Transmission Upgrades, New York State Public Service Commission (issued November 30, 2012).35 Growing Wind: Final Report of the NYISO 2010 Wind Generation Study, New York Independent System Operator, September 2010.36 Transco Z6 NY Average 2013 Spot Price was $5.05 per MMBtu, a 58% increase from 2012 (2013 State of the Markets Report, Office of Enforcement, Federal Energy Regulatory Commission, March 20, 2014.)37 Sustainable Energy in America Factbook, Bloomberg New Energy Finance, February 2014.38 FERC Proposes Reforms to Improve Gas-Electric Coordination, News Release, Federal Energy Regulatory Commission, March 20, 2014.39 2013 State of the Markets Report, Office of Enforcement, Federal Energy Regulatory Commission, March 20, 2014.40 Fuel Assurance & Pipeline Adequacy Study, Levitan and Associates, October 2013.
41 FERC Proposes Reforms to Improve Gas-Electric Coordination, Federal Energy Regulatory Commission News Release, March 20, 2014.
42 Net capacity figures based on data for respective Summer Capability Periods (May 1- October 31).
43 Centralized Capacity Market Design Elements, Federal Energy Regulatory Commission Staff Report AD13-7-000, August 23, 2013.
44 “Memorandum of Decision,” Case 1:12-cv-01286MJG, In the U.S. District Court for the District of Maryland, Sept. 30, 2013; “Memorandum,” Civil Action No. 11-745, In the U.S. District Court for the District of New Jersey, Oct. 11, 2013.
45 Market Monitoring Unit Review of the NYISO’s 2012 Comprehensive Reliability Plan, Potomac Economics, March 7, 2012.
46 Order on Rehearing, New York Independent System Operator, Inc., Docket No. ER13-1380-003, Issued May 27, 2014.
47 Comments of Dr. Susan Tierney, FERC Technical Conference on Capacity Markets – Docket No. AD13-7-000, September 9, 2013.
48 Governor Cuomo Announces Broad Series of Innovative Protections; Vice President Biden Credits Governor Cuomo’s Storm Plan as A Model for Future Recovery Efforts, Press Release, Office of the Governor of New York State, January 7, 2014.

71
49 NYISO to Host Distributed Energy Resource Workshop, News Release, New York Independent System Operator, November 20, 2013.
50 Database of State Incentives for Renewables and Efficiency (http://dsireusa.org/incentives/incentive.cfm?Incentive Code=NY05R&re=1&ee=1)
51 Solar Market Insight: 2013 Year-in-Review, GTM Research and the Solar Energy Industries Association, March 2014.
52 Governor Cuomo Announces $60 Million in NY-Sun Funding Available, News Release, Governor Andrew M. Cuomo, May 13, 2014.
53 Draft Gas-Electric System Interface Study: Existing Natural Gas-Electric System Interfaces, Levitan & Associations, February 21, 2014.
54 New York Independent System Operator, Inc., Docket ER08-1281-___; Broader Regional Markets Informational Report and Request to Modify the Reporting Obligation, March 19, 2014.
55 New York Independent System Operator, Inc., 146 FERC ¶ 61,097 at P 33 (2014).
56 New York Independent System Operator, Inc., 139 FERC ¶ 61,048 at P 29 (2012).
57 RGGI States Propose Lowering Regional CO2 Emissions Cap 45%, Implementing a more flexible cost-control mechanism, News Release, RGGI, Inc. February 7, 2013.
58 Case 13-M-0412, Order Establishing New York Green Bank And Providing Initial Capitalization, New York State Public Service Commission, December 19, 2013.
59 Restoring U.S. Leadership in Nuclear Energy, Center for Study of Strategic & International Studies, June 2013.
60 2014 Load and Capacity Report, New York Independent System Operator, April 2014.
61 Restoring U.S. Leadership in Nuclear Energy, Center for Study of Strategic & International Studies, June 2013.
62 Entergy to Close, Decommission Vermont Yankee, News Release, Entergy Corporation, August 27, 2013.
63 Indian Point Contingency Plans Move Forward, News Release, New York State Public Service Commission, October 17, 2013.
64 2012 Reliability Needs Assessment, New York Independent System Operator, September 2012.
65 Action Needed to Address Emerging Gaps in Federal Information Collection, General Accounting Office, June 30, 2003.
66 Electric Energy Market Competition Task Force. Report to Congress on Competition in Wholesale and Retail Markets for Electric Energy, April 2007.
67 United States of America Federal Energy Regulatory Commission 18 CFR Parts 35 and 385 [Docket Nos. RM95-8-000 and RM94-7-001] Promoting Wholesale Competition Through Open Access Non-discriminatory Transmission Services by Public Utilities; Recovery of Stranded Costs by Public Utilities and Transmitting Utilities Order No. 888 Final Rule (Issued April 24, 1996).
68 Staff Report on the State of Competitive Energy Markets: Progress To Date and Future Opportunities, New York State Department of Public Service, March 2, 2006.
69 Draft 2014 State Energy Plan: Volume 2 – Sources, New York State Energy Planning Board, January 2014.
70 The Delicate Politics of Incentive Alignment in Energy Markets, Breaking Energy, Peter Gardett, November 6, 2013.

Power Trends 2014: Evolution of the Grid72

NYISO at a Glance
The New York Independent System Operator (NYISO) is a not-for-profit corporation responsible for maintaining the safe, reliable flow of power throughout the Empire State.
The mission of the NYISO, in collaboration with its stakeholders, is to serve the public interest and provide benefit to consumers by:
� Maintaining and enhancing regional reliability � Operating open, fair, and competitive wholesale electricity markets � Planning the power system for the future � Providing factual information to policy makers, stakeholders and investors in the power system
The NYISO manages the efficient flow of power on more than 11,000 circuit-miles of electric transmission lines on a continuous basis, 24 hours-a-day, 365 days-a-year. As the administrator of the competitive wholesale markets, the NYISO conducts auctions that match the retail electric service companies looking to purchase power and the suppliers offering to sell it.
In addition the NYISO’s comprehensive planning process assesses New York’s electricity needs and evaluates the ability of proposed power options to meet those needs. This planning process involves stakeholders, regulators, public officials, consumer representatives, and energy experts who provide vital information and input from a variety of viewpoints.

Power Trends 2014: Evolution of the Grid
The NYISO is governed by a 10-member, independent Board of Directors and a committee structure comprising diverse stakeholder representatives. It is subject to the oversight of the Federal Energy Regulatory Commission (FERC) and regulated in certain aspects by the New York State Public Service Commission (NYSPSC). NYISO operations are also overseen by electric system reliability regulators, including the North American Electric Reliability Corporation (NERC), Northeast Power Coordinating Council (NPCC), and the New York State Reliability Council (NYSRC).
The members of the NYISO’s Board of Directors have backgrounds in electricity systems, finance, information technology, communications, and public service. The members of the Board, as well as all employees, have no business, financial, operating, or other direct relationship to any market participant.
The NYISO does not own power plants or transmission lines. The NYISO’s independence means that its actions and decisions are not based on profit motives, but on how best to enhance the reliability and efficiency of the power system, and safeguard the transparency and fairness of the markets.
The NYISO is committed to transparency and trust in how it carries out its duties, in the information it provides, and in its role as the impartial broker of the state’s wholesale electricity markets. Power Trends is the NYISO’s annual analysis of factors influencing New York State’s power grid and wholesale electricity markets. Begun in 2001 as Power Alert, the report provides a yearly review of key developments and emerging issues.

New York Independent System Operator10 Krey BoulevardRensselaer, NY 12144
www.nyiso.com