power with purpose 2016 annual report 2016 minnkota annual report ... s the electric utility...
TRANSCRIPT
Power with purpose 2016 ANNUAL REPORT

2 2016 Minnkota Annual Report
Cooperative Profile
Basin Electric Power Cooperative Bismarck, North Dakota Central Iowa Power Cooperative Cedar Rapids, Iowa Dairyland Power Cooperative LaCrosse, Wisconsin Interstate Power Company Dubuque, Iowa Lincoln Electric System Lincoln, Nebraska Manitoba Hydro Winnipeg, Manitoba, Canada MidAmerican Energy Davenport, Iowa Midcontinent Independent
Transmission System Operator (MISO)Carmel, Indiana
Minnesota Power Duluth, Minnesota Montana-Dakota Utilities Company Bismarck, North Dakota
Class B, C and D Members
Nebraska Public Power District Columbus, Nebraska Northern Municipal Power Agency Thief River Falls, Minnesota NorthWestern Corporation Sioux Falls, South Dakota Omaha Public Power District Omaha, Nebraska Otter Tail Power Company Fergus Falls, Minnesota U.S. Department of the Air Force Grand Forks Air Force Base, North Dakota Western Area Power Administration Billings, Montana Wisconsin Power and Light Madison, Wisconsin Xcel Energy Minneapolis, Minnesota
1. Beltrami Electric Cooperative, Inc.Bemidji, Minnesota
2. Cass County Electric Cooperative, Inc.Fargo, North Dakota
3. Cavalier Rural Electric Cooperative, Inc.Langdon, North Dakota
4. Clearwater-Polk Electric Cooperative, Inc.Bagley, Minnesota
5. Nodak Electric Cooperative, Inc.Grand Forks, North Dakota
6. North Star Electric Cooperative, Inc.Baudette, Minnesota
7. PKM Electric Cooperative, Inc.Warren, Minnesota
8. Red Lake Electric Cooperative, Inc.Red Lake Falls, Minnesota
9. Red River Valley CooperativePower AssociationHalstad, Minnesota
10. Roseau Electric Cooperative, Inc.Roseau, Minnesota
11. Wild Rice Electric Cooperative, Inc.Mahnomen, Minnesota
Class A Members
Cooperative ProfileCooperative ProfileOn the cover
A line worker installs blink outage mitigation equipment on a 69-kilovolt transmission line structure near Hallock, Minn.
Insets (left to right): Paul Koedam, maintenance supervisor, inspects the high pressure-intermediate pressure turbine blades during a major scheduled outage on Unit 2 of the Milton R. Young Station.
A circuit breaker is set in place at the Veterans substation in West Fargo, N.D.
One of the turbines at the new Oliver III wind farm stands tall over the prairie near Center, N.D.
Minnkota Power Cooperative is a generation and transmission (G&T) cooperative headquartered in Grand Forks, N.D. Through 11 member-owner distribution cooperatives, three in eastern North Dakota and eight in northwestern Minnesota, Minnkota provides valuable electric energy to nearly 135,000 residential, commercial and industrial consumers.
The primary source of generation is the Milton R. Young Station, which consists of two lignite coal-based generators located 35 miles northwest of Bismarck, N.D. Minnkota’s energy portfolio also includes signifi cant wind energy resources from North Dakota facilities located near the towns of Langdon, Valley City and Center. Additional hydropower is obtained from the Garrison Dam in central North Dakota.
Minnkota also serves as operating agent for the Northern Municipal Power Agency (NMPA), headquartered in Thief River Falls, Minn. NMPA is an association of 12 municipal utilities located in the same 35,000-square-mile service area as the Minnkota member cooperatives. NMPA owns a 30 percent share of the Coyote Station, a lignite-based power plant located near Beulah, N.D. Together, the Minnkota/NMPA Joint System serves approximately 150,000 consumer accounts.

Contents
2016 Minnkota Annual Report 3
Generating Plant Performance Young 1 Young 2 Coyote
Gross generation – MWh 2,111,702 2,707,174 2,587,585 Net generation – MWh 1,893,593 2,467,189 2,440,646 Station service – MWh 218,109 239,985 146,939 Hours on line 8,376 6,047 6,689 Hours off line 408 2,737 2,095 Availability – percent 95.4 68.8 76.2 Average net generation – MWh 226 408 365 Coal burned – tons 1,683,786 2,160,413 2,011,974 Fuel oil burned – gallons 131,750 581,237 777,659
Net Generation
MWh 2012 1,902,7332013 1,699,4512014 1,799,4792015 1,568,4652016 1,893,593
MWh 2012 3,260,9412013 2,509,2442014 2,758,5132015 3,333,8982016 2,467,189
MWh 2012 2,289,1912013 2,641,2602014 2,736,5092015 1,916,6522016 2,440,646
Young 1 Young 2 Coyote
2012 3,542,7582013 3,873,6332014 4,033,5212015 3,845,7332016 3,813,970
Energy SalesClass A Members
(MWh)
2012 68.30 2013 67.06 2014 67.682015 71.852016 74.56
Average Wholesale Power Rate(mills/kWh)
Joint System Energy Requirements
Thousands
Where it came from of MWh Percent
Young 1 1,894 28.1 Young 2 1,925 28.5 Coyote 749 11.1 WAPA – Firm 527 7.8 Wind – Ashtabula 737 10.9 Wind – Langdon 531 7.9 Wind – Oliver III 5 0.1 Wind – Infi nity 5 0.1 MISO 367 5.4 Other 11 0.1 TOTALS 6,751 100.0
ThousandsWhere it went of MWh Percent
Member Cooperatives 3,814 56.5 Municipal Participants 448 6.6 Off-system Sales 2,212 32.8 Other 86 1.3 Losses 191 2.8 TOTALS 6,751 100.0
20162015201420132012 2016201520142013201220162015201420132012
20162015201420132012 20162015201420132012
2 Class A, B, C and D Members 4 Report to the Members 6 Board of Directors and Offi cers 7 Executive Staff and Senior Management 8 2016 Year in Review 18 Treasurer’s Report 20 Financial Statements 26 Notes to Financial Statements 30 Independent Auditor’s Report 31 Operating Statistics 32 Associated Cooperative Boards and Management 34 Associated Cooperative Statistics

The success of our organization in these uncertain times depends on a vibrant, strong and unified membership. With their support, we are able to preserve our past, defend our current operations and adapt to the aggressive change that is shaping our future.
Collin JensenChairman of the Board
Mac McLennanPresident & CEO
As the electric utility industry continues to evolve and expand in complexity, Minnkota Power Cooperative is guided by a clear and constant purpose – our
members. The success of our organization in these uncertain times depends on a vibrant, strong and unifi ed membership. With their support, we are able to preserve our past, defend our current operations and adapt to the aggressive change that is shaping our future.
We recognize that there is no pause button in our world and that we must press forward to meet the needs of the membership. But before we can know where we need to be as a cooperative, we must fi rst understand where we’ve been. Over the past 76 years, we have built a system that has strengthened our local communities and helped homes, farms, schools and businesses fl ourish. We remain committed to making prudent investments in these generation and transmission assets that have served the members for decades. During the year, an extended outage was completed on Unit 2 of the Milton R. Young Station, our primary generation facility, to conduct boiler
Report to the Members
4 2016 Minnkota Annual Report
2016 Minnkota Annual Report 5
Collin Jensen Mac McLennan
maintenance and other various projects that help support the plant’s overall reliability. On the transmission side, we began an accelerated effort to address blink outages on our legacy 69-kilovolt (kV) lines, many of which have been in service for more than 50 years. These resources remain the backbone of Minnkota’s system and we aim to ensure they are dependable and effi cient for the next generation of consumers.
While completing this important work, our employees accomplished one of their best years of safety in Minnkota history. Our Grand Forks-based employees reached one million work hours and counting with no lost-time incidents – an achievement that required more than two years of safe work. Our employees based at the Young Station have also performed well, recording only two relatively minor incidents during 2016. Industry-based statistics and metrics show that we are performing equal to or better than our peers in all areas of safety. The full credit for the success of our safety program goes to the employees. They arrive each day with the mentality that working safely is valued above all other job functions – as it should be.
While we are proud of our current operations, we know we cannot rest and be content with the status quo. Our business receives pressure from outside infl uences such as adverse regulation, changing market conditions, fl uctu-ating commodity prices and security threats. We dedicated signifi cant time and resources in 2016 to addressing the Environmental Protection Agency’s Clean Power Plan – one of the most far-reaching regulatory efforts in the history of the utility industry. The potential impacts of regulating carbon dioxide in this manner are so severe that we initi-ated numerous legal and technical strategies to address the rule. At year-end, the Clean Power Plan was under a U.S. Supreme Court stay, which halts implementation until litigation concludes.
Bolstering the programs and systems that protect our employees, infrastructure and data is a continuous process. During the year, the North American Electric Reliability Corporation (NERC), our nation’s grid watchdog, completed an audit of our cybersecurity system fi nding no violations. While this is clearly a positive sign that we are doing our part to protect the grid, we only view the NERC standards as a platform upon which to enhance our secu-rity efforts. We continue to explore proactive solutions that safeguard our assets – from our generation facilities to the distribution substations that serve our members.
As the world continues to change around us, we will not become stagnant. We must adapt or risk being left behind. At Minnkota, we strive to foster a workplace where technology and innovation are not just industry buzzwords, but a critical part of how we do business. We set our sights high in 2016 by beginning the evaluation of a postcombus-tion carbon capture project at the Young Station. Known as Project Tundra, the venture is still in the early feasibility stages, but it shows promise as a real-world solution to operating in a carbon-managed world. Building partnerships and working with elected offi cials to prioritize funding for advanced energy technologies will remain a key initiative in 2017 and beyond.
In addition to lignite coal, wind is an increasingly important resource in our power supply portfolio. In 2016, we reached an agreement with NextEra Energy Resources to purchase energy from a 100-megawatt (MW) addition to the Oliver Wind Energy Center. Known as the Oliver III wind farm, the project brings Minnkota’s wind resource capacity to 459 MW. We also started a dialogue with NextEra on the opportunity to repower the existing Langdon and Ashtabula wind farms – a process that includes adding longer blades and replacing or refurbishing the nacelles. If completed, these projects would extend the life of some of North Da-kota’s early commercial-scale wind farms and ensure they are long-term, cost-effective resources for the membership.
Aggressive industry change was also a driving factor in the decision to build a new corporate campus in Grand Forks. A full year of construction has been completed and the complex is currently scheduled to be operational in the fourth quarter of 2017. This will be the fi rst new headquar-ters facility for Minnkota since the 1940s. The complex will give us greatly improved security, better workplace effi ciency and much-needed room to store and manage our vehicles and large equipment.
Looking back on 2016, we reached several milestones and created new opportunities to improve our operations. We know we have challenges in front of us, but we haven’t endured for nearly eight decades without facing adversity. We will remain a strong and stable cooperative as long as we stay true to our purpose.

Collin JensenChairmanRoseauElectric Cooperative
Russell OkesonVice ChairmanWild RiceElectric Cooperative
Jeffrey FollandSecretary/TreasurerPKMElectric Cooperative
Steve ArnesenNorth StarElectric Cooperative
Sid BergCass CountyElectric Cooperative
Donald SkjervheimCavalier RuralElectric Cooperative
Colette KujavaRed LakeElectric Cooperative
Lee McLaughlinNodakElectric Cooperative
Lucas SpaethNorthern MunicipalPower Agency
Mac McLennanPresident & CEO
Gerad PaulGeneral Counseland Assistant Secretary
Roger KrostueRed River ValleyCooperative PowerAssociation
Rick CoeBeltramiElectric Cooperative
Leroy RiewerClearwater-PolkElectric Cooperative
Board of Directors and Officers
6 2016 Minnkota Annual Report

2016 Minnkota Annual Report 7
Executive Staff and Senior Management
Gerry PfauSenior ManagerPower Production
Gerad PaulGeneral Counsel & Vice President for Legal Affairs
Karen ThingelstadVice President & Chief Financial Officer
Kathy DietzExecutive Coordinator
Stacey DahlExternal Affairs & Communications Manager
Mac McLennanPresident & Chief Executive Officer
Lowell StaveVice President & Chief Operating Officer
Dan InmanVice President & Chief Information Security Officer
From left:

8 2016 Minnkota Annual Report
Our purpose: Maintaining our system
GenerationMinnkota takes a proactive approach to maintaining its
generation facilities. Major outages typically are scheduled every three years to make repairs and conduct equipment inspections at the Minnkota-associated baseload power plants. In 2016, Unit 2 of the Milton R. Young Station, a 455-megawatt (MW) coal-based power plant, underwent an extended outage from Sept. 10 to Dec. 23.
Minnkota operates Unit 2 on behalf of owner Square Butte Electric Cooperative and purchases a portion of the plant’s energy production. Square Butte is owned by the same 11 cooperatives that govern Minnkota.
A primary focus during the outage was to complete one of the most extensive condition assessments of the unit’s boiler since the plant came online in 1977. The inspections identifi ed tube thinning in a large section of the boiler waterwall. Ad-dressing this issue required extending the outage beyond the original project schedule.
Inspections of the boiler feed pump turbine and the high pressure-intermediate pressure (HP-IP) turbine were also conducted with positive results. This is the fi rst inspection of this equipment since it was installed in 2007.
Other noteworthy projects at the plant, located near Cen-ter, N.D., included repairs on various station fans, coal handling equipment and the scrubber.
Minnkota also has interest in the Coyote Station, located near Beulah, N.D., through its Joint System arrangement with the Northern Municipal Power Agency (NMPA). NMPA owns a 30 percent share of the 427-MW coal-based plant.
Coyote Station came offl ine during spring 2016 for a 10-week outage that concluded May 30. The Otter Tail Power
Company-operated plant underwent boiler inspections and repairs, as well as the installation of an advanced over-fi re air system to reduce nitrogen oxides (NOx) emissions.
Power deliveryMinnkota remains committed to improving the reliability
of its existing power delivery system. During 2016, the cooperative began to accelerate a full-scale plan to address blink outage issues on its subtransmission system (69 kV and below). A signifi cant portion of this 2,100-mile system has aged beyond its 50th year of service and was not built to meet the heightened expectations of today’s consumers. While it is not practical nor cost-effective to reconstruct all of these lines in the near-term, modifi cations can be made to help limit their exposure to blinks caused by lightning strikes or wildlife.
Supported by a full study of its 69-kV system completed in 2015, Minnkota began working on existing lines that were experiencing higher-than-average blink outage occurrences. Structures were fi tted with equipment to help reduce blink impacts, including hanging lightning arresters, polymer post-top insulators, raptor deterrents (pole helmets) and climbing animal deterrents (pole wraps).
The implementation of these devices will continue dur-ing the next several years in impacted areas of the system. About 770 miles of line will be treated before the end of 2018. Minnkota will monitor these upgraded stretches of line to ensure the changes are the best solution moving forward.
FROM THE DEPTHS OF A 15-STORY BOILER TO THE TOPS OF TRANSMISSION STRUCTURES ALONG THE OPEN PRAIRIE, MINNKOTA EMPLOYEES WORKED TO ENSURE THE LONG-TERM RELIABILITY OF FACILITIES THAT HAVE SERVED THE MEMBERSHIP FOR DECADES.

2016 Minnkota Annual Report 9
Near the top of a 69-kilovolt structure, a line worker begins adding equipment designed to reduce blink outages. About 770 miles of line is scheduled for treatment before the end of 2018.
Insets: (Left) A welder works to complete boiler waterwall repairs during a major outage on Unit 2 of the Milton R. Young Station.(Right) Crews conduct live line maintenance near Hallock, Minn. The process includes adding equipment and making repairs without de-energizing the line.

10 2016 Minnkota Annual Report
Minnkota worked diligently in 2016 to protect the Milton R. Young Station, the cooperative’s primary generation
resource, from adverse regulation and security risks.
Inset: Theresa Allard (left), compliance manager, reviews North American Electric Reliability
Corporation (NERC) documents with Katherine Anagnost and Andy Fuhrman, both NERC
compliance coordinators.

2016 Minnkota Annual Report 11
Clean Power PlanIn August 2015, the Environmental Protection Agency
released its finalized version of the Clean Power Plan – the first-ever federal rule to limit carbon dioxide (CO2) emissions from existing coal-based power plants.
Under the rule, each state has a specific CO2 reduction target that must be met by 2030. North Dakota, where all of Minnkota’s electric generation resources are located, has one of the most stringent requirements in the nation. The state is required to reduce its CO2 emissions rate by 45 percent by 2030.
Throughout 2016, Minnkota pursued multiple legal, administrative and political efforts to address the rule, includ-ing the submission of a detailed Statement of Irreparable Harm filed as part of the initial litigation to suspend ap-plication of the rule. In February 2016, the U.S. Supreme Court, in an unprecedented action, granted a stay, thereby halting implementation of the rule until litigation concludes. After additional unexpected moves, the case was heard in September 2016 by the D.C. Circuit Court, which will likely issue a ruling in mid-2017.
However, it is expected that the change in administra-tion following the November 2016 election may alter the Clean Power Plan’s path to implementation. Minnkota will remain active in working with lawmakers and conducting internal modeling and analysis to ensure the best possible result for the membership’s resources.
SecurityMinnkota goes to great lengths to ensure the security
of its system and full compliance with all regulations set forth by the North American Electric Reliability Corporation (NERC). NERC is the regulatory authority that issues man-datory standards to protect the reliability of the bulk power system in North America.
The Midwest Reliability Organization, on behalf of NERC, conducted an audit in 2016 of Minnkota’s compliance with NERC Critical Infrastructure Protection (CIP) Version 5 reli-ability standards. No violations were found during the audit, which addressed the security of cyber assets essential to the reliable operation of the electric grid. The successful audit marks the second straight year in which Minnkota completed a NERC audit with no violations.
The focus in 2017 will be to address security issues at low-impact facilities, which includes 30 substations. Minnkota is also completing a thorough evaluation of security needs at the Young Station.
Demand responseMinnkota participates in the Midcontinent Independent
System Operator (MISO) wholesale market to buy and sell surplus power. In an effort to shield members from the volatil-ity of the market, the cooperative utilizes its demand response program. While mild weather throughout 2016 reduced the need to control peak loads, the program was important during the latter stages of the year when extended generator outages increased Minnkota’s exposure to the market.
Minnkota generally projects 80 to 100 control hours in the summer and about 250 hours of control in the winter. Inexpensive power was routinely available from the market to avoid control at most hours when Minnkota did not have adequate resources to serve its load. Only about 16 hours of control were required during winter 2015-2016, and only 28 hours were needed during summer 2016.
Minnkota views the demand response program as a long-term resource and completed extensive planning in 2016 to ensure its continued reliability. Much of the equipment currently associated with the program is more than 40 years old and needs replacement. With support from the member-ship, the cooperative will begin the process of replacing ripple injection equipment in 2017.
MINNKOTA FACED ADVERSE REGULATION AND OTHER EXTERNAL PRESSURES WITH STRATEGIES THAT START IN OUR BOARDROOM, BUILD THROUGH OUR MEMBERSHIP AND, IN MANY INSTANCES, REACH LOCAL AND NATIONAL POLICYMAKERS.
Our purpose: Protecting our resources
12 2016 Minnkota Annual Report
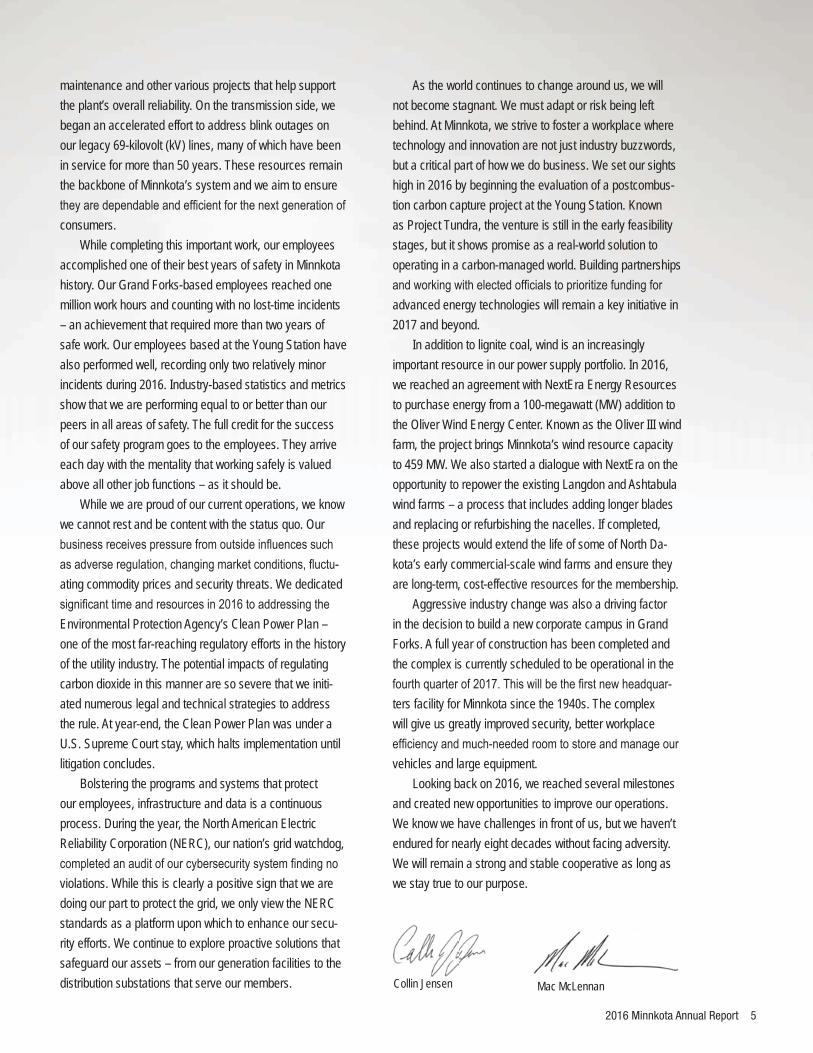
NEW WIND TURBINES BEGAN SPINNING, NEW POWER LINES BOLSTERED RELIABILITY AND NEW SUBSTATIONS SUPPORTED THE GROWING COMMUNITIES IN OUR SERVICE AREA.
piece of equipment is located next to the plant, and “steps up” the voltage of Unit 2 energy from 20 kV to 230 kV.
To accommodate the development of the new Oliver III wind farm, NextEra and Minnkota crews constructed the Roughrider 230-kV switching station, which includes three circuit breakers. The Roughrider station will interconnect Oliver III to the electric grid.
On the distribution side, Minnkota operates and maintains 205 substations that serve a diverse mix of rural, urban, indus-trial and agricultural consumers. The most prominent distribution substation project in the Minnkota system was the Veterans substation located in West Fargo, N.D. The substation was named as a tribute to all who have served in the U.S. Armed Forces. It will provide member Cass County Electric Cooperative with energy and capacity to serve the growing Fargo area, which includes the new Sanford Medical Center when it opens in 2017. In addition, much of the critical 69-kV line in the Fargo area will be converted to 115 kV by the end of 2017.
New facilitySignifi cant progress was made during 2016 on the
construction of Minnkota’s new corporate campus. It is the fi rst headquarters complex that the cooperative has built since the 1940s. Minnkota currently operates out of a set of facilities that were not designed to accommodate the unique and evolving demands of the electric utility industry. A new facility will meet Minnkota’s current and long-term needs in the areas of security, workplace effi ciency and large equipment storage. The project has been managed with minimal use of internal staff time, allow-ing work on behalf of the membership to continue unimpeded. The exterior of the entire facility was completed in 2016 and en-closed to allow for winter construction. At year-end, the project was on schedule for completion in fourth quarter of 2017.
Oliver IIIFollowing several months of construction during fall 2016,
the new Oliver III wind farm offi cially became operational Jan. 1, 2017. The 100-megawatt (MW) addition, which includes 48 GE turbines, was developed by NextEra Energy Resources. All production is sold to Minnkota under a 35-year Purchase Power Agreement (PPA).
Wind conditions and available transmission lines made the Oliver III wind farm an ideal project for Minnkota. This site should provide diversity to the wind production currently in the coopera-tive’s portfolio.
Minnkota and NextEra have a longstanding business rela-tionship focused on wind generation in North Dakota. In addition to the Oliver III project, Minnkota has PPAs in place with affi liates of NextEra for 357 MW of wind capacity from the Langdon and Ashtabula Wind Energy Centers on the eastern side of the state. In 2016, Minnkota signed fi ve-year extensions to two Ashtabula wind farm PPAs.
The PPAs ensure Minnkota is in position to meet long-term compliance with a renewable energy mandate in Minnesota and an objective in North Dakota. The Minnesota Renewable Energy Standard requires a 25 percent renewable energy supply component by 2025, and the North Dakota Renewable Energy Objective has a 10 percent goal, which began in 2015.
Power deliveryMinnkota is engaged in a continuous effort to upgrade its
power delivery assets – a system that extends from its primary generation resources in western North Dakota to its member systems in eastern North Dakota and northwestern Minnesota.
In 2016, the cooperative completed work to ensure its generation is effi ciently integrated into the electric grid. During a major scheduled outage at Unit 2 of the Young Station, Minnkota transmission crews used the downtime to replace the plant’s nearly 40-year-old generator step-up (GSU) transformer. This
Our purpose: Building for tomorrow
2016 Minnkota Annual Report 13
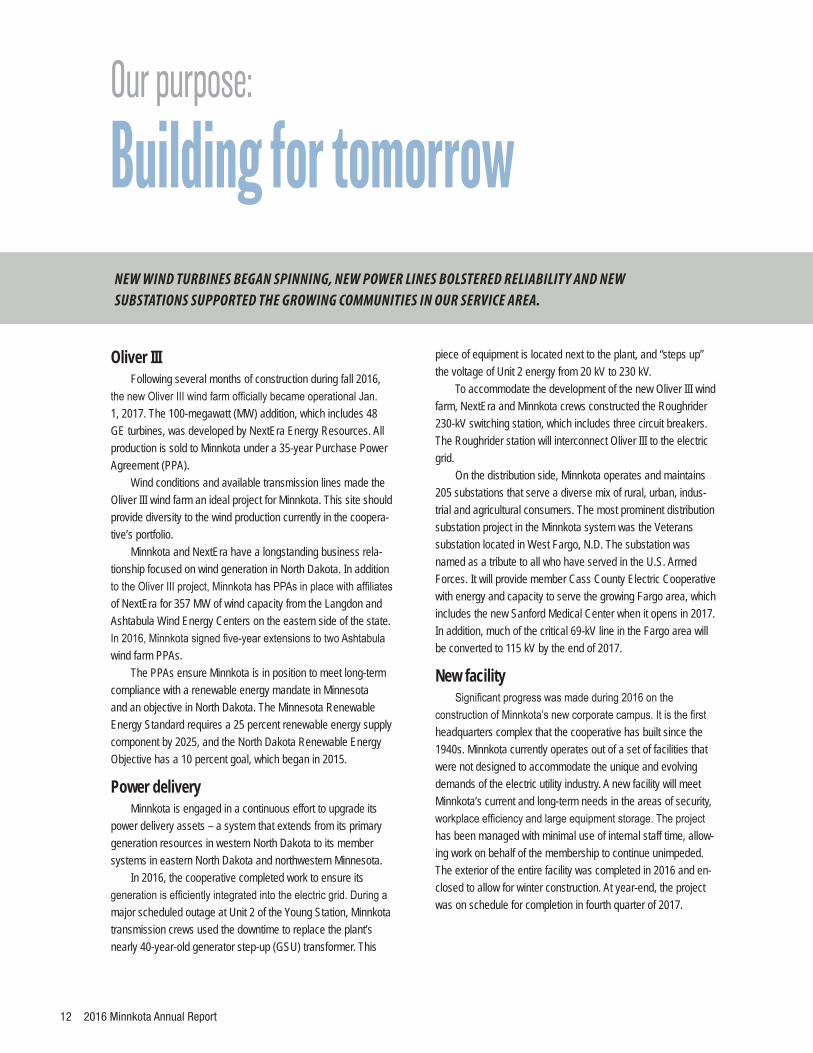
The 100-MW Oliver III wind farm was constructed during the fourth quarter of 2016 and went into full service Jan.1, 2017. Minnkota purchases all of the output from the 48 turbines located near Center, N.D.
Insets: (Left) Crews work on the Roughrider switching station, which transmits energy from the Oliver III wind farm. (Right) A new generator step-up (GSU) transformer is set in place for Unit 2 at the Young Station. The GSU steps up the voltage of the plant’s energy and integrates it onto the grid.

14 2016 Minnkota Annual Report
As part of training exercise, Minnkota line workers learn safe practices
for conducting maintenance on energized lines.
Inset: From the ground, line workers watch to ensure
their co-workers are a safe distance from the energized
lines during a training exercise.
2016 Minnkota Annual Report 15
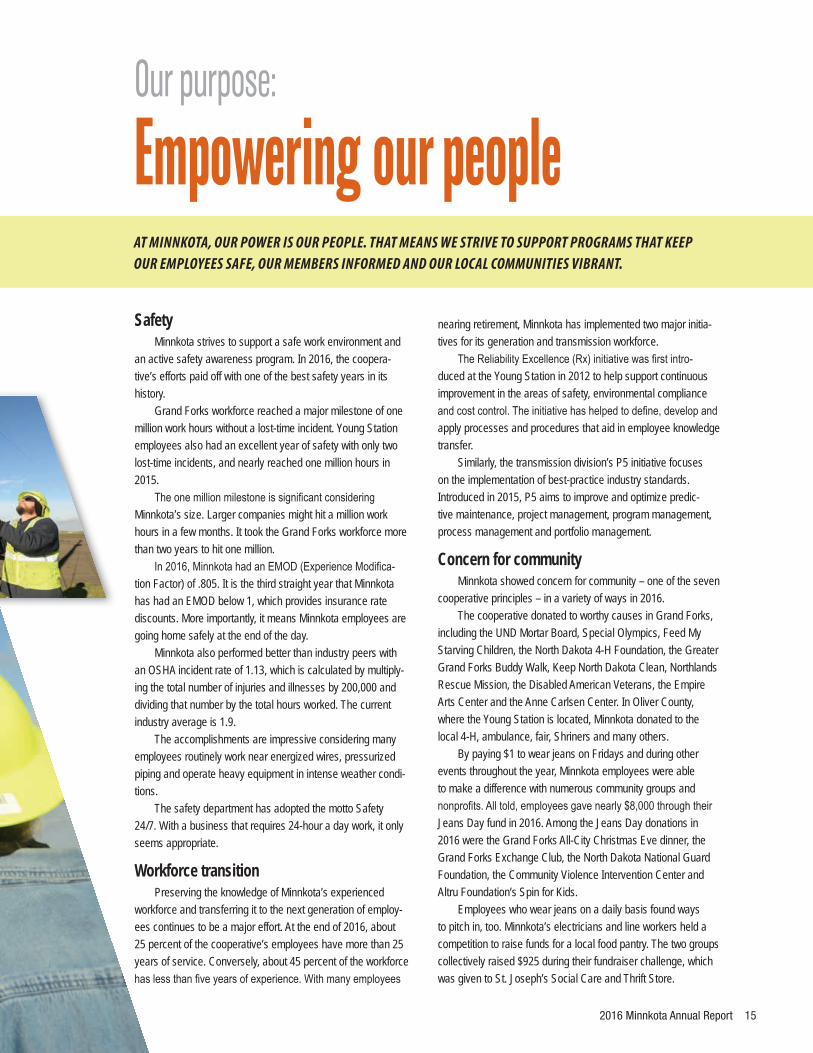
SafetyMinnkota strives to support a safe work environment and
an active safety awareness program. In 2016, the coopera-tive’s efforts paid off with one of the best safety years in its history.
Grand Forks workforce reached a major milestone of one million work hours without a lost-time incident. Young Station employees also had an excellent year of safety with only two lost-time incidents, and nearly reached one million hours in 2015.
The one million milestone is signifi cant considering Minnkota’s size. Larger companies might hit a million work hours in a few months. It took the Grand Forks workforce more than two years to hit one million.
In 2016, Minnkota had an EMOD (Experience Modifi ca-tion Factor) of .805. It is the third straight year that Minnkota has had an EMOD below 1, which provides insurance rate discounts. More importantly, it means Minnkota employees are going home safely at the end of the day.
Minnkota also performed better than industry peers with an OSHA incident rate of 1.13, which is calculated by multiply-ing the total number of injuries and illnesses by 200,000 and dividing that number by the total hours worked. The current industry average is 1.9.
The accomplishments are impressive considering many employees routinely work near energized wires, pressurized piping and operate heavy equipment in intense weather condi-tions.
The safety department has adopted the motto Safety 24/7. With a business that requires 24-hour a day work, it only seems appropriate.
Workforce transitionPreserving the knowledge of Minnkota’s experienced
workforce and transferring it to the next generation of employ-ees continues to be a major effort. At the end of 2016, about 25 percent of the cooperative’s employees have more than 25 years of service. Conversely, about 45 percent of the workforce has less than fi ve years of experience. With many employees
nearing retirement, Minnkota has implemented two major initia-tives for its generation and transmission workforce.
The Reliability Excellence (Rx) initiative was fi rst intro-duced at the Young Station in 2012 to help support continuous improvement in the areas of safety, environmental compliance and cost control. The initiative has helped to defi ne, develop and apply processes and procedures that aid in employee knowledge transfer.
Similarly, the transmission division’s P5 initiative focuses on the implementation of best-practice industry standards. Introduced in 2015, P5 aims to improve and optimize predic-tive maintenance, project management, program management, process management and portfolio management.
Concern for communityMinnkota showed concern for community – one of the seven
cooperative principles – in a variety of ways in 2016.The cooperative donated to worthy causes in Grand Forks,
including the UND Mortar Board, Special Olympics, Feed My Starving Children, the North Dakota 4-H Foundation, the Greater Grand Forks Buddy Walk, Keep North Dakota Clean, Northlands Rescue Mission, the Disabled American Veterans, the Empire Arts Center and the Anne Carlsen Center. In Oliver County, where the Young Station is located, Minnkota donated to the local 4-H, ambulance, fair, Shriners and many others.
By paying $1 to wear jeans on Fridays and during other events throughout the year, Minnkota employees were able to make a difference with numerous community groups and nonprofi ts. All told, employees gave nearly $8,000 through their Jeans Day fund in 2016. Among the Jeans Day donations in 2016 were the Grand Forks All-City Christmas Eve dinner, the Grand Forks Exchange Club, the North Dakota National Guard Foundation, the Community Violence Intervention Center and Altru Foundation’s Spin for Kids.
Employees who wear jeans on a daily basis found ways to pitch in, too. Minnkota’s electricians and line workers held a competition to raise funds for a local food pantry. The two groups collectively raised $925 during their fundraiser challenge, which was given to St. Joseph’s Social Care and Thrift Store.
Empowering our peopleOur purpose:
AT MINNKOTA, OUR POWER IS OUR PEOPLE. THAT MEANS WE STRIVE TO SUPPORT PROGRAMS THAT KEEP OUR EMPLOYEES SAFE, OUR MEMBERS INFORMED AND OUR LOCAL COMMUNITIES VIBRANT.
16 2016 Minnkota Annual Report
AS THE ENERGY INDUSTRY CONTINUES TO EVOLVE, MINNKOTA EXPLORES NEW AND ADVANCED WAYS TO GENERATE AND TRANSMIT ELECTRICITY, WHILE PROMOTING PROGRAMS THAT ENCOURAGE WISE ENERGY USE.
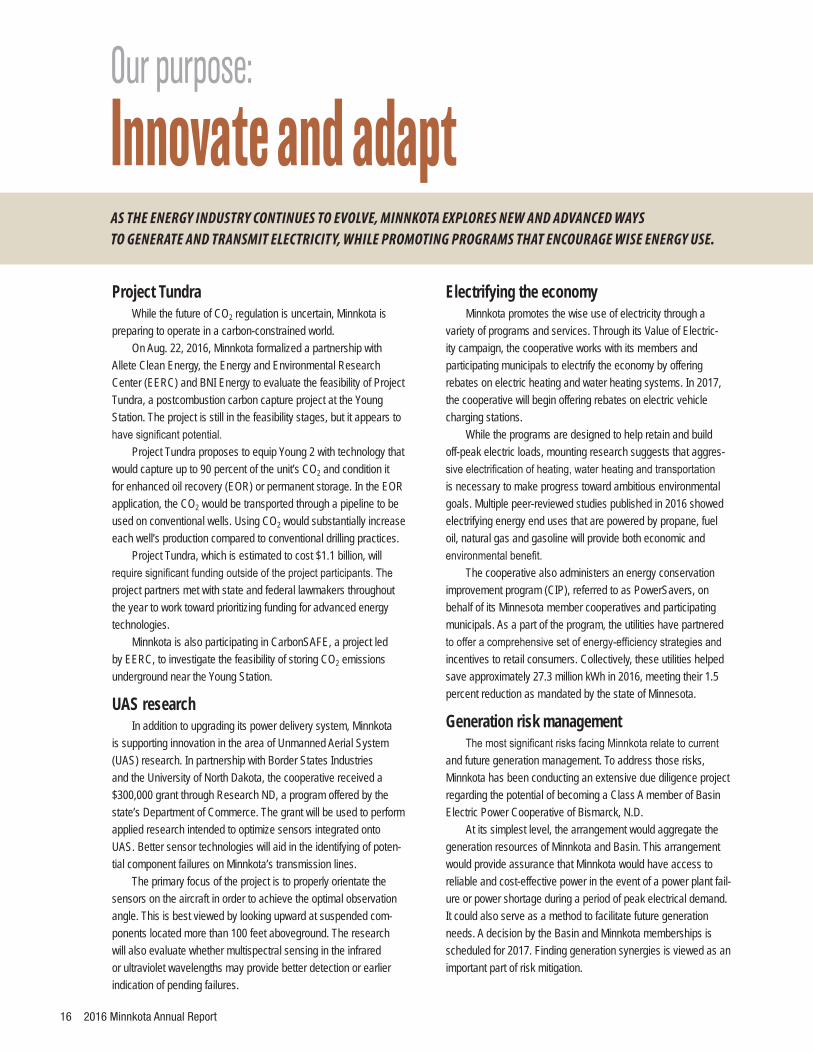
Project TundraWhile the future of CO2 regulation is uncertain, Minnkota is
preparing to operate in a carbon-constrained world.On Aug. 22, 2016, Minnkota formalized a partnership with
Allete Clean Energy, the Energy and Environmental Research Center (EERC) and BNI Energy to evaluate the feasibility of Project Tundra, a postcombustion carbon capture project at the Young Station. The project is still in the feasibility stages, but it appears to have signifi cant potential.
Project Tundra proposes to equip Young 2 with technology that would capture up to 90 percent of the unit’s CO2 and condition it for enhanced oil recovery (EOR) or permanent storage. In the EOR application, the CO2 would be transported through a pipeline to be used on conventional wells. Using CO2 would substantially increase each well’s production compared to conventional drilling practices.
Project Tundra, which is estimated to cost $1.1 billion, will require signifi cant funding outside of the project participants. The project partners met with state and federal lawmakers throughout the year to work toward prioritizing funding for advanced energy technologies.
Minnkota is also participating in CarbonSAFE, a project led by EERC, to investigate the feasibility of storing CO2 emissions underground near the Young Station.
UAS researchIn addition to upgrading its power delivery system, Minnkota
is supporting innovation in the area of Unmanned Aerial System (UAS) research. In partnership with Border States Industries and the University of North Dakota, the cooperative received a $300,000 grant through Research ND, a program offered by the state’s Department of Commerce. The grant will be used to perform applied research intended to optimize sensors integrated onto UAS. Better sensor technologies will aid in the identifying of poten-tial component failures on Minnkota’s transmission lines.
The primary focus of the project is to properly orientate the sensors on the aircraft in order to achieve the optimal observation angle. This is best viewed by looking upward at suspended com-ponents located more than 100 feet aboveground. The research will also evaluate whether multispectral sensing in the infrared or ultraviolet wavelengths may provide better detection or earlier indication of pending failures.
Electrifying the economyMinnkota promotes the wise use of electricity through a
variety of programs and services. Through its Value of Electric-ity campaign, the cooperative works with its members and participating municipals to electrify the economy by offering rebates on electric heating and water heating systems. In 2017, the cooperative will begin offering rebates on electric vehicle charging stations.
While the programs are designed to help retain and build off-peak electric loads, mounting research suggests that aggres-sive electrifi cation of heating, water heating and transportation is necessary to make progress toward ambitious environmental goals. Multiple peer-reviewed studies published in 2016 showed electrifying energy end uses that are powered by propane, fuel oil, natural gas and gasoline will provide both economic and environmental benefi t.
The cooperative also administers an energy conservation improvement program (CIP), referred to as PowerSavers, on behalf of its Minnesota member cooperatives and participating municipals. As a part of the program, the utilities have partnered to offer a comprehensive set of energy-effi ciency strategies and incentives to retail consumers. Collectively, these utilities helped save approximately 27.3 million kWh in 2016, meeting their 1.5 percent reduction as mandated by the state of Minnesota.
Generation risk managementThe most signifi cant risks facing Minnkota relate to current
and future generation management. To address those risks, Minnkota has been conducting an extensive due diligence project regarding the potential of becoming a Class A member of Basin Electric Power Cooperative of Bismarck, N.D.
At its simplest level, the arrangement would aggregate the generation resources of Minnkota and Basin. This arrangement would provide assurance that Minnkota would have access to reliable and cost-effective power in the event of a power plant fail-ure or power shortage during a period of peak electrical demand. It could also serve as a method to facilitate future generation needs. A decision by the Basin and Minnkota memberships is scheduled for 2017. Finding generation synergies is viewed as an important part of risk mitigation.
Our purpose: Innovate and adapt

CHARGE
2016 Minnkota Annual Report 17
As part of a research project, an inspection of Minnkota’s Center to Grand Forks transmission line is conducted using a drone.
Inset: Through its member cooperatives, Minnkota will begin offering new rebates for electric vehicle charging stations.
18 2016 Minnkota Annual Report
X = 49Y = 4Z = -3Persp = 0Depth = 10
Color pie pieces �rst.Then apply 3D settings when still round and �at.
X = 49Y = 4Z = -3Persp = 0Depth = 10
Color pie pieces �rst.Then apply 3D settings when still round and �at.
Treasurer’s Report
This report summarizes the fi nancial results of Minnkota’s operations for the year ended Dec. 31, 2016, and its fi nancial position as of Dec. 31,
2016.
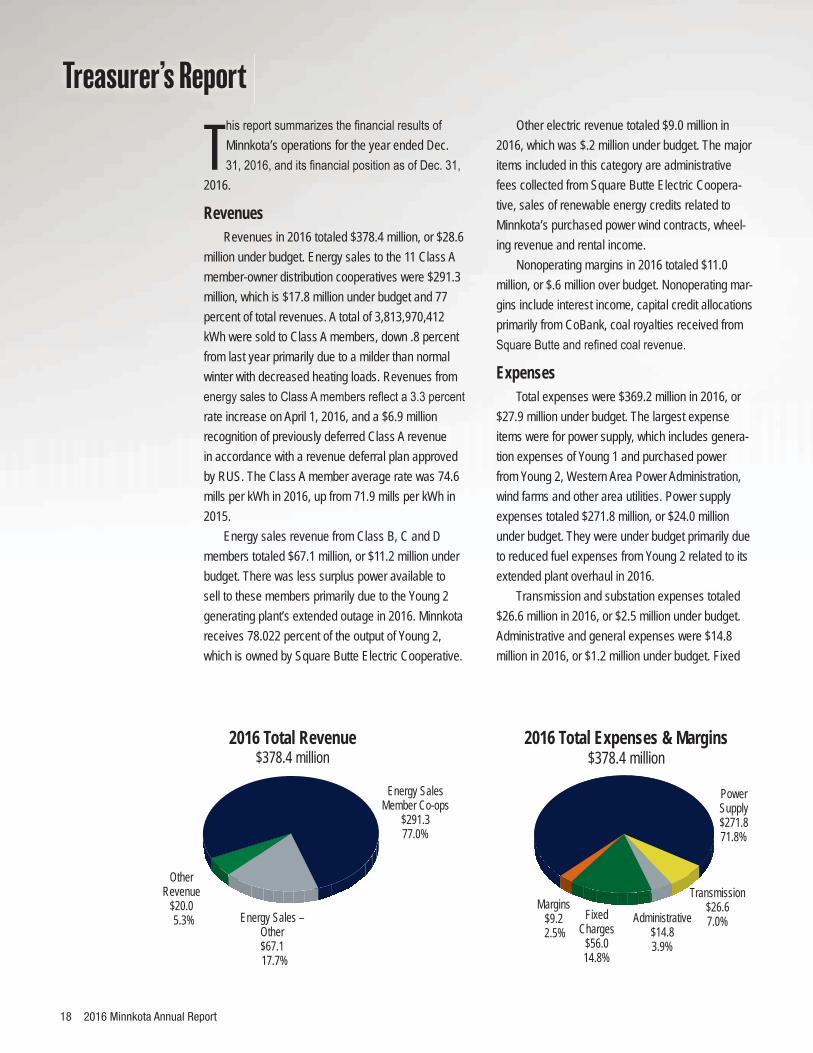
RevenuesRevenues in 2016 totaled $378.4 million, or $28.6
million under budget. Energy sales to the 11 Class A member-owner distribution cooperatives were $291.3 million, which is $17.8 million under budget and 77 percent of total revenues. A total of 3,813,970,412 kWh were sold to Class A members, down .8 percent from last year primarily due to a milder than normal winter with decreased heating loads. Revenues from energy sales to Class A members refl ect a 3.3 percent rate increase on April 1, 2016, and a $6.9 million recognition of previously deferred Class A revenue in accordance with a revenue deferral plan approved by RUS. The Class A member average rate was 74.6 mills per kWh in 2016, up from 71.9 mills per kWh in 2015.
Energy sales revenue from Class B, C and D members totaled $67.1 million, or $11.2 million under budget. There was less surplus power available to sell to these members primarily due to the Young 2 generating plant’s extended outage in 2016. Minnkota receives 78.022 percent of the output of Young 2, which is owned by Square Butte Electric Cooperative.
2016 Total Revenue$378.4 million
OtherRevenue
$20.0 5.3% Energy Sales –
Other$67.1
17.7%
Energy SalesMember Co-ops
$291.377.0%
2016 Total Expenses & Margins$378.4 million
Power Supply$271.871.8%
Margins$9.2
2.5%
Transmission$26.67.0%Administrative
$14.83.9%
Fixed Charges
$56.014.8%
Other electric revenue totaled $9.0 million in 2016, which was $.2 million under budget. The major items included in this category are administrative fees collected from Square Butte Electric Coopera-tive, sales of renewable energy credits related to Minnkota’s purchased power wind contracts, wheel-ing revenue and rental income.
Nonoperating margins in 2016 totaled $11.0 million, or $.6 million over budget. Nonoperating mar-gins include interest income, capital credit allocations primarily from CoBank, coal royalties received from Square Butte and refi ned coal revenue.
ExpensesTotal expenses were $369.2 million in 2016, or
$27.9 million under budget. The largest expense items were for power supply, which includes genera-tion expenses of Young 1 and purchased power from Young 2, Western Area Power Administration, wind farms and other area utilities. Power supply expenses totaled $271.8 million, or $24.0 million under budget. They were under budget primarily due to reduced fuel expenses from Young 2 related to its extended plant overhaul in 2016.
Transmission and substation expenses totaled $26.6 million in 2016, or $2.5 million under budget. Administrative and general expenses were $14.8 million in 2016, or $1.2 million under budget. Fixed

costs, which include interest and depreciation, totaled $56.0 million in 2016, which is $.2 million under budget.
Net marginsMargins for 2016 were $9.2 million, up from $7.5
million in 2015. The total margin consisted of an operat-ing loss of $1.8 million and a nonoperating margin of $11.0 million.
Patronage capitalTotal patronage capital was $19.6 million at
Dec. 31, 2016, and refl ects the 2016 operating loss of $1.8 million.
The nonoperating margin of $11.0 million will be retained as appropriated margins to be used for future contingencies.
Total equity at Dec. 31, 2016, was $130.2 million, 12.8 percent of total assets.
Electric PlantNet electric plant was $922.2 million at Dec. 31,
2016, up $23.8 million from last year. This increase is mainly due to transmission property additions.
Long-term debtMinnkota’s long-term debt, including current maturi-
ties, was $794.2 million as of Dec. 31, 2016, up $19.2 million from last year. In 2016, Minnkota had net loan advances of $35.0 million from RUS and CoBank and had an RUS cushion of credit balance of $130.0 million at Dec. 31, 2016, which represents unapplied debt pay-ments. Minnkota made $19.7 million in debt principal payments during the year.
This has been a brief review of the 2016 fi nancial statements. For further information, I urge you to review the fi nancial statements, the notes to the fi nancial state-ments and the Independent Auditor’s Report contained in this annual report.
Respectfully submitted,
Jeffrey FollandSecretary/Treasurer
costs, which include interest and depreciation, totaled $56.0 million in 2016, which is $.2 million under budget.
Margins for 2016 were $9.2 million, up from $7.5 million in 2015. The total margin consisted of an operat-ing loss of $1.8 million and a nonoperating margin of
Total patronage capital was $19.6 million at Dec. 31, 2016, and refl ects the 2016 operating loss of
The nonoperating margin of $11.0 million will be retained as appropriated margins to be used for future
Total equity at Dec. 31, 2016, was $130.2 million,
Net electric plant was $922.2 million at Dec. 31, 2016, up $23.8 million from last year. This increase is mainly due to transmission property additions.
Minnkota’s long-term debt, including current maturi-ties, was $794.2 million as of Dec. 31, 2016, up $19.2 million from last year. In 2016, Minnkota had net loan advances of $35.0 million from RUS and CoBank and had an RUS cushion of credit balance of $130.0 million at Dec. 31, 2016, which represents unapplied debt pay-ments. Minnkota made $19.7 million in debt principal
This has been a brief review of the 2016 fi nancial statements. For further information, I urge you to review the fi nancial statements, the notes to the fi nancial state-ments and the Independent Auditor’s Report contained
Jeffrey FollandSecretary/Treasurer
2016 Minnkota Annual Report 19
20 2016 Minnkota Annual Report
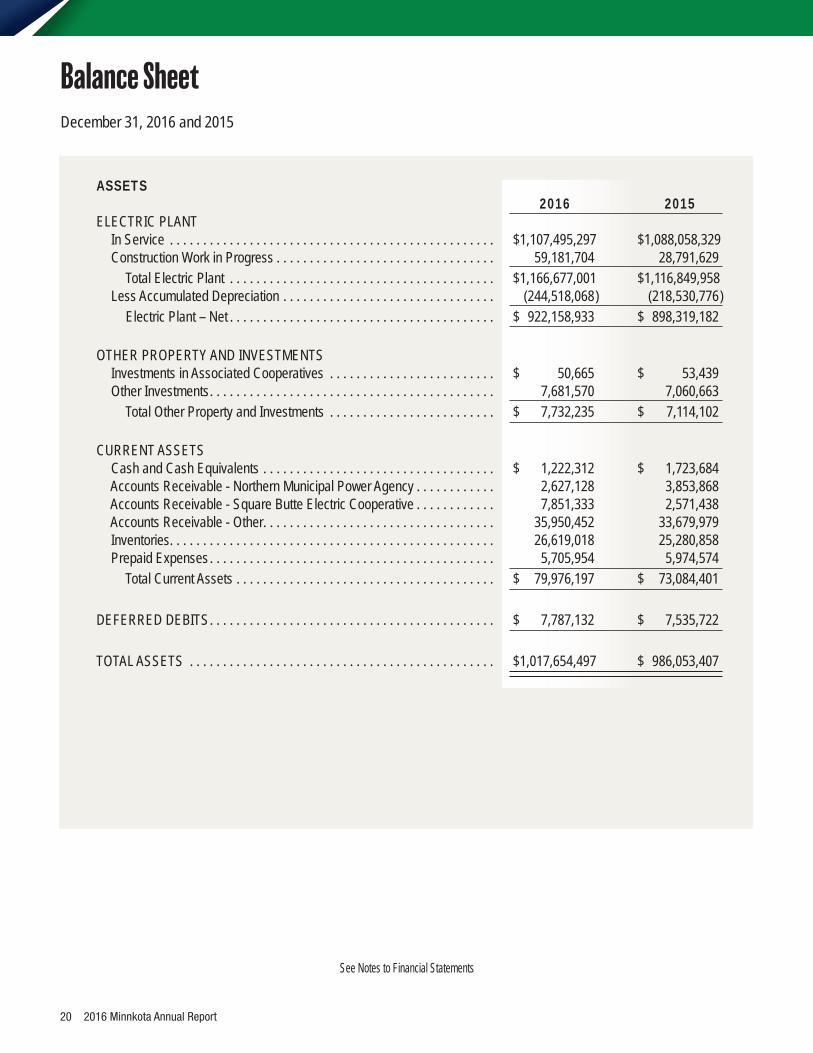
ASSETS 2016 2015 ELECTRIC PLANT In Service . . . . . . . . . . . . . . . . . . . . . . . . . . . . . . . . . . . . . . . . . . . . . . . . . $ 1,107,495,297 $ 1,088,058,329 Construction Work in Progress . . . . . . . . . . . . . . . . . . . . . . . . . . . . . . . . . 59,181,704 28,791,629 Total Electric Plant . . . . . . . . . . . . . . . . . . . . . . . . . . . . . . . . . . . . . . . . $ 1,166,677,001 $ 1,116,849,958 Less Accumulated Depreciation . . . . . . . . . . . . . . . . . . . . . . . . . . . . . . . . (244,518,068 ) (218,530,776 ) Electric Plant – Net . . . . . . . . . . . . . . . . . . . . . . . . . . . . . . . . . . . . . . . . $ 922,158,933 $ 898,319,182
OTHER PROPERTY AND INVESTMENTS Investments in Associated Cooperatives . . . . . . . . . . . . . . . . . . . . . . . . . $ 50,665 $ 53,439 Other Investments . . . . . . . . . . . . . . . . . . . . . . . . . . . . . . . . . . . . . . . . . . . 7,681,570 7,060,663 Total Other Property and Investments . . . . . . . . . . . . . . . . . . . . . . . . . $ 7,732,235 $ 7,114,102
CURRENT ASSETS Cash and Cash Equivalents . . . . . . . . . . . . . . . . . . . . . . . . . . . . . . . . . . . $ 1,222,312 $ 1,723,684 Accounts Receivable - Northern Municipal Power Agency . . . . . . . . . . . . 2,627,128 3,853,868 Accounts Receivable - Square Butte Electric Cooperative . . . . . . . . . . . . 7,851,333 2,571,438 Accounts Receivable - Other . . . . . . . . . . . . . . . . . . . . . . . . . . . . . . . . . . . 35,950,452 33,679,979 Inventories . . . . . . . . . . . . . . . . . . . . . . . . . . . . . . . . . . . . . . . . . . . . . . . . . 26,619,018 25,280,858 Prepaid Expenses . . . . . . . . . . . . . . . . . . . . . . . . . . . . . . . . . . . . . . . . . . . 5,705,954 5,974,574 Total Current Assets . . . . . . . . . . . . . . . . . . . . . . . . . . . . . . . . . . . . . . . $ 79,976,197 $ 73,084,401
DEFERRED DEBITS . . . . . . . . . . . . . . . . . . . . . . . . . . . . . . . . . . . . . . . . . . . $ 7,787,132 $ 7,535,722
TOTAL ASSETS . . . . . . . . . . . . . . . . . . . . . . . . . . . . . . . . . . . . . . . . . . . . . . $ 1,017,654,497 $ 986,053,407
See Notes to Financial Statements
December 31, 2016 and 2015
Balance Sheet

2016 Minnkota Annual Report 21
EQUITIES AND LIABILITIES 2016 2015EQUITIES Memberships Issued . . . . . . . . . . . . . . . . . . . . . . . . . . . . . . . . . . . . . . . . . $ 1,136 $ 1,136 Patronage Capital . . . . . . . . . . . . . . . . . . . . . . . . . . . . . . . . . . . . . . . . . . . 19,641,242 21,481,749 Appropriated Margins . . . . . . . . . . . . . . . . . . . . . . . . . . . . . . . . . . . . . . . . 113,982,600 102,912,093 Accumulated Other Comprehensive Income (Loss) . . . . . . . . . . . . . . . . . (3,468,436 ) (1,814,106 ) Total Equities . . . . . . . . . . . . . . . . . . . . . . . . . . . . . . . . . . . . . . . . . . . . $ 130,156,542 $ 122,580,872
LONG-TERM DEBT, LESS CURRENT MATURITIES Mortgage Notes Payable . . . . . . . . . . . . . . . . . . . . . . . . . . . . . . . . . . . . . . $ 770,507,659 $ 754,086,098 Accrued Pension Costs . . . . . . . . . . . . . . . . . . . . . . . . . . . . . . . . . . . . . . . 2,334,794 1,338,766 Total Long-Term Debt, Less Current Maturities . . . . . . . . . . . . . . . . . . $ 772,842,453 $ 755,424,864
OTHER NONCURRENT LIABILITIES Postretirement Health Insurance Obligation . . . . . . . . . . . . . . . . . . . . . . . $ 4,657,307 $ 6,044,867 Closure Cost Obligation . . . . . . . . . . . . . . . . . . . . . . . . . . . . . . . . . . . . . . 850,671 662,121 Total Noncurrent Liabilities . . . . . . . . . . . . . . . . . . . . . . . . . . . . . . . . . . $ 5,507,978 $ 6,706,988
CURRENT LIABILITIES Accounts Payable – Square Butte Electric . . . . . . . . . . . . . . . . . . . . . . . . $ 9,142,003 $ 8,530,983 Accounts Payable – Other . . . . . . . . . . . . . . . . . . . . . . . . . . . . . . . . . . . . . 37,292,612 28,977,763 Accrued Taxes . . . . . . . . . . . . . . . . . . . . . . . . . . . . . . . . . . . . . . . . . . . . . . 3,431,860 3,304,540 Accrued Interest . . . . . . . . . . . . . . . . . . . . . . . . . . . . . . . . . . . . . . . . . . . . 1,006,363 1,105,284 Accrued Payroll . . . . . . . . . . . . . . . . . . . . . . . . . . . . . . . . . . . . . . . . . . . . . 1,354,202 1,219,221 Vested Accrued Vacation . . . . . . . . . . . . . . . . . . . . . . . . . . . . . . . . . . . . . 4,012,108 4,295,980 Current Maturities of Long-Term Debt . . . . . . . . . . . . . . . . . . . . . . . . . . . . 21,334,777 19,587,267 Line of Credit . . . . . . . . . . . . . . . . . . . . . . . . . . . . . . . . . . . . . . . . . . . . . . . 15,395,000 15,892,000 Total Current Liabilities . . . . . . . . . . . . . . . . . . . . . . . . . . . . . . . . . . . . . $ 92,968,925 $ 82,913,038
DEFERRED CREDITS . . . . . . . . . . . . . . . . . . . . . . . . . . . . . . . . . . . . . . . . . $ 16,178,599 $ 18,427,645
TOTAL EQUITIES AND LIABILITIES . . . . . . . . . . . . . . . . . . . . . . . . . . . . . . $ 1,017,654,497 $ 986,053,407
See Notes to Financial Statements
22 2016 Minnkota Annual Report
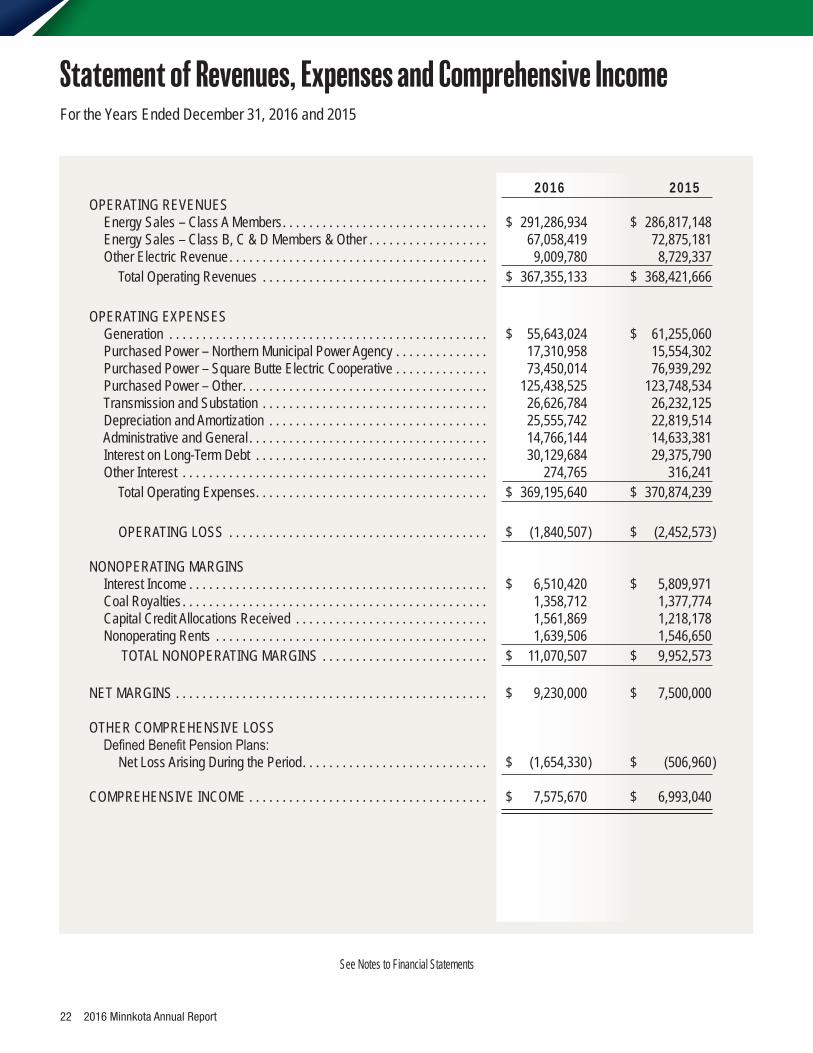
2016 2015OPERATING REVENUES Energy Sales – Class A Members . . . . . . . . . . . . . . . . . . . . . . . . . . . . . . . $ 291,286,934 $ 286,817,148 Energy Sales – Class B, C & D Members & Other . . . . . . . . . . . . . . . . . . 67,058,419 72,875,181 Other Electric Revenue . . . . . . . . . . . . . . . . . . . . . . . . . . . . . . . . . . . . . . . 9,009,780 8,729,337 Total Operating Revenues . . . . . . . . . . . . . . . . . . . . . . . . . . . . . . . . . . $ 367,355,133 $ 368,421,666
OPERATING EXPENSES Generation . . . . . . . . . . . . . . . . . . . . . . . . . . . . . . . . . . . . . . . . . . . . . . . . $ 55,643,024 $ 61,255,060 Purchased Power – Northern Municipal Power Agency . . . . . . . . . . . . . . 17,310,958 15,554,302 Purchased Power – Square Butte Electric Cooperative . . . . . . . . . . . . . . 73,450,014 76,939,292 Purchased Power – Other . . . . . . . . . . . . . . . . . . . . . . . . . . . . . . . . . . . . . 125,438,525 123,748,534 Transmission and Substation . . . . . . . . . . . . . . . . . . . . . . . . . . . . . . . . . . 26,626,784 26,232,125 Depreciation and Amortization . . . . . . . . . . . . . . . . . . . . . . . . . . . . . . . . . 25,555,742 22,819,514 Administrative and General . . . . . . . . . . . . . . . . . . . . . . . . . . . . . . . . . . . . 14,766,144 14,633,381 Interest on Long-Term Debt . . . . . . . . . . . . . . . . . . . . . . . . . . . . . . . . . . . 30,129,684 29,375,790 Other Interest . . . . . . . . . . . . . . . . . . . . . . . . . . . . . . . . . . . . . . . . . . . . . . 274,765 316,241 Total Operating Expenses . . . . . . . . . . . . . . . . . . . . . . . . . . . . . . . . . . . $ 369,195,640 $ 370,874,239
OPERATING LOSS . . . . . . . . . . . . . . . . . . . . . . . . . . . . . . . . . . . . . . . $ (1,840,507 ) $ (2,452,573 )
NONOPERATING MARGINS Interest Income . . . . . . . . . . . . . . . . . . . . . . . . . . . . . . . . . . . . . . . . . . . . . $ 6,510,420 $ 5,809,971 Coal Royalties . . . . . . . . . . . . . . . . . . . . . . . . . . . . . . . . . . . . . . . . . . . . . . 1,358,712 1,377,774 Capital Credit Allocations Received . . . . . . . . . . . . . . . . . . . . . . . . . . . . . 1,561,869 1,218,178 Nonoperating Rents . . . . . . . . . . . . . . . . . . . . . . . . . . . . . . . . . . . . . . . . . 1,639,506 1,546,650 TOTAL NONOPERATING MARGINS . . . . . . . . . . . . . . . . . . . . . . . . . $ 11,070,507 $ 9,952,573
NET MARGINS . . . . . . . . . . . . . . . . . . . . . . . . . . . . . . . . . . . . . . . . . . . . . . . $ 9,230,000 $ 7,500,000
OTHER COMPREHENSIVE LOSS Defi ned Benefi t Pension Plans: Net Loss Arising During the Period . . . . . . . . . . . . . . . . . . . . . . . . . . . . $ (1,654,330 ) $ (506,960 )
COMPREHENSIVE INCOME . . . . . . . . . . . . . . . . . . . . . . . . . . . . . . . . . . . . $ 7,575,670 $ 6,993,040
See Notes to Financial Statements
For the Years Ended December 31, 2016 and 2015
Statement of Revenues, Expenses and Comprehensive Income
2016 Minnkota Annual Report 23
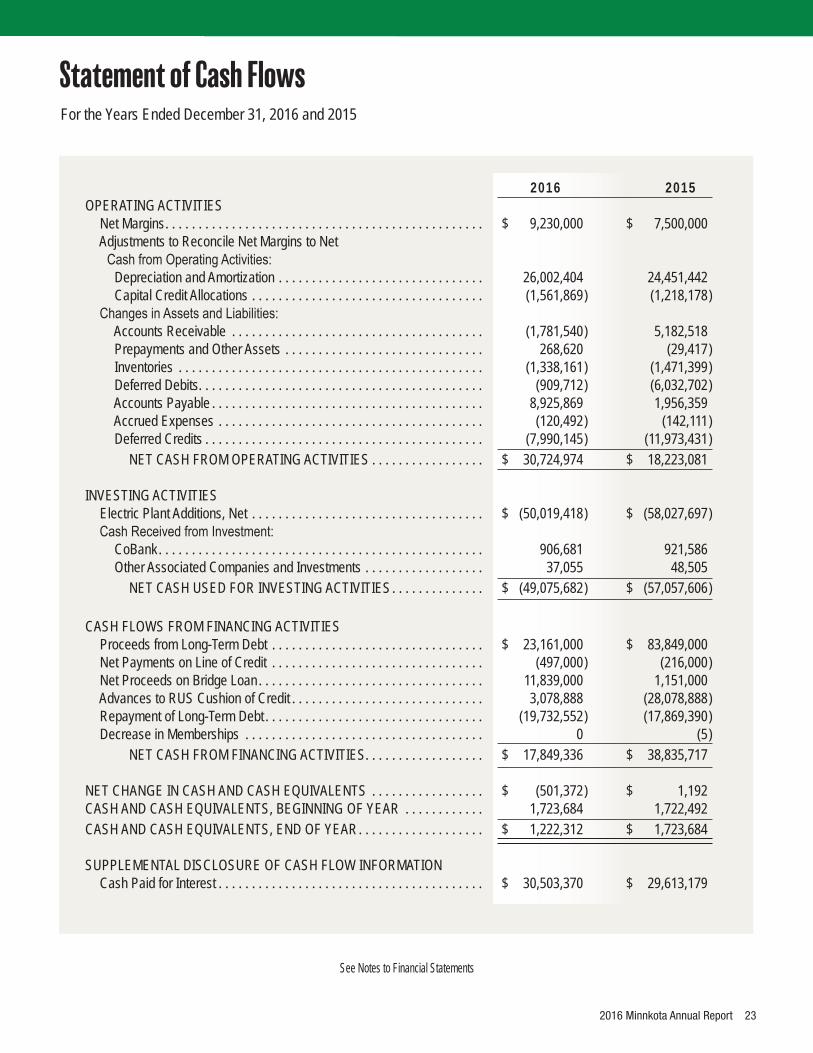
2016 2015OPERATING ACTIVITIES Net Margins . . . . . . . . . . . . . . . . . . . . . . . . . . . . . . . . . . . . . . . . . . . . . . . . $ 9,230,000 $ 7,500,000 Adjustments to Reconcile Net Margins to Net Cash from Operating Activities: Depreciation and Amortization . . . . . . . . . . . . . . . . . . . . . . . . . . . . . . . 26,002,404 24,451,442 Capital Credit Allocations . . . . . . . . . . . . . . . . . . . . . . . . . . . . . . . . . . . (1,561,869 ) (1,218,178 ) Changes in Assets and Liabilities: Accounts Receivable . . . . . . . . . . . . . . . . . . . . . . . . . . . . . . . . . . . . . . (1,781,540 ) 5,182,518 Prepayments and Other Assets . . . . . . . . . . . . . . . . . . . . . . . . . . . . . . 268,620 (29,417 ) Inventories . . . . . . . . . . . . . . . . . . . . . . . . . . . . . . . . . . . . . . . . . . . . . . (1,338,161 ) (1,471,399 ) Deferred Debits . . . . . . . . . . . . . . . . . . . . . . . . . . . . . . . . . . . . . . . . . . . (909,712 ) (6,032,702 ) Accounts Payable . . . . . . . . . . . . . . . . . . . . . . . . . . . . . . . . . . . . . . . . . 8,925,869 1,956,359 Accrued Expenses . . . . . . . . . . . . . . . . . . . . . . . . . . . . . . . . . . . . . . . . (120,492 ) (142,111 ) Deferred Credits . . . . . . . . . . . . . . . . . . . . . . . . . . . . . . . . . . . . . . . . . . (7,990,145 ) (11,973,431 ) NET CASH FROM OPERATING ACTIVITIES . . . . . . . . . . . . . . . . . $ 30,724,974 $ 18,223,081
INVESTING ACTIVITIES Electric Plant Additions, Net . . . . . . . . . . . . . . . . . . . . . . . . . . . . . . . . . . . $ (50,019,418 ) $ (58,027,697 ) Cash Received from Investment: CoBank . . . . . . . . . . . . . . . . . . . . . . . . . . . . . . . . . . . . . . . . . . . . . . . . . 906,681 921,586 Other Associated Companies and Investments . . . . . . . . . . . . . . . . . . 37,055 48,505 NET CASH USED FOR INVESTING ACTIVITIES . . . . . . . . . . . . . . $ (49,075,682 ) $ (57,057,606 )
CASH FLOWS FROM FINANCING ACTIVITIES Proceeds from Long-Term Debt . . . . . . . . . . . . . . . . . . . . . . . . . . . . . . . . $ 23,161,000 $ 83,849,000 Net Payments on Line of Credit . . . . . . . . . . . . . . . . . . . . . . . . . . . . . . . . (497,000 ) (216,000 ) Net Proceeds on Bridge Loan . . . . . . . . . . . . . . . . . . . . . . . . . . . . . . . . . . 11,839,000 1,151,000 Advances to RUS Cushion of Credit . . . . . . . . . . . . . . . . . . . . . . . . . . . . . 3,078,888 (28,078,888 ) Repayment of Long-Term Debt . . . . . . . . . . . . . . . . . . . . . . . . . . . . . . . . . (19,732,552 ) (17,869,390 ) Decrease in Memberships . . . . . . . . . . . . . . . . . . . . . . . . . . . . . . . . . . . . 0 (5 ) NET CASH FROM FINANCING ACTIVITIES. . . . . . . . . . . . . . . . . . $ 17,849,336 $ 38,835,717
NET CHANGE IN CASH AND CASH EQUIVALENTS . . . . . . . . . . . . . . . . . $ (501,372 ) $ 1,192 CASH AND CASH EQUIVALENTS, BEGINNING OF YEAR . . . . . . . . . . . . 1,723,684 1,722,492 CASH AND CASH EQUIVALENTS, END OF YEAR . . . . . . . . . . . . . . . . . . . $ 1,222,312 $ 1,723,684
SUPPLEMENTAL DISCLOSURE OF CASH FLOW INFORMATION Cash Paid for Interest . . . . . . . . . . . . . . . . . . . . . . . . . . . . . . . . . . . . . . . . $ 30,503,370 $ 29,613,179
See Notes to Financial Statements
Statement of Cash FlowsFor the Years Ended December 31, 2016 and 2015

24 2016 Minnkota Annual Report
Plant Accumulated Net Utility Investment Depreciation Plant
ELECTRIC PLANT IN SERVICEProduction Plant Milton R. Young Station No. 1 . . . . . . . . . . . . . . . . . $ 387,299,438 $ 98,481,552 $ 288,817,886 Wind Turbines . . . . . . . . . . . . . . . . . . . . . . . . . . . . . 2,011,953 1,441,142 570,811 Total Production Plant . . . . . . . . . . . . . . . . . . . . . $ 389,311,391 $ 99,922,694 $ 289,388,697
Transmission Lines . . . . . . . . . . . . . . . . . . . . . . . . . . . 474,092,301 60,632,925 413,459,376 Transmission Substations . . . . . . . . . . . . . . . . . . . . . . 108,870,001 29,511,043 79,358,958 Distribution Substations . . . . . . . . . . . . . . . . . . . . . . . . 77,713,348 19,944,491 57,768,857 General Plant . . . . . . . . . . . . . . . . . . . . . . . . . . . . . . . . 57,508,256 34,506,915 23,001,341 Total Electric Plant in Service . . . . . . . . . . . . . . . $ 1,107,495,297 $ 244,518,068 $ 862,977,229
CONSTRUCTION WORK IN PROGRESS . . . . . . . . . 59,181,704 59,181,704
TOTAL ELECTRIC PLANT . . . . . . . . . . . . . . . . . . . . $ 1,166,677,001 $ 244,518,068 $ 922,158,933
2016 2015MORTGAGE NOTES PAYABLE Notes Executed and Advanced . . . . . . . . . . . . . . . . . . . . . . . . . . . . . . . . . $ 1,250,482,133 $ 1,215,659,398 Loan Principal Repaid . . . . . . . . . . . . . . . . . . . . . . . . . . . . . . . . . . . . . . . . (328,639,697 ) (308,907,145 ) Total Mortgage Notes Payable . . . . . . . . . . . . . . . . . . . . . . . . . . . . . . $ 921,842,436 $ 906,752,253 Advance Payments Unapplied . . . . . . . . . . . . . . . . . . . . . . . . . . . . . . . . . (130,000,000 ) (133,078,888 ) Payments Due Currently . . . . . . . . . . . . . . . . . . . . . . . . . . . . . . . . . . . . . . (21,334,777 ) (19,587,267 ) Net Mortgage Notes Payable . . . . . . . . . . . . . . . . . . . . . . . . . . . . . . . $ 770,507,659 $ 754,086,098
Accrued Pension Costs . . . . . . . . . . . . . . . . . . . . . . . . . . . . . . . . . . . . . . . . . 2,334,794 1,338,766 TOTAL LONG-TERM DEBT, LESS CURRENT MATURITIES . . . . . . . . . . . $ 772,842,453 $ 755,424,864
See Notes to Financial Statements
Schedule of Electric PlantDecember 31, 2016
For the Years Ended December 31, 2016 and 2015
Long-Term Debt

2016 Minnkota Annual Report 25
Accumulated Other Patronage Appropriated Comprehensive Members Capital Margins Income (Loss) Total
BALANCE – JANUARY 1, 2015. . . . . . . . $ 1,141 $ 23,934,322 $ 92,959,520 $ (1,307,146 ) $ 115,587,837 Memberships Refunded . . . . . . . . . . . (5 ) (5 ) Operating Loss . . . . . . . . . . . . . . . . . . (2,452,573 ) (2,452,573 ) Nonoperating Margin . . . . . . . . . . . . . 9,952,573 9,952,573 Other Comprehensive Income . . . . . . (506,960 ) (506,960 )
BALANCE – DECEMBER 31, 2015 . . . . . $ 1,136 $ 21,481,749 $ 102,912,093 $ (1,814,106 ) $ 122,580,872
Operating Loss . . . . . . . . . . . . . . . . . . (1,840,507 ) (1,840,507 ) Nonoperating Margin . . . . . . . . . . . . . 11,070,507 11,070,507 Other Comprehensive Income . . . . . . (1,654,330 ) (1,654,330 )
BALANCE – DECEMBER 31, 2016 . . . . . $ 1,136 $ 19,641,242 $ 113,982,600 $ (3,468,436 ) $ 130,156,542
See Notes to Financial Statements
For the Years Ended December 31, 2016 and 2015
Statement of Changes in Equities
NOTE 1: SUMMARY OF SIGNIFICANT ACCOUNTING POLICIES
Nature of Operations. Minnkota Power Cooperative, Inc. (the Cooperative) is a generation and transmission cooperative that was formed on March 28, 1940, under the laws of the State of Minnesota with headquarters in Grand Forks, North Dakota. It operates on a non-prof it cooperative basis and is engaged primarily in the business of providing wholesale electric power to its distribution cooperative member-owners (members). The eleven members purchase power from the Cooperative pursuant to all-requirements wholesale power contracts, which terminate on December 31, 2055.
The Cooperative’s service area is located in northwestern Minnesota and eastern North Dakota. The service territory aggregates approximately 35,000 square miles with a population of approximately 300,000 people.
The Cooperative is subject to the accounting and reporting rules and regulations of the Rural Utilities Service (RUS). The Cooperative follows the Federal Energy Regu-latory Commission’s Uniform System of Accounts prescribed for Class A and B Electric Utilities as modif ied by RUS.
Rates charged to customers are established by the board of directors and are subject to deemed approval by RUS.
As a result of the ratemaking process, the Cooperative applies Accounting Standards Codif ication (ASC) 980 Regulated Operations. The application of generally accepted accounting principles by the cooperative dif fers in certain respects from the application by non-regulated businesses as a result of applying ASC 980. Such dif fer-ences generally related to the time at which certain items enter into the determination of net margins in order to follow the principle of matching costs and revenues.
Electric Plant and Retirements. Electric plant is stated at cost. The cost of additions to electric plant includes contracted work, direct labor and materials and allocable overheads. The cost of units of depreciable property retired is removed from electric plant and charged to accumulated depreciation along with removal costs less salvage. Repairs and the replacement and renewal of items determined to be less than units of property are charged to maintenance expense.
Depreciation. Depreciation is computed using the straight-line method based upon the estimated useful lives of the various classes of property through use of an-nual composite rates.
Allowance for Funds Used During Construction (AFUDC). The allowance for funds used during construction is interest that is capitalized on all construction proj-ects with a budgeted cost of greater than $50,000. AFUDC is classif ied as a reduction of interest expense. The Cooperative capitalized interest of $688,907 and $385,022 as of the years ended December 31, 2016 and 2015, respectively.
Investments. Investments are patronage allocations from cooperatives and other af f iliates stated at cost.
Fair Value Measurements. The Cooperative has determined the fair value of cer-tain assets and liabilities in accordance with generally accepted accounting principles, which provides a framework for measuring fair value.
Fair value is def ined as the exchange price that would be received for an asset or paid to transfer a liability (an exit price) in the principal or most advantageous market for the asset or liability in an orderly transaction between market participants on the measurement date. Valuation techniques should maximize the use of observable inputs and minimize the use of unobservable inputs.
A fair value hierarchy has been established, which prioritizes the valuation inputs into three broad levels. Level 1 inputs consist of quoted prices in active markets for identical assets or liabilities that the reporting entity has the ability to access at the measurement date. Level 2 inputs are inputs other than quoted prices included within Level 1 that are observable for the related asset or liability. Level 3 inputs are unob-servable inputs related to the asset or liability.
The Cooperative does not have any assets or liabilities subject to level 1, 2, or 3 valuation as of December 31, 2016 and 2015 and does not anticipate participating in transactions of this type in the future.
The fair value of the Cooperative’s long-term debt was estimated based upon borrowing rates currently available to the Cooperative for bank loans with similar terms and average maturities. The estimated fair value of the Cooperative’s long-term debt was $901,000,000 and $737,000,000 as of December 31, 2016 and 2015, respectively.
Cash and Cash Equivalents. For purposes of reporting cash f lows, the Coopera-tive considers all highly liquid investments purchased with a maturity of three months or less to be cash equivalents.
Receivables and Credit Policies. Trade receivables are uncollateralized cus-tomer obligations due under normal trade terms requiring payment within 30 days from the billing date. Management has deemed that no late fees or interest charges are as-sessed to the receivables. Management has determined that an allowance for doubtful accounts is not necessary, as all balances are considered fully collectible.
Inventories. Uncovered and undelivered coal inventory was $4,371,676 and $3,460,712 as of December 31, 2016 and 2015, respectively. Uncovered and undeliv-ered coal inventory is stated at FIFO (f irst- in, f irst-out) cost. All other inventories are stated at average cost.
Deferred Debits. Deferred debits consist of deferred pension costs and deferred outage expenses at production facilities and are amortized over future periods to better match the expense with the period the benefit is received. See also Note 6 and Note 10.
Deferred Credits. Deferred credits consist primarily of customer construction prepayments and a revenue deferral as approved by RUS. See also Note 12.
Patronage Capital. The Cooperative operates on a non-prof it basis. Amounts received from the furnishing of electric energy in excess of operating costs and expenses are assigned to patrons on a patronage basis. All other amounts received by the Cooperative from its operations in excess of costs and expenses are also allocated to its patrons on a patronage basis to the extent they are not needed to of fset current or prior losses.
Revenue Recognition. Revenue billings to members include all power delivered to its members for the years ended December 31, 2016 and 2015.
Business and Credit Risk. The Cooperative maintains its cash balances in a locally owned bank. Such balances are insured by the Federal Deposit Insurance Cor-poration up to $250,000. The cash balances exceeded insurance coverage at various times during the f iscal years.
Accounting Estimates. The preparation of the f inancial statements in conformity with accounting principles generally accepted in the United States of America requires management to make estimates and assumptions that af fect the reported amounts of assets and liabilities at the date of the f inancial statements and the reported amounts of revenues and expenses during the reporting period. Actual results could dif fer from those estimates.
Income Taxes. The Cooperative is exempt from income taxes under Section 501(c)(12). The Cooperative is annually required to f ile a Return of Organization Exempt from Income Tax (Form 990) with the IRS.
The Cooperative evaluates its tax positions that have been taken or are expected to be taken on income tax returns to determine if an accrual is necessary for uncertain tax positions. As of December 31, 2016 and 2015, the unrecognized tax benefit accrual was zero. The Cooperative will recognize future accrued interest and penalties related to unrecognized tax benefits in income tax expense if incurred. The Company is no longer subject to Federal tax examinations by tax authorities for years before 2013 and state examinations for years before 2013.
Advertising Costs. Advertising and promotional costs are expensed as incurred.Sales Taxes. The Cooperative calculates sales tax on materials purchased which
is required by the Off ice of State Tax Commissioner and adjusts the amounts when entering the invoices. Additional tax owed or refunded is submitted to the Off ice of State Tax Commissioner on a monthly basis.
Reclassifications. Certain reclassif ications of amounts previously reported have been made to the accompanying f inancial statement to maintain consistency between periods presented. The reclassif ications had no impact on net income or retained earnings.
Subsequent Events. The Cooperative has evaluated subsequent events through February 15, 2017, the date which the f inancial statements were available to be issued.
NOTE 2: SQUARE BUTTE ELECTRIC COOPERATIVE
Square Butte owns a 488-megawatt (MW) steam electric generating plant (Young 2) adjacent to the Cooperative’s 256 MW generating plant (Young 1) near Center, North Dakota.
Minnkota Power Cooperative, Inc., as agent for Square Butte, operates and maintains Young 2.
The long-term power purchase agreement with Square Butte has been evaluated under the accounting guidance for variable interest entities. We have determined that we have no variable interest in the agreement. This conclusion is based on the fact that we do not have both control over activities that are most signif icant to the entity and an obligation to absorb losses or receive benefits from the entity’s per formance. Minnkota Power Cooperative, Inc.’s f inancial exposure related to the agreement is limited to our capacity and energy payments.
On December 30, 2009, the Cooperative, Square Butte and Minnesota Power (MP) completed an agreement in which the Cooperative receives additional energy and capacity from Young 2. Between 2014 and 2026, the Cooperative has the option to acquire MP’s 50% allocation from Young 2. In 2014, the Cooperative exercised this op-
Notes to Financial Statements
26 2016 Minnkota Annual Report
NOTE 3: NORTHERN MUNICIPAL POWER AGENCY
Northern Municipal Power Agency (Northern) is a municipal corporation and a political subdivision of the State of Minnesota. Its membership consists of ten Minne-sota and two North Dakota municipalities each of which owns and operates a municipal electric utility distribution system.
On March 1, 1981, the Cooperative entered into a Power Supply Coordination Agreement with Northern. This agreement is ef fective until the later of December 31, 2031, or the date on which the Coyote Plant is retired from service. All annual debt payments and plant operating cost requirements not provided by Northern’s member revenue and the sale of all capacity and energy in excess of Northern’s member requirements are an obligation of the Cooperative.
Related party transactions include: 2016 2015Purchase of wholesale power $ 17,310,958 $ 15,554,302 Accounts receivable from Northern $ 2,627,128 $ 3,853,868
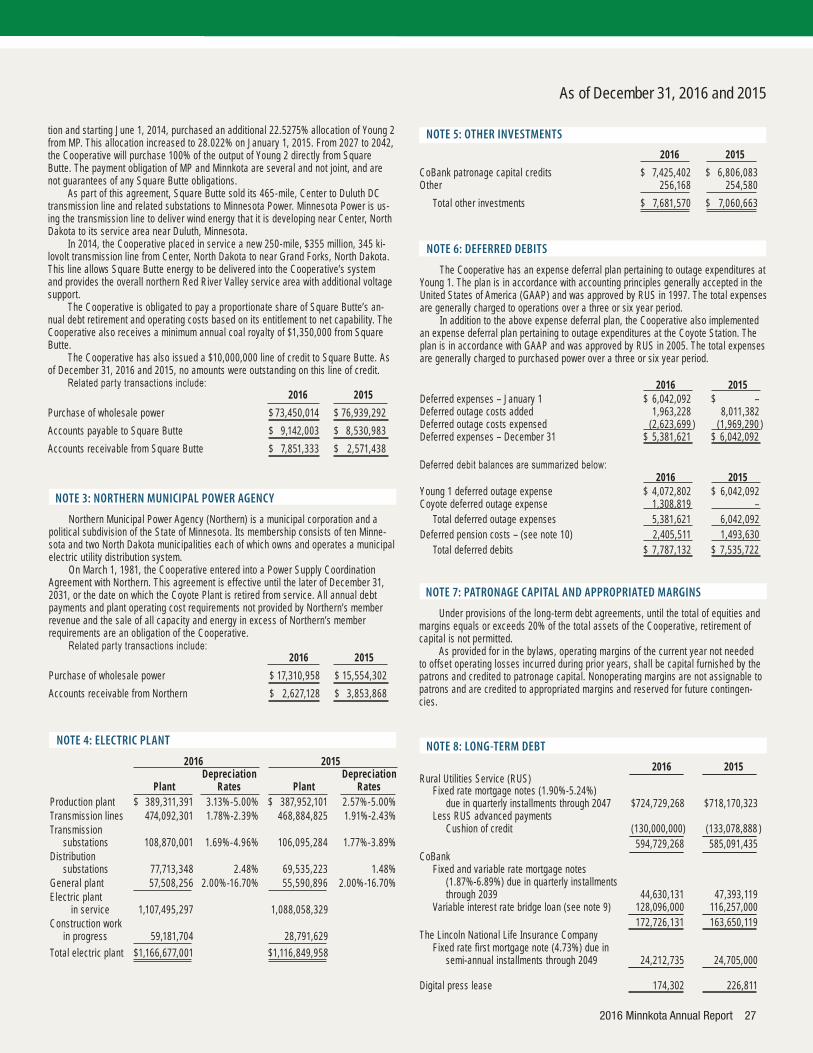
NOTE 6: DEFERRED DEBITS
The Cooperative has an expense deferral plan pertaining to outage expenditures at Young 1. The plan is in accordance with accounting principles generally accepted in the United States of America (GAAP) and was approved by RUS in 1997. The total expenses are generally charged to operations over a three or six year period.
In addition to the above expense deferral plan, the Cooperative also implemented an expense deferral plan pertaining to outage expenditures at the Coyote Station. The plan is in accordance with GAAP and was approved by RUS in 2005. The total expenses are generally charged to purchased power over a three or six year period.
2016 2015Deferred expenses – January 1 $ 6,042,092 $ –Deferred outage costs added 1,963,228 8,011,382Deferred outage costs expensed (2,623,699 ) (1,969,290 ) Deferred expenses – December 31 $ 5,381,621 $ 6,042,092
Deferred debit balances are summarized below: 2016 2015Young 1 deferred outage expense $ 4,072,802 $ 6,042,092Coyote deferred outage expense 1,308,819 – Total deferred outage expenses 5,381,621 6,042,092Deferred pension costs – (see note 10) 2,405,511 1,493,630 Total deferred debits $ 7,787,132 $ 7,535,722
As of December 31, 2016 and 2015
tion and star ting June 1, 2014, purchased an additional 22.5275% allocation of Young 2 from MP. This allocation increased to 28.022% on January 1, 2015. From 2027 to 2042, the Cooperative will purchase 100% of the output of Young 2 directly from Square Butte. The payment obligation of MP and Minnkota are several and not joint, and are not guarantees of any Square Butte obligations.
As part of this agreement, Square Butte sold its 465-mile, Center to Duluth DC transmission line and related substations to Minnesota Power. Minnesota Power is us-ing the transmission line to deliver wind energy that it is developing near Center, North Dakota to its service area near Duluth, Minnesota.
In 2014, the Cooperative placed in service a new 250-mile, $355 million, 345 ki-lovolt transmission line from Center, North Dakota to near Grand Forks, North Dakota. This line allows Square Butte energy to be delivered into the Cooperative’s system and provides the overall northern Red River Valley service area with additional voltage support.
The Cooperative is obligated to pay a proportionate share of Square Butte’s an-nual debt retirement and operating costs based on its entitlement to net capability. The Cooperative also receives a minimum annual coal royalty of $1,350,000 from Square Butte.
The Cooperative has also issued a $10,000,000 line of credit to Square Butte. As of December 31, 2016 and 2015, no amounts were outstanding on this line of credit.
Related party transactions include: 2016 2015Purchase of wholesale power $ 73,450,014 $ 76,939,292 Accounts payable to Square Butte $ 9,142,003 $ 8,530,983 Accounts receivable from Square Butte $ 7,851,333 $ 2,571,438
NOTE 4: ELECTRIC PLANT
2016 2015 Depreciation Depreciation Plant Rates Plant RatesProduction plant $ 389,311,391 3.13%-5.00% $ 387,952,101 2.57%-5.00%Transmission lines 474,092,301 1.78%-2.39% 468,884,825 1.91%-2.43%Transmission substations 108,870,001 1.69%-4.96% 106,095,284 1.77%-3.89%Distribution substations 77,713,348 2.48% 69,535,223 1.48%General plant 57,508,256 2.00%-16.70% 55,590,896 2.00%-16.70%Electric plant in service 1,107,495,297 1,088,058,329Construction work in progress 59,181,704 28,791,629Total electric plant $ 1,166,677,001 $ 1,116,849,958
NOTE 5: OTHER INVESTMENTS
2016 2015CoBank patronage capital credits $ 7,425,402 $ 6,806,083 Other 256,168 254,580 Total other investments $ 7,681,570 $ 7,060,663
NOTE 7: PATRONAGE CAPITAL AND APPROPRIATED MARGINS
Under provisions of the long-term debt agreements, until the total of equities and margins equals or exceeds 20% of the total assets of the Cooperative, retirement of capital is not permitted.
As provided for in the bylaws, operating margins of the current year not needed to of fset operating losses incurred during prior years, shall be capital furnished by the patrons and credited to patronage capital. Nonoperating margins are not assignable to patrons and are credited to appropriated margins and reserved for future contingen-cies.
NOTE 8: LONG-TERM DEBT
2016 2015 Rural Utilities Service (RUS) Fixed rate mortgage notes (1.90%-5.24%) due in quarterly installments through 2047 $ 724,729,268 $ 718,170,323 Less RUS advanced payments Cushion of credit (130,000,000 ) (133,078,888 ) 594,729,268 585,091,435CoBank Fixed and variable rate mortgage notes (1.87%-6.89%) due in quarterly installments through 2039 44,630,131 47,393,119 Variable interest rate bridge loan (see note 9) 128,096,000 116,257,000 172,726,131 163,650,119The Lincoln National Life Insurance Company Fixed rate first mortgage note (4.73%) due in semi-annual installments through 2049 24,212,735 24,705,000
Digital press lease 174,302 226,811
2016 Minnkota Annual Report 27
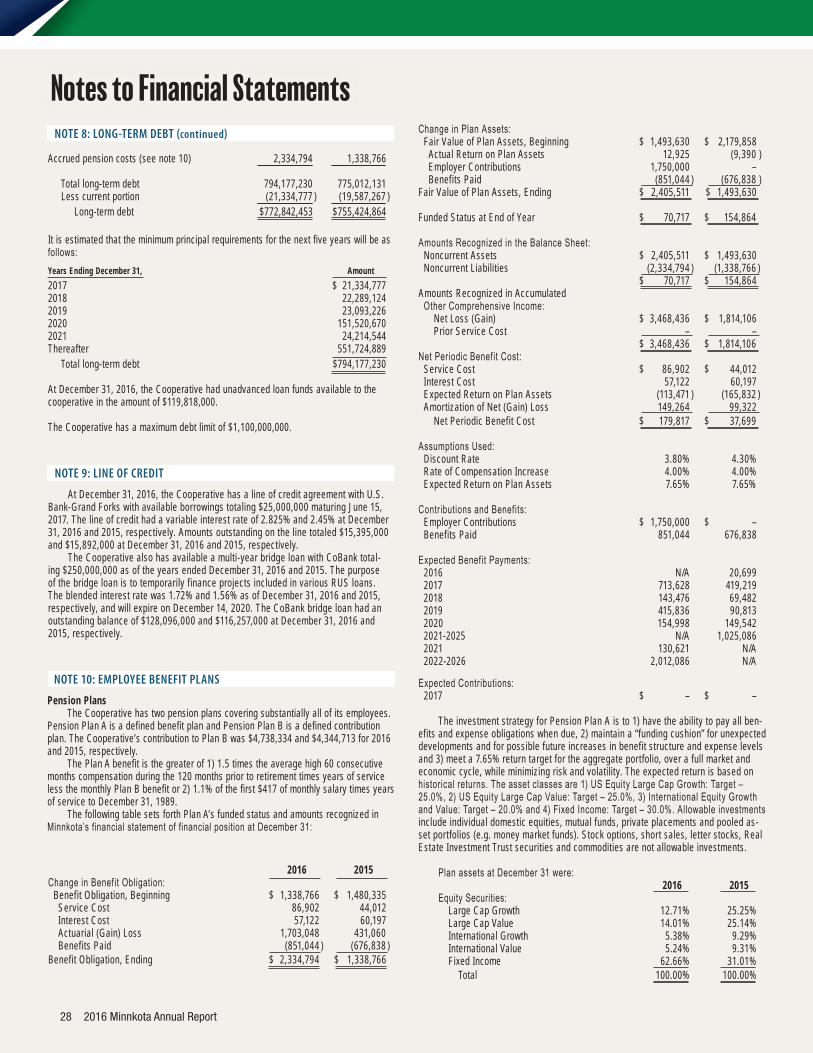
Notes to Financial StatementsNOTE 8: LONG-TERM DEBT (continued)
Accrued pension costs (see note 10) 2,334,794 1,338,766
Total long-term debt 794,177,230 775,012,131 Less current portion (21,334,777 ) (19,587,267 ) Long-term debt $ 772,842,453 $ 755,424,864
It is estimated that the minimum principal requirements for the next five years will be as follows:Years Ending December 31, Amount2017 $ 21,334,7772018 22,289,1242019 23,093,2262020 151,520,6702021 24,214,544Thereafter 551,724,889 Total long-term debt $794,177,230
At December 31, 2016, the Cooperative had unadvanced loan funds available to the cooperative in the amount of $119,818,000.
The Cooperative has a maximum debt limit of $1,100,000,000.
NOTE 9: LINE OF CREDIT
At December 31, 2016, the Cooperative has a line of credit agreement with U.S. Bank-Grand Forks with available borrowings totaling $25,000,000 maturing June 15, 2017. The line of credit had a variable interest rate of 2.825% and 2.45% at December 31, 2016 and 2015, respectively. Amounts outstanding on the line totaled $15,395,000 and $15,892,000 at December 31, 2016 and 2015, respectively.
The Cooperative also has available a multi-year bridge loan with CoBank total-ing $250,000,000 as of the years ended December 31, 2016 and 2015. The purpose of the bridge loan is to temporarily f inance projects included in various RUS loans. The blended interest rate was 1.72% and 1.56% as of December 31, 2016 and 2015, respectively, and will expire on December 14, 2020. The CoBank bridge loan had an outstanding balance of $128,096,000 and $116,257,000 at December 31, 2016 and 2015, respectively.
NOTE 10: EMPLOYEE BENEFIT PLANS
Pension PlansThe Cooperative has two pension plans covering substantially all of its employees.
Pension Plan A is a defined benefit plan and Pension Plan B is a defined contribution plan. The Cooperative’s contribution to Plan B was $4,738,334 and $4,344,713 for 2016 and 2015, respectively.
The Plan A benefit is the greater of 1) 1.5 times the average high 60 consecutive months compensation during the 120 months prior to retirement times years of service less the monthly Plan B benefit or 2) 1.1% of the first $417 of monthly salary times years of service to December 31, 1989.
The following table sets forth Plan A’s funded status and amounts recognized in Minnkota’s financial statement of financial position at December 31:
2016 2015 Change in Benefit Obligation: Benefit Obligation, Beginning $ 1,338,766 $ 1,480,335 Service Cost 86,902 44,012 Interest Cost 57,122 60,197 Actuarial (Gain) Loss 1,703,048 431,060 Benefits Paid (851,044 ) (676,838 )Benefit Obligation, Ending $ 2,334,794 $ 1,338,766
28 2016 Minnkota Annual Report
Change in Plan Assets: Fair Value of Plan Assets, Beginning $ 1,493,630 $ 2,179,858 Actual Return on Plan Assets 12,925 (9,390 ) Employer Contributions 1,750,000 – Benefits Paid (851,044 ) (676,838 )Fair Value of Plan Assets, Ending $ 2,405,511 $ 1,493,630
Funded Status at End of Year $ 70,717 $ 154,864 Amounts Recognized in the Balance Sheet: Noncurrent Assets $ 2,405,511 $ 1,493,630 Noncurrent Liabilities (2,334,794 ) (1,338,766 ) $ 70,717 $ 154,864Amounts Recognized in Accumulated Other Comprehensive Income: Net Loss (Gain) $ 3,468,436 $ 1,814,106 Prior Service Cost – – $ 3,468,436 $ 1,814,106 Net Periodic Benefit Cost: Service Cost $ 86,902 $ 44,012 Interest Cost 57,122 60,197 Expected Return on Plan Assets (113,471 ) (165,832 ) Amortization of Net (Gain) Loss 149,264 99,322 Net Periodic Benefit Cost $ 179,817 $ 37,699 Assumptions Used: Discount Rate 3.80% 4.30% Rate of Compensation Increase 4.00% 4.00% Expected Return on Plan Assets 7.65% 7.65% Contributions and Benefits: Employer Contributions $ 1,750,000 $ – Benefits Paid 851,044 676,838 Expected Benefit Payments: 2016 N/A 20,699 2017 713,628 419,219 2018 143,476 69,482 2019 415,836 90,813 2020 154,998 149,542 2021-2025 N/A 1,025,086 2021 130,621 N/A 2022-2026 2,012,086 N/A
Expected Contributions: 2017 $ – $ –
The investment strategy for Pension Plan A is to 1) have the ability to pay all ben-ef its and expense obligations when due, 2) maintain a “ funding cushion” for unexpected developments and for possible future increases in benefit structure and expense levels and 3) meet a 7.65% return target for the aggregate portfolio, over a full market and economic cycle, while minimizing risk and volatility. The expected return is based on historical returns. The asset classes are 1) US Equity Large Cap Growth: Target – 25.0%, 2) US Equity Large Cap Value: Target – 25.0%, 3) International Equity Growth and Value: Target – 20.0% and 4) Fixed Income: Target – 30.0%. Allowable investments include individual domestic equities, mutual funds, private placements and pooled as-set portfolios (e.g. money market funds). Stock options, short sales, letter stocks, Real Estate Investment Trust securities and commodities are not allowable investments.
Plan assets at December 31 were: 2016 2015 Equity Securities: Large Cap Growth 12.71% 25.25% Large Cap Value 14.01% 25.14% International Growth 5.38% 9.29% International Value 5.24% 9.31% Fixed Income 62.66% 31.01% Total 100.00% 100.00%
As of December 31, 2016 and 2015
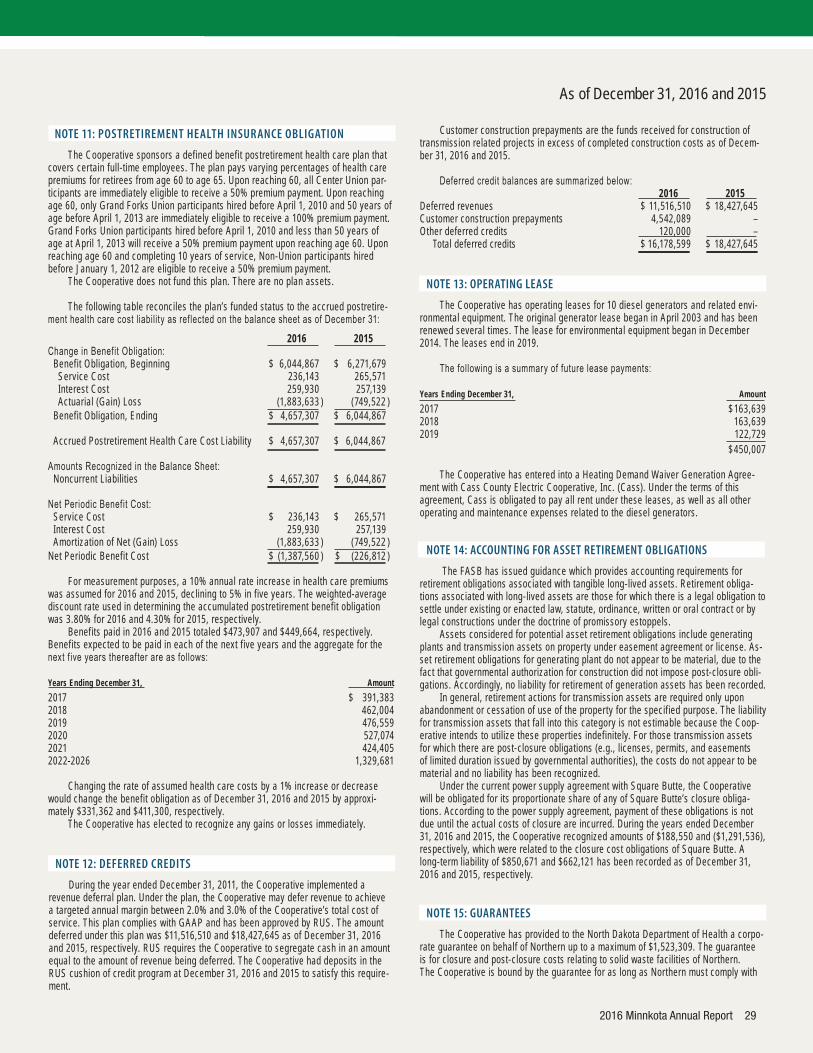
NOTE 11: POSTRETIREMENT HEALTH INSURANCE OBLIGATION
The Cooperative sponsors a defined benefit postretirement health care plan that covers certain full-time employees. The plan pays varying percentages of health care premiums for retirees from age 60 to age 65. Upon reaching 60, all Center Union par-ticipants are immediately eligible to receive a 50% premium payment. Upon reaching age 60, only Grand Forks Union participants hired before April 1, 2010 and 50 years of age before April 1, 2013 are immediately eligible to receive a 100% premium payment. Grand Forks Union participants hired before April 1, 2010 and less than 50 years of age at April 1, 2013 will receive a 50% premium payment upon reaching age 60. Upon reaching age 60 and completing 10 years of service, Non-Union participants hired before January 1, 2012 are eligible to receive a 50% premium payment.
The Cooperative does not fund this plan. There are no plan assets.
The following table reconciles the plan’s funded status to the accrued postretire-ment health care cost liability as ref lected on the balance sheet as of December 31:
2016 2015 Change in Benefit Obligation: Benefit Obligation, Beginning $ 6,044,867 $ 6,271,679 Service Cost 236,143 265,571 Interest Cost 259,930 257,139 Actuarial (Gain) Loss (1,883,633 ) (749,522 ) Benefit Obligation, Ending $ 4,657,307 $ 6,044,867 Accrued Postretirement Health Care Cost Liability $ 4,657,307 $ 6,044,867 Amounts Recognized in the Balance Sheet: Noncurrent Liabilities $ 4,657,307 $ 6,044,867 Net Periodic Benefit Cost: Service Cost $ 236,143 $ 265,571 Interest Cost 259,930 257,139 Amortization of Net (Gain) Loss (1,883,633 ) (749,522 )Net Periodic Benefit Cost $ (1,387,560 ) $ (226,812 )
For measurement purposes, a 10% annual rate increase in health care premiums was assumed for 2016 and 2015, declining to 5% in f ive years. The weighted-average discount rate used in determining the accumulated postretirement benefit obligation was 3.80% for 2016 and 4.30% for 2015, respectively.
Benefits paid in 2016 and 2015 totaled $473,907 and $449,664, respectively. Benefits expected to be paid in each of the next f ive years and the aggregate for the next f ive years thereafter are as follows:
Years Ending December 31, Amount2017 $ 391,3832018 462,0042019 476,5592020 527,0742021 424,4052022-2026 1,329,681
Changing the rate of assumed health care costs by a 1% increase or decrease would change the benefit obligation as of December 31, 2016 and 2015 by approxi-mately $331,362 and $411,300, respectively.
The Cooperative has elected to recognize any gains or losses immediately.
NOTE 12: DEFERRED CREDITS
During the year ended December 31, 2011, the Cooperative implemented a revenue deferral plan. Under the plan, the Cooperative may defer revenue to achieve a targeted annual margin between 2.0% and 3.0% of the Cooperative’s total cost of service. This plan complies with GAAP and has been approved by RUS. The amount deferred under this plan was $11,516,510 and $18,427,645 as of December 31, 2016 and 2015, respectively. RUS requires the Cooperative to segregate cash in an amount equal to the amount of revenue being deferred. The Cooperative had deposits in the RUS cushion of credit program at December 31, 2016 and 2015 to satisfy this require-ment.
2016 Minnkota Annual Report 29
Customer construction prepayments are the funds received for construction of transmission related projects in excess of completed construction costs as of Decem-ber 31, 2016 and 2015.
Deferred credit balances are summarized below: 2016 2015
Deferred revenues $ 11,516,510 $ 18,427,645Customer construction prepayments 4,542,089 –Other deferred credits 120,000 – Total deferred credits $ 16,178,599 $ 18,427,645
NOTE 13: OPERATING LEASE
The Cooperative has operating leases for 10 diesel generators and related envi-ronmental equipment. The original generator lease began in April 2003 and has been renewed several times. The lease for environmental equipment began in December 2014. The leases end in 2019.
The following is a summary of future lease payments:
Years Ending December 31, Amount2017 $ 163,6392018 163,6392019 122,729 $ 450,007
The Cooperative has entered into a Heating Demand Waiver Generation Agree-ment with Cass County Electric Cooperative, Inc. (Cass). Under the terms of this agreement, Cass is obligated to pay all rent under these leases, as well as all other operating and maintenance expenses related to the diesel generators.
NOTE 14: ACCOUNTING FOR ASSET RETIREMENT OBLIGATIONS
The FASB has issued guidance which provides accounting requirements for retirement obligations associated with tangible long-lived assets. Retirement obliga-tions associated with long-lived assets are those for which there is a legal obligation to settle under existing or enacted law, statute, ordinance, writ ten or oral contract or by legal constructions under the doctrine of promissory estoppels.
Assets considered for potential asset retirement obligations include generating plants and transmission assets on property under easement agreement or license. As-set retirement obligations for generating plant do not appear to be material, due to the fact that governmental authorization for construction did not impose post-closure obli-gations. Accordingly, no liability for retirement of generation assets has been recorded.
In general, retirement actions for transmission assets are required only upon abandonment or cessation of use of the property for the specif ied purpose. The liability for transmission assets that fall into this category is not estimable because the Coop-erative intends to utilize these properties indefinitely. For those transmission assets for which there are post-closure obligations (e.g., licenses, permits, and easements of limited duration issued by governmental authorities), the costs do not appear to be material and no liability has been recognized.
Under the current power supply agreement with Square Butte, the Cooperative will be obligated for its proportionate share of any of Square Butte’s closure obliga-tions. According to the power supply agreement, payment of these obligations is not due until the actual costs of closure are incurred. During the years ended December 31, 2016 and 2015, the Cooperative recognized amounts of $188,550 and ($1,291,536), respectively, which were related to the closure cost obligations of Square Butte. A long-term liability of $850,671 and $662,121 has been recorded as of December 31, 2016 and 2015, respectively.
NOTE 15: GUARANTEES
The Cooperative has provided to the North Dakota Department of Health a corpo-rate guarantee on behalf of Northern up to a maximum of $1,523,309. The guarantee is for closure and post-closure costs relating to solid waste facilities of Northern. The Cooperative is bound by the guarantee for as long as Northern must comply with

30 2016 Minnkota Annual Report
Notes to Financial Statements As of December 31, 2016 and 2015
the applicable f inancial assurance requirements for the solid waste facilities. The guarantee may be terminated upon 120 days notice. The Cooperative entered into the guarantee because it was more economical than other f inancial assurance mechanisms such as reserve accounts, trust funds, surety bonds, letters of credit or insurance. If Northern fails to per form closure and/or post-closure of the solid waste facilities in accordance with plans, permits or other interim status requirements, The Cooperative would be required to do so or to establish a trust fund in the amount of the current closure or post-closure cost estimates.
NOTE 16: COMMITMENTS
The Cooperative’s power plant utilizes North Dakota lignite coal, which is being supplied from the Center Mine by BNI. The Cooperative and BNI have a cost-plus contract, which expires in 2037, with an additional 5-year extension at the Coopera-tive’s option.
The Cooperative has various 25-year contracts for the purchase of wind energy. These contracts require the Cooperative to purchase all of the output generated by these wind farms for the term of the contracts which expire between 2032 and 2034.
The year 2015 was the last year of a long-term contract with one of its custom-ers that required the Cooperative to provide 100 megawatts of summer capacity and energy.
The Cooperative participates in federal grant programs, which are governed by various rules and regulations of the grantor agency. Costs charged to the respective grant programs are subject to audit and adjustment by the grantor agency; therefore, to the extent that the Cooperative has not complied with the rules and regulations govern-ing the grants, refunds of any money received may be required.Concentration of Sources of Labor
At December 31, 2016, the Cooperative has approximately 50% of its employees covered by two collective bargaining agreements. The collective bargaining agree-ments for Locals 1593 and 1426 are in force through March 31, 2019 and March 31, 2020, respectively.
Independent Auditor’s Report Report on the Financial Statements
We have audited the accompanying fi nancial statements of Minnkota Power Cooperative, Inc., which comprise the balance sheet as of December 31, 2016, and the related statements of revenues, expenses, and comprehensive income, changes in equities, and cash fl ows for the year then ended, and the related notes to the fi nancial statements.Management’s Responsibility for the Financial Statements
Management is responsible for the preparation and fair presentation of these fi nancial statements in accordance with accounting principles generally accepted in the United States of America; this includes the design, implementation, and maintenance of internal control relevant to the preparation and fair presentation of fi nancial statements that are free from material misstatement, whether due to fraud or error.Auditor’s Responsibility
Our responsibility is to express an opinion on these fi nancial statements based on our audit. We conducted our audits in accordance with auditing standards generally accepted in the United States of America and the standards applicable to fi nancial audits contained in Government Auditing Standards, issued by the Comptroller General of the United States. Those standards require that we plan and perform the audit to obtain reasonable assurance about whether the fi nancial statements are free from material misstatement.
An audit involves performing procedures to obtain audit evidence about the amounts and disclosures in the fi nancial statements. The procedures selected depend on the auditor’s judgment, including the assessment of the risks of material misstatement of the fi nancial statements, whether due to fraud or error. In making those risk assessments, the auditor considers internal control relevant to the entity’s preparation and fair presentation of the fi nancial statements in order to design audit procedures that are appropriate in the circumstances, but not for the purpose of expressing an opinion on the effectiveness of the entity’s internal control. Accordingly, we express no such opinion. An audit also includes evaluating the appropriateness of accounting policies used and the reasonableness of signifi cant accounting estimates made by management, as well as evaluating the overall presentation of the fi nancial statements.
We believe that the audit evidence we have obtained is suffi cient and appropriate to provide a basis for our audit opinion.Opinion
In our opinion, the fi nancial statements referred to above present fairly, in all material respects, the fi nancial position of Minnkota Power Cooperative, Inc. as of December 31, 2016, and the results of its operations and its cash fl ows for the year then ended in accordance with accounting principles generally accepted in the United States of America.Other Matter
The fi nancial statements of Minnkota Power Cooperative, Inc. as of December 31, 2015, were audited by other auditors, whose report dated February 15, 2016, expressed an unmodifi ed opinion on those statements.Other Reporting Required by Government Auditing Standards
In accordance with Government Auditing Standards, we have also issued our report dated February 15, 2017 on our consideration of Minnkota Power Cooperative, Inc.’s internal control over fi nancial reporting and our tests of its compliance with certain provisions of laws, regulations, contracts and grant agreements and other matters. The purpose of that report is to describe the scope of our testing of internal control over fi nancial reporting and compliance and the results of that testing, and not to provide an opinion on the internal control over fi nancial reporting or on compliance. That report is an integral part of an audit performed in accor-dance with Government Auditing Standards and should be read in conjunction with this report in considering the results of our audit. Eide Bailly, LLPFargo, North DakotaFebruary 15, 2017
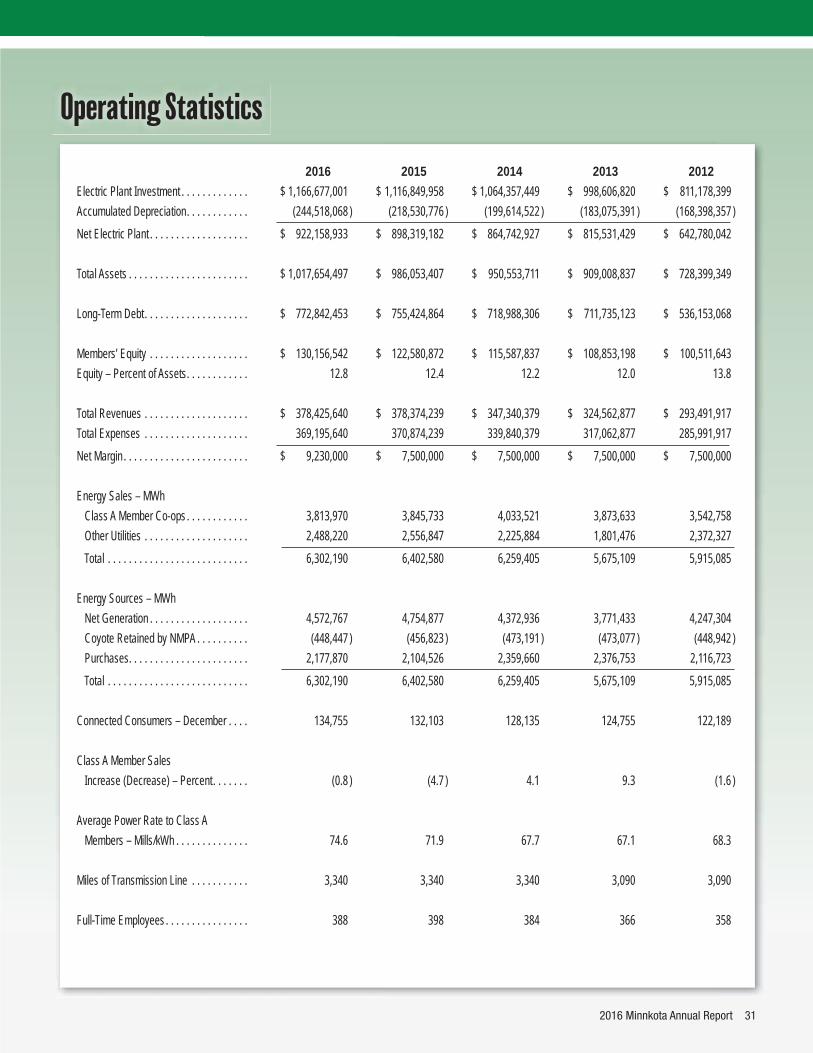
Operating Statistics
2016 2015 2014 2013 2012 Electric Plant Investment . . . . . . . . . . . . . $ 1,166,677,001 $ 1,116,849,958 $ 1,064,357,449 $ 998,606,820 $ 811,178,399 Accumulated Depreciation . . . . . . . . . . . . (244,518,068 ) (218,530,776 ) (199,614,522 ) (183,075,391 ) (168,398,357 )Net Electric Plant . . . . . . . . . . . . . . . . . . . $ 922,158,933 $ 898,319,182 $ 864,742,927 $ 815,531,429 $ 642,780,042
Total Assets . . . . . . . . . . . . . . . . . . . . . . . $ 1,017,654,497 $ 986,053,407 $ 950,553,711 $ 909,008,837 $ 728,399,349
Long-Term Debt . . . . . . . . . . . . . . . . . . . . $ 772,842,453 $ 755,424,864 $ 718,988,306 $ 711,735,123 $ 536,153,068
Members’ Equity . . . . . . . . . . . . . . . . . . . $ 130,156,542 $ 122,580,872 $ 115,587,837 $ 108,853,198 $ 100,511,643 Equity – Percent of Assets . . . . . . . . . . . . 12.8 12.4 12.2 12.0 13.8
Total Revenues . . . . . . . . . . . . . . . . . . . . $ 378,425,640 $ 378,374,239 $ 347,340,379 $ 324,562,877 $ 293,491,917 Total Expenses . . . . . . . . . . . . . . . . . . . . 369,195,640 370,874,239 339,840,379 317,062,877 285,991,917 Net Margin . . . . . . . . . . . . . . . . . . . . . . . . $ 9,230,000 $ 7,500,000 $ 7,500,000 $ 7,500,000 $ 7,500,000
Energy Sales – MWh Class A Member Co-ops . . . . . . . . . . . . 3,813,970 3,845,733 4,033,521 3,873,633 3,542,758 Other Utilities . . . . . . . . . . . . . . . . . . . . 2,488,220 2,556,847 2,225,884 1,801,476 2,372,327 Total . . . . . . . . . . . . . . . . . . . . . . . . . . . 6,302,190 6,402,580 6,259,405 5,675,109 5,915,085
Energy Sources – MWh Net Generation . . . . . . . . . . . . . . . . . . . 4,572,767 4,754,877 4,372,936 3,771,433 4,247,304 Coyote Retained by NMPA . . . . . . . . . . (448,447 ) (456,823 ) (473,191 ) (473,077 ) (448,942 ) Purchases . . . . . . . . . . . . . . . . . . . . . . . 2,177,870 2,104,526 2,359,660 2,376,753 2,116,723 Total . . . . . . . . . . . . . . . . . . . . . . . . . . . 6,302,190 6,402,580 6,259,405 5,675,109 5,915,085
Connected Consumers – December . . . . 134,755 132,103 128,135 124,755 122,189
Class A Member Sales Increase (Decrease) – Percent . . . . . . . (0.8 ) (4.7 ) 4.1 9.3 (1.6 )
Average Power Rate to Class A Members – Mills/kWh . . . . . . . . . . . . . . 74.6 71.9 67.7 67.1 68.3
Miles of Transmission Line . . . . . . . . . . . 3,340 3,340 3,340 3,090 3,090
Full-Time Employees . . . . . . . . . . . . . . . . 388 398 384 366 358
2016 Minnkota Annual Report 31

Red River Valley CooperativePower AssociationHALSTAD, MINNESOTA
Board of DirectorsRoger Krostue, Chairman . . . . . . . . . . . . . . . . . . . . . . . . . . Fisher, MNMarvis Thompson, Vice Chairman . . . . . . . . . . . . . . . . . . . . Perley, MNTrevor Sorby, Secretary-Treasurer. . . . . . . . . . . . . . . . . . Glyndon, MNKay Green . . . . . . . . . . . . . . . . . . . . . . . . . . . . . . . . . . . . . . . . Ada, MNSarah Tommerdahl . . . . . . . . . . . . . . . . . . . . . . . . . . . . .Hendrum, MNNeil Wieser . . . . . . . . . . . . . . . . . . . . . . . . . . . . . . . . . . Moorhead, MNStaffLauren Brorby . . . . . . . . . . . . . . . . . . . . . . . . . . . . . . . . . . . . . . . . CEORich Whitcomb . . . . . . . . . . . . . . . Member Services/Marketing DirectorGary Shulstad . . . . . . . . . . . . . . . . . . . . . . . . . . . . . . . . . . . . .EngineerJim Shelquist, Jr. . . . . . . . . . . . . . . . . . . . . . . . . . . Line Superintendent
Cass County Electric Cooperative Inc.FARGO, NORTH DAKOTA
Board of DirectorsWendy Loucks, Chairman . . . . . . . . . . . . . . . . . . . . . . . . . . .Fargo, NDRussell Berg, Vice Chairman . . . . . . . . . . . . . . . . . . . . . . . .Horace, NDMarcy Svenningsen, Secretary . . . . . . . . . . . . . . . . . . . Valley City, NDJeff Triebold, Treasurer . . . . . . . . . . . . . . . . . . . . . . . . . . . . .Fargo, NDDouglas Anderson . . . . . . . . . . . . . . . . . . . . . . . . . . . . . . . . .Arthur, NDSid Berg . . . . . . . . . . . . . . . . . . . . . . . . . . . . . . . . . . . . . . . . Colfax, NDJohn Froelich . . . . . . . . . . . . . . . . . . . . . . . . . . . . . . . . . Valley City, NDGlenn Mitzel . . . . . . . . . . . . . . . . . . . . . . . . . . . . . . . . . West Fargo, NDSteve Swiontek . . . . . . . . . . . . . . . . . . . . . . . . . . . . . . . . . . .Fargo, NDStaffMarshal Albright . . . . . . . . . . . . . . . . . . . . . . . . . . . . . President & CEOJodi Bullinger . . . . . . . . . . . . . . . . . . . . . V.P. Engineering & OperationsTim Sanden . . . . . . . . . . . . . . . . . . . V.P. Information Technology/CIOChad Sapa . . . . . . . . . . . . . . . . . . . . . . . . V.P. Corporate Services/CFOPaul Matthys . . . . . . . . . . . . . . . . . . . .V.P. Member & Energy Services
Beltrami Electric Cooperative, Inc.BEMIDJI, MINNESOTABoard of DirectorsRick Coe, President . . . . . . . . . . . . . . . . . . . . . . . . . . . . . . Bemidji, MNJohn Lund, Vice President . . . . . . . . . . . . . . . . . . . . . . . . . Bemidji, MNMurl Nord, Secretary . . . . . . . . . . . . . . . . . . . . . . . . . . . Blackduck, MNJudy Honer, Treasurer . . . . . . . . . . . . . . . . . . . . . . . . . . . . Laporte, MNSue Kringen . . . . . . . . . . . . . . . . . . . . . . . . . . . . . . . . . . . . Bemidji, MNJerry Larson . . . . . . . . . . . . . . . . . . . . . . . . . . . . . . . . . . . . . .Hines, MNCharlie Parson . . . . . . . . . . . . . . . . . . . . . . . . . . . . . . . . . Puposky, MNLea Perkins . . . . . . . . . . . . . . . . . . . . . . . . . . . . . . . . . . . Puposky, MNRobert Wallner . . . . . . . . . . . . . . . . . . . . . . . . . . . . . . . . Blackduck, MNStaffJared Echternach . . . . . . . . . . . . . . . . . . . . . . . . . . . . . . . . . . . . . . CEODan Edens . . . . . . . . . . . . . . . . . . . . . . . . . . . . .Manager of OperationsSam Mason . . . . . . . . . . . . . . Manager of Energy Services & FacilitiesJolene Kallroos . . . . . . . . . . . . . . . . . . . Manager of Member ServicesChris Kelsey. . . . . . . . . . . . . . . . . . . . Manager of Information ServicesRich Riewer . . . . . . . . . . . . . . . . . . . . . . . . . . . Manager of EngineeringSidney Sletten . . . . . . . . . . . . .Director of Finance & Member ServicesArlene Hogquist . . . . . . . . . . Director of Strategy & Corporate ServicesRandy Dahle . . . . . . . . . . . . . . . . . . . . . . . . . . . . . Line Superintendent
Nodak Electric Cooperative, Inc.GRAND FORKS, NORTH DAKOTA
Board of DirectorsPaul Sigurdson, Chairman . . . . . . . . . . . . . . . . . . . . . . . Edinburg, NDLuther Meberg, Vice Chairman . . . . . . . . . . . . . . . . . . . Park River, NDLes Windjue, Secretary-Treasurer . . . . . . . . . . . . . . . . Devils Lake, NDDavid Hagert . . . . . . . . . . . . . . . . . . . . . . . . . . . . . . . Grand Forks, NDDavid Kent . . . . . . . . . . . . . . . . . . . . . . . . . . . . . . . . . . . . . Hatton, NDDoug Lund . . . . . . . . . . . . . . . . . . . . . . . . . . . . . . . . . . . . . . .Aneta, NDLee McLaughlin . . . . . . . . . . . . . . . . . . . . . . . . . . . . . . . . . . Lankin, NDPeter Naastad . . . . . . . . . . . . . . . . . . . . . . . . . . . . . . . . . . . Hatton, NDSteve Smaaladen . . . . . . . . . . . . . . . . . . . . . . . . . . . . . . . . .Aneta, NDStaffMylo Einarson . . . . . . . . . . . . . . . . . . . . . . . . . . . . . . President & CEOTom Edwards . . . . . . . . . . . . . . . . . . . . Accounting & Finance ManagerBlaine Rekken . . . . . . . . . . . . . . . . Member/Energy Services ManagerSteve Breidenbach . . . . . . . . . . . . . . . . . . . . . . . Engineering ManagerDan Schaefer . . . . . . . . . . . . . . . . . . . . . . . . . . . . . Line Superintendent
Red Lake Electric Cooperative, Inc.RED LAKE FALLS, MINNESOTA
Board of DirectorsBonnie Christians, President . . . . . . . . . . . . . . . . . . . . . Crookston, MNRandy Versdahl, Vice President . . . . . . . . . . . . . . Red Lake Falls, MNMark Hanson, Secretary-Treasurer . . . . . . . . . . . Thief River Falls, MNStacy Blawat . . . . . . . . . . . . . . . . . . . . . . . . . . . . Thief River Falls, MNAaron Chervestad . . . . . . . . . . . . . . . . . . . . . . . . . . . . . . . . Oklee, MNRobert Finstad . . . . . . . . . . . . . . . . . . . . . . . . . . . Thief River Falls, MNColette Kujava . . . . . . . . . . . . . . . . . . . . . . . . . . . . . . . .Newfolden, MNSteve Linder. . . . . . . . . . . . . . . . . . . . . . . . . . . . . . . . . . . . . Oklee, MNPeter Mosbeck . . . . . . . . . . . . . . . . . . . . . . . . . . . . Red Lake Falls, MNStaffRoger Johanneck . . . . . . . . . . . . . . . . . . . . . . . . . . . . General ManagerShirley Bregier . . . . . . . . . . . . . . .Manager of Finance & AdministrationSteve Conely . . . . . . . . . . . . . . Manager of Electric System OperationsKelli Brateng . . . . . . . . . . . . . . . . . . . . . Manager of Member Services
Clearwater-Polk Electric Cooperative, Inc.BAGLEY, MINNESOTA
Board of DirectorsLeroy Riewer, President . . . . . . . . . . . . . . . . . . . . . . . . . . . .Bagley, MNVernon Hamnes, Vice President . . . . . . . . . . . . . . . . . . . .Gonvick, MNRobert A. Johnson, Secretary . . . . . . . . . . . . . . . . . . . . . . .Bagley, MNHarlan Highberg, Treasurer . . . . . . . . . . . . . . . . . . . . . . . . .Bagley, MNKeith DeMaris . . . . . . . . . . . . . . . . . . . . . . . . . . . . . . . . . . Shevlin, MNGary Mathis . . . . . . . . . . . . . . . . . . . . . . . . . . . . . . . . . . . .Gonvick, MNGreg Spaulding . . . . . . . . . . . . . . . . . . . . . . . . . . . . . . . . . .Bagley, MNStaffBruce Bjerke . . . . . . . . . . . . . . . . . . . . . . . . . . . . . . . General ManagerDebbie Olson . . . . . . . . . . . . . . . . . . . . . . . . . . . . . . . . .Offi ce ManagerTodd Waggoner . . . . . . . . . . . . . . . . . . . . . . . . . . .Operations ManagerJoel Rendahl . . . . . . . . . . . . . . . . . . . . . . . . Member Services Director
Associated Cooperative Boards and Management
32 2016 Minnkota Annual Report

CassCounty
PKM
RedRiver
C-Polk
WildRice
RedLake
NorthStar
RoseauCavalier
NodakBeltrami
North Star Electric Cooperative, Inc.BAUDETTE, MINNESOTA
Board of DirectorsSteve Arnesen, President . . . . . . . . . . . . . . . . . . . . . . . Roosevelt, MNMichael Hanson, Vice President . . . . . . . . . . . . . . . . . . . Baudette, MNLorraine Nygaard, Secretary-Treasurer . . . . . . . . . . . . . . Big Falls, MNRandy Bergan . . . . . . . . . . . . . . . . . . . . . . . . . . . . . . . . . Williams, MNJulian Brzoznowski . . . . . . . . . . . . . . . . . . . . . . . . . . . . . . . . . .Orr, MNThomas Smith . . . . . . . . . . . . . . . . . . . . . . . . . . International Falls, MNMike Trueman . . . . . . . . . . . . . . . . . . . . . . . . . . . . . . . . . Williams, MNStaffAnn Ellis . . . . . . . . . . . . . . . . . . . . . . . . . . . . . . . . . . . General ManagerRobyn Sonstegard . . . . . . . . . . . .Manager of Finance & AdministrationWayne Haukaas . . . . . . . . Manager of Member Services & ComplianceMarty Mollberg . . . . . . . . . . . . . . . . . . . . . . . . . .Manager of Operations
PKM Electric Cooperative, Inc.WARREN, MINNESOTA
Board of DirectorsTom Woinarowicz, President . . . . . . . . . . . . . . . . . . . . . . Stephen, MNMichael Beaudry, Vice President . . . . . . . . . . . . . . . . . . . Alvarado, MNGordon Bernstrom, Secretary-Treasurer . . . . . . . . . . . . Lancaster, MNPaul Aakre . . . . . . . . . . . . . . . . . . . . . . . . . . . . . . . . . . . . . . Angus, MNJeffrey Folland . . . . . . . . . . . . . . . . . . . . . . . . . . . . . . . . . . . Halma, MNSteve Goodwin . . . . . . . . . . . . . . . . . . . . . . . . . . . . . . . . . . Angus, MNMark Hatton . . . . . . . . . . . . . . . . . . . . . . . . . . . . . . . . . . . . Drayton, NDWayne Malm . . . . . . . . . . . . . . . . . . . . . . . . . . . . . . . . . . . . Argyle, MNBlake Owens . . . . . . . . . . . . . . . . . . . . . . . . . . . . . . . . . . . Warren, MNStaffCharles Riesen . . . . . . . . . . . . . . . . . . . . . . . . . . . . . . . . . . . ManagerMike Schmidt . . . . . . . . . . . . . . . . . . . . . . . . . . . . . . Assistant ManagerRick Bye . . . . . . . . . . . . . . . . . . . . . . . . . . . . . .Manager of OperationsJeff Rustad . . . . . . . . . . . . . . . . . . . . . . . Manager of Member Services
Roseau Electric Cooperative, Inc. ROSEAU, MINNESOTA
Board of DirectorsCurtis Hukee, Chairman. . . . . . . . . . . . . . . . . . . . . . . . . . . Badger, MNMark Sax, Vice Chairman . . . . . . . . . . . . . . . . . . . . . . . . . . Grygla, MNCollin Jensen, Secretary-Treasurer . . . . . . . . . . . . . . . . . . Roseau, MNRoger Amundson . . . . . . . . . . . . . . . . . . . . . . . . . . . . . . . . Roseau, MNShawn Gust . . . . . . . . . . . . . . . . . . . . . . . . . . . . . . . . . Strathcona, MNJames Hallan . . . . . . . . . . . . . . . . . . . . . . . . . . . . . . . . . . Warroad, MNWes McFarlane . . . . . . . . . . . . . . . . . . . . . . . . . . . . . . . . Warroad, MNDale Moser . . . . . . . . . . . . . . . . . . . . . . . . . . . . . . . . . . . . . . Salol, MNJoe Tesarek . . . . . . . . . . . . . . . . . . . . . . . . . . . . . . . . . . . . Badger, MNStaffTracey Stoll . . . . . . . . . . . . . . . . . . . . . . . . . . . . . . . . General ManagerRyan Severson . . . . . . . . . . . . . . . . . . . . . . . . . . . . Assistant ManagerStephanie Johnson . . . . . . . . . . . . . . . . . . . . . . . . . . . .Offi ce ManagerMike Millner . . . . . . . . . . . . . . . . . . . . . . . . . . . . . . Line SuperintendentJeremy Lindemann . . . . . . . . . . . . . . . . . . . Member Services Director
Wild Rice Electric Cooperative, Inc. MAHNOMEN, MINNESOTA
Board of DirectorsJeff Nornes, Chairman . . . . . . . . . . . . . . . . . . . . . . . . . . . . Erskine, MNRussell Okeson, Vice Chairman . . . . . . . . . . . . . . . .Detroit Lakes, MNMark Habedank, Secretary . . . . . . . . . . . . . . . . . . . . . Twin Valley, MNLarry Sollie, Treasurer . . . . . . . . . . . . . . . . . . . . . . . . . . . .Fosston, MNGary Bergan . . . . . . . . . . . . . . . . . . . . . . . . . . . . . . . . . . . Hawley, MNDiane Christianson . . . . . . . . . . . . . . . . . . . . . . . . . . . . . . .Mentor, MNMike Guetter . . . . . . . . . . . . . . . . . . . . . . . . . . . . . . .Detroit Lakes, MNGreg LaVoy . . . . . . . . . . . . . . . . . . . . . . . . . . . . . . . Naytahwaush, MNRoger Winter . . . . . . . . . . . . . . . . . . . . . . . . . . . . . . . . . . Callaway, MNStaffSteven Haaven . . . . . . . . . . . . . . . . . . . . . . . . . . . . . President & CEODuane Gunderson . . . . . . . . . . . . Director of Finance & Administration Thomas Houdek . . . . . . . Member Services/Communications DirectorDave Thronson . . . . . . . . . . . . . . . . . . . . . . . . . Director of Operations
Cavalier Rural Electric Cooperative, Inc.LANGDON, NORTH DAKOTA
Board of DirectorsAnthony Ottem, President . . . . . . . . . . . . . . . . . . . . . . . . . . .Milton, NDJohn Martinson, Vice President . . . . . . . . . . . . . . . . . . . . . Edmore, NDSteve Hart, Secretary-Treasurer . . . . . . . . . . . . . . . . . . . . . Wales, NDTim Devine . . . . . . . . . . . . . . . . . . . . . . . . . . . . . . . . . . . Langdon, NDDel Gage . . . . . . . . . . . . . . . . . . . . . . . . . . . . . . . . . . . . . . . Sarles, NDOwen Goeser . . . . . . . . . . . . . . . . . . . . . . . . . . . . . . . . Devils Lake, NDDonald Skjervheim . . . . . . . . . . . . . . . . . . . . . . . . . . . . . Langdon, NDStaffDuane Otto . . . . . . . . . . . . . . . . . . . . . . . . . . . . . . . . . . . . . . . ManagerKerry Mikkelsen . . . . . . . . . . . . . . . . . . . . . . . . . . . Line SuperintendentVal Darling . . . . . . . . . . . . . . . . . . . . . . . . . . . . . . . . . . .Offi ce Manager
2016 Minnkota Annual Report 33

Clearwater- Beltrami Cass Cavalier Polk Nodak
Balance SheetTotal Electric Plant $142,171,687 $ 254,628,744 $ 18,569,906 $25,553,575 $ 154,797,647 Accumulated Depreciation 41,182,113 61,860,134 6,924,157 8,663,610 53,972,273 Net Electric Plant $100,989,574 $192,768,610 $11,645,749 $16,889,965 $ 100,825,374 Current and Accrued Assets 9,818,028 34,337,934 2,332,046 1,778,602 16,399,349 Other Assets 11,692,756 18,596,557 1,559,274 1,873,383 8,784,006 Total Assets $122,500,358 $245,703,101 $15,537,069 $20,541,950 $ 126,008,729
Total Equity $ 43,601,889 $ 97,026,103 $ 6,037,460 $ 10,787,506 $ 47,733,706 Long-Term Debt 65,913,087 120,428,083 8,573,073 7,701,192 55,062,915 Other Liabilities and Credits 12,985,382 28,248,915 926,536 2,053,252 23,212,108 Total Liabilities and Equity $122,500,358 $ 245,703,101 $ 15,537,069 $ 20,541,950 $ 126,008,729
Operations Operating Revenue $ 52,010,349 $121,241,581 $ 4,917,096 $ 9,006,841 $ 95,581,108 Purchased Power 36,405,749 88,808,104 2,852,273 5,813,203 80,855,316 Other Operating Expenses 8,496,133 15,152,510 1,266,963 1,772,533 8,140,025 Depreciation 3,533,130 6,925,816 470,386 681,354 4,023,800 Interest 2,695,200 4,471,299 230,327 296,303 2,451,730 Total Cost of Electric Service $ 51,130,212 $115,357,729 $ 4,819,949 $ 8,563,393 $ 95,470,871 Operating Margin $ 880,137 $ 5,883,852 $ 97,147 $ 443,448 $ 110,237 Nonoperating Margin 631,079 1,090,587 34,907 66,469 813,365 Total Margin $ 1,511,216 $ 6,974,439 $ 132,054 $ 509,917 $ 923,602
Consumers – End of Year Residential 19,464 41,962 1,361 4,113 19,018 Residential – Seasonal 0 0 0 0 0 Commercial and Other 1,423 5,643 124 254 499 Total 20,887 47,605 1,485 4,367 19,517 Increase (Decrease) – Percent 0.9% 5.0% (1.1% (0.8% 1.9%
Energy Sales – kWh Residential 273,175,863 550,341,360 25,012,845 58,118,135 371,093,470 Residential – Seasonal 0 0 0 0 0 Commercial and Other 192,230,448 610,771,805 7,374,780 10,154,676 686,385,389 Total 465,406,311 1,161,113,165 32,387,625 68,272,811 1,057,478,859 Increase (Decrease) – Percent 2.6% 1.7% (0.5% (2.2% (2.3%
Miscellaneous kWh Consumption/Resident/Month 1,170 1,093 1,532 1,178 1,626 Miles of Line 3,467 5,521 1,321 1,498 8,139 Consumers/Miles of Line 6.02 8.62 1.12 2.92 2.40 Number of Employees 65 93 13 15 64 Average Rate – Residential – (¢/kWh) 12.68 11.38 15.09 13.28 11.26
Associated Cooperative Statistics
) ) )
) )
34 2016 Minnkota Annual Report
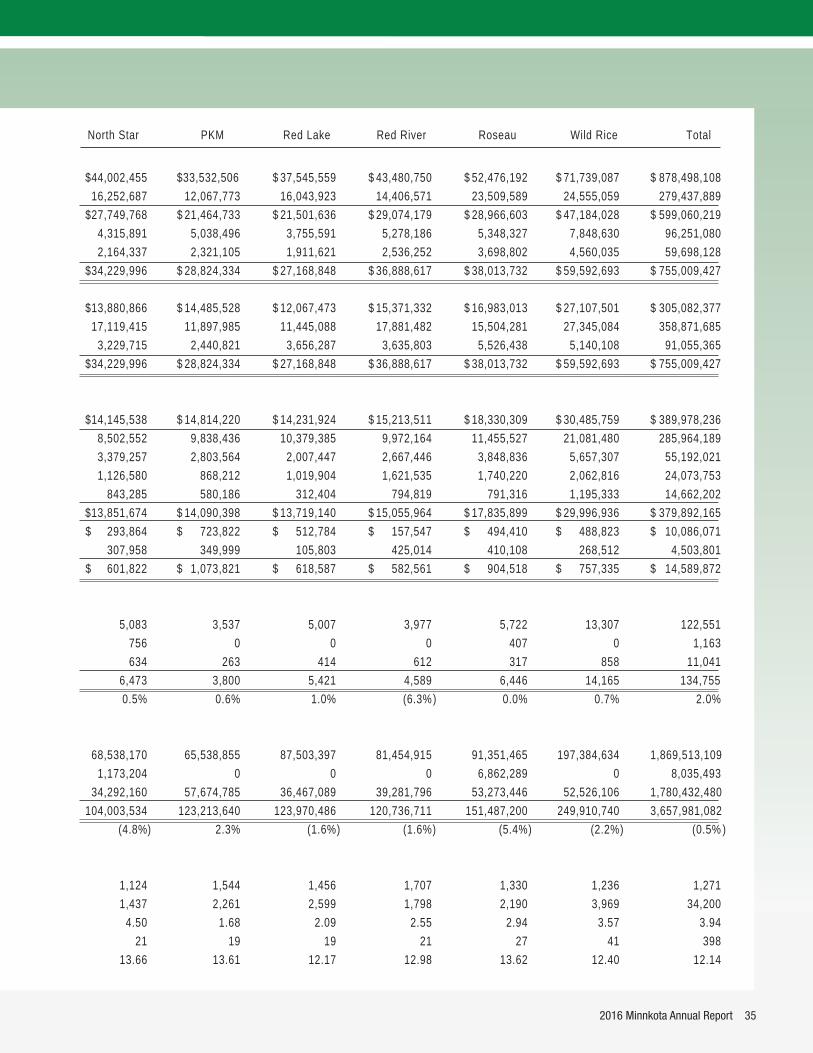
North Star PKM Red Lake Red River Roseau Wild Rice Total
$44,002,455 $33,532,506 $ 37,545,559 $ 43,480,750 $ 52,476,192 $ 71,739,087 $ 878,498,108 16,252,687 12,067,773 16,043,923 14,406,571 23,509,589 24,555,059 279,437,889 $27,749,768 $ 21,464,733 $ 21,501,636 $ 29,074,179 $ 28,966,603 $ 47,184,028 $ 599,060,219 4,315,891 5,038,496 3,755,591 5,278,186 5,348,327 7,848,630 96,251,080 2,164,337 2,321,105 1,911,621 2,536,252 3,698,802 4,560,035 59,698,128 $34,229,996 $ 28,824,334 $ 27,168,848 $ 36,888,617 $ 38,013,732 $ 59,592,693 $ 755,009,427 $13,880,866 $ 14,485,528 $ 12,067,473 $ 15,371,332 $ 16,983,013 $ 27,107,501 $ 305,082,377 17,119,415 11,897,985 11,445,088 17,881,482 15,504,281 27,345,084 358,871,685 3,229,715 2,440,821 3,656,287 3,635,803 5,526,438 5,140,108 91,055,365 $34,229,996 $ 28,824,334 $ 27,168,848 $ 36,888,617 $ 38,013,732 $ 59,592,693 $ 755,009,427 $14,145,538 $ 14,814,220 $ 14,231,924 $ 15,213,511 $ 18,330,309 $ 30,485,759 $ 389,978,236 8,502,552 9,838,436 10,379,385 9,972,164 11,455,527 21,081,480 285,964,189 3,379,257 2,803,564 2,007,447 2,667,446 3,848,836 5,657,307 55,192,021 1,126,580 868,212 1,019,904 1,621,535 1,740,220 2,062,816 24,073,753 843,285 580,186 312,404 794,819 791,316 1,195,333 14,662,202 $13,851,674 $ 14,090,398 $ 13,719,140 $ 15,055,964 $ 17,835,899 $ 29,996,936 $ 379,892,165 $ 293,864 $ 723,822 $ 512,784 $ 157,547 $ 494,410 $ 488,823 $ 10,086,071 307,958 349,999 105,803 425,014 410,108 268,512 4,503,801 $ 601,822 $ 1,073,821 $ 618,587 $ 582,561 $ 904,518 $ 757,335 $ 14,589,872 5,083 3,537 5,007 3,977 5,722 13,307 122,551 756 0 0 0 407 0 1,163 634 263 414 612 317 858 11,041 6,473 3,800 5,421 4,589 6,446 14,165 134,755 0.5% 0.6% 1.0% (6.3% 0.0% 0.7% 2.0% 68,538,170 65,538,855 87,503,397 81,454,915 91,351,465 197,384,634 1,869,513,109 1,173,204 0 0 0 6,862,289 0 8,035,493 34,292,160 57,674,785 36,467,089 39,281,796 53,273,446 52,526,106 1,780,432,480 104,003,534 123,213,640 123,970,486 120,736,711 151,487,200 249,910,740 3,657,981,082 (4.8% 2.3% (1.6% (1.6% (5.4% (2.2% (0.5% 1,124 1,544 1,456 1,707 1,330 1,236 1,271 1,437 2,261 2,599 1,798 2,190 3,969 34,200 4.50 1.68 2.09 2.55 2.94 3.57 3.94 21 19 19 21 27 41 398 13.66 13.61 12.17 12.98 13.62 12.40 12.14
) ) ) ) ) )
)
2016 Minnkota Annual Report 35
P.O. Box 13200 Grand Forks, ND 58208-3200 Phone (701) 795-4000www.minnkota.com
Connect with us:
Minnkota.com
Like us on Facebook
Follow us on Twitter
View the annual report online