powering new york’s future new york’s future ... 13.8 to 22.0 kv) transmission substation ......
TRANSCRIPT

1
Con EdisonPowering New York’s Future
Technical Conference June 18, 2008

2
Outline
• Con Edison Service Area
• Major Elements of Rate Filing
• Capital Investment Summary
• Rate Mitigation

3
Unique Service Territory
• Con Edison Service Territory represents 1.3% of NY State Area
• Con Edison expects to deliver 40.7% of NY State 2008 peak demand
47,214 Square Miles
604 Square Miles

4
8 Million
8.4 Million
8.7 Million
9.1 Million
2000 2010 2020 2030
Unique Service Territory
5
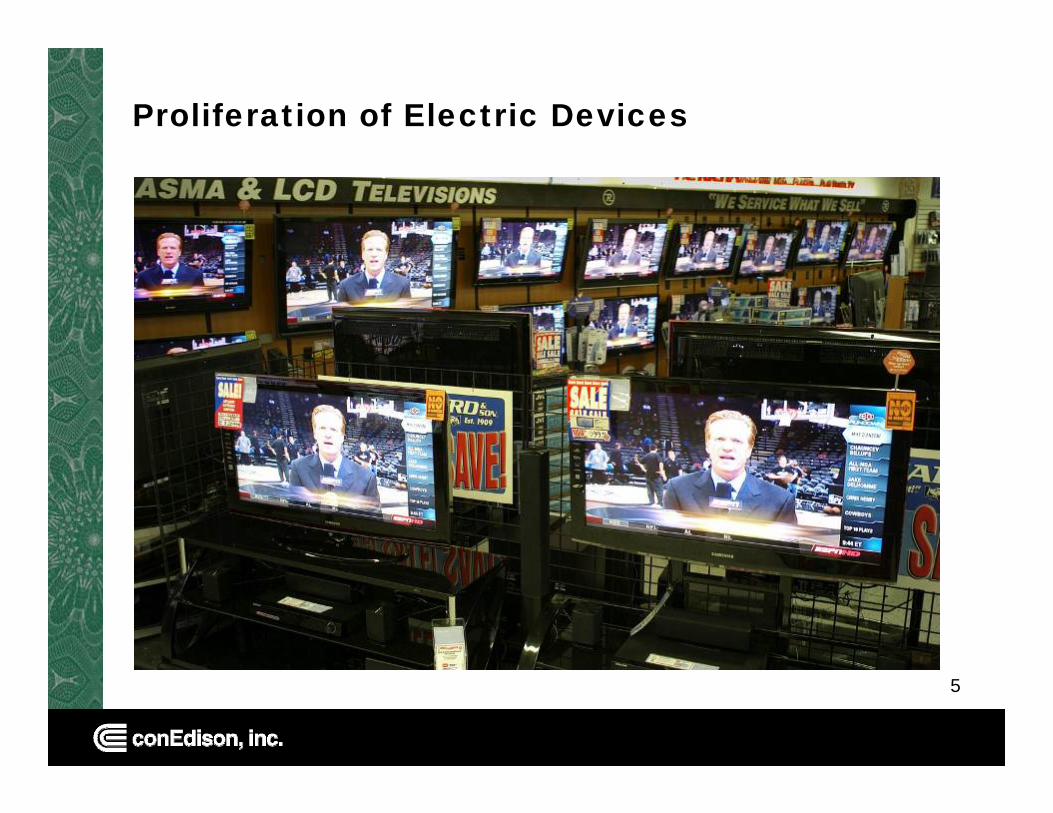
Proliferation of Electric Devices

6
Proliferation of Electric Devices
60,000 40,000
Growth in Central Air Conditioners
2002 – 2007 2008 – 2012Forecast
650,000
1,000,000
500,000
900,000 Growth in Personal Home Computers
Growth in Room Air Conditioners

7
Major Development
WTC
FLUSHING COMMONS
SILVERCUP WEST
ATLANTIC YARDS
YANKEE STADIUM
CITIFIELD
525 E 118 ST
1765 FIRST AVENUE
ALBEE SQUARE TOWER
RIDGE HILL VILLAGE

8
Major Infrastructure
CROTON WATER TREATMENT PLANT
SECOND AVENUE
SUBWAY
# 7 LINE EXTENSION
FULTON STREET HUBSOUTH FERRY TERMINAL
EAST SIDE ACCESS
PATH TRANSPORTATION
HUB (WTC)
9
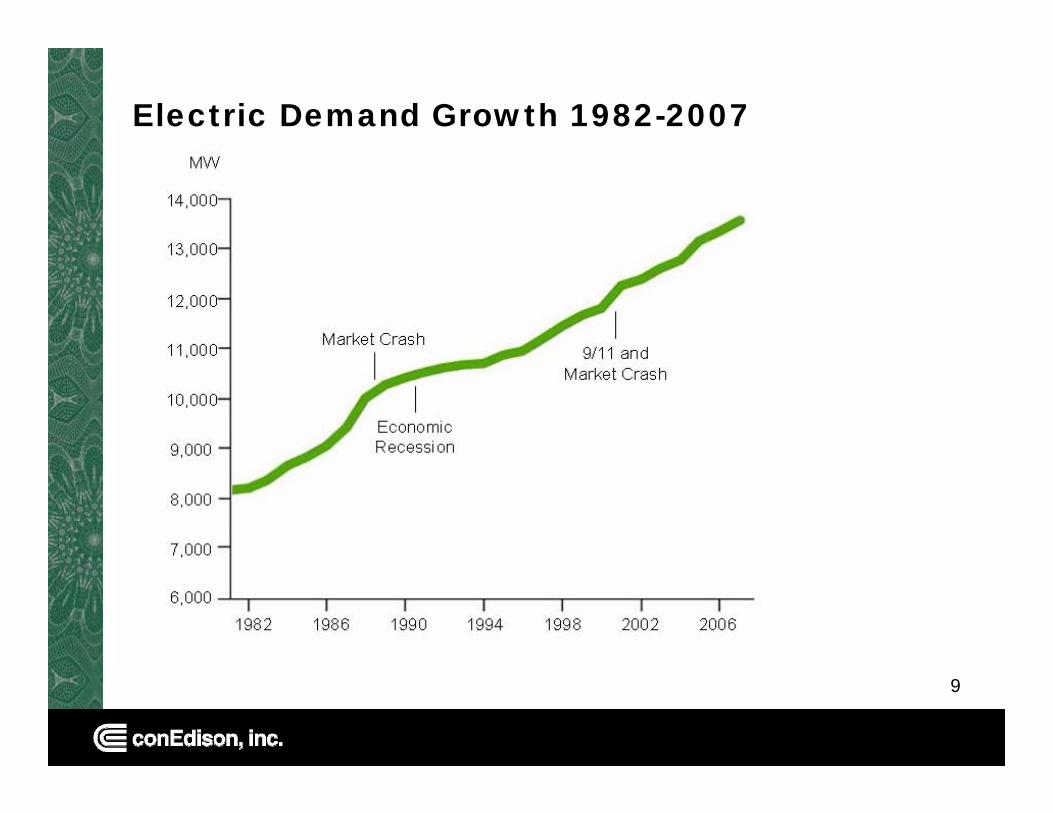
Electric Demand Growth 1982-2007
1010
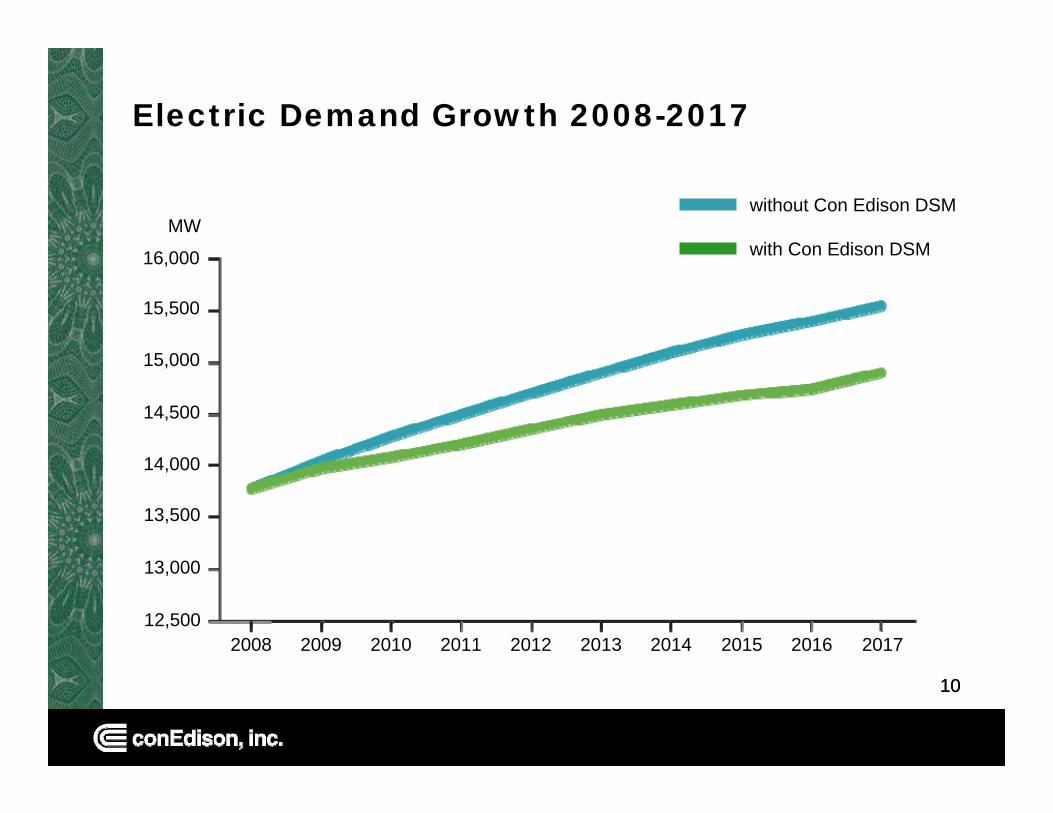
Electric Demand Growth 2008-2017
2008
16,000
MW
2009 2010 2011 2012 2013 2014 2015 2016 2017
15,500
15,000
14,500
14,000
13,500
13,000
12,500
without Con Edison DSM
with Con Edison DSM
11
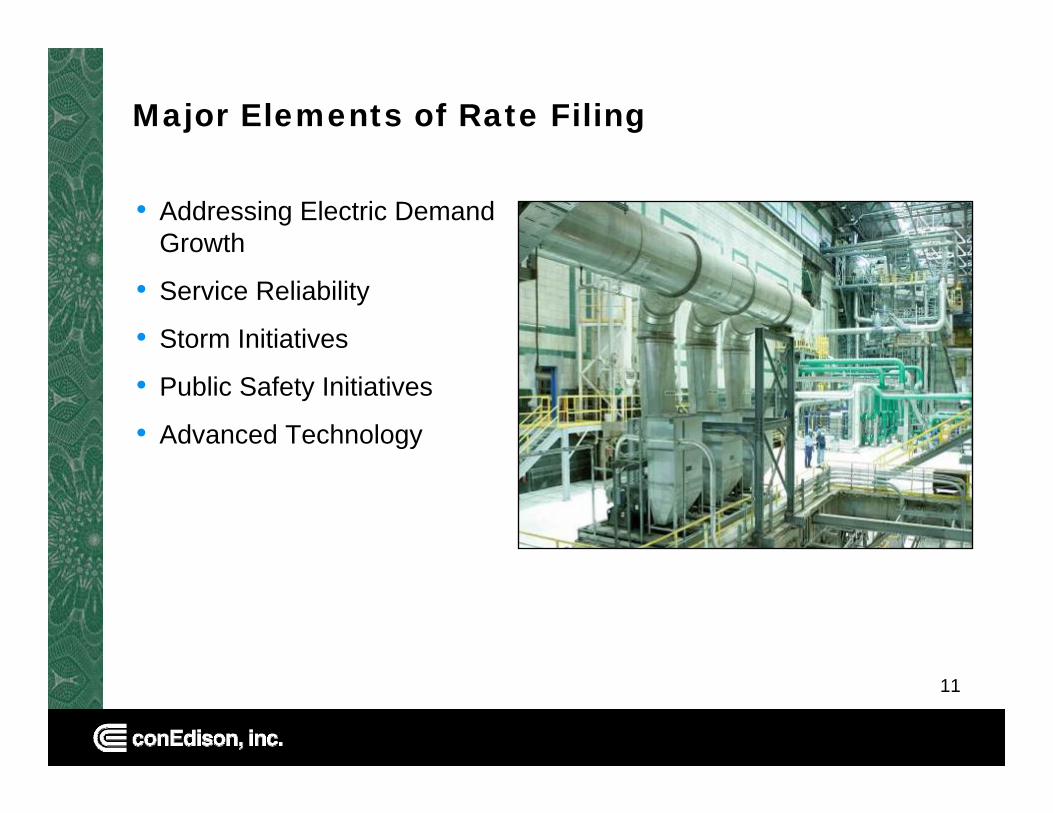
Major Elements of Rate Filing
• Addressing Electric Demand Growth
• Service Reliability
• Storm Initiatives
• Public Safety Initiatives
• Advanced Technology

12
Addressing Electric Demand Growth
• Energy Efficiency Programs
• Load Transfers
• Additional Capacity
• Construct New Area Substation
• Construct New Transmission Station

13
• 1971: Save-A-Watt program – 200 MW reduction
• 1988 – 1998: Enlightened Energyprogram – 740 MW reduction
• 2004: first RFP for targeted DSM – 42 MW reduction
• 2005: Electric Rate Plan– 150 MW reduction under contract
• 2008: Electric Rate Plan – 30 MW continuation of targeted program
• 2008: Electric Rate Proposal – 108 MW continuation of targeted program
• 2015: Planned 500 MW reduction
Con Edison Energy Efficiency Programs

14
Unique System Design
Generating Station(electricity generated at 13.8 to 22.0 kV)
Transmission Substation
Area Substation(voltage stepped down to distribution voltage)
Transformers(voltage stepped down to 480, 208, or 120 V)
Feeders
Connection To Others
60 Network SystemsSupply 86% of System Demand
Overhead SystemSupplies 14% of System Demand

15
Load Transfers2008
• 21 MW from Bensonhurst No. 2 to Bensonhurst No. 1 in Brooklyn
• 21 MW from West 110 St. No. 2 to West 110 St. No 1 in Manhattan
• 10 MW from Hell Gate in Bronx to West 110 St No. 1 in Manhattan
• 8 MW from Hell Gate to Bruckner in Bronx
• 4 MW from Mohansic to Buchanan in Westchester
16
Additional Capacity
• Parkchester Transformer # 4
• Parkchester 3rd Cap Bank
• Woodrow Transformer # 3
• Corona Transformer # 10
• Corona Transformer # 7 Upgrade

17
2008 New Substations
Parkview Area Substation
• Four Transformers
• 20 MVAR Capacitor Bank
• 120 MW Load Transfer in 2008
Rockview Area Substation
• Three Transformers
• 72 MW Load Transfer in 2008
Parkview (2008)
Rockview (2008)
18
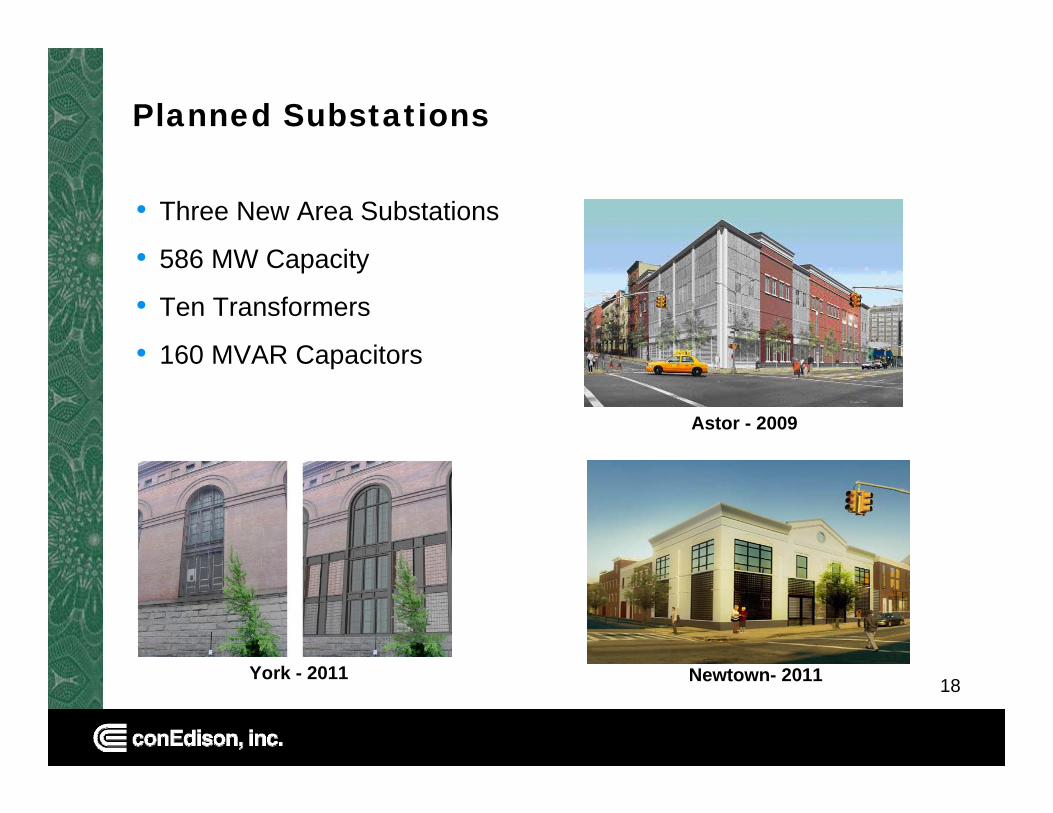
Planned Substations
• Three New Area Substations
• 586 MW Capacity
• Ten Transformers
• 160 MVAR Capacitors
York - 2011
Astor - 2009
Newtown- 2011

19
Planned Transmission Station
Academy Transmission Station
M-29 Transmission Feeder
• 9.5-mile, 345-kV line connecting Westchester with upper Manhattan
• Additional 350 MW to New York City’s import capability
• Expect to be in service by summer 2011

20
New York City Load Areas – Summer 2017With Demand Side Management
Above 100%
95 – 100%
90 – 94%
Without New Investment With New Investment
Below 90%

21
Above 100%
95 – 100%
90 – 94%
Without New Investment With New Investment
Below 90%
Westchester Load Areas – Summer 2017With Demand Side Management

22
Unparalleled Reliability
1,400
1,000
200
0
2006 2006
800
600
400
1,250
1,000
380
15675
National(USA)
New York State(w/o Con Edison)
Con Edison(non-network)
Con Edison(overall)
Con Edison(network)
1,000
800
600
400
200
098 99 00 01 02 03 04 05 06 07
Source: New York State Public Service Commission
NYS
Con Edison
2007 2007 2007
1,200

23
Generation • Overhauls, Maintenance and Testing
Transmission Feeders• Upgrade Four Feeders• Facility Upgrades (Structures,
Structural Supports and Footings)
Area & Transmission Substations• Replace Six Transformers• Infrared Testing• Inspection and Testing of Transformers• Replace Circuit Breakers
Service Reliability

24
Service Reliability
Distribution Cable• Replace 3,100 Miles of Primary
Cable
• Replace 3,000 Miles of Secondary Cable
• Replace 600 Miles of Overhead Wire
• Inspection & Maintenance Programs
Distribution Transformers• Replace 4,500 Network
Transformers
• Inspection & Maintenance Programs

25
Storm Initiatives
• Reduce Number of Customers Affected
• Reduce Duration of Customers Affected
• Communicate to Customers & Stakeholders

26
Public Safety Initiatives

27
Public Safety Initiatives
• Stray Voltage Detection
• Structure Inspection Program
• Cover Replacement Program
• Streetlight Isolation Transformers
• Improved Cable Design

28
Electric Shock Reports
151120
70
0
40
80
120
160
200
2005 2006 2007
Public Safety ImprovementsElectric Shock Reports
210
11689
46
0
40
80
120
160
200
2004 2005 2006 2007
Transformer Failures
Electric Shock Report
45%
58%
78%
21%
54%

29
Environmental Stewardship
Prevention • Energy Efficiency Programs
• Paper Insulated Lead Cable (PILC) Removal Program
• Oil Leak Detection Initiatives
Reduction• Reducing Carbon Footprint
• Green Fleet

30
Environmental Stewardship
Remediation• Brownfield Clean-up Programs• Manufacturing Gas Plant (MGP)
Sites
Awards • EPA honor, PILC Cable Removal
(2008) • Award for Greatest Improvement
in Carbon Efficiency by Large Corporation in the Americas in 2007
• Top US Utility for Climate Governance in 2007
• Ranked Number One in North America for Environmental & Social Performance (2007)

31
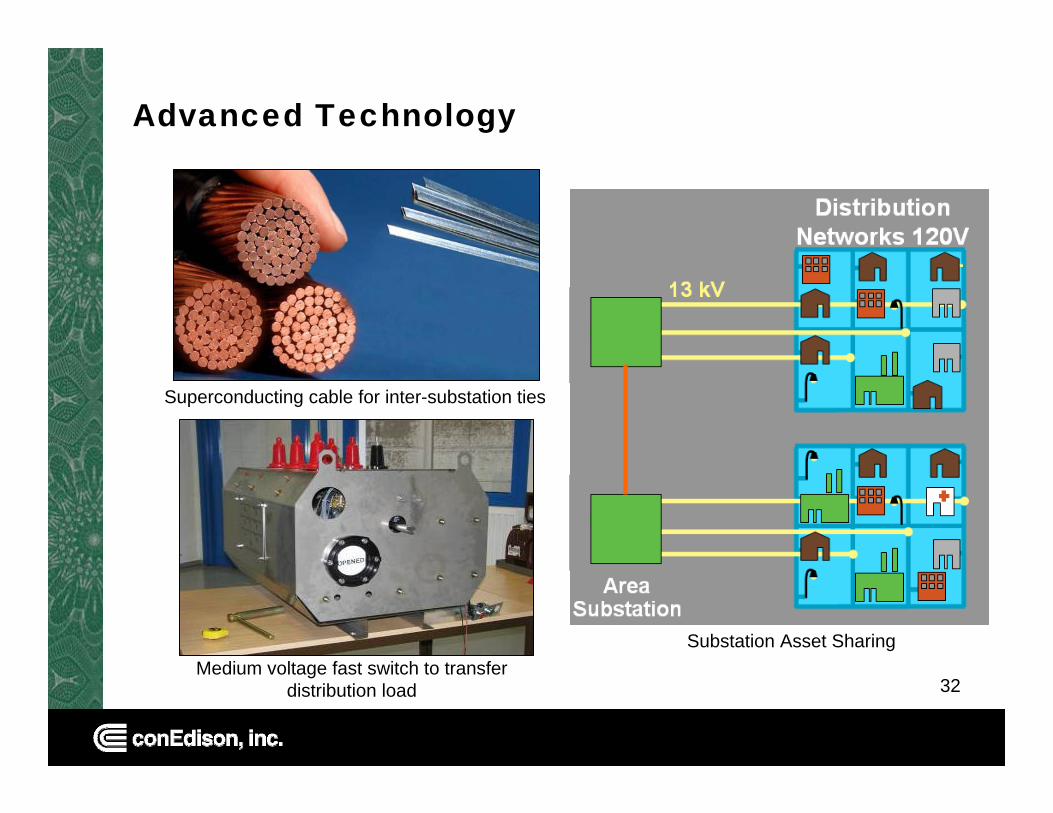
Advanced Technology
Energy Control Center
32
Superconducting cable for inter-substation ties
Medium voltage fast switch to transfer distribution load
Advanced Technology
Substation Asset Sharing

33
• Network Secondary Modeling & Monitoring
• Advanced Decision Support Tools
• Transformer Remote Monitoring
• Automatic Fault Finding Network Secondary Modeling & Monitoring
Advanced Technology
Network Trouble IndicatorHeads Up Display

34
Capital Investment Summary
Increased Customer Demand
40%
Environmental & Public
Improvement Mandates
2%
Emergency Response
10%
Service Reliability 43%
Advanced Technology
3%

35
$1,900
$1,008
$1,288
$1,457
$1,658$1,767
$1,628
$1,383 $1,362
$1,794 $1,849$1,763 $1,741
0
200
400
600
800
1000
1200
1400
1600
1800
2000
2005 2006 2007 2008 2009 2010 2011 2012
Actual Proposed Proposed Without DSM
Capital Investment Summary ($ Millions)
$1.2 Billion Reduction with DSM
36
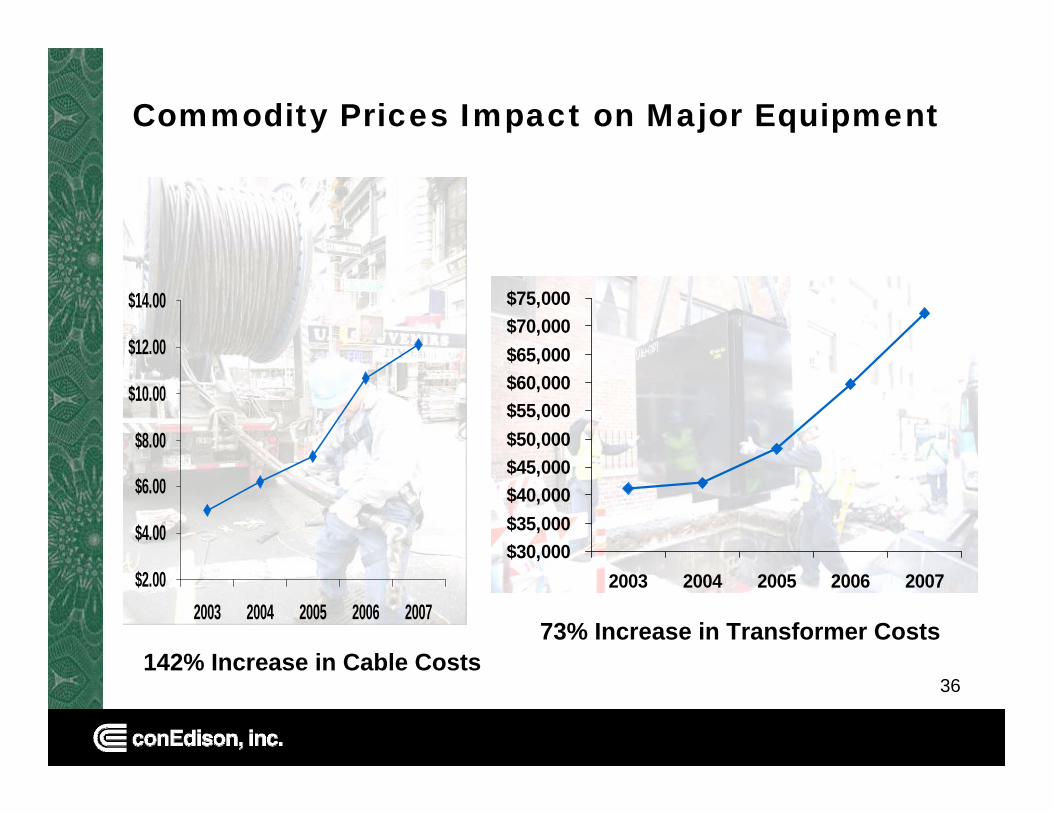
Commodity Prices Impact on Major Equipment
$30,000$35,000$40,000$45,000$50,000$55,000$60,000$65,000$70,000$75,000
2003 2004 2005 2006 2007$2.00
$4.00
$6.00
$8.00
$10.00
$12.00
$14.00
2003 2004 2005 2006 2007
142% Increase in Cable Costs 73% Increase in Transformer Costs

37
Mitigate Rate Impact on Customers
Demand Side Management • Defer Seven Substations
• Defer Substation Land Acquisition
• Defer New Transmission Feeders
Extend Length of Programs/Projects
• Coastal Storm• Rear Lot Pole Elimination • Distribution Feeder River
Crossings• Transmission Feeders on
Queensboro Bridge
38
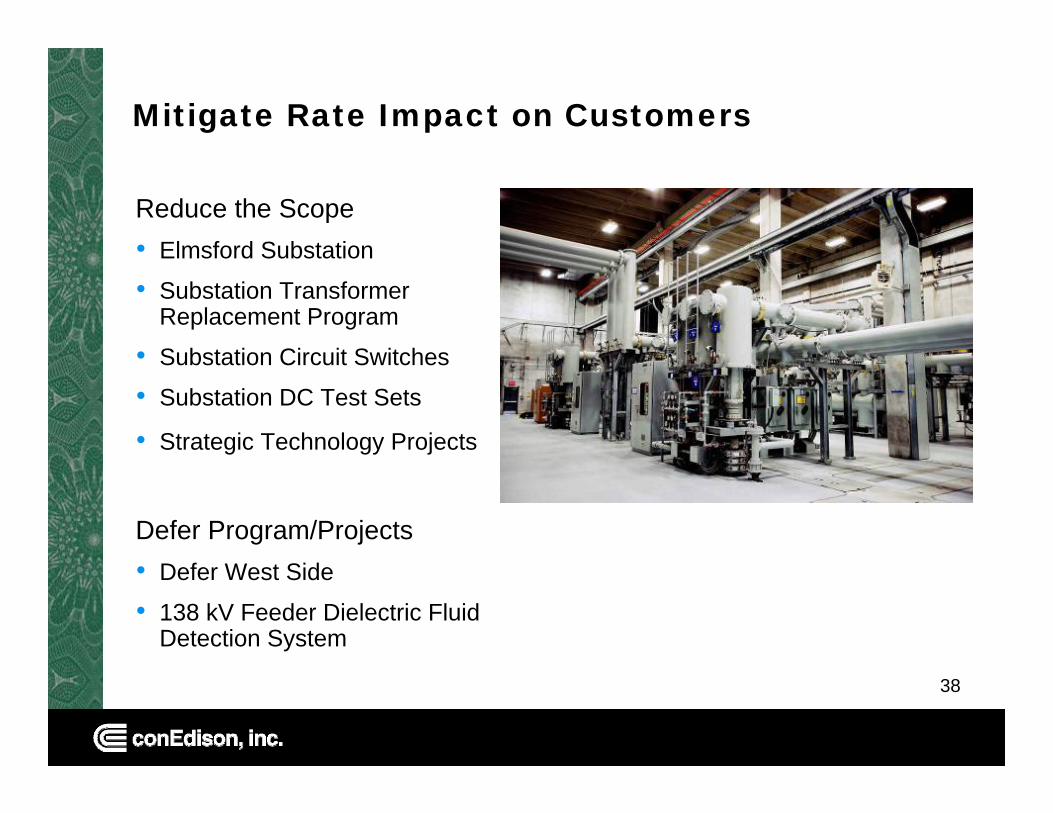
Mitigate Rate Impact on Customers
Reduce the Scope • Elmsford Substation
• Substation Transformer Replacement Program
• Substation Circuit Switches
• Substation DC Test Sets
• Strategic Technology Projects
Defer Program/Projects• Defer West Side
• 138 kV Feeder Dielectric Fluid Detection System

39
$1,767
$1,628
$1,383
$1,849$1,763 $1,741
$1,362
$1,900
$0
$200
$400
$600
$800
$1,000
$1,200
$1,400
$1,600
$1,800
$2,000
2009 2010 2011 2012
Proposed Proposed Without DSM
Mitigate Rate Impact on Customers
$1.2 Billion Reduction

40
Financial Overview

41
Discussion Topics
• Overview
• Rate increase before mitigation
• Rate mitigation efforts
• Rate increases with mitigation
• Rate Year 2 & 3 cost drivers
42
Overview
• Filing date – May 9, 2008
• Rate request covers one year, includes proposal for a three year rate plan
• Filing includes five year revenue requirement forecast
• Mitigation efforts integral part of filing

43
Rate Increase – w/o Mitigation$ millions
9.6%Increase in total bill
$1,080Electric rate increase, before mitigation
(25)Sales growth
55Amortization of deficiency in depreciation reserve
165Three year amortization of deferred charges and credits
165Higher operating expenses
200Property tax increases
270Higher ROE (11.3% vs. 9.1%)
250Total carrying cost of new infrastructure
55Depreciation$ 195Carrying cost of new infrastructure at allowed ROE (9.1%)

44
Components of Property Tax Increase$ millions
$200 Increase in property taxes
15 Recovery 2008 / 2009 deferral
39 Forecast increase due to tax rate changes
68 Impact of increase in new plant additions
17 Increase in asset replacement costs 2009/10
$ 61 Increase in asset replacement costs 2008/09
45
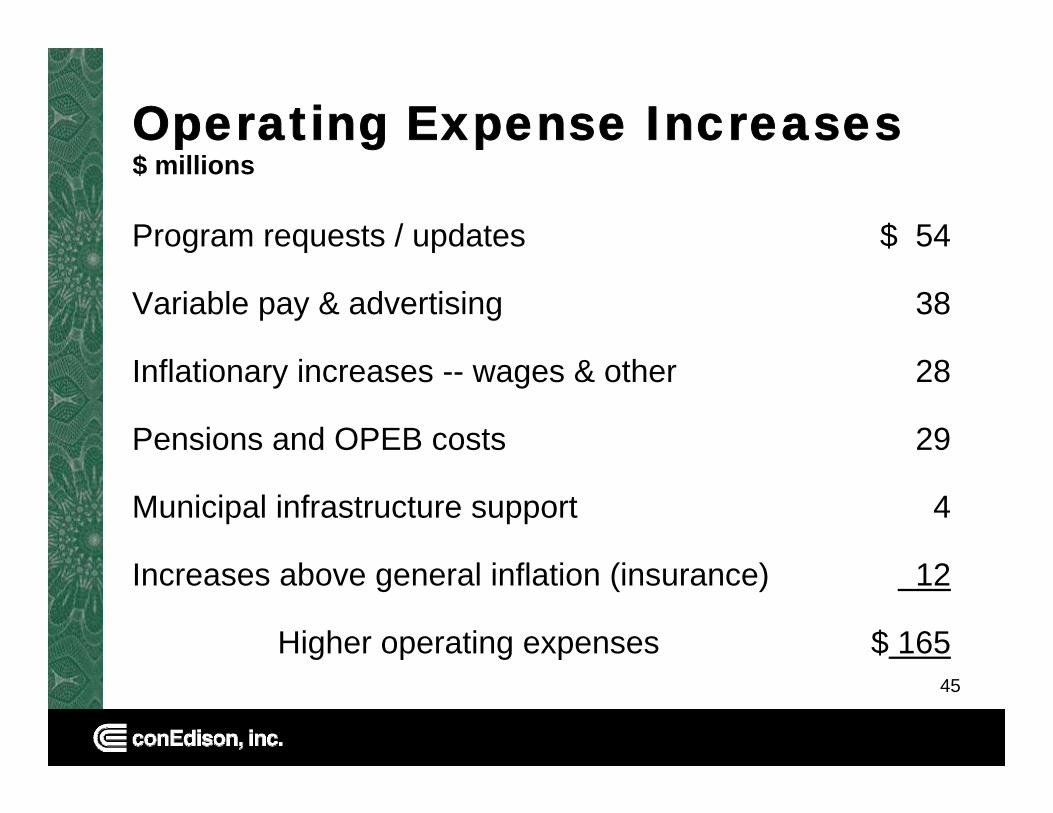
Operating Expense Increases$ millions
38 Variable pay & advertising
$ 165 Higher operating expenses
12 Increases above general inflation (insurance)
4 Municipal infrastructure support
29 Pensions and OPEB costs
28 Inflationary increases -- wages & other
$ 54 Program requests / updates

46
Deferred Costs and Credits$ millions
$ 165 Amortization of deferred costs and credits
10Pension and other Items
10 Expired Credits from 07-E-0523 (property tax refunds)
20 Three-year recovery of WTC cost ($34 vs. $14 million/yr)
25 Amortize credits from prior case -- 3 vs. 2 years
50 Recovery deferred MGP costs -- 3 years
$ 50 Recovery deferred T&D carrying costs -- 3 years
47
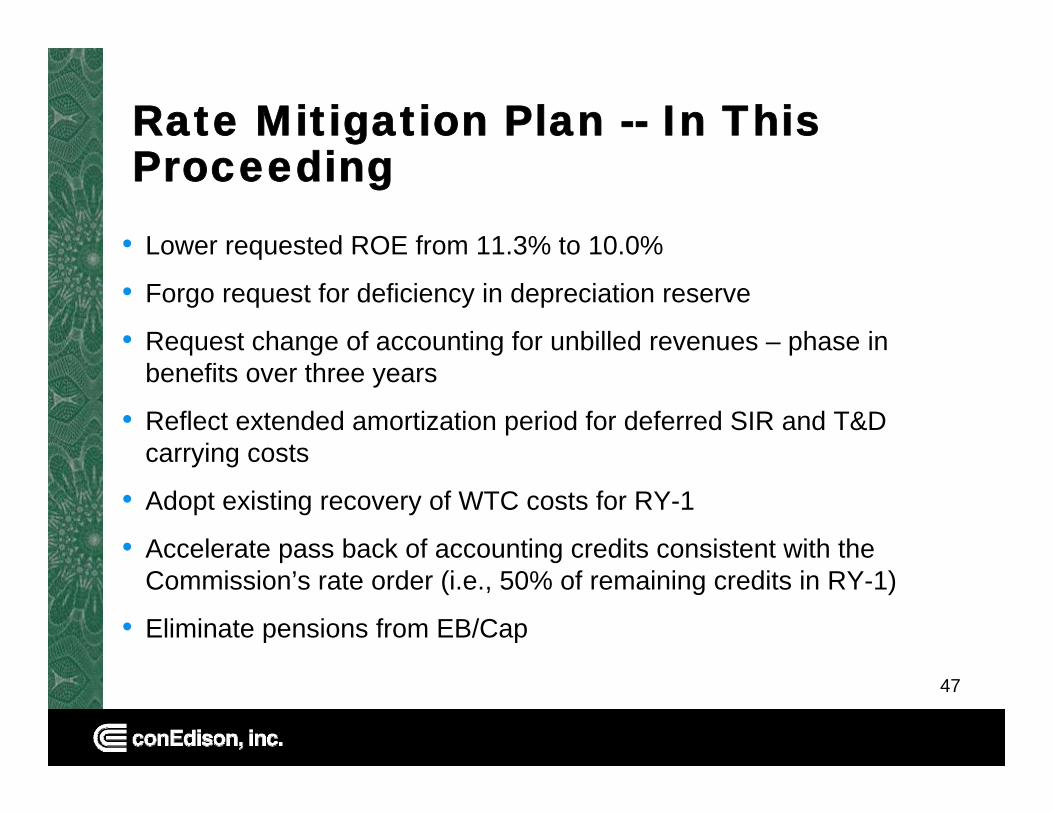
Rate Mitigation Plan -- In This Proceeding
• Lower requested ROE from 11.3% to 10.0%
• Forgo request for deficiency in depreciation reserve
• Request change of accounting for unbilled revenues – phase in benefits over three years
• Reflect extended amortization period for deferred SIR and T&D carrying costs
• Adopt existing recovery of WTC costs for RY-1
• Accelerate pass back of accounting credits consistent with the Commission’s rate order (i.e., 50% of remaining credits in RY-1)
• Eliminate pensions from EB/Cap

48
Impact of Mitigation on Rate Increase$ millions
(20)(15)(155)- Lower requested ROE to 10.0%
$420 $ 475 $ 654 Electric rate increase, after mitigation
--(20)- Earnings base/capitalization adjustment
-23 (45)- Phase-in unbilled revenue accrual
--(55)- Forgo depreciation deficiency adjustment
-87(151)- Extend recovery of deferred charges
$440 $ 380 $1,080 Revenue Requirement @ 11.3% ROE
RY-3RY-2RY-1
49
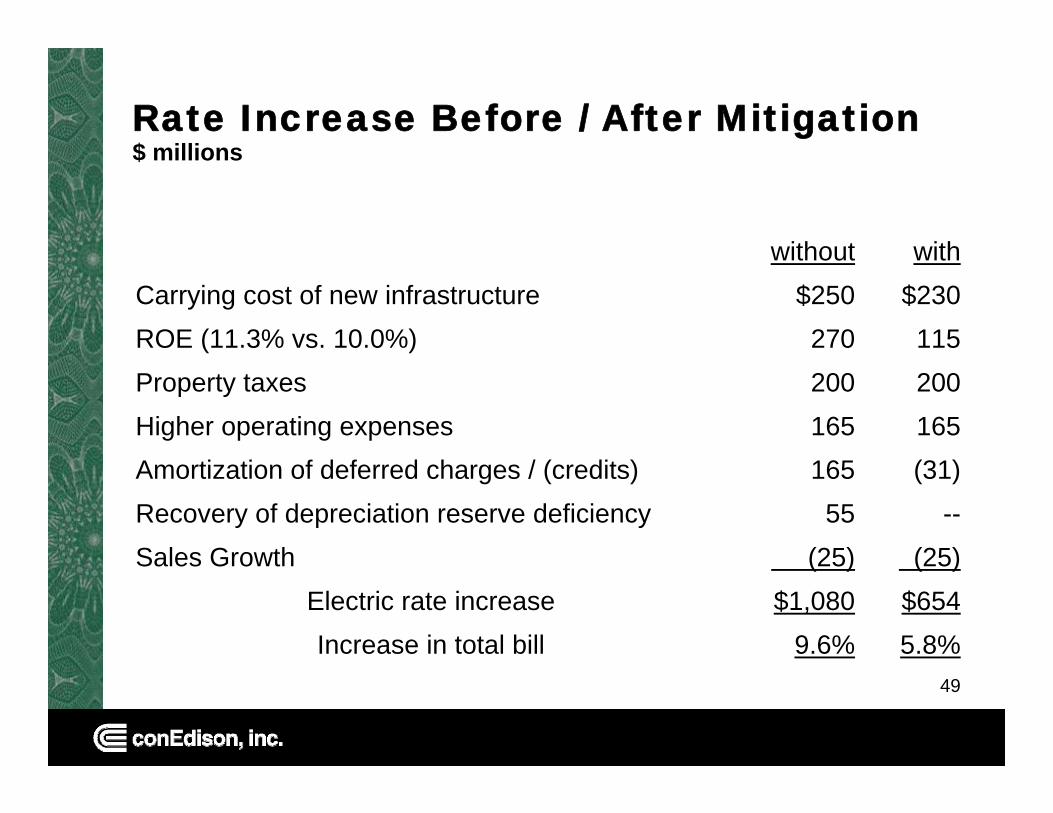
Rate Increase Before / After Mitigation$ millions
5.8%9.6%Increase in total bill$654$1,080Electric rate increase(25)(25)Sales Growth
--55Recovery of depreciation reserve deficiency(31)165Amortization of deferred charges / (credits)165165Higher operating expenses200200Property taxes115270ROE (11.3% vs. 10.0%)
$230$250Carrying cost of new infrastructurewithwithout

50
RY-2 and RY-3 with Mitigation$ millions
$420 $475 Electric rate increase30(15)(Higher) / lower sales revenues
-110 Amortization of deferred credits & unbilled (15)35 Pension and OPEBs
40 40 O&M labor and other escalations110 100 Property and other taxes255 205 Total carrying cost of new infrastructure
65 35 Depreciation$190 $170 Carrying cost of new infrastructureRY-3RY-2

51
Annual vs. Levelized Rate Increases$ millions
13.1%13.1%13.1%- Delivery percent increase
4.9%4.9%4.9%- Overall percent increase
$556 $556 $556 Levelized Three Year Rate Increase
9.9%11.2%15.4%- Delivery percent increase
3.7%4.2%5.8%- Overall percent increase
$420 $475 $654 Electric rate increase, after mitigation
RY-3RY-2RY-1
52
Rate and Bill Impact Overview

53
Components of RY 1 Non-Levelized vs. Levelized Rate Increase
$ 19.6$ 20.2MAC Increase
$ 637.1$ 654.1Total Delivery Increase
$ 522.6$ 536.5T&D IncreaseLevelized
$ 617.5$ 633.9T&D IncreaseNon-Levelized
$ 542.2$ 556.7Total Delivery Increase
$ 19.6$ 20.2MAC Increase
Excluding GRT
(Million $)
Including GRT
(Million $)
54
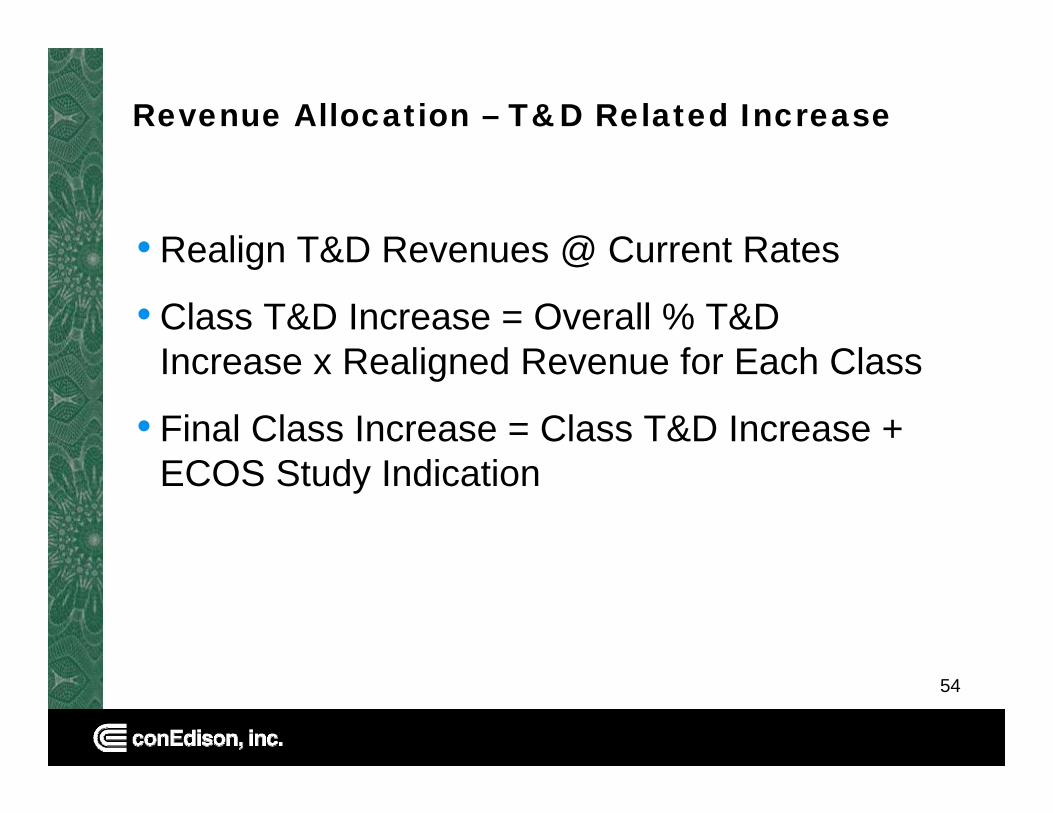
Revenue Allocation – T&D Related Increase
• Realign T&D Revenues @ Current Rates
• Class T&D Increase = Overall % T&D Increase x Realigned Revenue for Each Class
• Final Class Increase = Class T&D Increase + ECOS Study Indication

55
Allocation of Non-Levelized Delivery Revenue Increase – Eff. April 1, 2009
17.6 %17.5 %22.4 %17.0 %% T&D Increase15.4 %17.5 %22.4 %14.7 %% Delivery Increase
$ 654.1$ 4.4$ 88.7$ 561.0Total Delivery Increase Incl GRT
5.8 %4.4 %6.9 %5.7 %Total % Bill Increase
$ 19.6NANA$ 19.6MAC Increase Excl GRT
$ 617.5$ 4.4$ 86.4$ 526.7Total T&D Revenue Increase Excl GRT
TOTALEDDSNYPACECONY

56
Allocation of Levelized Delivery Revenue Increase for RY 1 – Eff. April 1, 2009
15.0 %15.0 %19.5 %14.5 %% T&D Increase13.1 %15.0 %19.5 %12.4 %% Delivery Increase
$ 556.7$3.8$77.4$ 475.5Total Delivery Increase Incl GRT
4.9 %3.8 %6.0 %4.8 %Total % Bill Increase
$ 19.6NANA$ 19.6MAC Increase Excl GRT
$ 522.6$ 3.6$ 75.4$443.6Total T&D Revenue Increase Excl GRT
TOTALEDDSNYPACECONY
57
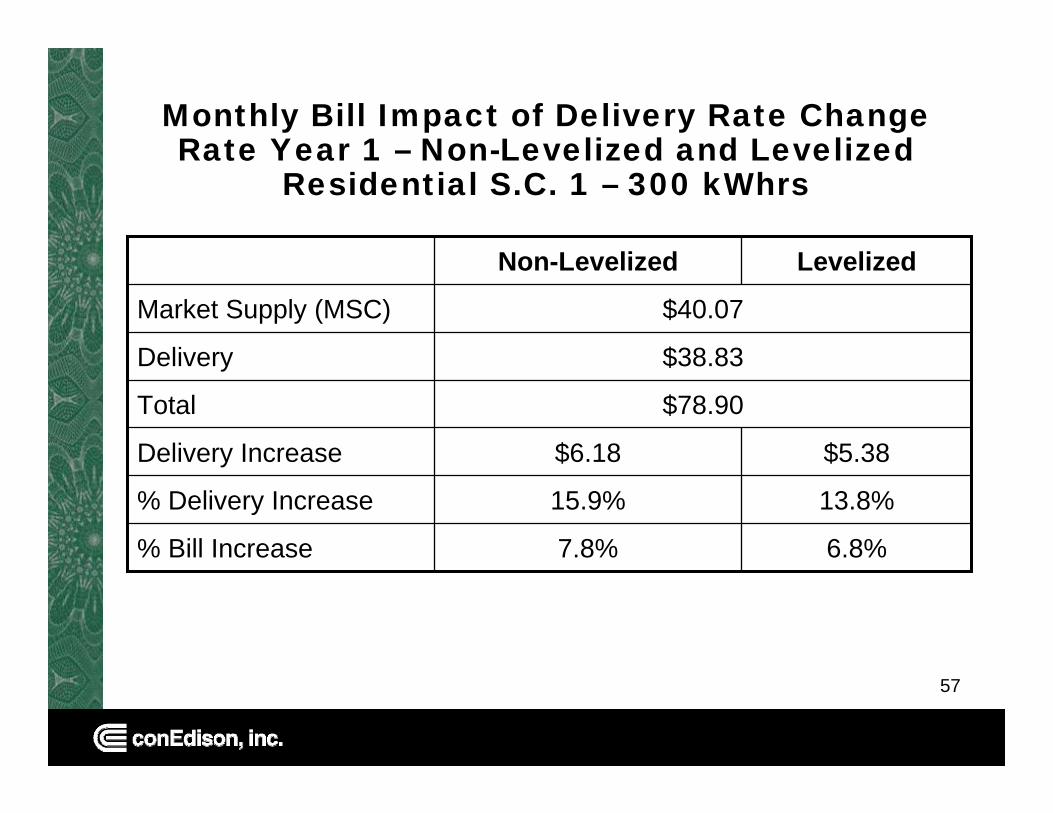
Monthly Bill Impact of Delivery Rate Change Rate Year 1 – Non-Levelized and Levelized
Residential S.C. 1 – 300 kWhrs
$78.90Total
$5.38$6.18Delivery Increase
13.8%15.9%% Delivery Increase
6.8%7.8%% Bill Increase
$38.83Delivery
$40.07Market Supply (MSC)
LevelizedNon-Levelized

58
Monthly Bill Impact of Delivery Rate Change Rate Year 1 – Non-Levelized and LevelizedCommercial S.C. 9 – 30 kW, 10,800 kWhrs
$2,338Total$101$120Delivery Increase
12.1%14.4%% Delivery Increase4.3%5.1%% Bill Increase
$835Delivery$1,503Market Supply (MSC)
LevelizedNon-Levelized

59
Con EdisonPowering New York’s Future
Technical Conference June 18, 2008