powerpoint presentationanimp.it/prodotti_editoriali/news/internazionalizzazione... ·...
TRANSCRIPT

1 Dec 2014
Dec 2014

2 Dec 2014
NPC Organization Chart
National Petrochemical Co. (NPC)
Projects Production
Control
Planning &
Development
Administration
& Training Finance
Ministry of Petroleum

3 Dec 2014
Iran’s Proven Oil Reserves
North America
13,2%
Venezuela
17,8%
Kazakhstan
1,8% Russian
Federation
5,2%
Iran
9,4%
Iraq
9,0% Kuwait
6,1%
Saudi Arabia
15,9%
United Arab
Emirates
5,9%
Africa
7,8%
Asia Pacific
2,5%
Other World
5,4%
Source: BP - Statistical review of world energy - 2013
Global Crude Oil Proven Reserves (End of 2012)
1,669 billion barrels

4 Dec 2014
Natural Gas Proven Reserves
US
4,5%
S. & Cent.
America
4,1%
Russian
Federation
17,6%
Europe &
Eurasia
13,6%
Iran
18,0%
Qatar
13,4%
Saudi Arabia
4,4%
Other World
8,5%
Africa
7,7%
Asia Pacific
8,3%
Source: BP - Statistical review of world energy - 2013
Global Natural Gas Proven Reserves (End of 2012):
187.3 trillion cubic meters

5 Dec 2014
Major Advantages of
Iran’s Petrochemical Industry
Availability of colossal oil-based feedstock
(world’s 4th largest oil reserves)
Availability of huge gas resources containing over
10% C2+ in gas-phase (world’s 2nd largest natural gas
reserves)
Well-developed export & import infrastructure (ports, …)
Iran has numerous advantages in petrochemical
industry
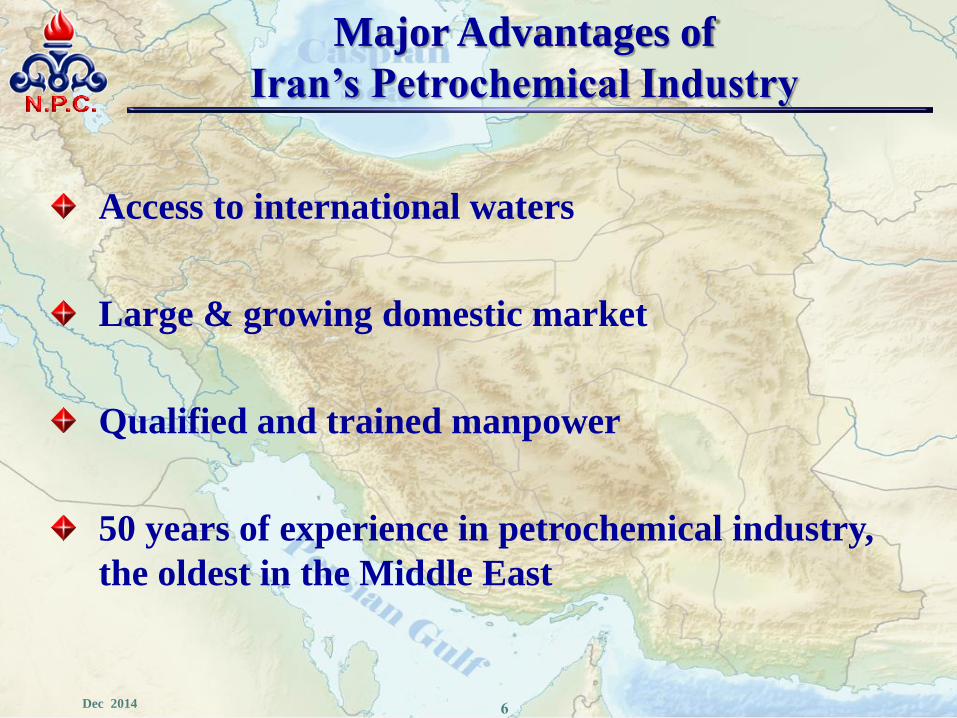
6 Dec 2014
Access to international waters
Large & growing domestic market
Qualified and trained manpower
50 years of experience in petrochemical industry,
the oldest in the Middle East
Major Advantages of
Iran’s Petrochemical Industry
7 Dec 2014
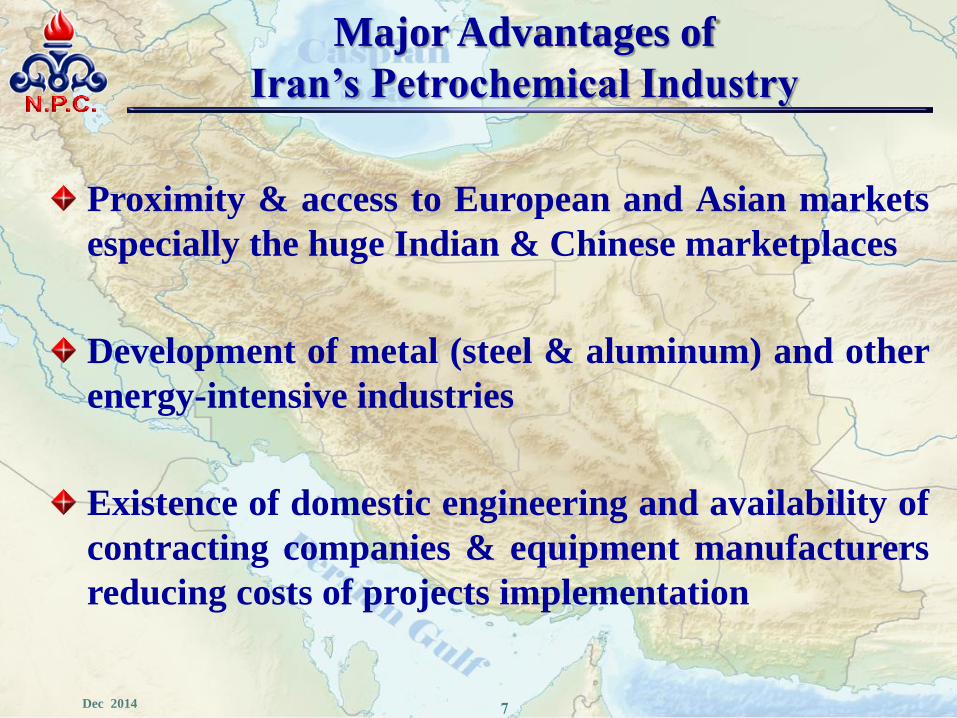
Proximity & access to European and Asian markets
especially the huge Indian & Chinese marketplaces
Development of metal (steel & aluminum) and other
energy-intensive industries
Existence of domestic engineering and availability of
contracting companies & equipment manufacturers
reducing costs of projects implementation
Major Advantages of
Iran’s Petrochemical Industry

8 Dec 2014
Chabahar
Special
Economic Zone
Petrochemical Development Zones
Petrochemical
Special Economic
Zone
Pars Special
Economic - Energy
Zone
Sarakhs
Qeshm Kish
Lavan
North Pars
Tehran
Caspian Sea
Iranshahr

9 Dec 2014
Petrochemical Special Economic Zone
Bandar Imam
(Mahshahr)

10 Dec 2014
Pars Special Economic / Energy Zone
Assaluyeh

11 Dec 2014
West Ethylene Pipeline
3 Supplier complexes with 3.5 Million tons/yr capacity
11consumers with 3.2 Million tons/yr capacity

12 Dec 2014
0,1 2,7
3,1 5,4
10,3 10,6
14,2
14,5
18,2
20,4
51,1 54,5
57,1 60
0
10
20
30
40
50
60
70
Mil
lion
Ton
s
Capacity By the End of 2013
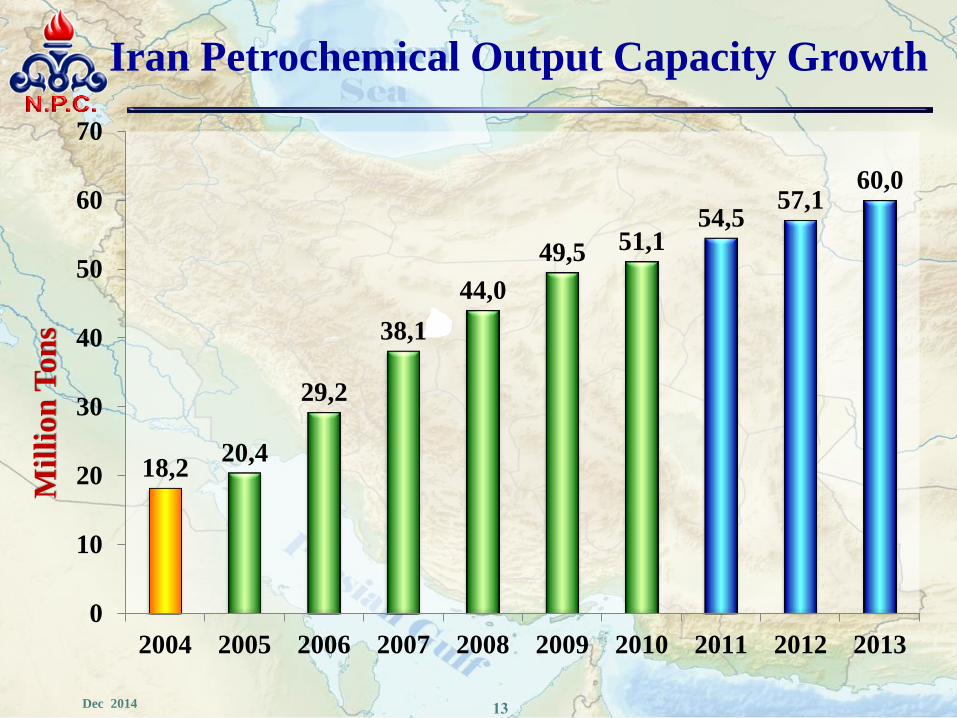
13 Dec 2014
Iran Petrochemical Output Capacity Growth
18,2 20,4
29,2
38,1
44,0
49,5 51,1 54,5
57,1 60,0
0
10
20
30
40
50
60
70
2004 2005 2006 2007 2008 2009 2010 2011 2012 2013
Mil
lio
n T
on
s

14 Dec 2014
Iran Petrochemical Export &
Domestic Demand
5,2 5,2 6
9,5
12,3
14,2
17,9 18,2
15,8
13
4,8 4,9 6,1 6,4
7,6 7,9
10,5
12 13,3
14.5
0
2
4
6
8
10
12
14
16
18
20
2004 2005 2006 2007 2008 2009 2010 2011 2012 2013
Export Domestic Demand
Mil
lion t
on
s
15 Dec 2014

16 Dec 2014
No. of Projects 67
Design Capacity 61 Million Tons/Yr
Products Value 32 Billion USD/ Yr
Average Physical Progress 20 %
Total Capital Investment 39 Billion USD
Projects under Implementation

17 Dec 2014
No. of Projects 36
Design Capacity 60 Million Tons/ Yr
Saleable Products 28 Million Tons/ Yr
Value of Saleable Products 30 Billion USD/ Yr
Total Capital Investment 42 Billion USD
New Investment Opportunities
18 Dec 2014
PRIVATIZATION
Petrochemical industry’s privatization gained
momentum according to Article 44 of IRAN’s
Constitution.
Based on the Article, NPC, as a state-owned
company has investment restriction.
Best option for private sector investment is
investing in basic, mid & downstream
production chain projects.

19 Dec 2014

20 Dec 2014
Iran’s Share of the World and Mid East
Ethylene Capacity
The international trade of ethylene is quite limited due to expenses associated with
transportation. As a result, most ethylene that crosses international borders is in the form of
derivative chemicals, such as polyethylene, ethylene glycol, and EDC.
4
22,1
7
32
7,5
32
0
10
20
30
40
World Middle East
Per
cen
t
2012 2017 2022
21 Dec 2014
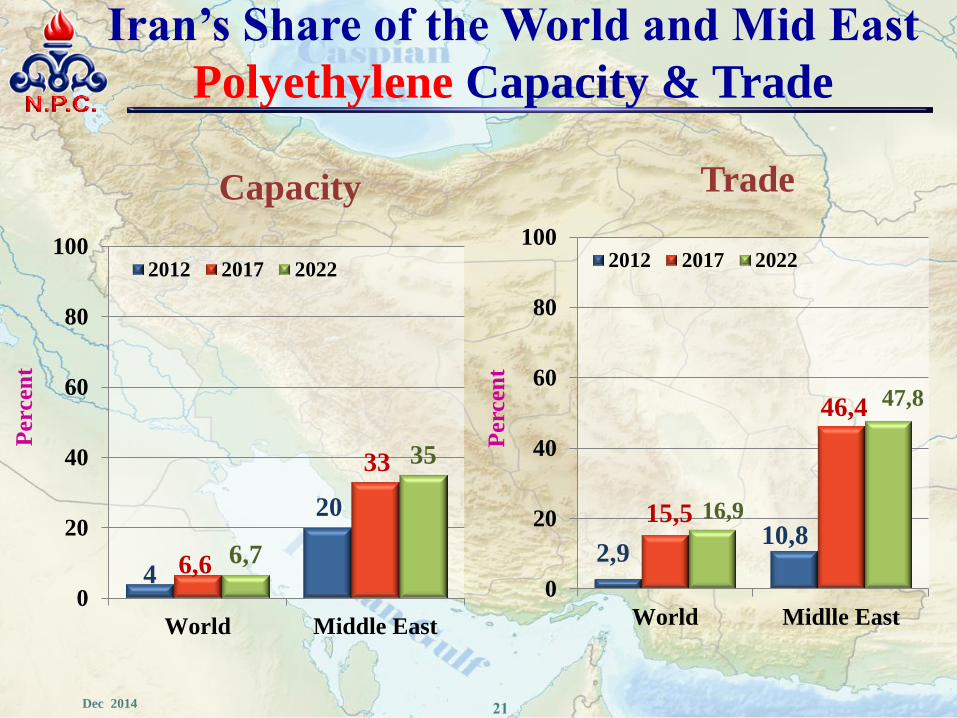
4
20
6,6
33
6,7
35
0
20
40
60
80
100
World Middle East
Perc
en
t
Capacity
2012 2017 2022
2,9 10,8
15,5
46,4
16,9
47,8
0
20
40
60
80
100
World Midlle East
Perc
en
t
Trade
2012 2017 2022
Iran’s Share of the World and Mid East
Polyethylene Capacity & Trade
22 Dec 2014
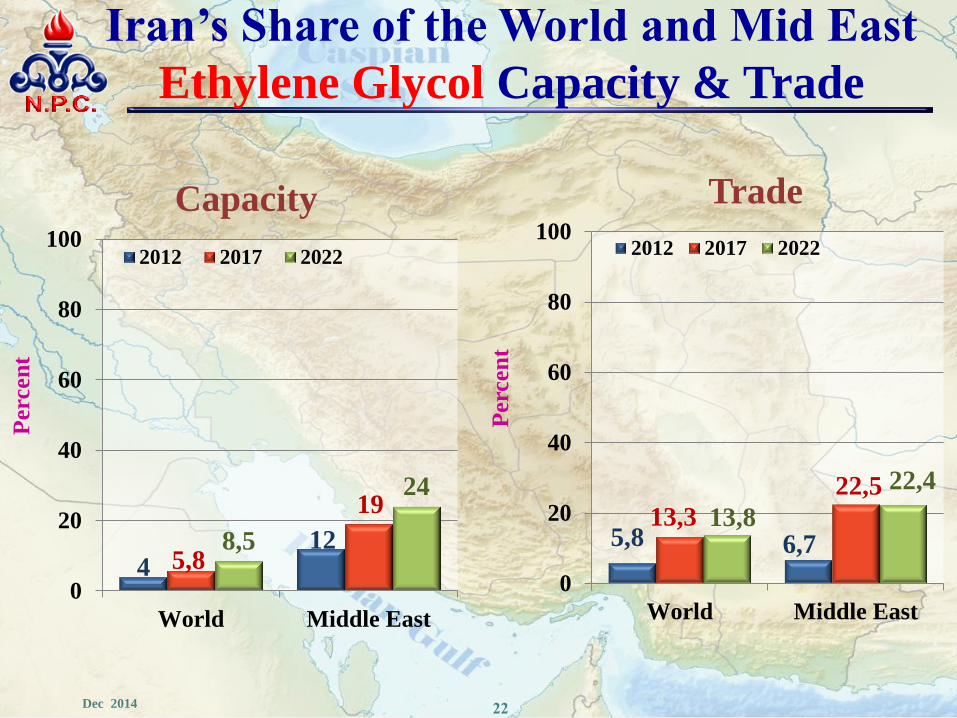
4 12
5,8
19
8,5
24
0
20
40
60
80
100
World Middle East
Perc
en
t
Capacity
2012 2017 2022
5,8 6,7 13,3
22,5
13,8
22,4
0
20
40
60
80
100
World Middle East
Perc
en
t
Trade
2012 2017 2022
Iran’s Share of the World and Mid East
Ethylene Glycol Capacity & Trade

23 Dec 2014
1
12
2,2
19
6,5
37
0
10
20
30
40
World Middle East
Perc
en
t
2012 2017 2022
Iran’s Share of the World and Mid East
Propylene Capacity
International trade of propylene monomer is quite limited because of the costs of
transporting highly pressurized or refrigerated liquids. Most of the propylene trade
crossing international borders is in the form of derivative chemicals, such as
polypropylene and acrylonytrile.
24 Dec 2014
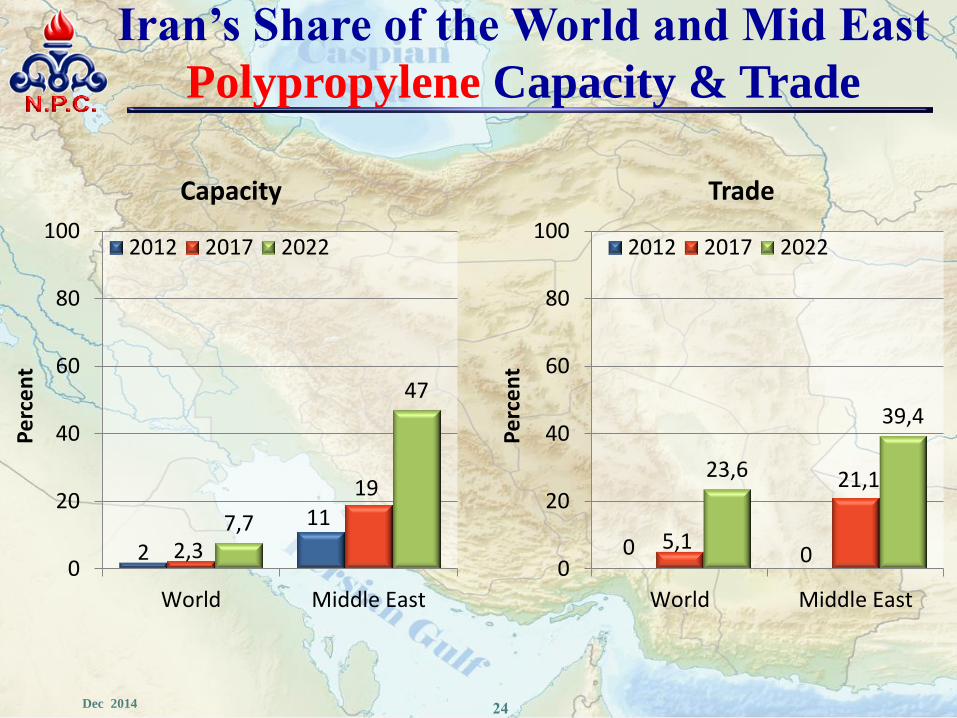
2
11
2,3
19
7,7
47
0
20
40
60
80
100
World Middle East
Pe
rce
nt
Capacity
2012 2017 2022
0 0 5,1
21,1 23,6
39,4
0
20
40
60
80
100
World Middle East
Pe
rce
nt
Trade
2012 2017 2022
Iran’s Share of the World and Mid East
Polypropylene Capacity & Trade
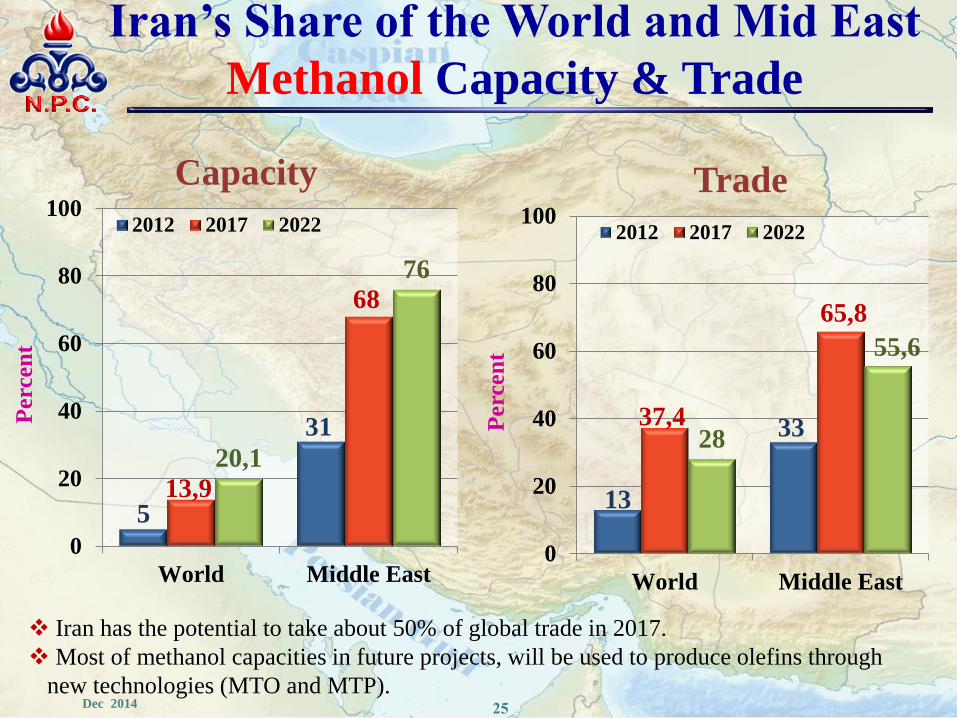
25 Dec 2014
5
31
13,9
68
20,1
76
0
20
40
60
80
100
World Middle East
Perc
en
t
Capacity
2012 2017 2022
13
33 37,4
65,8
28
55,6
0
20
40
60
80
100
World Middle East
Perc
en
t
Trade
2012 2017 2022
Iran’s Share of the World and Mid East
Methanol Capacity & Trade
Iran has the potential to take about 50% of global trade in 2017.
Most of methanol capacities in future projects, will be used to produce olefins through
new technologies (MTO and MTP).
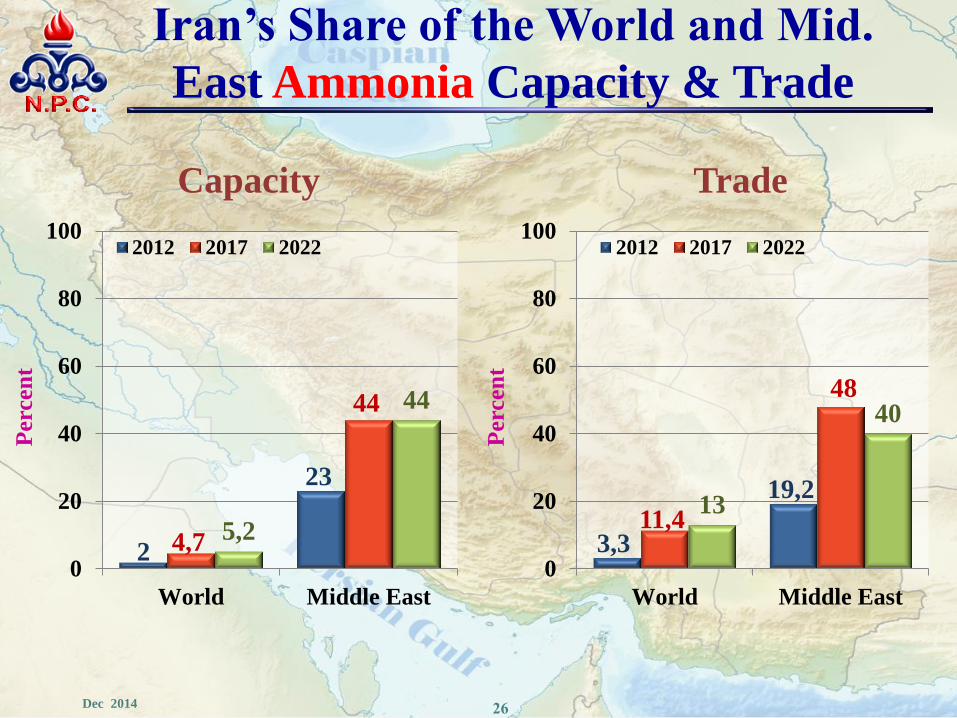
26 Dec 2014
2
23
4,7
44
5,2
44
0
20
40
60
80
100
World Middle East
Perc
en
t
Capacity
2012 2017 2022
3,3
19,2
11,4
48
13
40
0
20
40
60
80
100
World Middle East
Perc
en
t
Trade
2012 2017 2022
Iran’s Share of the World and Mid.
East Ammonia Capacity & Trade
