powerpoint presentation · 4/21/2015 2 2 instructors curtis hinman senior scientist key project...
TRANSCRIPT
4/21/2015
1
1
4/21/2015
2
2
INSTRUCTORS
Curtis HinmanSenior Scientist
Key project experience: Research specialist in the performance and design of LID practices.
Dylan Ahearn PhD
Associate Scientist
Key project experience: Stormwater monitoring and proprietary treatment verification and certification specialist.
4/21/2015
3
3
ADVANCED TOPICS IN LID DESIGN: BIORETENTION MEDIA AND
PROPRIETARY MEDIA FILTERS
Training ProgramStatewide LID
4/21/2015
4
4
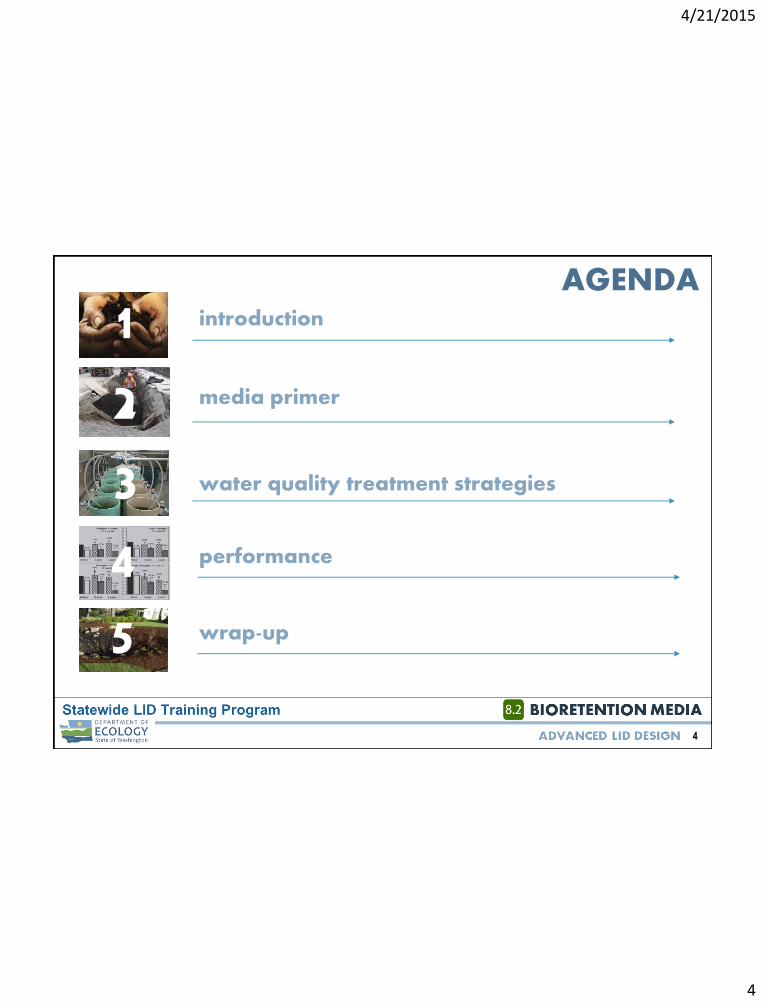
introduction
media primer
water quality treatment strategies
performance
AGENDA
21
345 wrap-up

4/21/2015
5
5
LOGISTICS
SCHEDULE
8-hour training
Lunch on your own
OTHER LOGISTICS
• Restrooms
• Food
• Turn off cell phones
• Sign in and sign out
4/21/2015
6
6
LEARNING OBJECTIVES
1. Gain an advanced level understanding of the physical and chemical characteristics of bioretention media components and blends necessary to meet specific performance objectives.
2. Understand the flow control and water quality treatment performance of current bioretention media specifications.
3. Better understand the mechanics, performance and operations of proprietary media filters with special attention to phosphorus management.

4/21/2015
7
7
PROGRAM OVERVIEW
• 2012: Public and private partners engage state legislature to fund program
• June 2012: LID Training Steering Committee convened
• 2012-2013: Washington State LID Training Plan developed: www.wastormwatercenter.org/statewide-lid-training-program-plan
• 2014: Training program built from state LID Training Plan.
4/21/2015
8
8
PROGRAM OVERVIEW
• Implement first phase of trainings (September 2014 through May 2015)
• 64 trainings offered in first phase
• Three levels: Introductory, Intermediate, and Advanced
4/21/2015
9
9
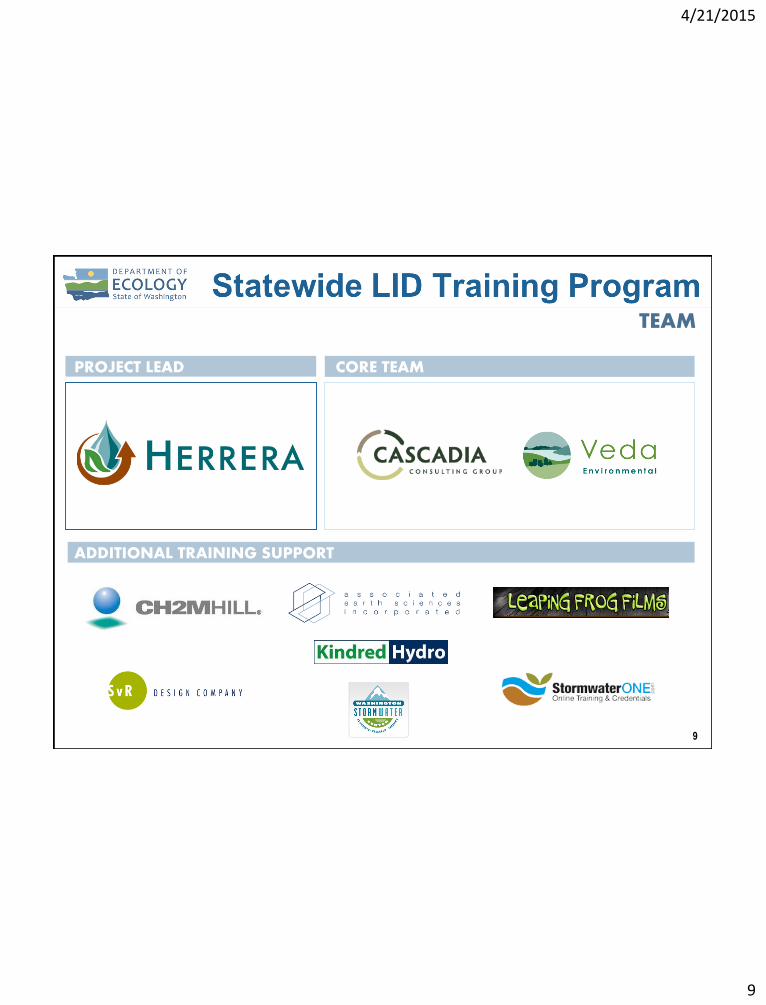
PROJECT LEAD
ADDITIONAL TRAINING SUPPORT
TEAM
CORE TEAM

4/21/2015
10
10
Introduction toLID for Eastern Washington
INTRODUCTORY INTERMEDIATE ADVANCED
TRAIN THE TRAINERS
Service Providers
Introduction toLID for Inspection & Maintenance Staff
Introduction toLID for Developers & Contractors: Make Money be Green
Intermediate LID Design: Rainwater Collection Systems & Vegetated Roofs
Intermediate LID –NPDES Phase I & II Requirements
Intermediate LID Design: Permeable Pavement
Intermediate LID Design: Hydrologic Modeling
Advanced Topics in LID Design:Bioretention
Advanced Topics in LID Design:Permeable Pavement
Advanced Topics in LID Design:Hydrologic Modeling
Advanced Topics in LID Design: Site Assessment, Planning & Layout
LID Topic Experts
Advanced Topics in LID Design: Rainwater Collection Systems & Vegetated Roofs
Advanced Topics in LID Design:Bioretention Media
TRAINING SEQUENCE
Advanced Topics for LID Operations: Bioretention
Intermediate LID Design: Bioretention
Advanced Topics for LID Operations: Permeable Pavement
Intermediate LID Design: Site Assessment, Planning & Layout

4/21/2015
11
11
Introduction toLID for Eastern Washington
INTRODUCTORY INTERMEDIATE ADVANCED
TRAIN THE TRAINERS
Service Providers
Introduction toLID for Inspection & Maintenance Staff
Introduction toLID for Developers & Contractors: Make Money be Green
Intermediate LID Design: Rainwater Collection Systems & Vegetated Roofs
Intermediate LID –NPDES Phase I & II Requirements
Intermediate LID Design: Permeable Pavement
Intermediate LID Design: Hydrologic Modeling
Advanced Topics in LID Design:Bioretention
Advanced Topics in LID Design:Permeable Pavement
Advanced Topics in LID Design:Hydrologic Modeling
Advanced Topics in LID Design: Site Assessment, Planning & Layout
LID Topic Experts
Advanced Topics in LID Design: Rainwater Collection Systems & Vegetated Roofs
Advanced Topics in LID Design:Bioretention Media
TRAINING SEQUENCE
Advanced Topics for LID Operations: Bioretention
Intermediate LID Design: Bioretention
Advanced Topics for LID Operations: Permeable Pavement
Intermediate LID Design: Site Assessment, Planning & Layout

4/21/2015
12
12
introduction
21
345
4/21/2015
13
13
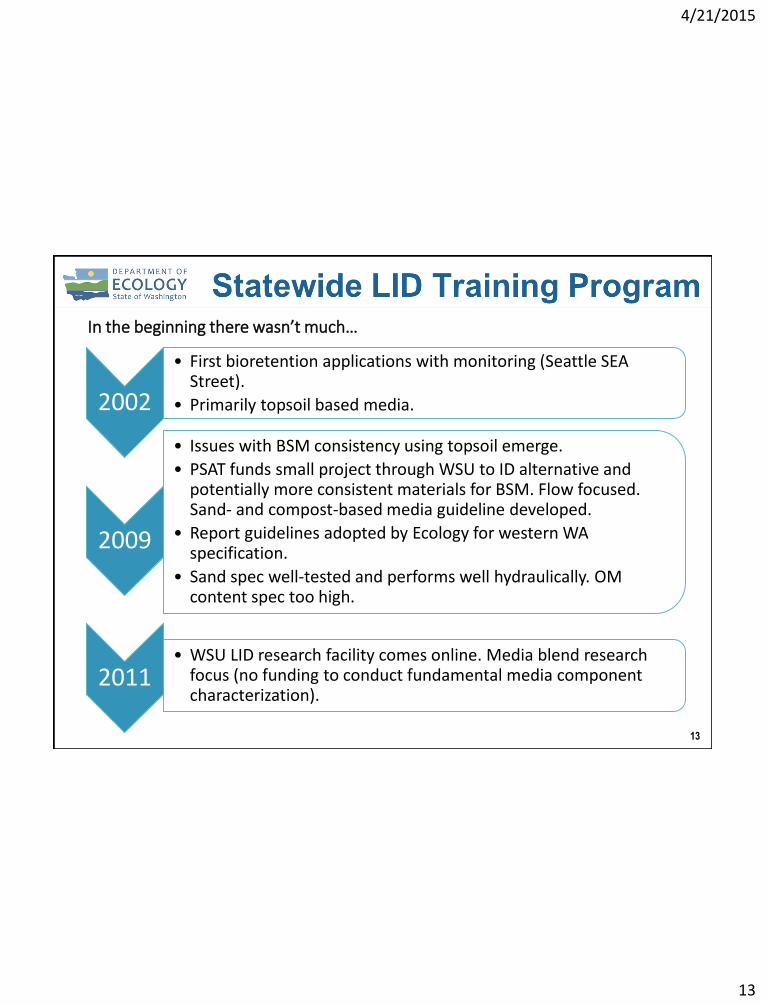
2002
• First bioretention applications with monitoring (Seattle SEA Street).
• Primarily topsoil based media.
2009
• Issues with BSM consistency using topsoil emerge.
• PSAT funds small project through WSU to ID alternative and potentially more consistent materials for BSM. Flow focused. Sand- and compost-based media guideline developed.
• Report guidelines adopted by Ecology for western WA specification.
• Sand spec well-tested and performs well hydraulically. OM content spec too high.
2011• WSU LID research facility comes online. Media blend research
focus (no funding to conduct fundamental media component characterization).
In the beginning there wasn’t much…
4/21/2015
14
14
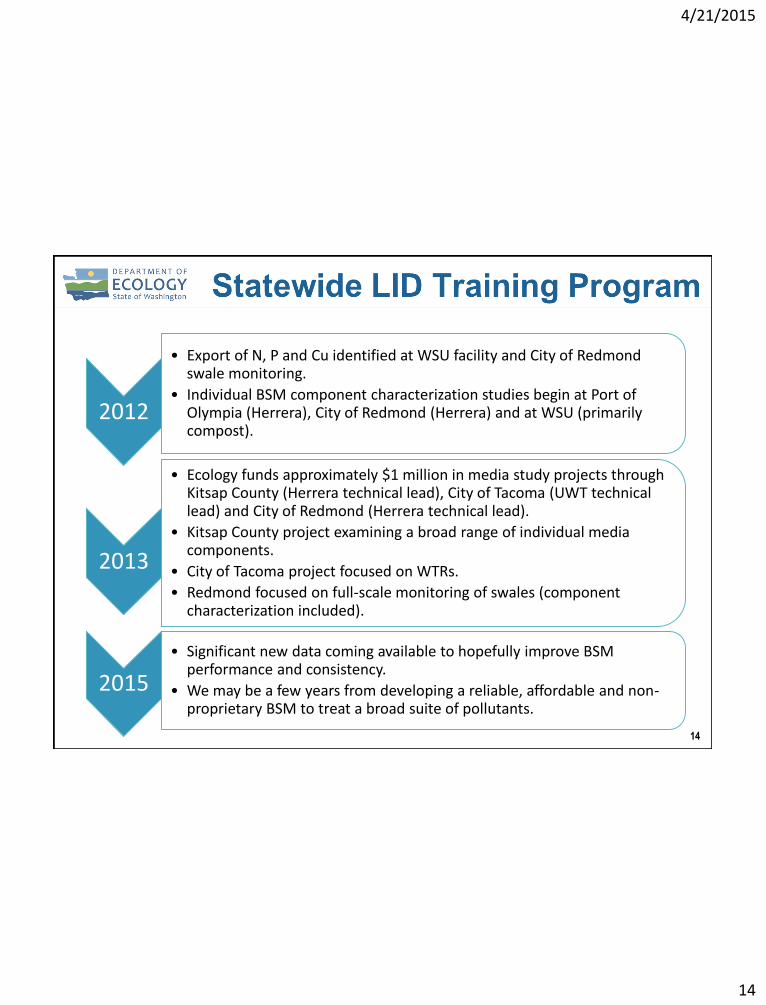
2012
• Export of N, P and Cu identified at WSU facility and City of Redmond swale monitoring.
• Individual BSM component characterization studies begin at Port of Olympia (Herrera), City of Redmond (Herrera) and at WSU (primarily compost).
2013
• Ecology funds approximately $1 million in media study projects through Kitsap County (Herrera technical lead), City of Tacoma (UWT technical lead) and City of Redmond (Herrera technical lead).
• Kitsap County project examining a broad range of individual media components.
• City of Tacoma project focused on WTRs.
• Redmond focused on full-scale monitoring of swales (component characterization included).
2015
• Significant new data coming available to hopefully improve BSM performance and consistency.
• We may be a few years from developing a reliable, affordable and non-proprietary BSM to treat a broad suite of pollutants.
4/21/2015
15
15
BACKGROUNDINTRODUCTION
Today’s focus:
• Bioretention media for advanced water quality treatment (direct release to receiving waters, over shallow drinking water aquifers, industrial sites, remedial sites…)
• There are many applications where a conventional sand and compost or topsoil-based media will perform well.
4/21/2015
16
16
BACKGROUND
Context
• For advance treatment media we are opening a complex black box…
• And attempting to reliably replicate a dynamic biological system with complex structures and processes to treat a broad range of contaminants to very low levels…a worthy challenge!
INTRODUCTION
4/21/2015
17
17
BACKGROUNDINTRODUCTION
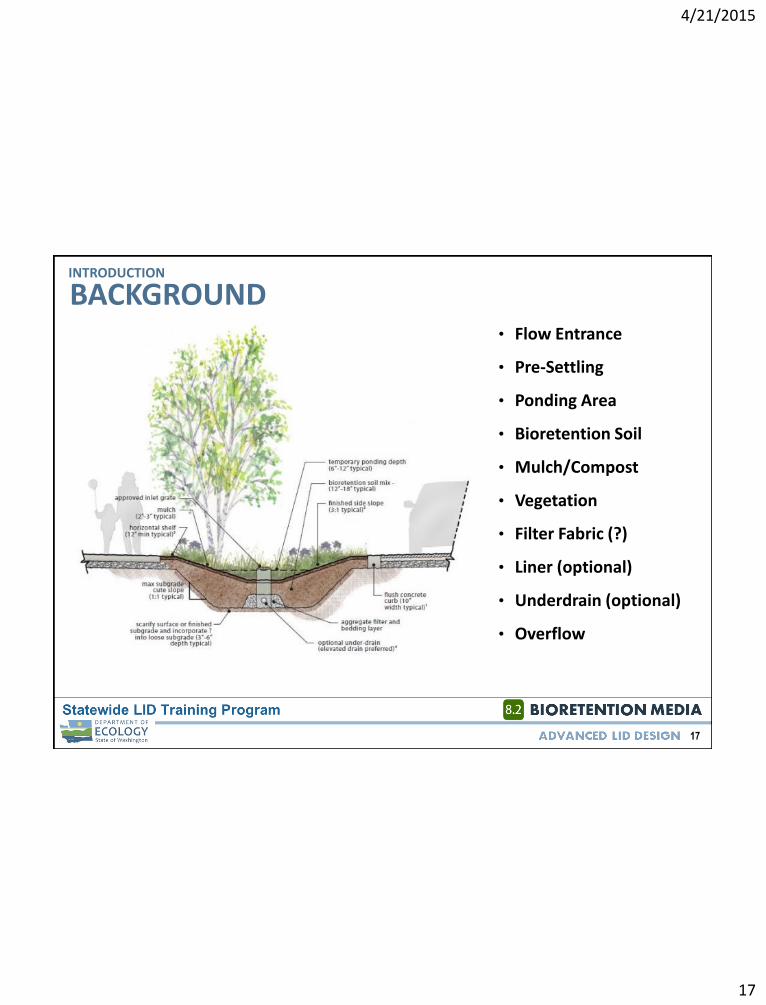
• Flow Entrance
• Pre-Settling
• Ponding Area
• Bioretention Soil
• Mulch/Compost
• Vegetation
• Filter Fabric (?)
• Liner (optional)
• Underdrain (optional)
• Overflow

4/21/2015
18
18
media primer21
345
4/21/2015
19
19
BIORETENTION HYDRAULICS PRIMERMEDIA BASICS
Factors influencing hydraulic conductivity
• Percent fines
• Particle size distribution

4/21/2015
20
20
BIORETENTION HYDRAULICS PRIMERMEDIA BASICS
Hydraulic conductivity strongly related to percent fines (passing #200 sieve)

4/21/2015
21
21
BIORETENTION HYDRAULICS PRIMERMEDIA BASICS
Hydraulic conductivity strongly related to coefficient of uniformity

4/21/2015
22
22
BIORETENTION HYDRAULICS PRIMERMEDIA BASICS
Factors influencing hydraulic conductivity
• Percent fines
• Particle size distribution
• Compaction
• Organic material
• Plants

4/21/2015
23
23
BIORETENTION HYDRAULICS PRIMERMEDIA BASICS
Control structures
4/21/2015
24
24
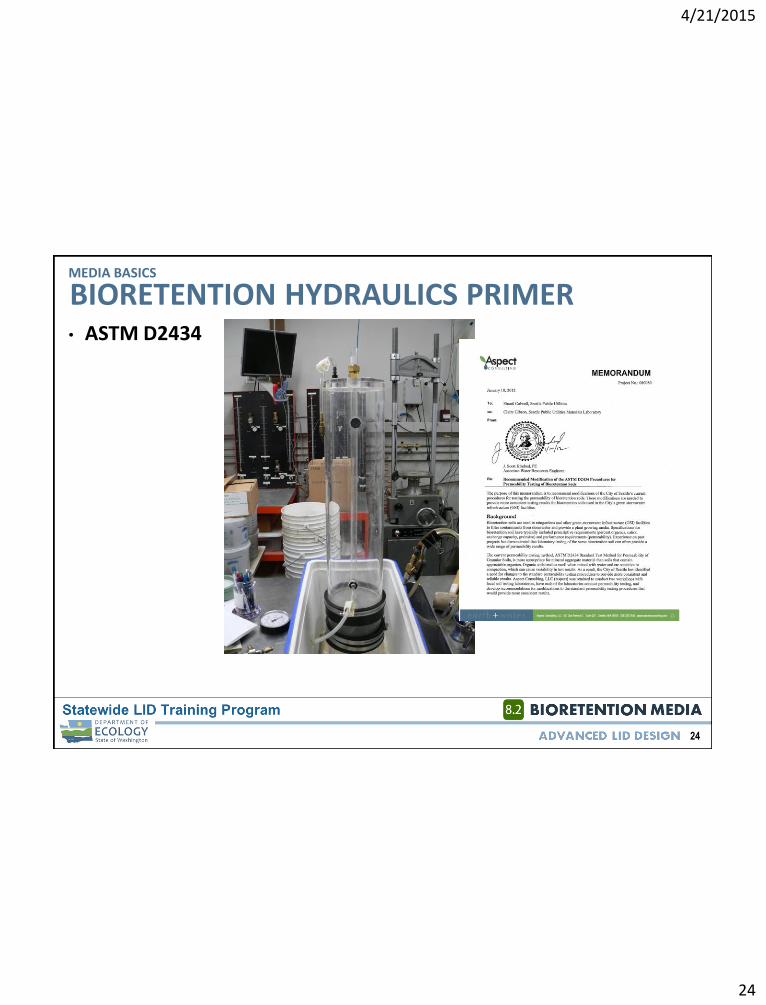
BIORETENTION HYDRAULICS PRIMERMEDIA BASICS
• ASTM D2434
4/21/2015
25
25
Break

4/21/2015
26
26
WATER QUALITY TREATMENT PRIMERMEDIA BASICS
All primary pathways for removing pollutants from storm flows are active in bioretention
• Stormwater volume reduction
• Sedimentation
• Filtration
• Phytoremediation
• Thermal attenuation
• Sorption
• Complexation
• Volatilzation

4/21/2015
27
27
WATER QUALITY TREATMENT PRIMERFactors influencing water quality treatment
• pH
• Temperature
• Hydraulic residence time
• Media (organic material, particle size, porosity, chemistry)
• Competing ions, ionic chemistry
• Soil water condition
• Influent concentration
MEDIA BASICS
4/21/2015
28
28
WATER QUALITY TREATMENT PRIMERIs the following statement correct?
• If an influent concentration of 5 µg/L into a bioretention area results in an effluent concentration of 10 µg/L
then
• an influent concentration of 50 µg/L will result in an effluent concentration of 100 µg/L.
MEDIA BASICS

4/21/2015
29
29
WATER QUALITY TREATMENT PRIMERSorption
• Ionic charge and speciation
• Functional groups (moiety)
• Organic material (TOC and DOC)
• Competing ions and ion exchange
• Particle size
Metal Fraction Mobility
Exchangeable FractionHigh. Changes in major cationic compositions may cause release due to ion exchange
Fe-Mn Oxides BoundCarbonate Bound
Medium. Changes in redox conditions may cause release
OM Bound Medium/high. Decomposition/oxidation with time.
MEDIA BASICS

4/21/2015
30
30
water quality treatment strategies
21
345

4/21/2015
31
31
TREATMENT STRATEGIES• Sorption and metal complexes
• Metal atom associated with group of molecules or anions
• Organically bound Cu often dominant fraction in soils
“Cu however, has a high affinity for soluble organic ligands and the formation of these complexes may greatly increase Cu mobility in soils.” (EPA 1992)
MEDIA BASICS

4/21/2015
32
32
TREATMENT STRATEGIES• Implications for copper
• To best manage Cu we will likely have to manage DOC
• Fe and Ca may be (likely), important for DOC capture
• Identify aggregate and organic materials with low Cu content and flushing potential
MEDIA BASICS

4/21/2015
33
33
TREATMENT STRATEGIES• Primary mechanisms for P
management
• Plant and microbial uptake
• Sorption and precipitation. Sorption materials include Al and Fe hydroxides and Ca
• Reactions are pH dependent. Calcium likely not a reliable material for binding P (higher pH best for precipitation)
MEDIA BASICS
Organic matter, fertilizers
Available P
Mineral P
Adsorbed P
inorganic
Microbial P
organic
leaching
weath
erin
g
pre
cip
itat
ion
Plant uptake
Methods for retaining phosphate

4/21/2015
34
34
TREATMENT STRATEGIESMEDIA BASICS
4/21/2015
35
35
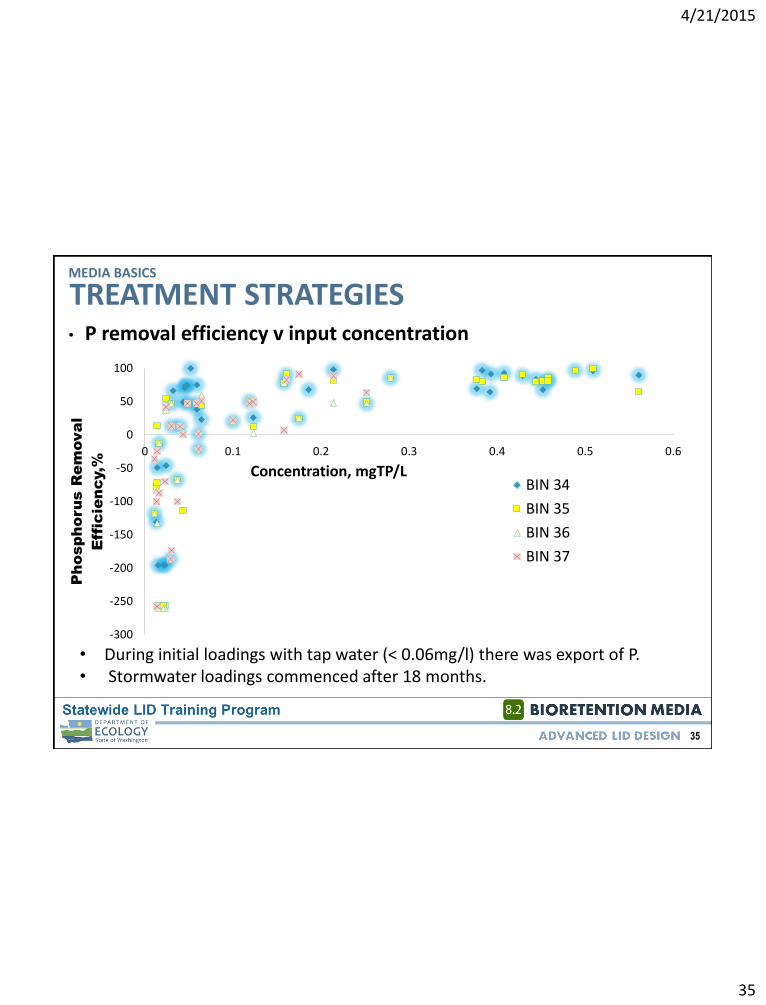
TREATMENT STRATEGIES• P removal efficiency v input concentration
MEDIA BASICS
-300
-250
-200
-150
-100
-50
0
50
100
0 0.1 0.2 0.3 0.4 0.5 0.6
Phosphorus R
em
oval
Efficiency,%
Concentration, mgTP/LBIN 34
BIN 35
BIN 36
BIN 37
• During initial loadings with tap water (< 0.06mg/l) there was export of P.• Stormwater loadings commenced after 18 months.
4/21/2015
36
36
TREATMENT STRATEGIESImplications for phosphorus
• Design with lower organic material content and upper range for C/N ratio (i.e. 35/1)
• Use organic material that is refractory (probably the older the better)
• Bind P with Al or Fe hydroxides
• Identify aggregate material with little to no P flushing
• Likely will need a polishing layer/filter if using compost
• Above design considerations likely most important for at least three years of installation
MEDIA BASICS

4/21/2015
37
37
TREATMENT STRATEGIESMethods for managing nitrate (biological transformations)
MEDIA BASICS
organic matter
mineralization
Ammonium (NH4
+)
nitrification
Nitrites (NO2
-)Nitrates (NO
3
-)
plant consumption
Denitrification (N
2, N
2O)
leaching
NO3- electron acceptor not O2 in anaerobic conditions2NO3- + 10e- + 12H+ N2 + 6H2OElectron donor may be sugar, hydrocarbon (simple) or complex (mulch).
4/21/2015
38
38
TREATMENT STRATEGIESMEDIA BASICS
4/21/2015
39
39
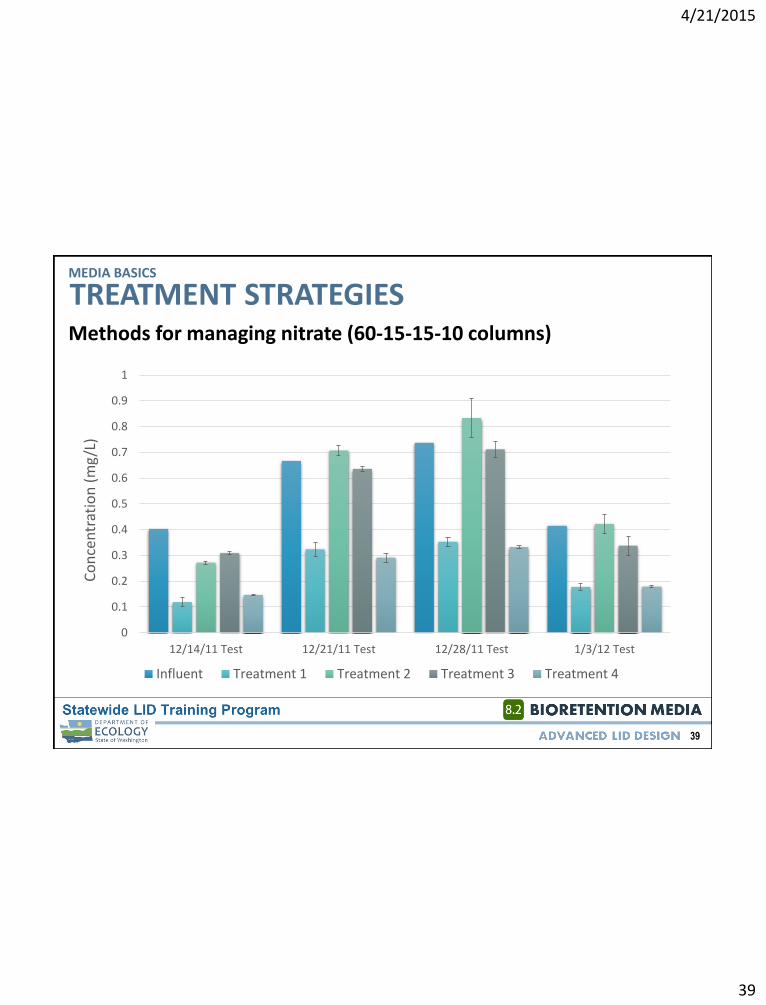
TREATMENT STRATEGIESMethods for managing nitrate (60-15-15-10 columns)
MEDIA BASICS
0
0.1
0.2
0.3
0.4
0.5
0.6
0.7
0.8
0.9
1
12/14/11 Test 12/21/11 Test 12/28/11 Test 1/3/12 Test
Co
nce
ntr
atio
n (
mg
/L)
Influent Treatment 1 Treatment 2 Treatment 3 Treatment 4

4/21/2015
40
40
TREATMENT STRATEGIESImplications
• Design with an elevated under-drain (multiple advantages to this approach)
• Caution: we don’t fully understand the potential for metal and P desorption in the anoxic zone
MEDIA BASICS
0
0.05
0.1
0.15
0.2
0.25
0.3
0.35
0.4
0.45
12/14/11 Test 12/21/11 Test 12/28/11 Test 1/3/12 Test
Co
nce
ntr
atio
n (
mg
/L)
Influent Treatment 1 Treatment 2 Treatment 3 Treatment 4
4/21/2015
41
41
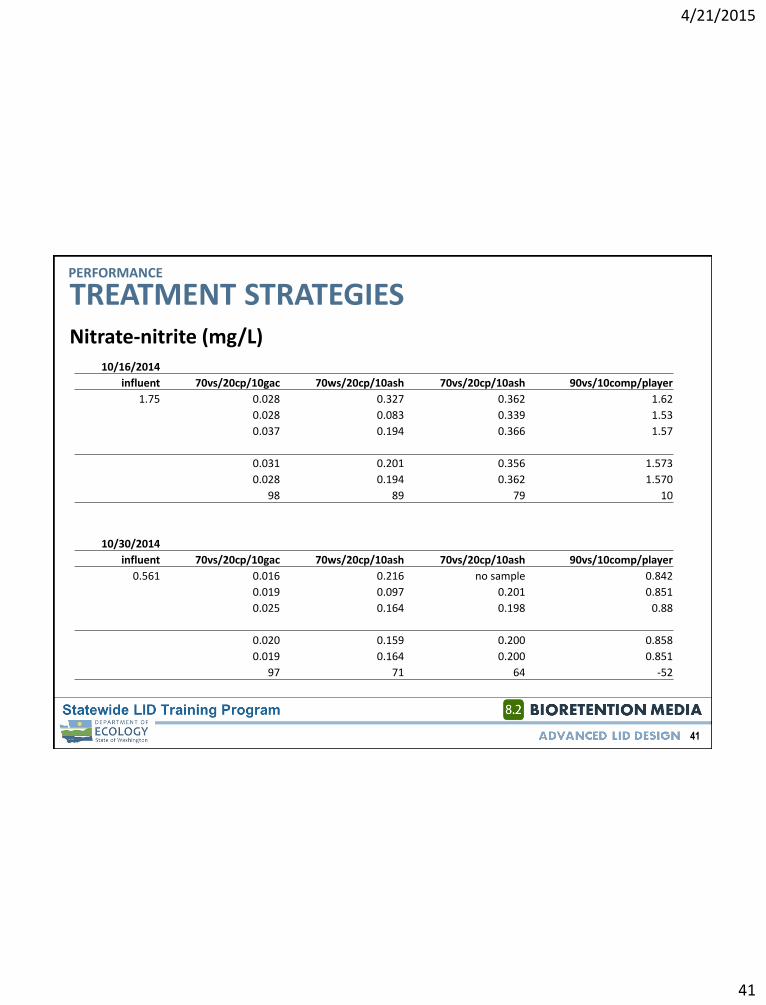
TREATMENT STRATEGIESPERFORMANCE
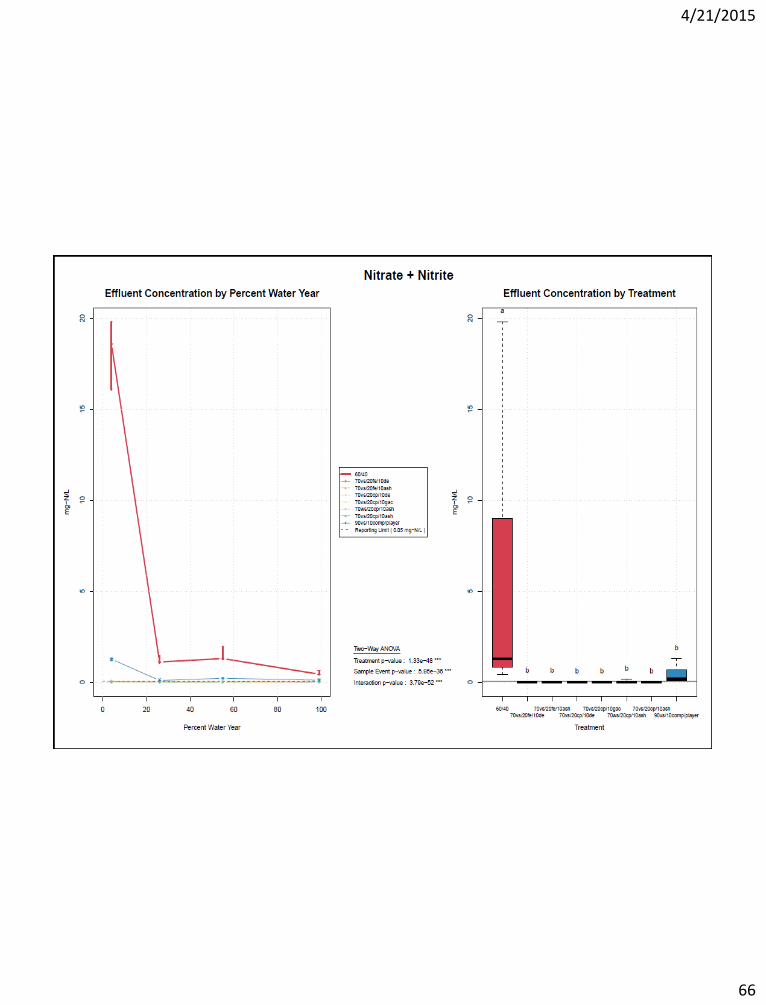
Nitrate-nitrite (mg/L)10/16/2014
influent 70vs/20cp/10gac 70ws/20cp/10ash 70vs/20cp/10ash 90vs/10comp/player
1.75 0.028 0.327 0.362 1.62
0.028 0.083 0.339 1.53
0.037 0.194 0.366 1.57
0.031 0.201 0.356 1.573
0.028 0.194 0.362 1.570
98 89 79 10
10/30/2014
influent 70vs/20cp/10gac 70ws/20cp/10ash 70vs/20cp/10ash 90vs/10comp/player
0.561 0.016 0.216 no sample 0.842
0.019 0.097 0.201 0.851
0.025 0.164 0.198 0.88
0.020 0.159 0.200 0.858
0.019 0.164 0.200 0.851
97 71 64 -52
4/21/2015
42
42
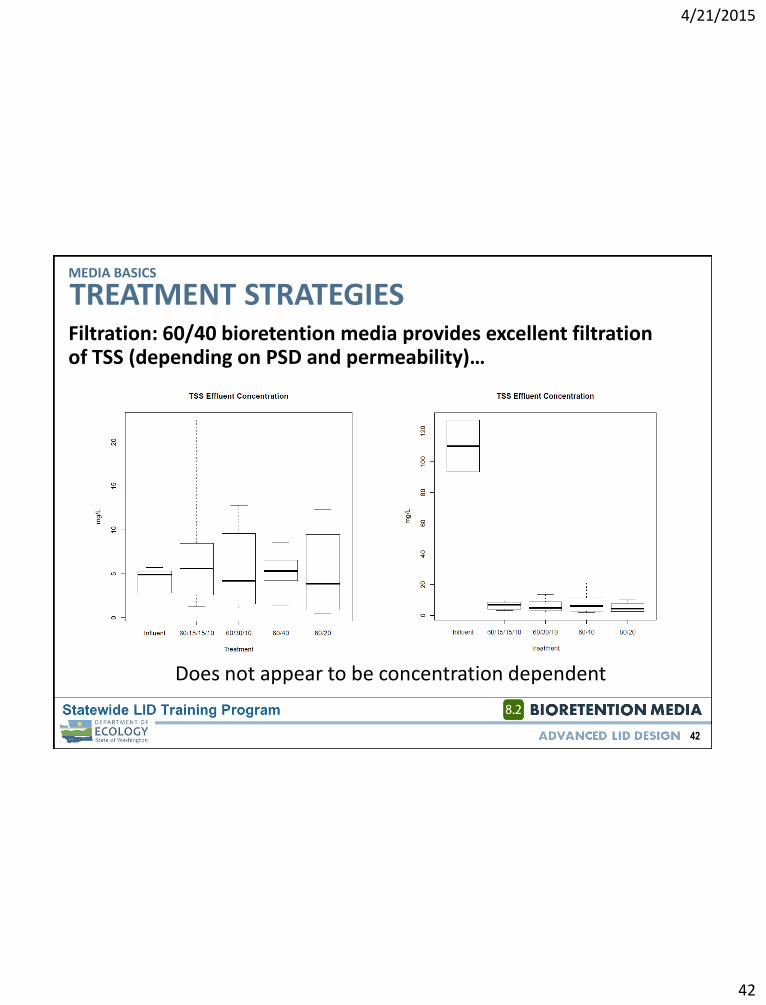
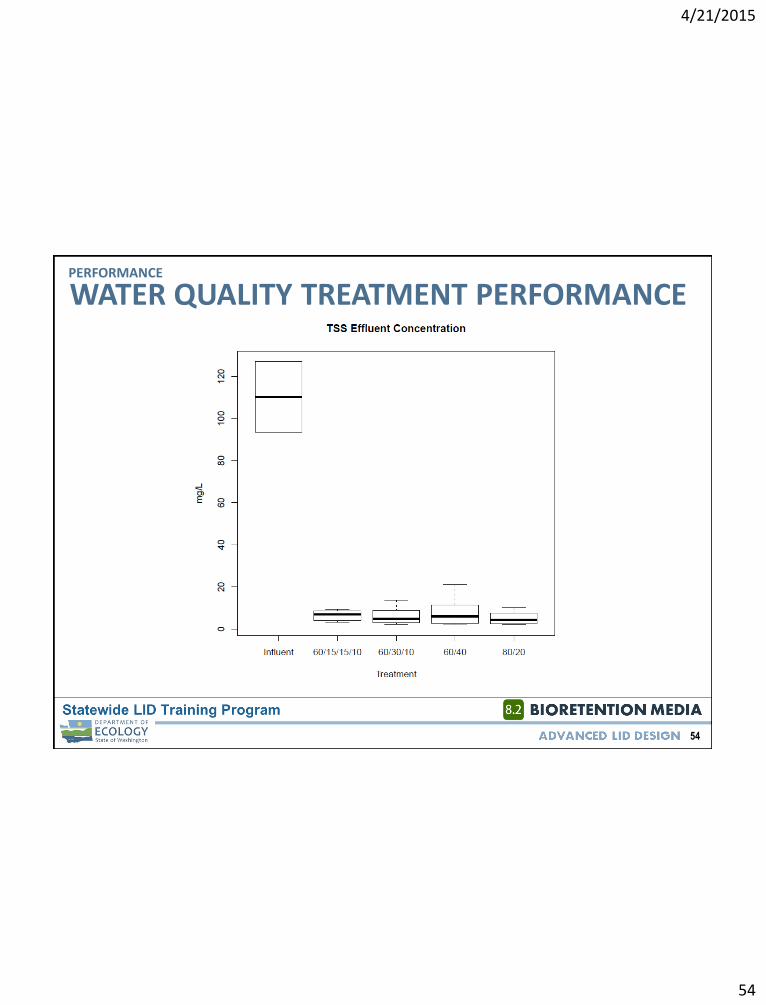
TREATMENT STRATEGIESFiltration: 60/40 bioretention media provides excellent filtration of TSS (depending on PSD and permeability)…
MEDIA BASICS
Does not appear to be concentration dependent

4/21/2015
43
43
performance
21
345
4/21/2015
44
44
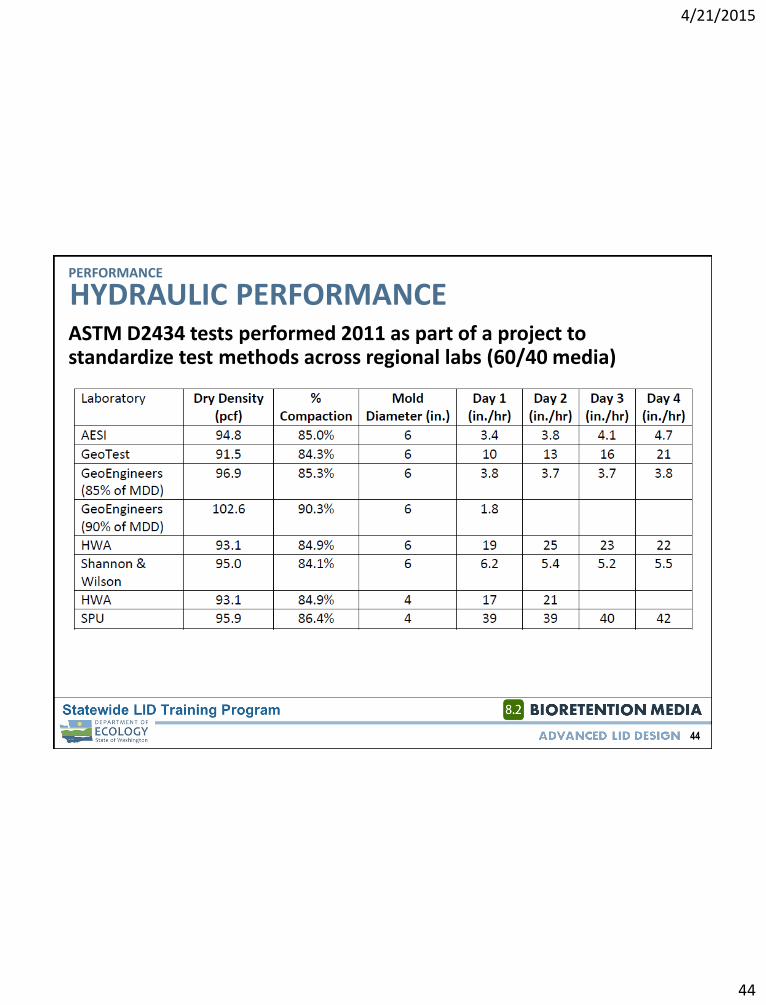
HYDRAULIC PERFORMANCEASTM D2434 tests performed 2011 as part of a project to standardize test methods across regional labs (60/40 media)
PERFORMANCE

4/21/2015
45
45
HYDRAULIC PERFORMANCE• Soil treatments
• 60% sand – 40% compost
• 80% sand – 20% compost
• 60% sand – 30% compost –10% WTRs
• 60%sand – 15% compost –15% shredded bark – 10% WTRs
• 60% sand – 10% biosolids –15% – shredded bark – 5% sawdust – 10% WTRs
PERFORMANCE
4/21/2015
46
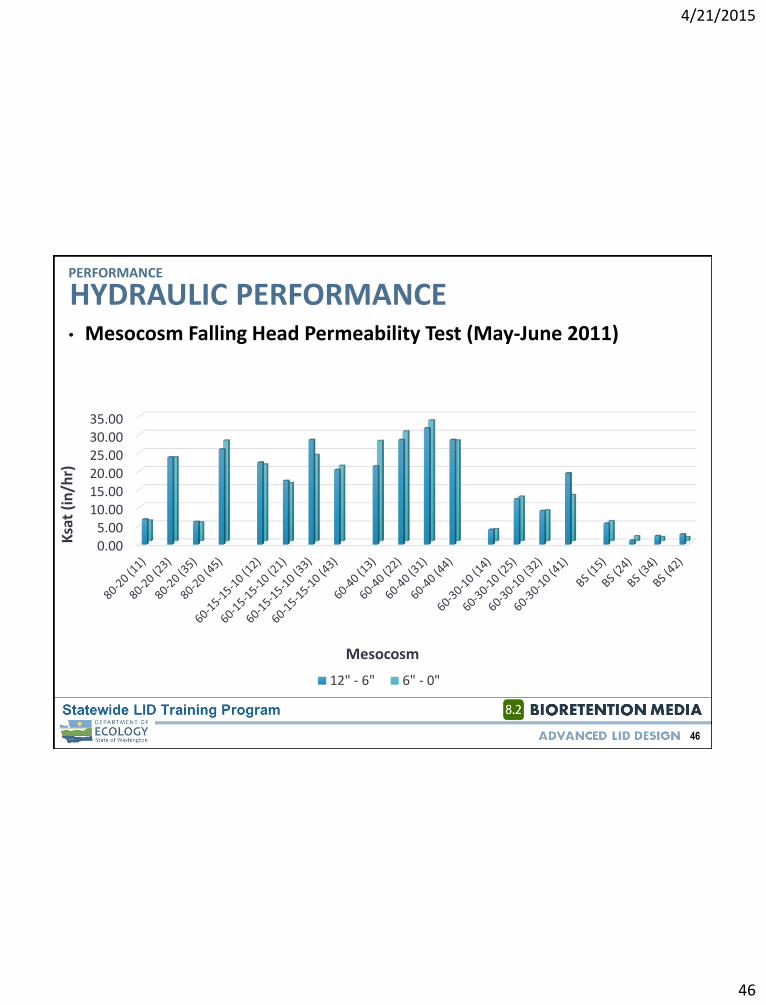
46
HYDRAULIC PERFORMANCE• Mesocosm Falling Head Permeability Test (May-June 2011)
0.005.00
10.0015.0020.0025.0030.0035.00
Ksa
t (i
n/h
r)
Mesocosm
12" - 6" 6" - 0"
PERFORMANCE

4/21/2015
47
47
HYDRAULIC PERFORMANCE• Mesocosm Falling Head Permeability Test (June 2012)
0.00
5.00
10.00
15.00
20.00
25.00
30.00
35.00
Ksa
t (i
n/h
r)
Mesocosm
12" - 6" 6" - 0"
PERFORMANCE

4/21/2015
48
48
HYDRAULIC PERFORMANCE• Mesocosm Falling Head Permeability Test (June 2013)
0.00
10.00
20.00
30.00
40.00
50.00
Ksa
t (i
n/h
r)
Mesocosm
12" - 6" 6" - 0"
PERFORMANCE

4/21/2015
49
49
HYDRAULIC PERFORMANCEASTM D2434 tests performed 2015 as part of a project to develop a high performance water quality treatment media
PERFORMANCE
51
69
81
138
32
91
148
0 20 40 60 80 100 120 140 160
70vs/20fe/10de
70vs/20fe/10ash
70vs/20cp/10de
70vs/20cp/10gac
70ws/20cp/10ash
70vs/20cp/10ash
90vs/10comp/player
Ksat (in/hr)
Trea
tmen
t
Mean Ksat Rates per ASTM 2434
4/21/2015
50
50
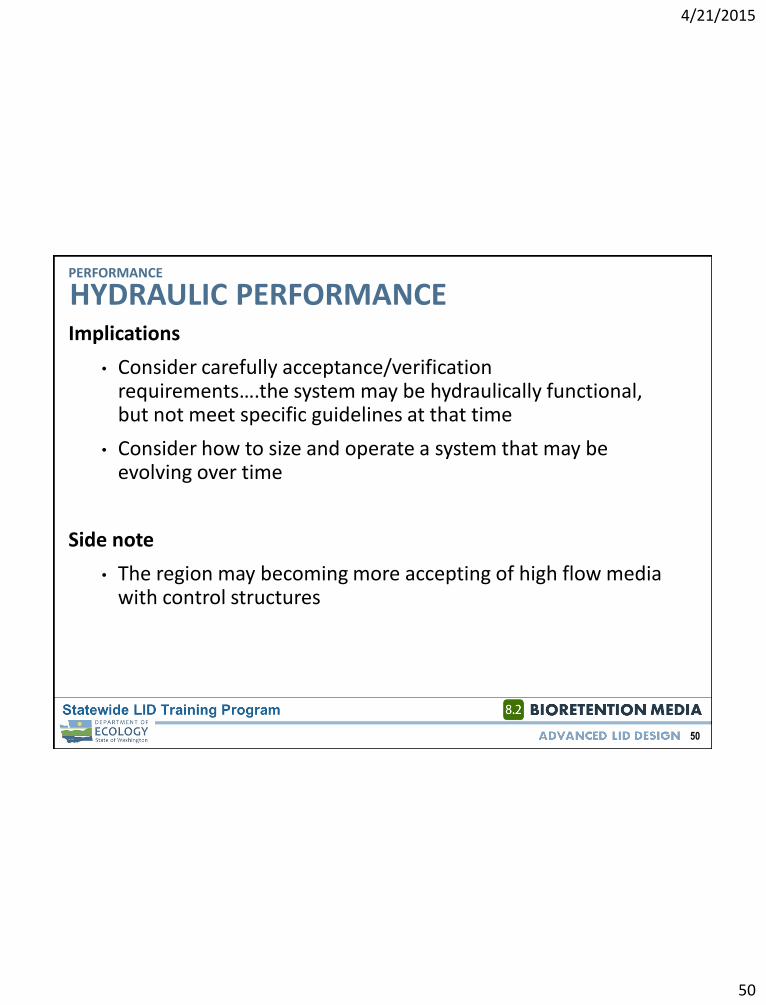
HYDRAULIC PERFORMANCEImplications
• Consider carefully acceptance/verification requirements….the system may be hydraulically functional, but not meet specific guidelines at that time
• Consider how to size and operate a system that may be evolving over time
Side note
• The region may becoming more accepting of high flow media with control structures
PERFORMANCE
4/21/2015
51
51
Lunch

4/21/2015
52
52
HYDRAULIC PERFORMANCECompost-based media
PERFORMANCE

4/21/2015
53
53
WATER QUALITY TREATMENT PERFORMANCEPERFORMANCE
4/21/2015
54
54
WATER QUALITY TREATMENT PERFORMANCEPERFORMANCE

4/21/2015
55
55
anything interesting
WATER QUALITY TREATMENT PERFORMANCEPERFORMANCE
4/21/2015
56
56
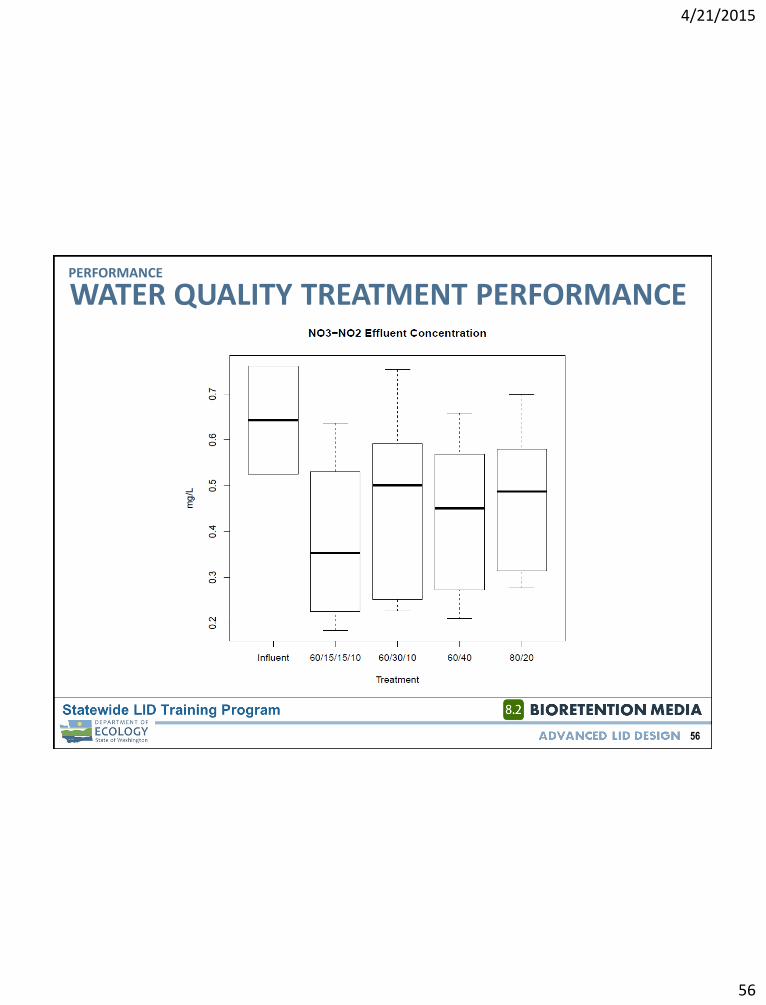
WATER QUALITY TREATMENT PERFORMANCEPERFORMANCE
4/21/2015
57
57
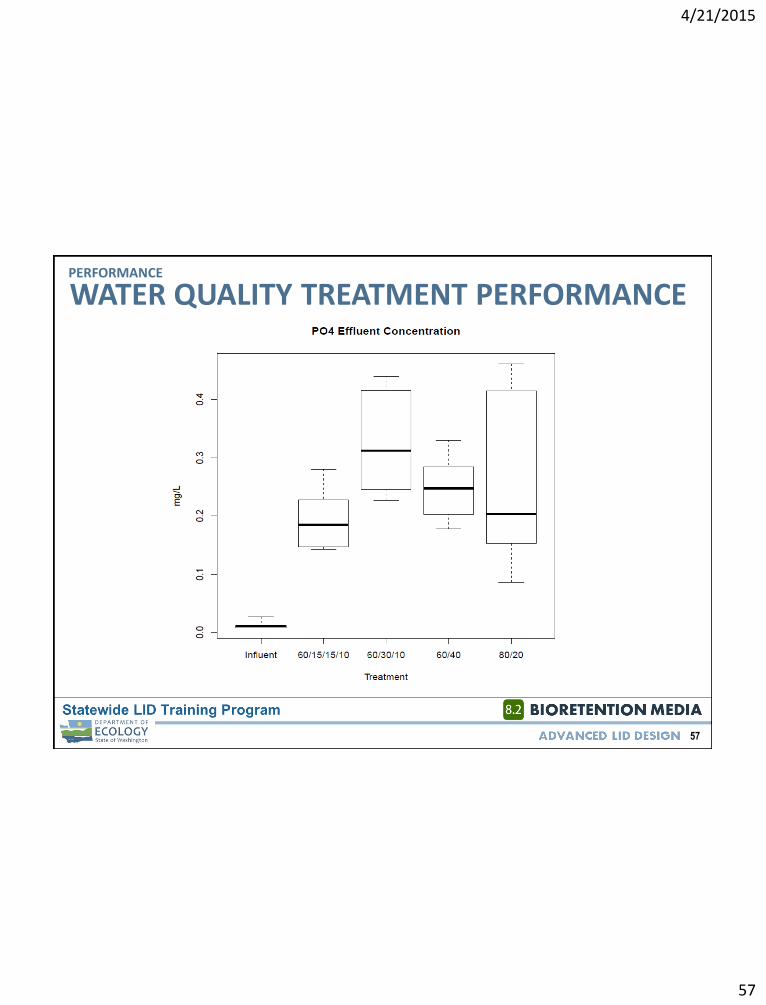
WATER QUALITY TREATMENT PERFORMANCEPERFORMANCE
4/21/2015
58
58
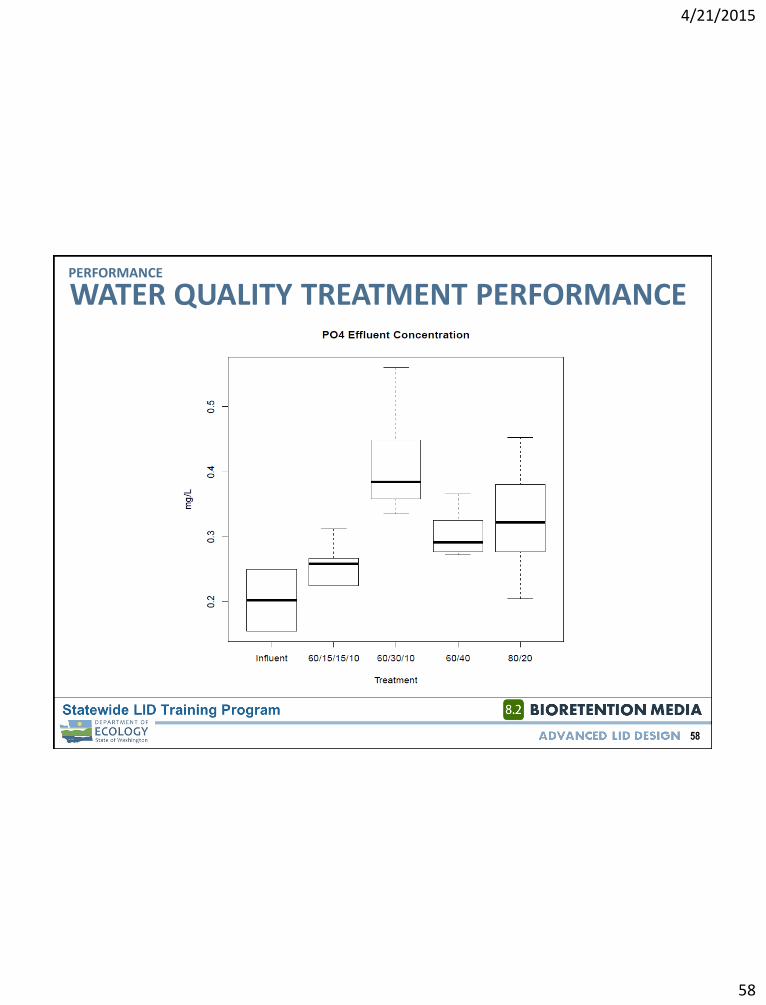
WATER QUALITY TREATMENT PERFORMANCEPERFORMANCE

4/21/2015
59
59
WATER QUALITY TREATMENT PERFORMANCEPERFORMANCE

4/21/2015
60
60
WATER QUALITY TREATMENT PERFORMANCEPERFORMANCE

4/21/2015
61
61
WATER QUALITY TREATMENT PERFORMANCEPERFORMANCE

4/21/2015
62
62
WATER QUALITY TREATMENT PERFORMANCEPERFORMANCE
4/21/2015
63
63
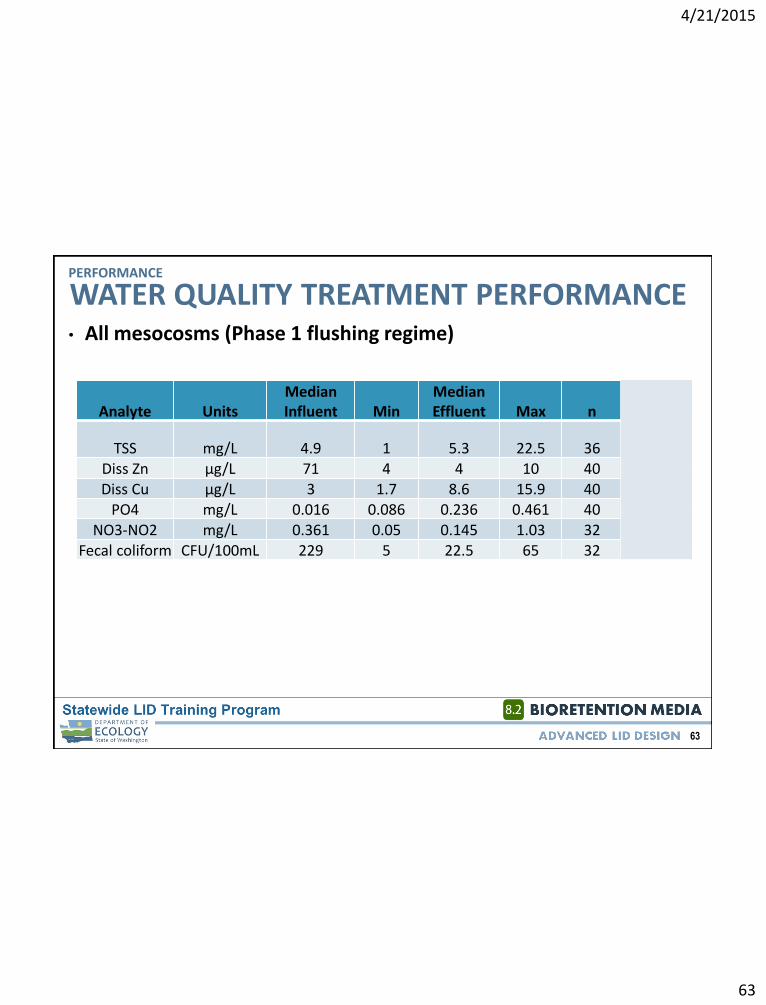
Analyte UnitsMedian Influent Min
Median Effluent Max n
Sand Result
TSS mg/L 4.9 1 5.3 22.5 36Diss Zn µg/L 71 4 4 10 40 20.0Diss Cu µg/L 3 1.7 8.6 15.9 40 14.0
PO4 mg/L 0.016 0.086 0.236 0.461 40 0.15NO3-NO2 mg/L 0.361 0.05 0.145 1.03 32 0.36
Fecal coliform CFU/100mL 229 5 22.5 65 32
• All mesocosms (Phase 1 flushing regime)
WATER QUALITY TREATMENT PERFORMANCEPERFORMANCE

4/21/2015
64
64
Developing a high-performance WQ treatment media
WATER QUALITY TREATMENT PERFORMANCEPERFORMANCE
4/21/2015
65
65
WATER QUALITY TREATMENT PERFORMANCEPERFORMANCE
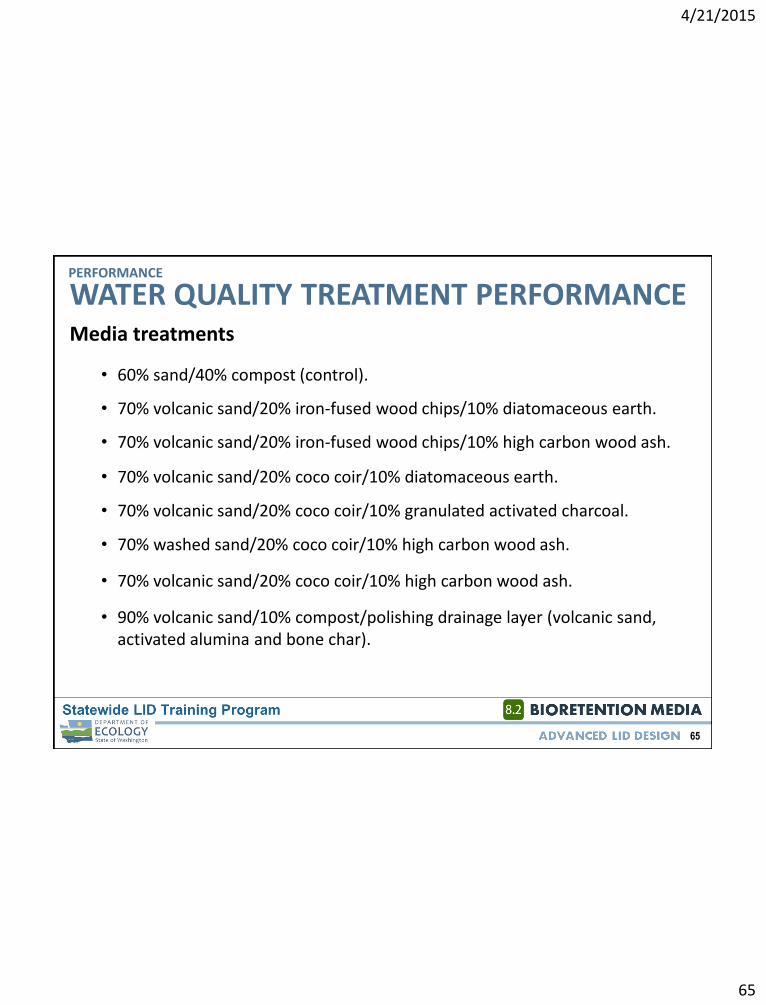
Media treatments
• 60% sand/40% compost (control).
• 70% volcanic sand/20% iron-fused wood chips/10% high carbon wood ash.
• 70% volcanic sand/20% iron-fused wood chips/10% diatomaceous earth.
• 70% volcanic sand/20% coco coir/10% diatomaceous earth.
• 70% volcanic sand/20% coco coir/10% granulated activated charcoal.
• 70% washed sand/20% coco coir/10% high carbon wood ash.
• 70% volcanic sand/20% coco coir/10% high carbon wood ash.
• 90% volcanic sand/10% compost/polishing drainage layer (volcanic sand, activated alumina and bone char).
4/21/2015
66
66
WATER QUALITY TREATMENT PERFORMANCEPERFORMANCE
4/21/2015
67
67
WATER QUALITY TREATMENT PERFORMANCEPERFORMANCE
4/21/2015
68
68
WATER QUALITY TREATMENT PERFORMANCEPERFORMANCE

4/21/2015
69
69
WATER QUALITY TREATMENT PERFORMANCEPERFORMANCE
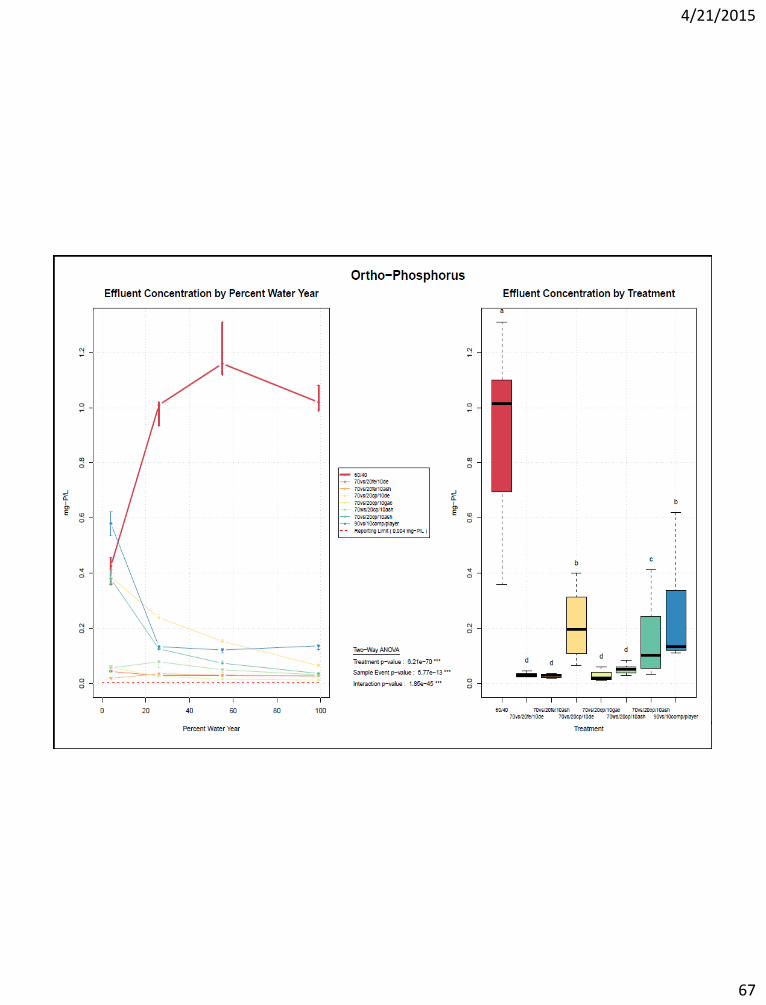
• 60% sand/40% compost (control) flushing concentrations 1-2 orders of magnitude greater than treatments.
• All treatments exhibit a standard flushing pattern for N and Cu; however, ortho-P flushing increases before decreasing in 60/40. Other research showing extended flushing of ortho-P in compost medias.
• In general, the coco coir pith and GAC or high carbon wood ash best performers for minimal flushing.
Flushing findings
4/21/2015
70
70
WATER QUALITY TREATMENT PERFORMANCEPERFORMANCE
4/21/2015
71
71
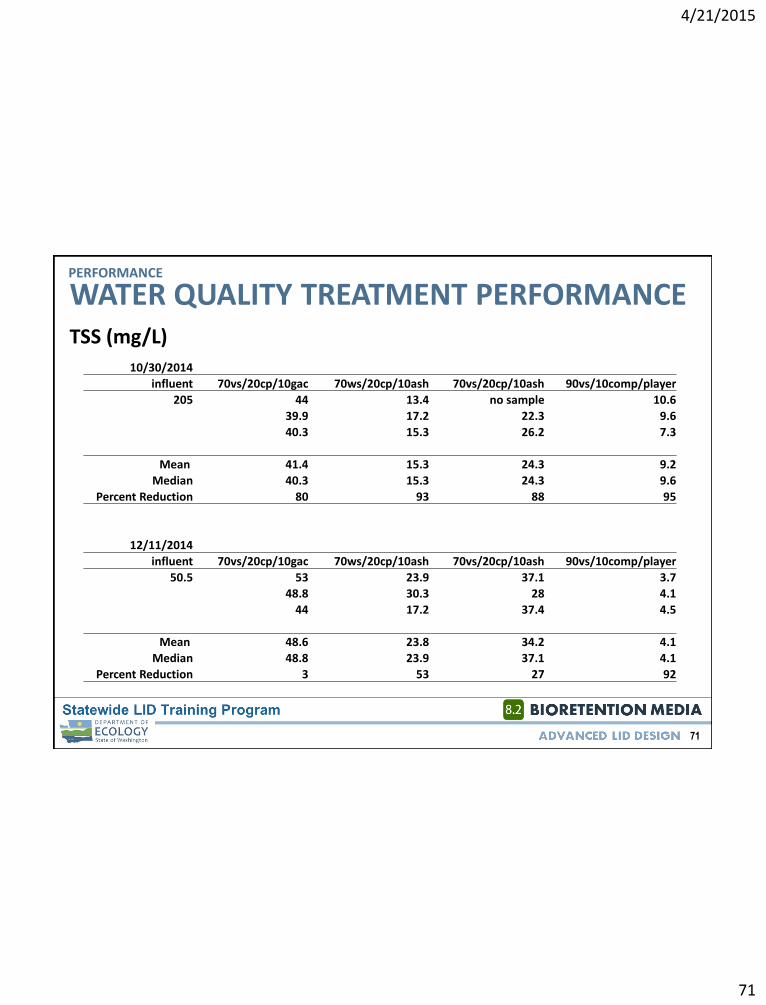
WATER QUALITY TREATMENT PERFORMANCEPERFORMANCE
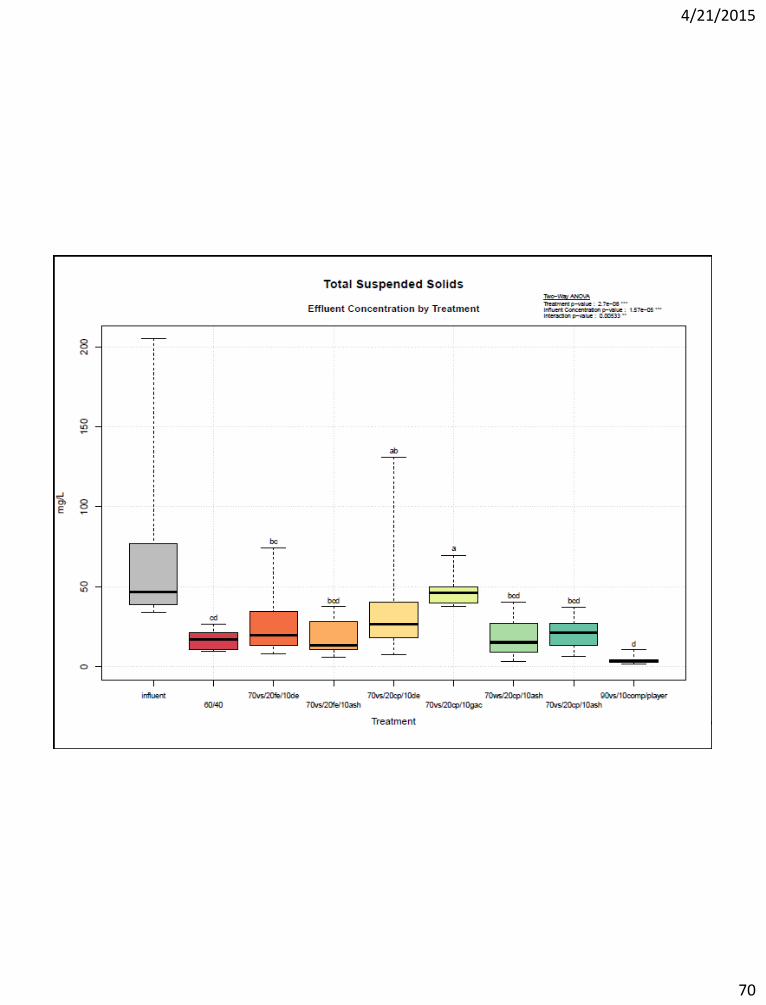
TSS (mg/L)
10/30/2014
influent 70vs/20cp/10gac 70ws/20cp/10ash 70vs/20cp/10ash 90vs/10comp/player
205 44 13.4 no sample 10.6
39.9 17.2 22.3 9.6
40.3 15.3 26.2 7.3
Mean 41.4 15.3 24.3 9.2
Median 40.3 15.3 24.3 9.6
Percent Reduction 80 93 88 95
12/11/2014
influent 70vs/20cp/10gac 70ws/20cp/10ash 70vs/20cp/10ash 90vs/10comp/player
50.5 53 23.9 37.1 3.7
48.8 30.3 28 4.1
44 17.2 37.4 4.5
Mean 48.6 23.8 34.2 4.1
Median 48.8 23.9 37.1 4.1
Percent Reduction 3 53 27 92

4/21/2015
72
72
WATER QUALITY TREATMENT PERFORMANCEPERFORMANCE

4/21/2015
73
73
WATER QUALITY TREATMENT PERFORMANCEPERFORMANCE
Ortho-P (mg/L)12/11/2014
influent 70vs/20cp/10gac 70ws/20cp/10ash 70vs/20cp/10ash 90vs/10comp/player
1.13 0.097 0.016 no sample 0.102
0.085 0.022 0.229 0.092
0.099 0.02 0.204 0.119
Mean 0.094 0.019 0.217 0.104
Median 0.097 0.020 0.217 0.102
Percent Reduction 91 98 81 91
12/11/2014
influent 70vs/20cp/10gac 70ws/20cp/10ash 70vs/20cp/10ash 90vs/10comp/player
0.145 0.058 0.018 0.068 0.08
0.061 0.025 0.067 0.098
0.069 0.022 0.066 0.104
Mean 0.063 0.022 0.067 0.094
Median 0.061 0.022 0.067 0.098
Percent Reduction 58 85 54 32
4/21/2015
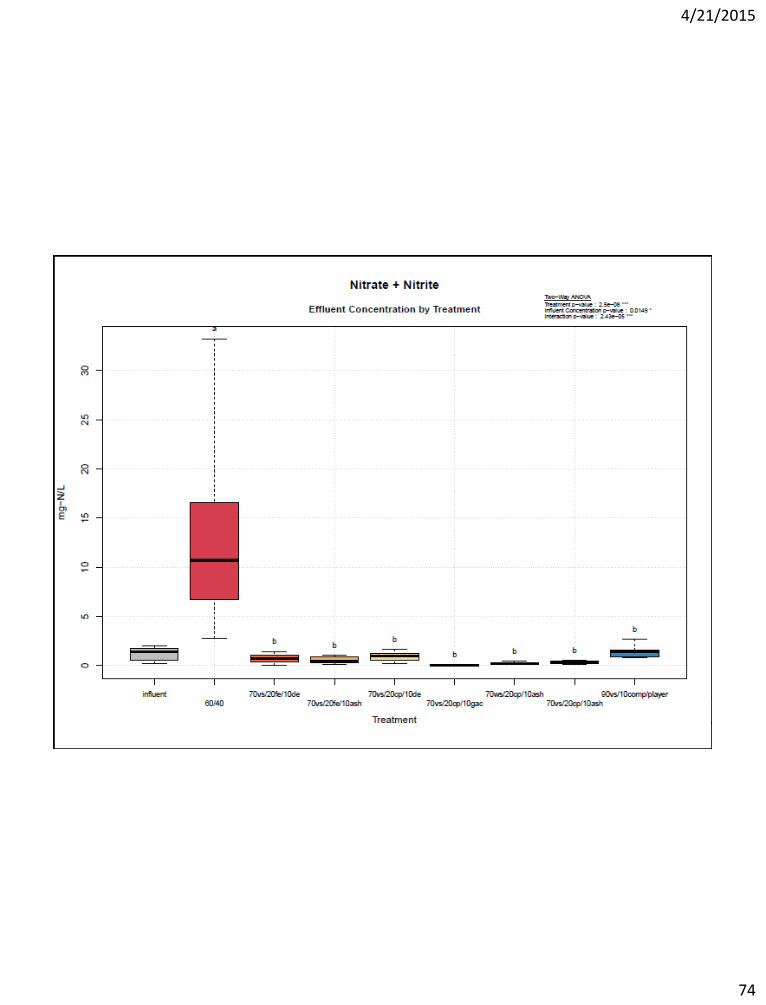
74
74
WATER QUALITY TREATMENT PERFORMANCEPERFORMANCE

4/21/2015
75
75
WATER QUALITY TREATMENT PERFORMANCEPERFORMANCE

4/21/2015
76
76
WATER QUALITY TREATMENT PERFORMANCEPERFORMANCE
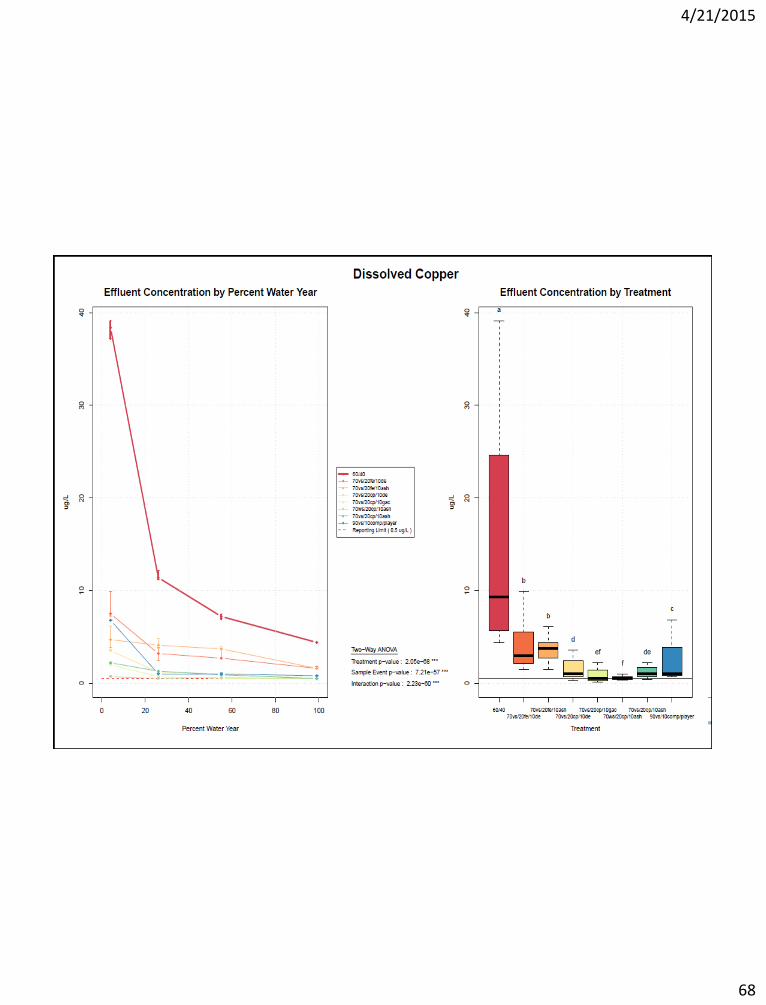
Dissolved Cu (µg/L)10/30/2014
influent 70vs/20cp/10gac 70ws/20cp/10ash 70vs/20cp/10ash 90vs/10comp/player
297 11.7 7 no sample 13.9
12 8.1 14.5 15.9
12.8 7.7 14.8 16.5
Mean 12.2 7.6 14.7 15.4
Median 12.0 7.7 14.7 15.9
Percent Reduction 96 97 95 95
12/11/2014
influent 70vs/20cp/10gac 70ws/20cp/10ash 70vs/20cp/10ash 90vs/10comp/player
8 3.6 3.3 5.7 8.4
3.7 3.2 5.7 9.1
3.8 2.8 5.2 7.3
Mean 3.7 3.1 5.5 8.3
Median 3.7 3.2 5.7 8.4
Percent Reduction 54 60 29 -5

4/21/2015
77
77
WATER QUALITY TREATMENT PERFORMANCEPERFORMANCE
Dosing findings
• 60% sand/40% compost (control) effluent concentrations 1-2 orders of magnitude greater for N and P than treatments.
• Significant release of dissolved Cu in treatments with iron coated wood chips during dosing.
• Coco coir and GAC or high carbon wood ash best performers for N, P and Cu capture.
• Very good dissolved Cu management at low and high influent concentrations for coco coir pith and GAC or high carbon wood ash treatments.
• Good N and P management at low and high influent concentrations for coco coir pith and GAC or high carbon wood ash.
4/21/2015
78
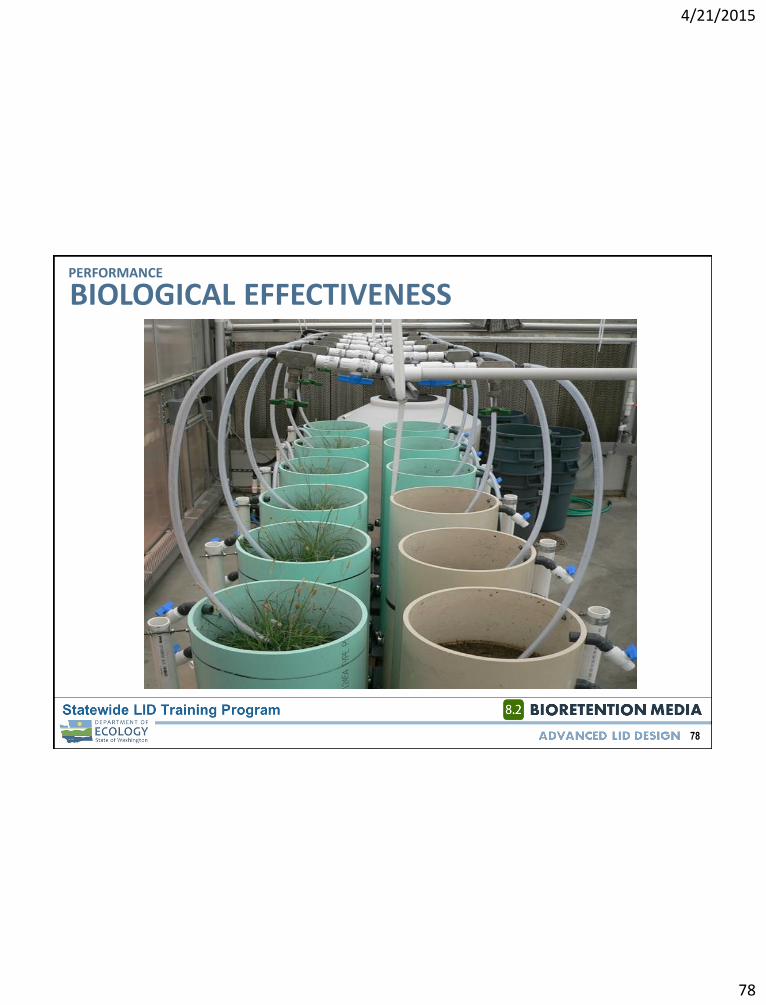
78
BIOLOGICAL EFFECTIVENESSPERFORMANCE
4/21/2015
79
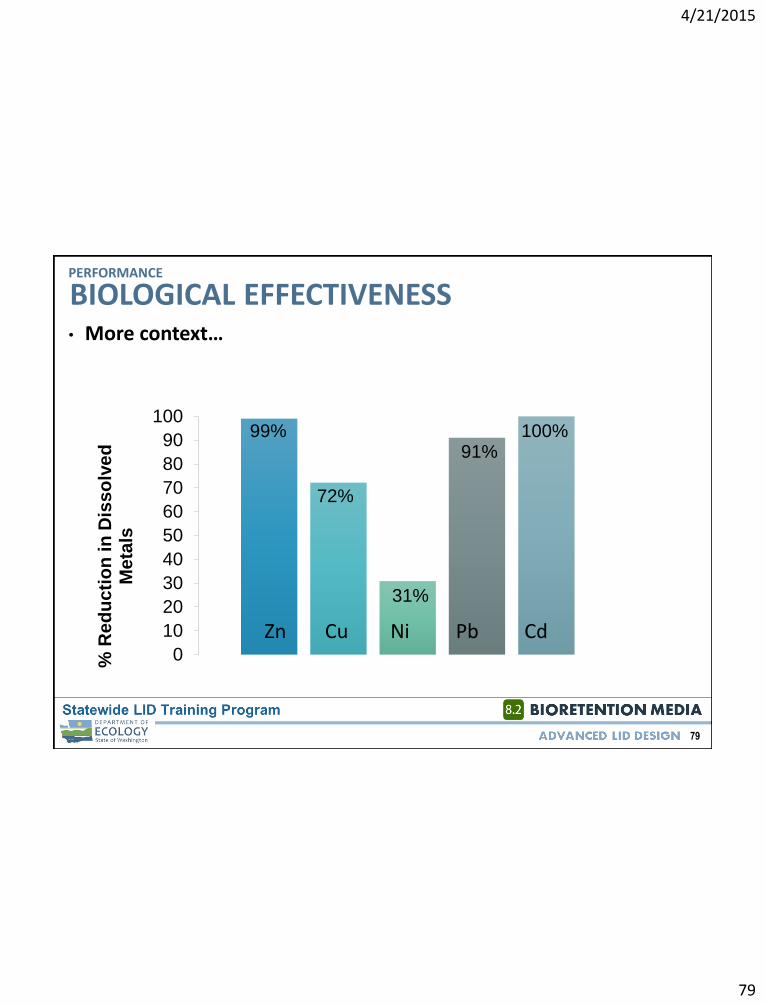
79
BIOLOGICAL EFFECTIVENESS• More context…
PERFORMANCE
0
10
20
30
40
50
60
70
80
90
100
% R
ed
ucti
on
in
Dis
so
lved
M
eta
ls
99%
72%
31%
91%100%
Zn Cu Ni Pb Cd

4/21/2015
80
80
Animal Model Effect Exposure Reduced Eliminated
Juv. coho Mortality 96 h 100% ✓
Mayfly nymph Mortality 48 h 100% ✓
Zebrafish Mortality 96 h 100% ✓
Daphnid Mortality 48 h 100% ✓
Reproductive Impairment
7 d 100% ✓
Zebrafish Cardiac dysfunction 48 h 100% ✓
Growth impairment 96 h 100% ✓
Cardiac edema 96 h 100% ✓
Swim bladder 96 h 100% ✓
Microphthalmia 96 h 81%
CYP1a induction 48 h TBD TBD
Cardiac genes 48 h TBD TBD
BIOLOGICAL EFFECTIVENESSPERFORMANCE
4/21/2015
81
81
21
345 wrap-up
4/21/2015
82
82
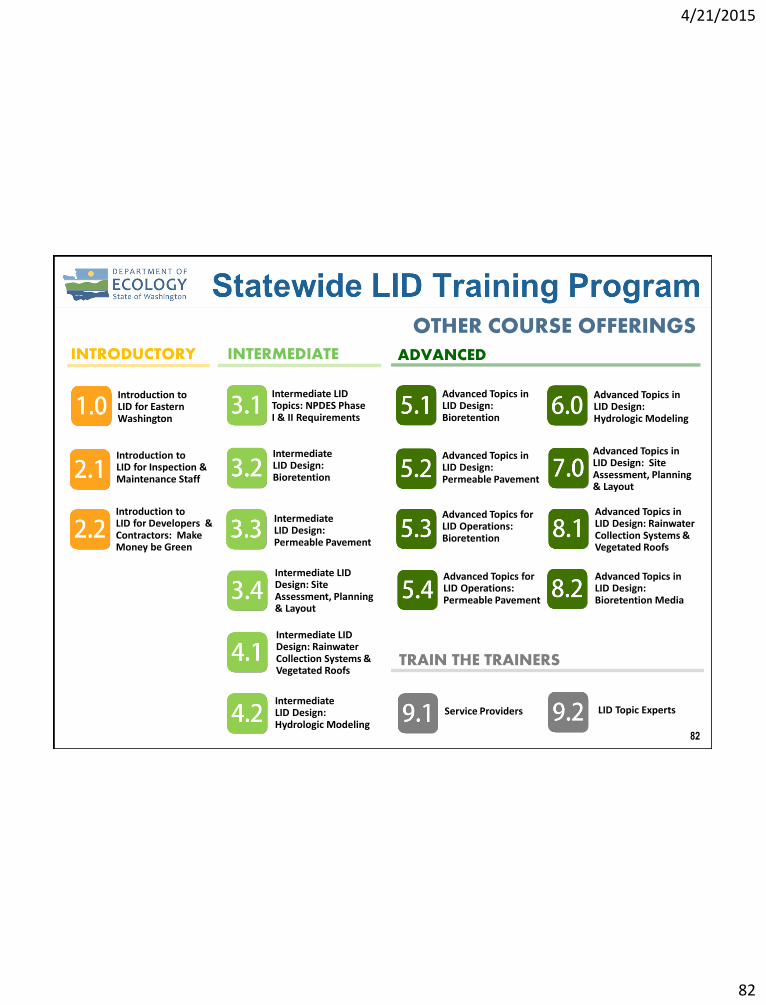
OTHER COURSE OFFERINGS
Introduction toLID for Eastern Washington
INTRODUCTORY INTERMEDIATE ADVANCED
TRAIN THE TRAINERS
Service Providers
Introduction toLID for Inspection & Maintenance Staff
Introduction toLID for Developers & Contractors: Make Money be Green
Intermediate LID Design: Rainwater Collection Systems & Vegetated Roofs
Intermediate LID Topics: NPDES Phase I & II Requirements
Intermediate LID Design: Permeable Pavement
Intermediate LID Design: Hydrologic Modeling
Advanced Topics in LID Design:Bioretention
Advanced Topics in LID Design:Permeable Pavement
Advanced Topics in LID Design:Hydrologic Modeling
Advanced Topics in LID Design: Site Assessment, Planning & Layout
LID Topic Experts
Advanced Topics in LID Design: Rainwater Collection Systems & Vegetated Roofs
Advanced Topics in LID Design:Bioretention Media
Advanced Topics for LID Operations: Bioretention
Intermediate LID Design: Bioretention
Advanced Topics for LID Operations: Permeable Pavement
Intermediate LID Design: Site Assessment, Planning & Layout
4/21/2015
83
83
ONLINE EVALUATION
• An on-line evaluation will be sent to you within 5 days following this training
• Feedback will help to refine future trainings
• Feedback is also important to pursue funding to support a long-term statewide LID training program

4/21/2015
84
84
CERTIFICATE
Two certificates:
• LID Design certificate
• Long-term LID Operations certificate
• Stay tuned for developing certificate policies
Sign out!

4/21/2015
85
85
ONLINE RESOURCES
For information on training and other resources, visit the Washington Stormwater Center website:
http://www.wastormwatercenter.org
Stay connected through Social Media
• Come “Like” our Page
• Sign up to follow and get Tweets

4/21/2015
86
86
PROJECT LEAD
QUESTIONS
CORE TEAM
Further questions? Contact:
(206) 449-1163