powerpoint: charts and graphs hsc it center training randy graff 273-5051
TRANSCRIPT

PowerPoint: Charts and Graphs
HSC IT Center Training
Randy Graff
273-5051
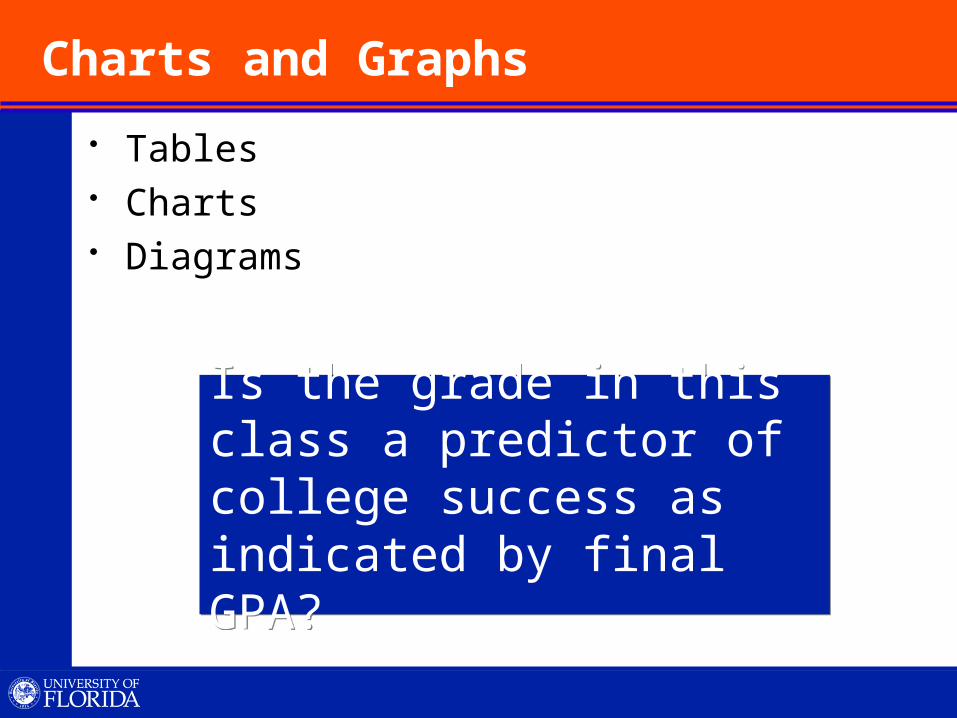
Charts and Graphs
Tables Charts Diagrams
Is the grade in this class a predictor of college success as indicated by final GPA?
Is the grade in this class a predictor of college success as indicated by final GPA?

Tables
Inserting Adding Data Modifying and Formatting Copying and Pasting

Tables: Inserting
Click Title and Content layout
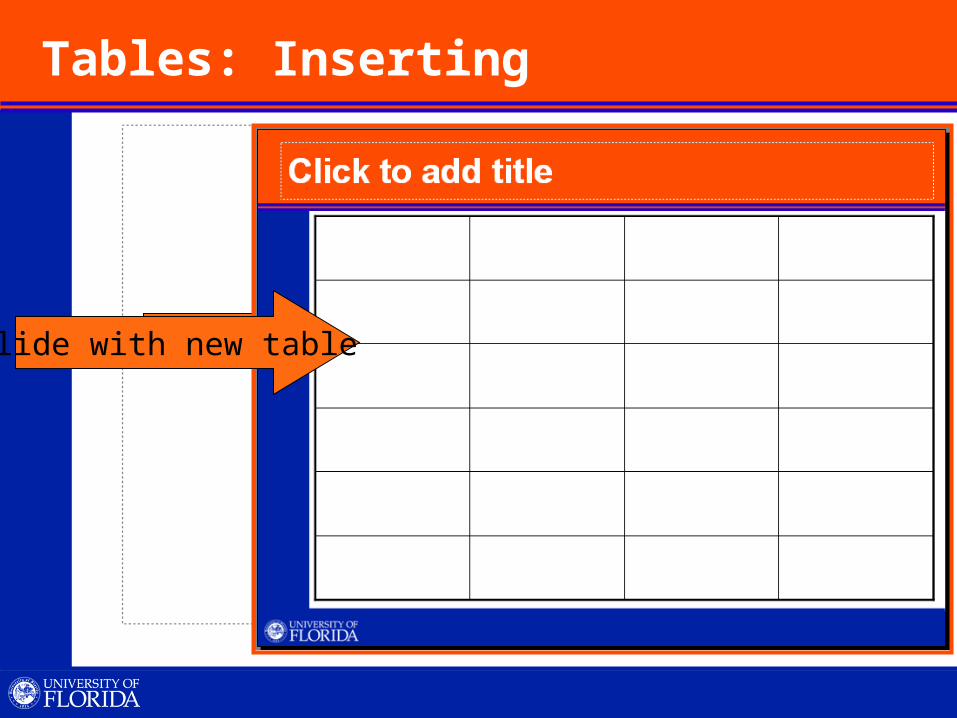
Tables: Inserting
Click Insert Table
Insert the desired number of columns
and rows
Slide with new table

Tables: Adding Data
Informant Year Class Grade GPA
00001 2007 A 4.0
00002 2009 C 2.0
00003 2006 C 4.0
00004 2006 B 3.0
00005 2007 A 4.0

4.0A200700005
3.0B200600004
4.0C200600003
2.0C200900002
4.0A200700001
GPAClass GradeYearInformant
4.0A200700005
3.0B200600004
4.0C200600003
2.0C200900002
4.0A200700001
GPAClass GradeYearInformant
Tables: Modifying and Formatting
Type in data Resizing Justification and cell alignment Colors

Tables: Resizing
Column width or row height
Entire table (less font size)
Font size

Tables: Justification and Cell Alignment
Vertical text alignment
Horizontal text alignment (justification)

Tables: Color
Fill Color Text Color

Tables: Copying and Pasting
Paste Paste Special: Word Object Paste Special: Image Paste Special: Text Paste Special: Link

Tables: Copying and Pasting
Informant Year Class Grade GPA
00001 2007 A 4.0
00002 2009 C 2.0
00003 2009 C 4.0
00004 2006 B 3.0
00005 2007 A 4.0

Tables: Paste Special - Word
Informant Year Class Grade GPA 00001 2007 A 4.0 00002 2009 C 2.0 00003 2009 C 4.0 00004 2006 B 3.0 00005 2007 A 4.0
A copy

Tables: Paste Special - Image
Informant Year Class Grade GPA 00001 2007 A 4.0 00002 2009 C 2.0 00003 2009 C 4.0 00004 2006 B 3.0 00005 2007 A 4.0

Tables: Paste Special - Text
Informant Year Class GradeGPA
00001 2007 A 4.0
00002 2009 C 2.0
00003 2009 C 4.0
00004 2006 B 3.0
00005 2007 A 4.0

Tables: Paste Special - Link
Informant Year Class Grade GPA 00001 2007 A 4.0 00002 2009 C 2.0 00003 2009 C 4.0 00004 2006 B 3.0 00005 2007 A 4.0
Linked to
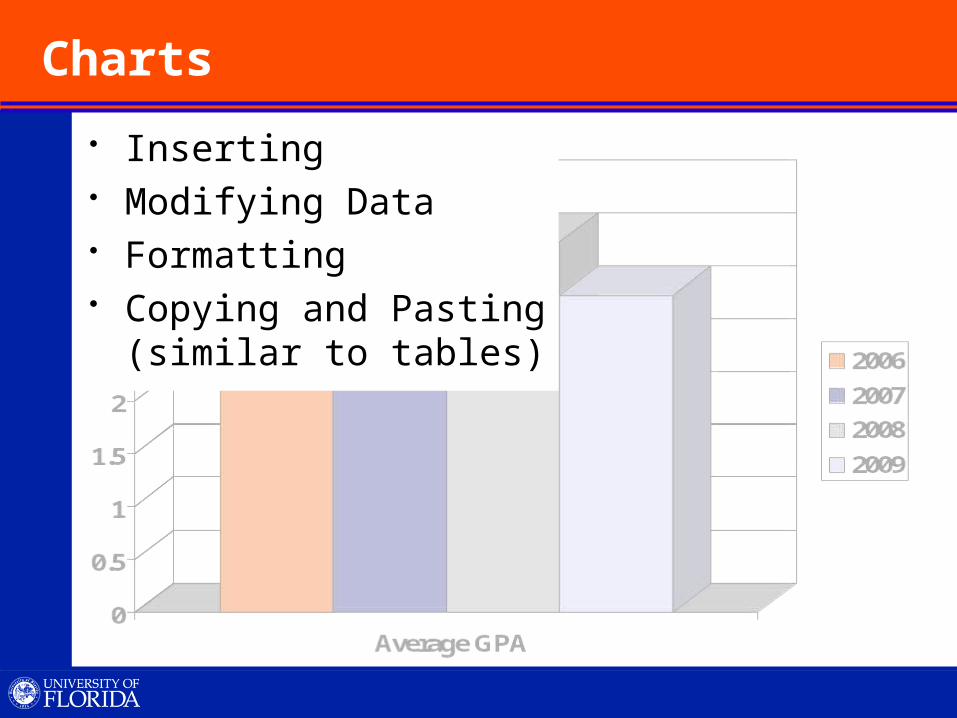
Charts
Inserting Modifying Data Formatting Copying and Pasting
(similar to tables)

Charts: Inserting
Click Title and Content layout

Click Insert Chart
Charts: Inserting

Charts: Inserting
Menu
Standard ToolbarChart Type
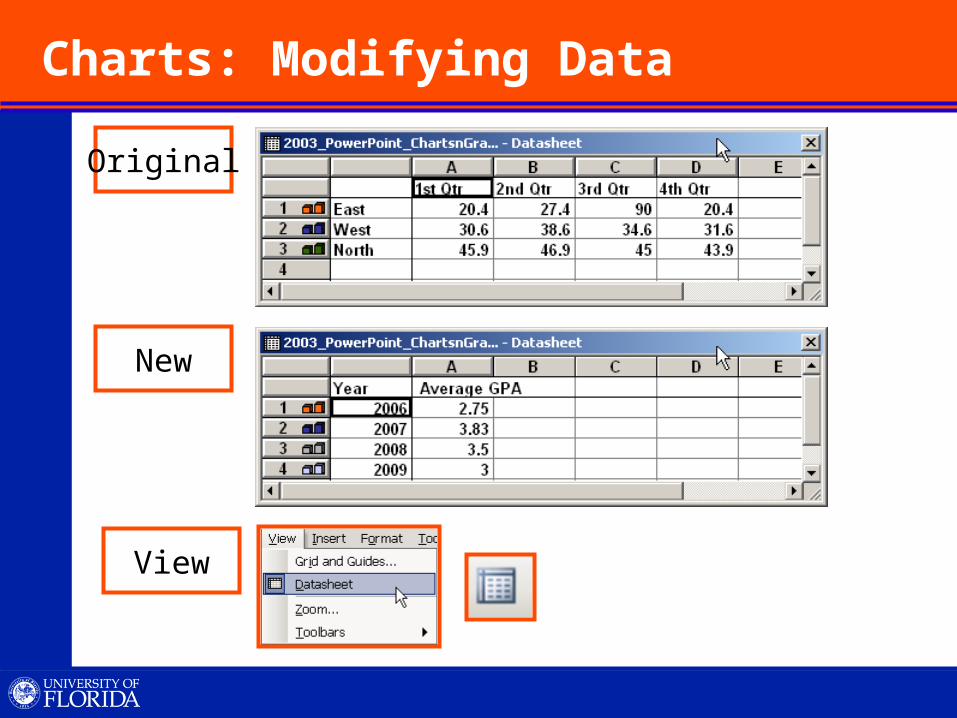
Charts: Modifying Data
Original
New
View

Charts: Formatting
Legend
Axis
Axis
DataPoint
Walls
Chart
Plot

Diagrams
Organizational Cycle Radial Pyramid Venn Target
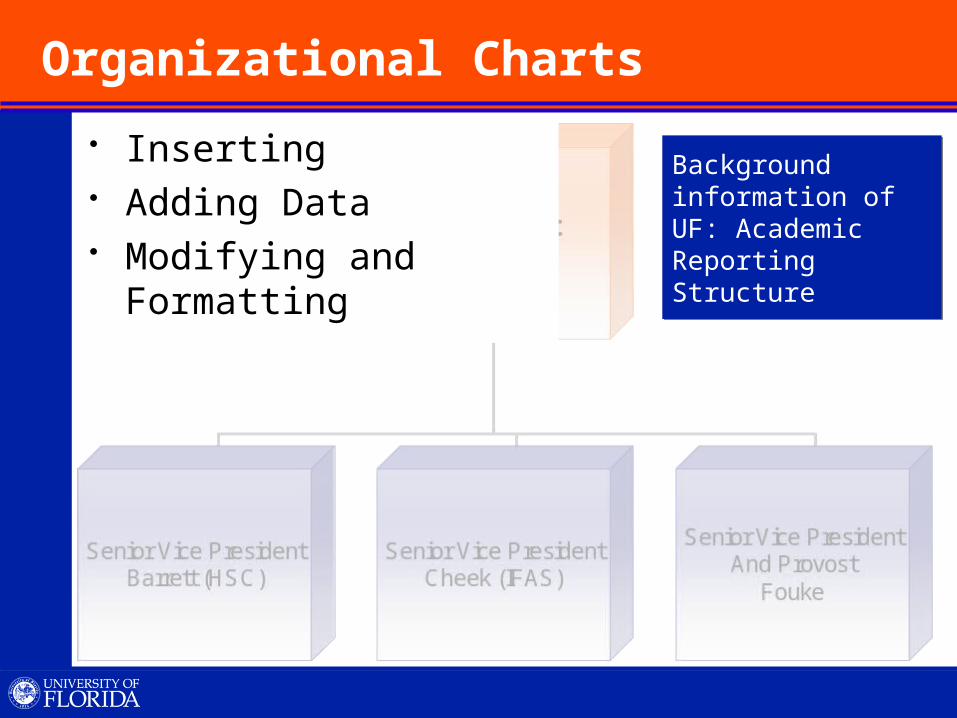
Organizational Charts
Inserting Adding Data Modifying and Formatting
Background information of UF: Academic Reporting Structure
Background information of UF: Academic Reporting Structure

Charts: Inserting
Click Title and Content layout

Organizational Chart: Inserting
Click Diagram or Organizational chart

Organizational Chart: Add Data
PresidentMachen
Senior Vice PresidentBarrett (HSC)
Senior Vice PresidentCheek (IFAS)
Senior Vice PresidentAnd Provost
Fouke
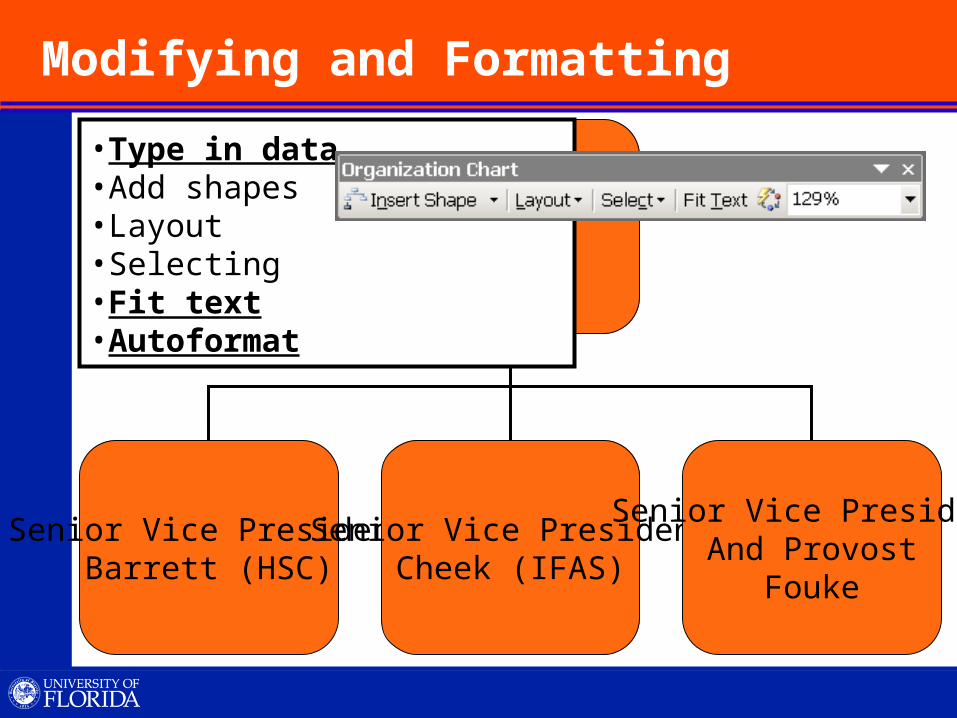
Modifying and Formatting
PresidentMachen
Senior Vice PresidentBarrett (HSC)
Senior Vice PresidentCheek (IFAS)
Senior Vice PresidentAnd Provost
Fouke
•Type in data•Add shapes•Layout•Selecting•Fit text•Autoformat
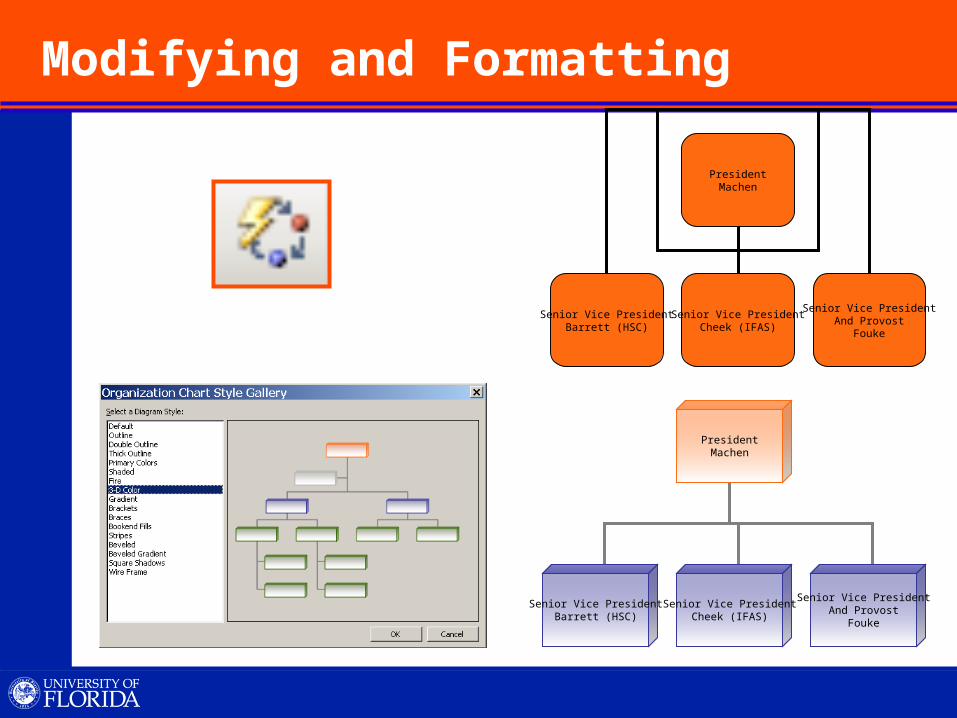
Modifying and Formatting
PresidentMachen
Senior Vice PresidentBarrett (HSC)
Senior Vice PresidentCheek (IFAS)
Senior Vice PresidentAnd Provost
Fouke
PresidentMachen
Senior Vice PresidentBarrett (HSC)
Senior Vice PresidentCheek (IFAS)
Senior Vice PresidentAnd Provost
Fouke
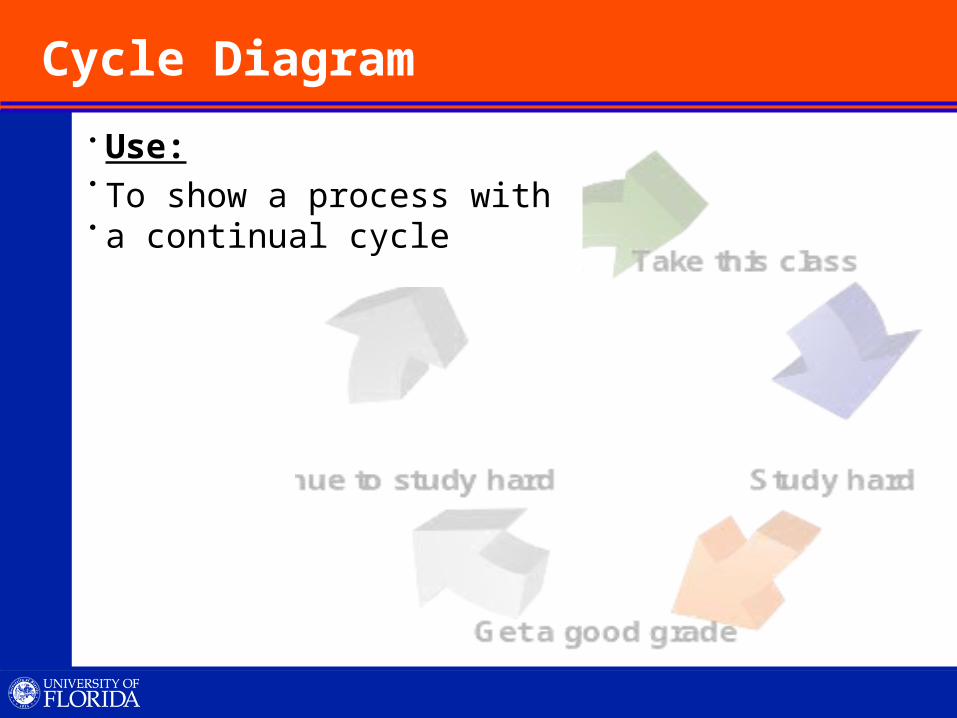
Cycle Diagram
Inserting Adding Data Modifying and Formatting
Use:
To show a process with a continual cycle

Cycle Diagram: Inserting
Click Diagram or Organizational chart

Cycle Diagram: Adding Data
Get a good grade
Take this classGraduate with a good GPA
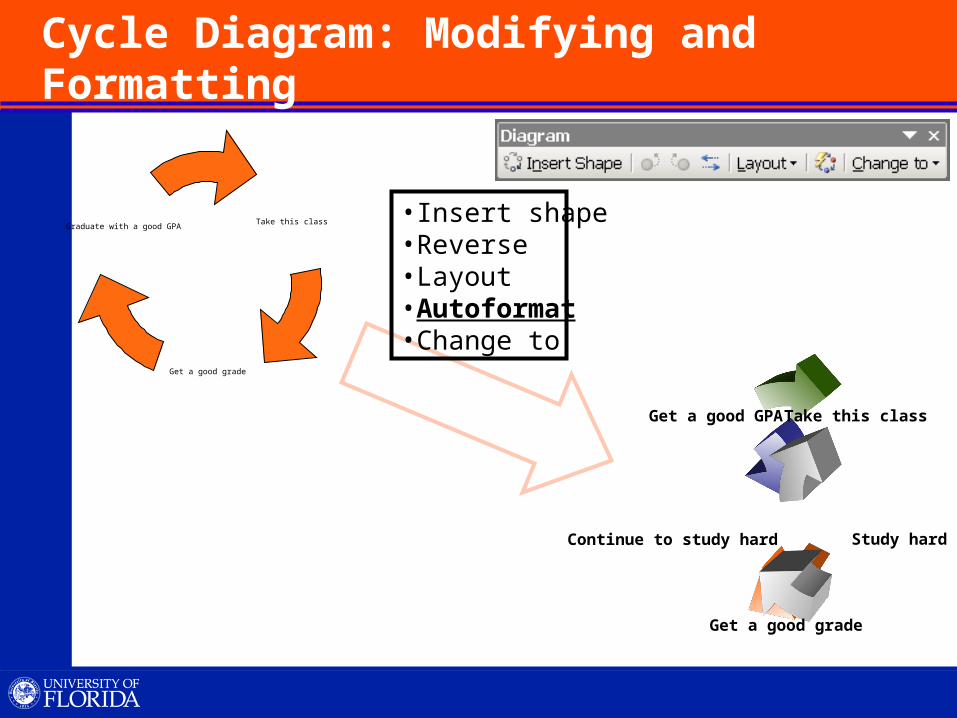
Cycle Diagram: Modifying and Formatting
Study hard
Take this class
Continue to study hard
Get a good grade
Get a good GPA
Get a good grade
Take this classGraduate with a good GPA
•Insert shape•Reverse•Layout•Autoformat•Change to

Other Diagrams: Radial
Use:
To show relationships of a core element
HealthHealthHealthHealth
HappinessHappinessHappinessHappiness Job opportunitiesJob opportunitiesJob opportunitiesJob opportunities
GPAGPAGPAGPA
WealthWealthWealthWealth
Class GradeClass GradeClass GradeClass Grade

Other Diagrams: Pyramid
Use:
To show foundation based relationships
AdvancementAdvancementAdvancementAdvancement
Educational NeedsEducational NeedsEducational NeedsEducational Needs
Emotional NeedsEmotional NeedsEmotional NeedsEmotional Needs
Physical NeedsPhysical NeedsPhysical NeedsPhysical Needs

Other Diagrams: Venn
Use:
To show areas of overlap between elements
PhysicalPhysicalHealthHealth
MentalMentalHealthHealth
AppetiteAppetite
SleepSleepHealthHealth

Other Diagrams: Target
Use:
To show steps towards a goal
Attend ClassAttend Class
Take NotesTake Notes
Study NotesStudy Notes
Class SuccessClass Success
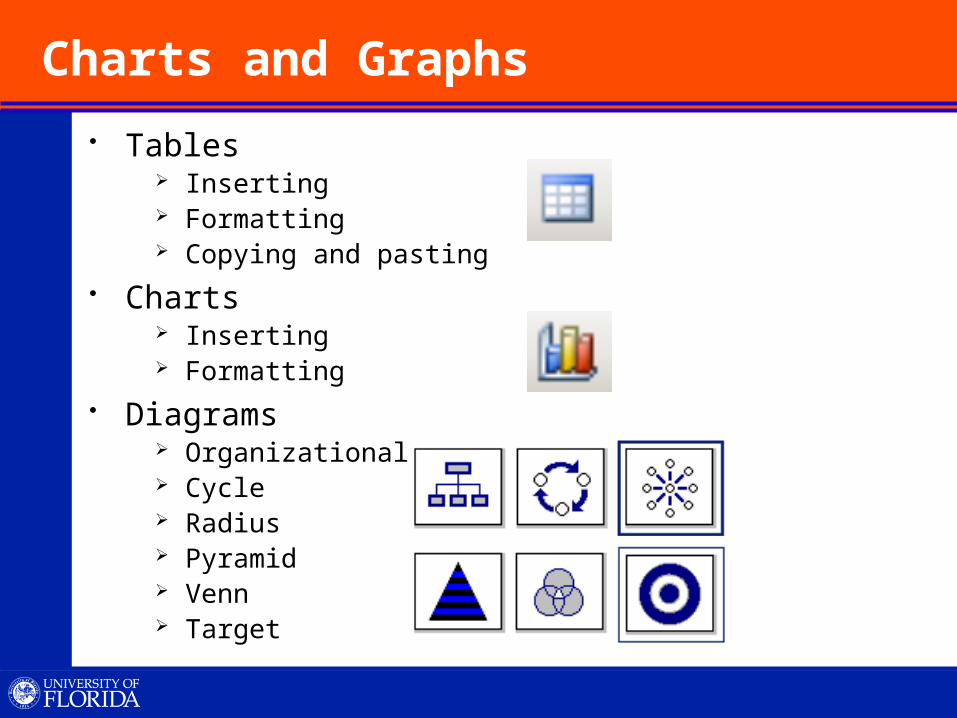
Charts and Graphs
Tables Inserting Formatting Copying and pasting
Charts Inserting Formatting
Diagrams Organizational Cycle Radius Pyramid Venn Target

Questions?
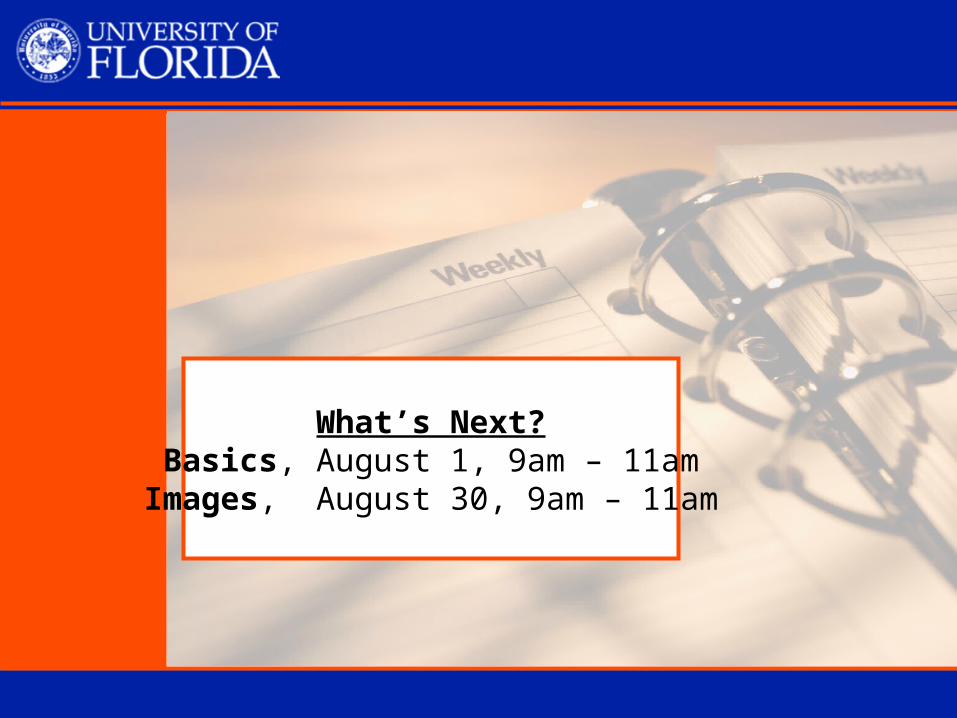
What’s Next?Basics, August 1, 9am – 11am
Images, August 30, 9am – 11am

Thank you for attending
Please complete the evaluation
on the desktop of your computer
Thank you for attending
Please complete the evaluation
on the desktop of your computer
Evaluation