powerpoint presentation - guaranty trust bank...• price of premium motor spirit (pms) increased by...
TRANSCRIPT

1
2016 Half Year Investors/Analysts Presentation

2
Outline
Macro-economic Review
Overview of H1 2016
H1 2016 Performance Review
Business Segments and
Subsidiary Review
H2 2016 Guidance and Plans

Macro-economic Review
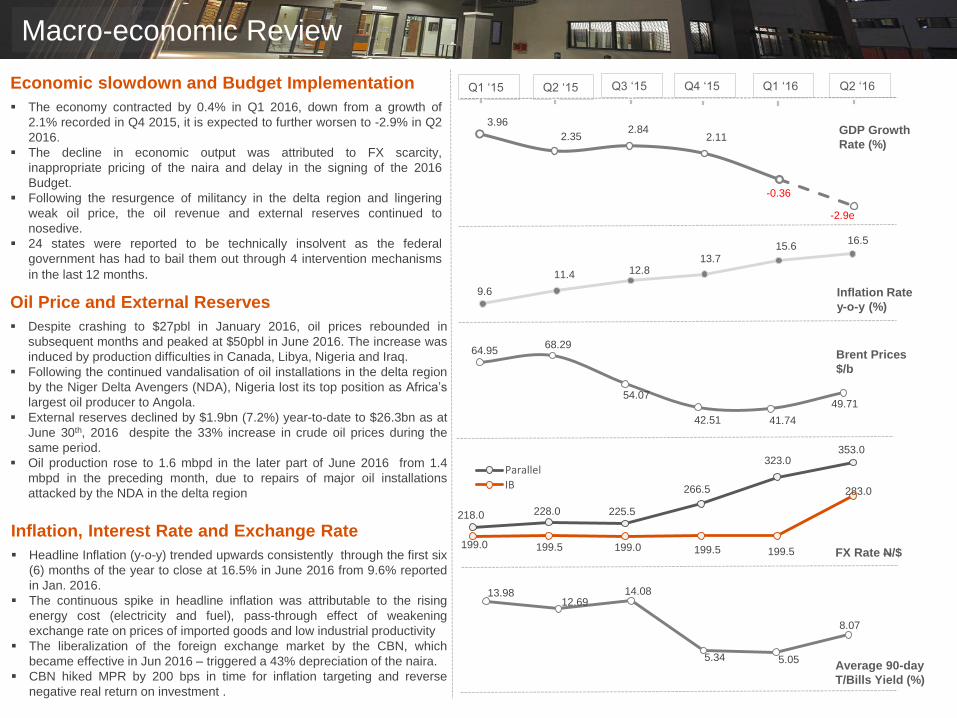
Economic slowdown and Budget Implementation
The economy contracted by 0.4% in Q1 2016, down from a growth of
2.1% recorded in Q4 2015, it is expected to further worsen to -2.9% in Q2
2016.
The decline in economic output was attributed to FX scarcity,
inappropriate pricing of the naira and delay in the signing of the 2016
Budget.
Following the resurgence of militancy in the delta region and lingering
weak oil price, the oil revenue and external reserves continued to
nosedive.
24 states were reported to be technically insolvent as the federal
government has had to bail them out through 4 intervention mechanisms
in the last 12 months.
Oil Price and External Reserves
Despite crashing to $27pbl in January 2016, oil prices rebounded in
subsequent months and peaked at $50pbl in June 2016. The increase was
induced by production difficulties in Canada, Libya, Nigeria and Iraq.
Following the continued vandalisation of oil installations in the delta region
by the Niger Delta Avengers (NDA), Nigeria lost its top position as Africa’s
largest oil producer to Angola.
External reserves declined by $1.9bn (7.2%) year-to-date to $26.3bn as at
June 30th, 2016 despite the 33% increase in crude oil prices during the
same period.
Oil production rose to 1.6 mbpd in the later part of June 2016 from 1.4
mbpd in the preceding month, due to repairs of major oil installations
attacked by the NDA in the delta region
Inflation, Interest Rate and Exchange Rate
Headline Inflation (y-o-y) trended upwards consistently through the first six
(6) months of the year to close at 16.5% in June 2016 from 9.6% reported
in Jan. 2016.
The continuous spike in headline inflation was attributable to the rising
energy cost (electricity and fuel), pass-through effect of weakening
exchange rate on prices of imported goods and low industrial productivity
The liberalization of the foreign exchange market by the CBN, which
became effective in Jun 2016 – triggered a 43% depreciation of the naira.
CBN hiked MPR by 200 bps in time for inflation targeting and reverse
negative real return on investment .
9.6
11.4 12.813.7
15.616.5
3.96
2.352.84
2.11
-0.36
-2.9e
64.9568.29
54.07
42.51 41.74
49.71
218.0 228.0 225.5
266.5
323.0353.0
199.0 199.5 199.0 199.5 199.5
283.0
ParallelIB
13.98 12.69
14.08
5.34 5.05
8.07
Q1 ‘15 Q2 ‘15 Q3 ‘15 Q4 ‘15 Q1 ‘16 Q2 ‘16
GDP Growth
Rate (%)
Inflation Rate
y-o-y (%)
Brent Prices
$/b
FX Rate N/$
Average 90-day
T/Bills Yield (%)
Macro-economic Review

Overview of H1 2016
• Headline inflation (year-on-year) flat at 9.6% from 9.55% in December 2015.
• The CBN discontinued sale of foreign exchange to Bureau de Change (BDC)
operators to stem sharp practises.
• CBN resumed sale of PTA/BTA to customers through commercial banks.
• Oil prices fell below US$30 per barrel following the lifting of international sanctions
against Iran and return of Iran’s oil production into the market
• The CBN discontinued daily dollar auctions to banks in a bid to stem reserves
attrition.
• The CBN replaced COT with a Negotiable Current Account Maintenance fee
(NCAMF) and capped the rate at N1/mille.
• The CBN MPC maintains status quo on all macro-economic indicators.
• Domestic crude oil production was estimated at 1.80 million barrels per day (mbpd)
with export at 1.35 mbpd putting local consumption at 0.45 mpbd.
• Brent crude oil estimated at US$35.39 per barrel relative to $27.69 per barrel in
Jan.2016.
• Headline inflation rose to 11.4% from 9.6% recorded in Jan. 2016.
• 45% increase in electricity tariff took effect on February 1st, 2016.
• An oil facility operated by Shell Petroleum development Company (SPDC),
Forcados, was attacked by the Niger Delta Avengers (NDA).
• Commercial Banks encouraged to allocate at least 50% of its CBN intervention
winnings to fresh LCs.
• Headline inflation increased to 12.8% from 11.4% reported in February
2016.
• Banks were mandated to commence publishing details of FX sales to
customers.
• The CBN permitted DMBs to resume receipt of FX deposits from
customers
• The MPC commenced tightening; increased MPR by 100 bps to 12%
and CRR by 250 bps to 22.5% (5% still sterilized for real sector lending).
• Lingering fuel scarcity affected businesses and households severely,
thus hindered economic activities in the country.
• Headline inflation continued its upward run closing at 13.7% from 12.8%
in the preceding month.
• The Federal Government announced a possible currency swap deal
between Nigeria and China to facilitate trade.
• Headline inflation soared to 15.6% from 13.7% reported in April 2016.
• Price of Premium Motor Spirit (PMS) increased by 68% from N87 to
N145 per litre effectively removing subsidy paid on PMS.
• The MPC maintained status quo on all macroeconomic indicators at its
May 2016 Meeting.
• The CBN announced a review of the foreign exchange policy and hinted
a possible floating of the naira.
• President Buhari signed the 2016 Budget into law
• Headline inflation spiked to 16.5% from 15.6% reported in May 2016• The FX Interbank market was reopened with new FX policy and market guidelines• The adoption of floating exchange rate and market guidelines saw the naira devalued by
43%.• The CBN launched the country’s first Naira-settled over-the-counter (OTC) foreign exchange
(FX) Futures on the FMDQ OTC Securities Exchange market.• CBN sold $4.05bn in a combination of $582.87mm spot and $3.47bn forwards of 1, 2 and 3
months in a bid to clear backlog demands.• The Federal Government approved a N90 billion bailout for states.• Following eight (8) separate attacks on oil facilities by the NDA in May 2016, oil production
dipped to 1.38mbpd from 1.50mbpd in May 2016.• Higher capital requirement of 16% for SIBs (Systematically Important Banks) was further
extended to July 2017.
JanuaryFebruary
MarchApril
JuneMay
H1 2016 Performance Review
7
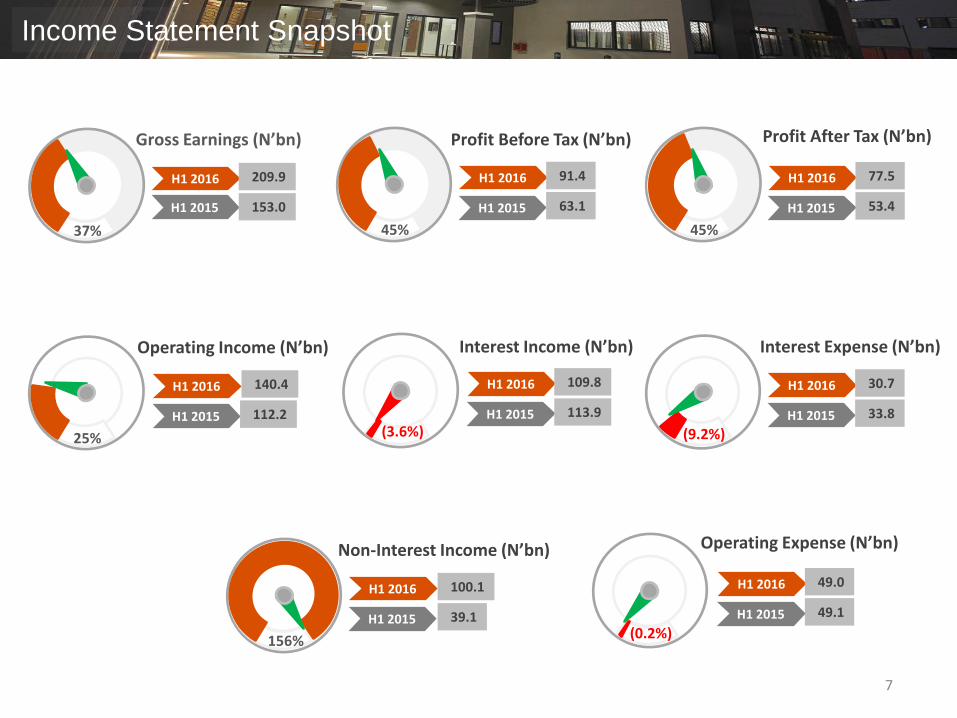
37%
H1 2015
H1 2016 209.9
153.0
45%
H1 2015
H1 2016 91.4
63.1
25%
H1 2015
H1 2016 140.4
112.2
(0.2%)H1 2015
H1 2016 49.0
49.1
156%
H1 2015
H1 2016 100.1
39.1
45%
H1 2015
H1 2016 77.5
53.4
(9.2%)H1 2015
H1 2016 30.7
33.8(3.6%)
H1 2015
H1 2016 109.8
113.9
Gross Earnings (N’bn)
Operating Income (N’bn)
Profit Before Tax (N’bn) Profit After Tax (N’bn)
Interest Expense (N’bn)
Operating Expense (N’bn)Non-Interest Income (N’bn)
Interest Income (N’bn)
Income Statement Snapshot
8
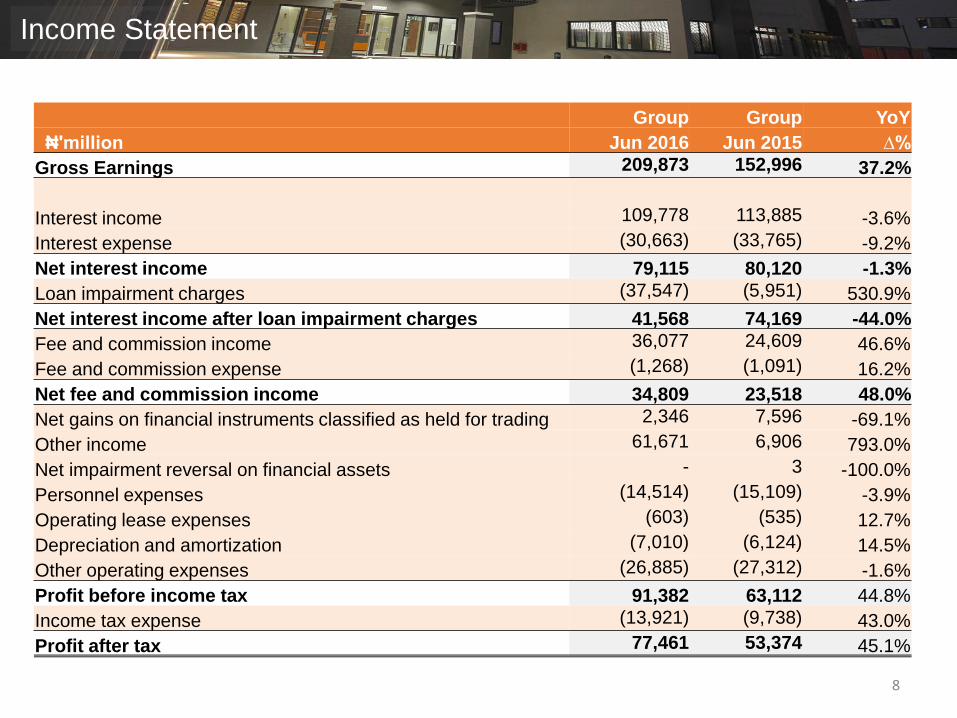
Income Statement
Group Group YoY
₦'million Jun 2016 Jun 2015 ∆%
Gross Earnings 209,873 152,996 37.2%
Interest income 109,778 113,885 -3.6%
Interest expense (30,663) (33,765) -9.2%
Net interest income 79,115 80,120 -1.3%
Loan impairment charges (37,547) (5,951) 530.9%
Net interest income after loan impairment charges 41,568 74,169 -44.0%
Fee and commission income 36,077 24,609 46.6%
Fee and commission expense (1,268) (1,091) 16.2%
Net fee and commission income 34,809 23,518 48.0%
Net gains on financial instruments classified as held for trading 2,346 7,596 -69.1%
Other income 61,671 6,906 793.0%
Net impairment reversal on financial assets - 3 -100.0%
Personnel expenses (14,514) (15,109) -3.9%
Operating lease expenses (603) (535) 12.7%
Depreciation and amortization (7,010) (6,124) 14.5%
Other operating expenses (26,885) (27,312) -1.6%
Profit before income tax 91,382 63,112 44.8%
Income tax expense (13,921) (9,738) 43.0%
Profit after tax 77,461 53,374 45.1%

9
16%
FY 2015
H1 2016 2,931.0
2,524.6
17%
FY 2015
H1 2016 2,478.2
2,111.0
14%
FY 2015
H1 2016 1,562.3
1,373.0
23%
FY 2015
H1 2016 2,007.9
1,636.6
46%
H1 2015
H1 2016 274
188
0%
H1 2015
H1 2016 25
25
9.0%
FY 2015
H1 2016 452.8
413.6
(6.3%)FY 2015
H1 2016 459.3
490.2
Total Asset (N’bn)
Total Loans and Advances (N’bn)
EPS (Kobo)
Total Liability (N’bn) Total Equity (N’bn)
Total Deposits (N’bn)
Interim Dividend (Kobo)
Investment Securities (N’bn)
Balance Sheet Snapshot
10
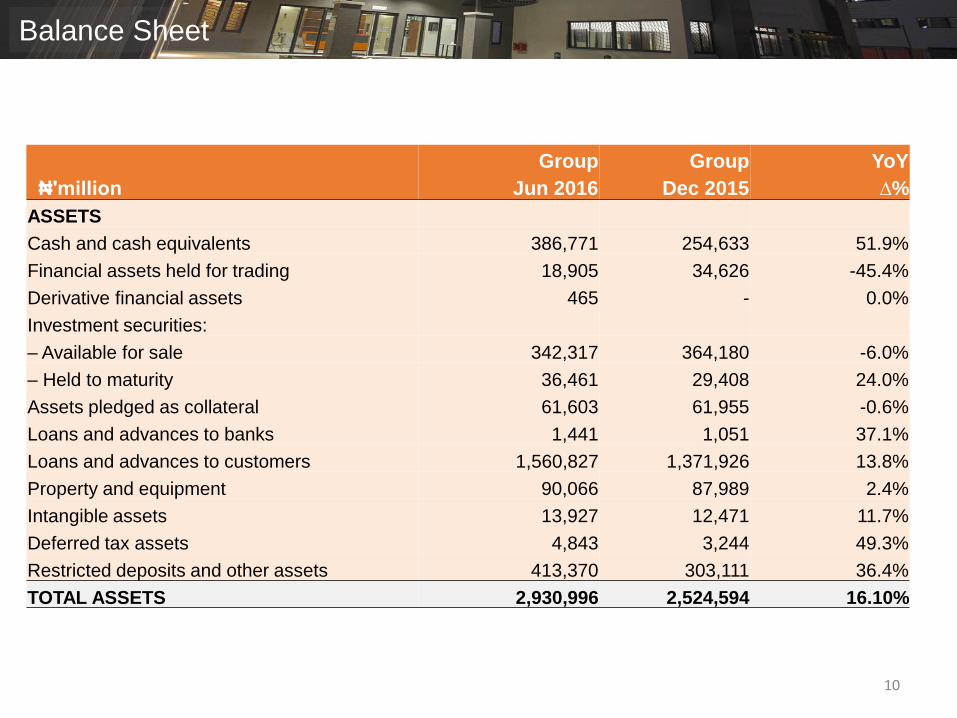
Group Group YoY
₦'million Jun 2016 Dec 2015 ∆%
ASSETS
Cash and cash equivalents 386,771 254,633 51.9%
Financial assets held for trading 18,905 34,626 -45.4%
Derivative financial assets 465 - 0.0%
Investment securities:
– Available for sale 342,317 364,180 -6.0%
– Held to maturity 36,461 29,408 24.0%
Assets pledged as collateral 61,603 61,955 -0.6%
Loans and advances to banks 1,441 1,051 37.1%
Loans and advances to customers 1,560,827 1,371,926 13.8%
Property and equipment 90,066 87,989 2.4%
Intangible assets 13,927 12,471 11.7%
Deferred tax assets 4,843 3,244 49.3%
Restricted deposits and other assets 413,370 303,111 36.4%
TOTAL ASSETS 2,930,996 2,524,594 16.10%
Balance Sheet

11
Group Group YoY
₦'million Jun 2016 Dec 2015 ∆%
LIABILITIES
Deposits from banks 34,853 26,257 32.8%
Deposits from customers 1,973,009 1,610,350 22.52%
Derivative financial liabilities 398 - 0.00%
Other liabilities 126,087 104,606 20.54%
Current income tax liabilities 17,961 17,739 1.25%
Deferred tax liabilities 4,040 6,840 -40.9%
Debt securities issued 113,962 180,117 -36.4%
Other borrowed funds 207,885 165,123 25.9%
TOTAL LIABILITIES 2,478,195 2,111,032 17.4%
Group Group YoY
₦'million Jun 2016 Dec 2015 ∆%
Capital and Reserves
Share capital 14,716 14,716 0.0%
Share premium 123,471 123,471 0.0%
Treasury shares (5,291) (4,754) 11.3%
Retained earnings 63,935 51,089 25.1%
Other components of equity 248,127 222,651 11.4%
Total equity attributable to equity owners of the
parent 444,958 407,173 9.3%
Non-controlling interests in equity 7,843 6,389 22.8%
Total equity 452,801 413,562 9.5%
Total equity And liabilities 2,930,996 2,524,594 16.1%
Balance Sheet Contd.

12
Net Interest Margin
Cost to Income
Capital Adequacy
Liquidity
Loans to Deposits and Borrowings
Return on Average Equity
Return on Average Assets
NPL to Total Loans
Cost of Risk
Coverage (with Reg. Risk Reserve)
8.17% 8.40%
43.75% 34.91%
*18.17% 18.25%
*42.21% 36.87%
*69.28% 67.06%
28.12% 35.76%
4.36% 5.68%
*3.21% 4.39%
0.91% 2.48%
*186.73% 170.11%
Six months ended June 30, 2015 Six months ended June 30, 2016
*ratios as at December 31st, 2015
Key Performance Ratios
4.24% 4.07% 4.36%5.68%
27.30%25.55%
28.12%
35.76%
Dec-2014 Dec-2015 Jun-2015 Jun-2016
Return on Average Asset (ROaA) Return on Average Equity (ROaE)
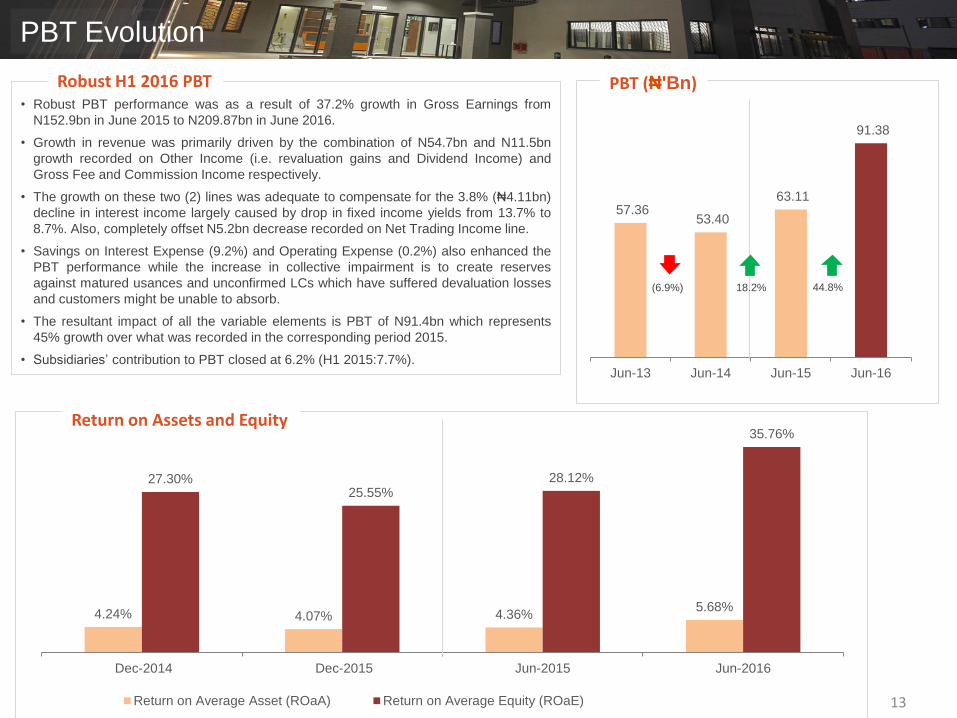
• Robust PBT performance was as a result of 37.2% growth in Gross Earnings from
N152.9bn in June 2015 to N209.87bn in June 2016.
• Growth in revenue was primarily driven by the combination of N54.7bn and N11.5bn
growth recorded on Other Income (i.e. revaluation gains and Dividend Income) and
Gross Fee and Commission Income respectively.
• The growth on these two (2) lines was adequate to compensate for the 3.8% (₦4.11bn)
decline in interest income largely caused by drop in fixed income yields from 13.7% to
8.7%. Also, completely offset N5.2bn decrease recorded on Net Trading Income line.
• Savings on Interest Expense (9.2%) and Operating Expense (0.2%) also enhanced the
PBT performance while the increase in collective impairment is to create reserves
against matured usances and unconfirmed LCs which have suffered devaluation losses
and customers might be unable to absorb.
• The resultant impact of all the variable elements is PBT of N91.4bn which represents
45% growth over what was recorded in the corresponding period 2015.
• Subsidiaries’ contribution to PBT closed at 6.2% (H1 2015:7.7%).
Robust H1 2016 PBT
13
57.36 53.40
63.11
91.38
Jun-13 Jun-14 Jun-15 Jun-16
PBT (₦'Bn)
Return on Assets and Equity
PBT Evolution
(6.9%) 18.2% 44.8%
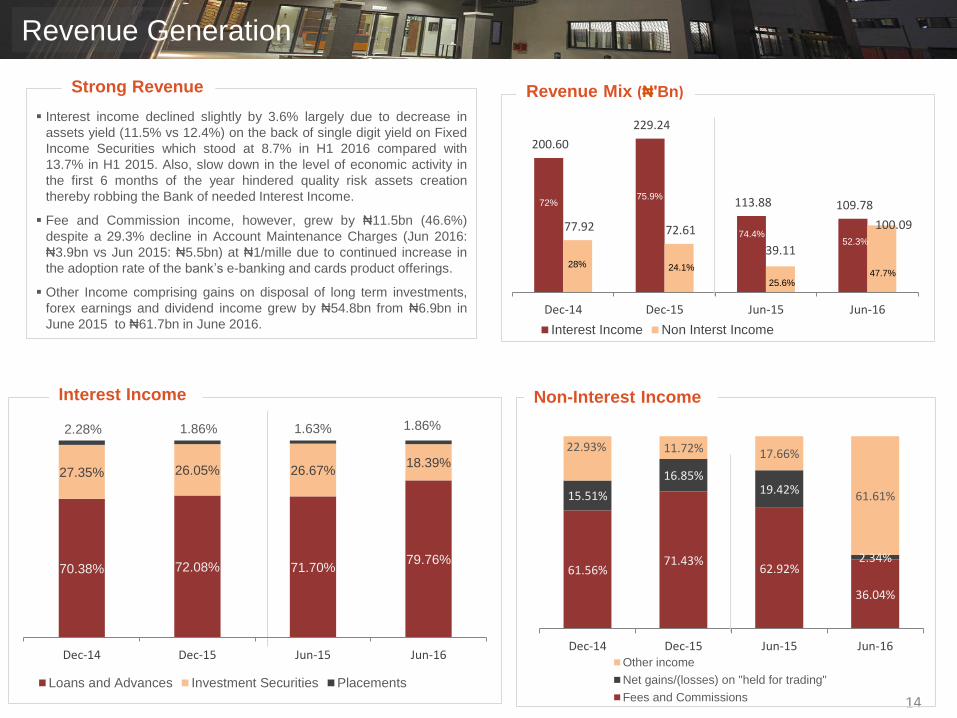
Interest income declined slightly by 3.6% largely due to decrease in
assets yield (11.5% vs 12.4%) on the back of single digit yield on Fixed
Income Securities which stood at 8.7% in H1 2016 compared with
13.7% in H1 2015. Also, slow down in the level of economic activity in
the first 6 months of the year hindered quality risk assets creation
thereby robbing the Bank of needed Interest Income.
Fee and Commission income, however, grew by ₦11.5bn (46.6%)
despite a 29.3% decline in Account Maintenance Charges (Jun 2016:
₦3.9bn vs Jun 2015: ₦5.5bn) at ₦1/mille due to continued increase in
the adoption rate of the bank’s e-banking and cards product offerings.
Other Income comprising gains on disposal of long term investments,
forex earnings and dividend income grew by ₦54.8bn from ₦6.9bn in
June 2015 to ₦61.7bn in June 2016.
14
200.60
229.24
113.88 109.78
77.92 72.61
39.11
100.09
Dec-14 Dec-15 Jun-15 Jun-16
Interest Income Non Interst Income
61.56%71.43%
62.92%
36.04%
15.51%
16.85%19.42%
2.34%
22.93% 11.72% 17.66%
61.61%
Dec-14 Dec-15 Jun-15 Jun-16Other income
Net gains/(losses) on "held for trading"
Fees and Commissions
70.38% 72.08% 71.70%79.76%
27.35% 26.05% 26.67%18.39%
2.28% 1.86% 1.63% 1.86%
Dec-14 Dec-15 Jun-15 Jun-16
Loans and Advances Investment Securities Placements
Non-Interest Income
Revenue Mix (₦'Bn)Strong Revenue
Interest Income
Revenue Generation
72%
28%
75.9%
24.1%
74.4%
25.6%
52.3%
47.7%

15
Cost to Income Ratio (CIR) improved to 34.9% relative to 43.8% in June
2015. Operating Expense was relatively flat for the period under review as it
improved by 0.2% to N49.0bn from N49.1bn in Jun. 2015 despite rise in
inflation rate.
CIR improved as a result of our unrivaled cost curtailment strategies coupled
with revenue growth. CIR (YoY) would have been better by 29bps but for the
increase in AMCON charges (N5.7bn in June 2016 from N5.3bn in June
2015) and NDIC premium (N3.1bn in June 2016 from N3.0bn in June 2015).
Interest Expense also improved by 9.2% to N30.7bn from N33.8bn in June
2015 as a result of 11.5% cost savings on interest expense paid on
customers’ deposits i.e. N24.7bn vs N21.9bn of June 2015.
There was also a 17.9% savings on interest expense paid on debt securities
issued from N6.2bn in June 2015 to N5.1bn in June 2016. The savings on
this line resulted from the repayment of the US$500m Eurobond debt note
wherein 25% was redeemed via Tender Offer in February 2016, despite the
FX scarcity that pervaded the economy, and final redemption of the balance
75% in May 2016.
Cost Efficiency
44.79% 44.40% 43.75%
34.91%
Dec-14 Dec-15 Jun-15 Jun-16
94.44 96.38
49.08 49.01
58.21 69.29
33.76 30.66
7.10
12.41
5.9537.55
2.11
3.08
1.09
1.27
Dec-14 Dec-15 Jun-15 Jun-16Operating Expenses Interest expense
Loan impairment Fee and Commission Expense
Cost to Income (CIR)
Overview of Expenses (₦'Bn)
Effective Cost Management
27.44 27.72 15.11 14.51
0.91 1.12
0.54 0.60
53.93 54.94
27.31 26.89
12.15 12.59
6.12 7.01
Dec-14 Dec-15 Jun-15 Jun-16
Personnel Expenses Operating Lease Expense
Other Operating Expenses Depreciation and Amortization
Operating Expenses (OPEX) (₦'Bn)

1,649.87 1,636.61 1,725.34 2,007.86
258.62 345.24 328.69
321.85
57.20 104.61 94.20
126.09
374.33 413.56 385.00
452.80
Dec-2013 Dec-2014 Jun-2015 Jun-2016
Equity Other Liabilities Borrowed Funds and Debt Securities Total Deposits
Well structured Balance Sheet with earning assets accounting for 72% and
Non-earning asset 28% (owing to sterilization of 27.5% in CRR – 22.5%
required and 5% for real sector loans). Total Loan book which grew by ₦189bn
(13.8%) to ₦1.562tn from ₦1.373tn in Dec.2015 (with Devaluation Impact)
accounted for 53.3% of the Total Asset as at June 2016.
However, Fixed income securities’ contribution to Total Assets declined from
17.8% in H1 2015 to 15.0% in H1 2016 as a result of the need to meet TSA
directive.
Well diversified funding base with Deposits accounting for 69%, Equity 15.6%,
Other Borrowed Funds 11.1% and Other Liabilities 4.3%. Total Deposits grew
by ₦371.3bn (22.7%) to ₦2.008tn from ₦1.637tn in December 2015, largely
due to the Group’s impressive low cost deposits drive. Without the impact of
currency devaluation, the Group would have still returned a decent 10.2%
growth in customers’ deposits during the period under review.
Loan-to-deposit and borrowings which stood at 67.1% (Dec 2015: 69.3%)
presents adequate elbow room for further risk assets growth.
Balance Sheet Management
1,281.38 1,372.98 1,299.51 1,562.27
246.94 254.63 275.64
386.77 419.04 455.54 452.23
440.38
9.42 34.63 16.34
18.91
399.10406.81 501.08
522.67
Dec-2014 Dec-2015 Jun-2015 Jun-2016
Net Loans Cash and cash equivalents
Investment securities Financial Assets held for trading
Other Assets
Components of Asset Base (₦'Bn)
Balance Sheet Composition
54.4%
10.5%
17.8%
0.4%
17.0%
54.4%
10.1%
18.0%
1.4%
16.1%
51.1%
10.8%
17.8%
0.6%
19.7%
53.3%
13.2%
15.0%
0.7%
17.8%
70.5%
11.1%
2.4%
16.0%
65.5%
13.8%
4.2%
16.5%
68.1%
13.0%
3.7%
15.2%
69.0%
11.1%
4.3%
15.6%
Diverse Funding Mix (₦'Bn)
1,281 1,373 1,300
1,562 1,650 1,637
1,725
2,008
2,356 2,525 2,545
2,931
Dec-14 Dec-15 Jun-15 Jun-16
Net Loans Deposits Total Assets
Loans, Deposits & Total Assets (₦'Bn)

17
• Yields on Fixed income securities were mostly at single digit
levels for the period under review and these led to the marginal
drop in Asset yield by 90bps from 12.4% in June 2015 to 11.5%
in June 2016.
• Cost of funds improved by 60bps to 2.8% from 3.4% in June
2015.
• NIM remained strong at 8.4% (H1 2015: 8.2%) as improved cost
of funding neutralized the impact of decline in average asset
yield.
Sustained Competitive Margins
8.10%
8.26%
8.17%
8.40%
Dec-2014 Dec-2015 Jun-2015 Jun-2016
3.12%
3.43% 3.38%
2.78%
Dec-2014 Dec-2015 Jun-2015 Jun-2016
11.66%
12.48%
12.35%
11.52%
Dec-2014 Dec-2015 Jun-2015 Jun-2016
Yields on Interest earning Assets Cost of Funds
Net Interest Margin
Margin Metrics
18
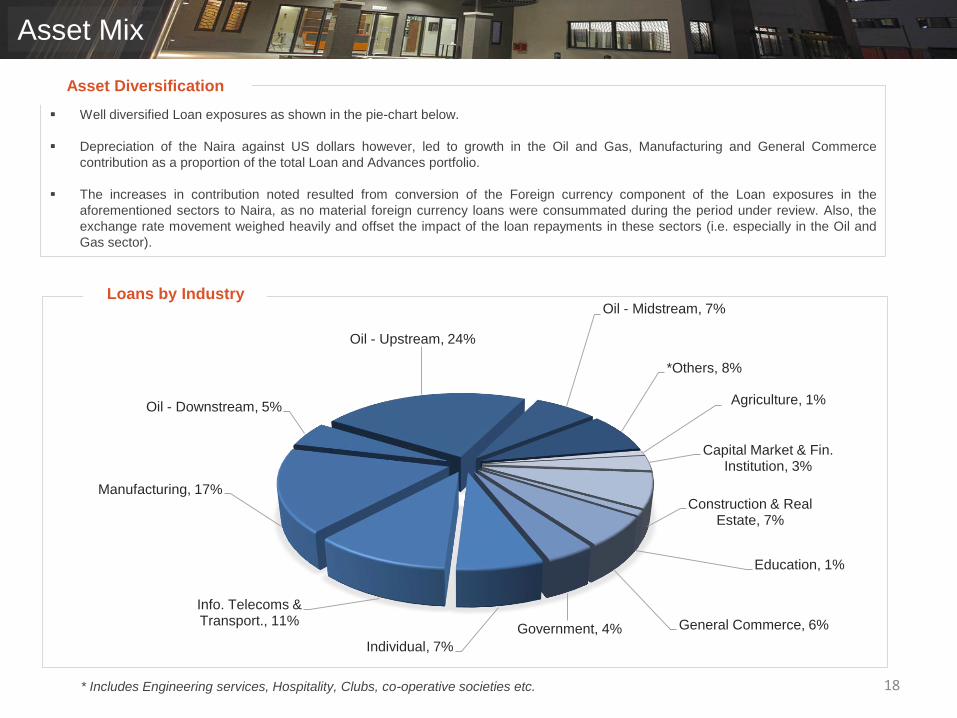
Well diversified Loan exposures as shown in the pie-chart below.
Depreciation of the Naira against US dollars however, led to growth in the Oil and Gas, Manufacturing and General Commerce
contribution as a proportion of the total Loan and Advances portfolio.
The increases in contribution noted resulted from conversion of the Foreign currency component of the Loan exposures in the
aforementioned sectors to Naira, as no material foreign currency loans were consummated during the period under review. Also, the
exchange rate movement weighed heavily and offset the impact of the loan repayments in these sectors (i.e. especially in the Oil and
Gas sector).
Asset Diversification
Asset Mix
Agriculture, 1%
Capital Market & Fin. Institution, 3%
Construction & Real Estate, 7%
Education, 1%
General Commerce, 6%Government, 4%
Individual, 7%
Info. Telecoms & Transport., 11%
Manufacturing, 17%
Oil - Downstream, 5%
Oil - Upstream, 24%
Oil - Midstream, 7%
*Others, 8%
Loans by Industry
* Includes Engineering services, Hospitality, Clubs, co-operative societies etc.
19
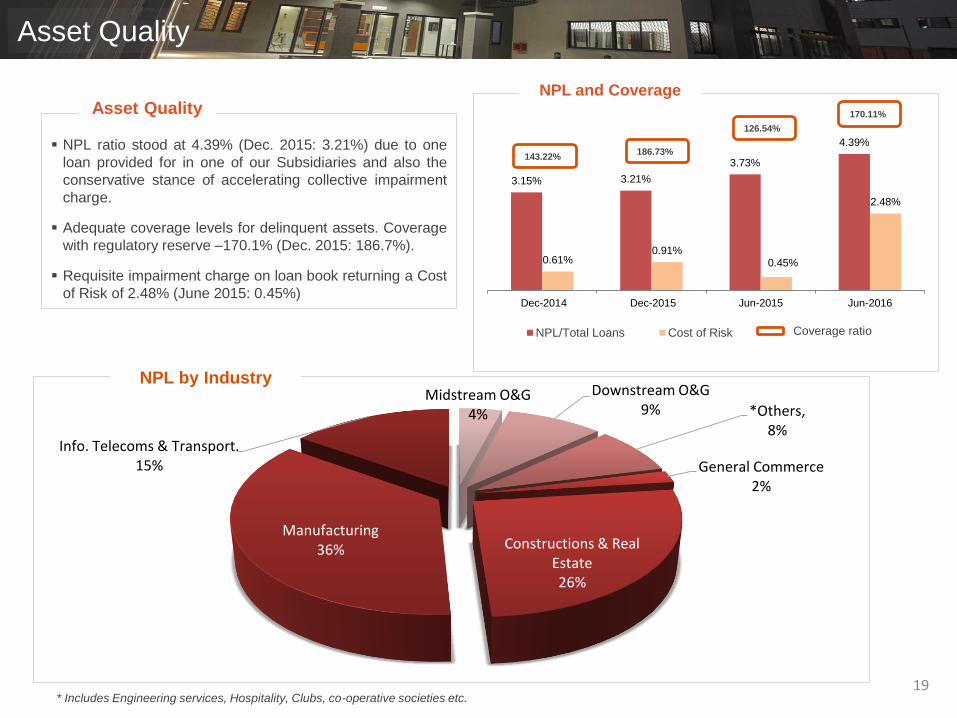
NPL ratio stood at 4.39% (Dec. 2015: 3.21%) due to one
loan provided for in one of our Subsidiaries and also the
conservative stance of accelerating collective impairment
charge.
Adequate coverage levels for delinquent assets. Coverage
with regulatory reserve –170.1% (Dec. 2015: 186.7%).
Requisite impairment charge on loan book returning a Cost
of Risk of 2.48% (June 2015: 0.45%)
Asset Quality
3.15% 3.21%
3.73%
4.39%
0.61%0.91%
0.45%
2.48%
Dec-2014 Dec-2015 Jun-2015 Jun-2016
NPL/Total Loans Cost of Risk
126.54%
170.11%
143.22%186.73%
Coverage ratio
NPL and Coverage
Asset Quality
Midstream O&G4%
Downstream O&G9% *Others,
8%
General Commerce2%
Constructions & Real Estate26%
Manufacturing36%
Info. Telecoms & Transport.15%
NPL by Industry
* Includes Engineering services, Hospitality, Clubs, co-operative societies etc.

20
Capital adequacy ratio, computed under Basel II
requirement remained strong at 18.25%.
Tier 1 CAR was 18.33% and Tier 2 CAR, which
comprises of Fair Value Reserves from Available For Sale
(AFS) securities and equity investment, stood at -0.08%
CAR well above the 15% regulatory limit and 16% for
domestic systematically important banks (SIB).
Others comprise of additional investments in subsidiaries,
increase in intangible assets (software), deferred tax
assets and changes in fair value reserve.
Dec 2014 Dec 2015 Jun 2016
298.6
333.4
356.3
NOTE: Investment in unconsolidated subsidiaries have been
excluded.
Improving Regulatory Capital - Tier 1 & 2 (₦'Bn)
FY15 Net profit Dividend Others H1 16
333.4
(44.7)
(7.9)
Figures in ₦ ‘bn
356.3
18.3%18.2%
75.5
Strong Capital Ratios
in millions of Naira Dec-15 Jun-16
Net Tier 1 Capital 329,661 357,964
Net Tier 2 Capital 3,765 (1,662)
Total Regulatory Capital 333,426 356,302
Risk-Weighted for Credit Risk 1,505,104 1,604,335
Risk-Weighted for Operational Risk 325,137 347,267
Risk-Weighted for Market Risk 4,831 1,204
Aggregate Risk-Weighted Assets 1,835,072 1,952,806
Capital Adequacy
Tier I Risk Weighted Capital Ratio 17.96% 18.33%
Tier II Risk Weighted Capital Ratio 0.21% (0.08%)
Total Risk Weighted Capital Ratio 18.17% 18.25%
Capital Adequacy Computation(Basel II)
21
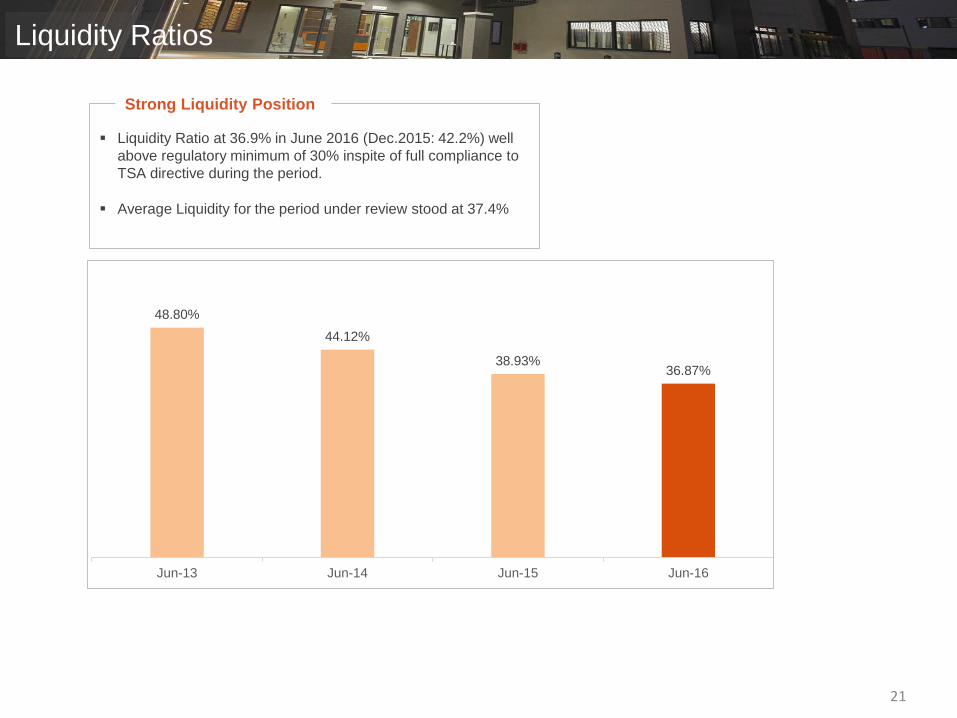
Liquidity Ratio at 36.9% in June 2016 (Dec.2015: 42.2%) well
above regulatory minimum of 30% inspite of full compliance to
TSA directive during the period.
Average Liquidity for the period under review stood at 37.4%
Liquidity Ratios
48.80%
44.12%
38.93%36.87%
Jun-13 Jun-14 Jun-15 Jun-16
Strong Liquidity Position

22
Non-Financial Highlights for HY 2016

Business Segments and Subsidiary
Review

Description Key figures Loans Deposits PBT
FY 2015: 70.1% FY 2015: 23.4% H1 2015: 69.4%
FY 2015: 14.9% FY 2015: 17.8% H1 2015: 9.3%
FY 2015: 1.4% FY 2015: 10.5% H1 2015: 1.9%
FY 2015: 9.7% FY 2015: 46.1% H1 2015: 15.6%
FY 2015: 3.8% FY 2015: 2.3% H1 2015: 3.8%
Public
Sector
• Focus on:
• Federal government
• State governments
• Local governments and customers
• Active in all government segments
Retail
SME
• Small and medium enterprises (turnover under
N500mm)
• Products tailored to cater to small, fledglingand other types of fairly unstructuredbusinesses
• Middle market companies (turnover between
N500mm and N5bn)
• Extensive product range: tailor-madesolutions and flexibility
• Custom E-commerce solutionsCommercial
All tiers of government
• Loans – N64.1bn
• Deposits – N30.4bn
• PBT – N0.7bn
Over 8.3 mil. Customers
• Loans – N164.5bn
• Deposits – N893.3bn
• PBT – N24.6bn
Over 300,000 Customers
• Loans – N22.2bn
• Deposits – N200.3bn
• PBT – N2.0bn
Over 50,000 Customers
• Loans – N201.7bn
• Deposits – N319.2bn
• PBT – N5.0bn
Over 400 Customers
• Loans – N1,108.3bn
• Deposits - N529.7bn
• PBT – N57.9bn
• Multinationals and large corporates(turnover N5bn)
• Comprises of six sectors:
• Energy • Wholesale Banking• Telecoms • Corporate Banking
• Maritime
• Deposit drive focus for retail customer-base
• Rapidly developing business line
• 224 branches, 46 e-branches & 1,165 ATMs
• Extensive leverage of all distribution channels
24
Institutional
and Wholesale
Retail
Public Sector
71.0% 26.8% 64.2%
12.9% 16.2% 5.6%
1.4% 10.2% 2.2%
10.5% 45.3% 27.2%
4.1% 1.5% 0.8%
Business Segmentation
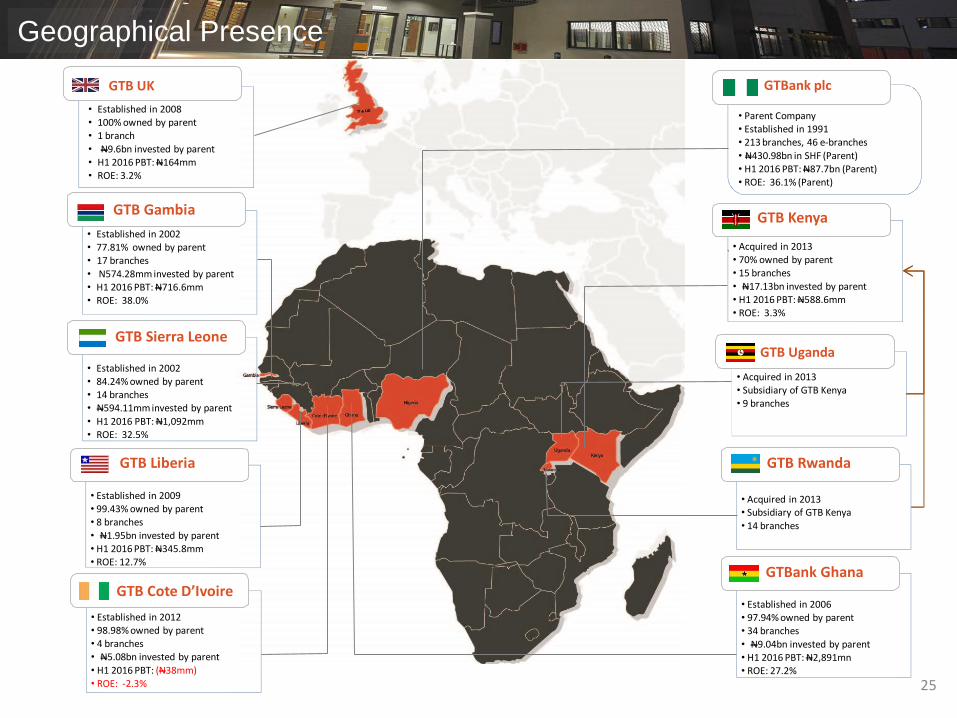
GTBank plc
• Parent Company• Established in 1991• 213 branches, 46 e-branches
• N430.98bn in SHF (Parent)• H1 2016 PBT: N87.7bn (Parent)• ROE: 36.1% (Parent)
• Acquired in 2013• 70% owned by parent• 15 branches
• N17.13bn invested by parent• H1 2016 PBT: N588.6mm• ROE: 3.3%
GTB Uganda
• Acquired in 2013• Subsidiary of GTB Kenya• 9 branches
• Acquired in 2013• Subsidiary of GTB Kenya
• 14 branches
• Established in 2006• 97.94% owned by parent• 34 branches
• N9.04bn invested by parent• H1 2016 PBT: N2,891mn• ROE: 27.2%
GTB UK
• Established in 2008• 100% owned by parent• 1 branch
• N9.6bn invested by parent• H1 2016 PBT: N164mm• ROE: 3.2%
• Established in 2002• 77.81% owned by parent• 17 branches
• N574.28mm invested by parent• H1 2016 PBT: N716.6mm• ROE: 38.0%
• Established in 2002• 84.24% owned by parent• 14 branches• N594.11mm invested by parent
• H1 2016 PBT: N1,092mm• ROE: 32.5%
• Established in 2009• 99.43% owned by parent• 8 branches
• N1.95bn invested by parent• H1 2016 PBT: N345.8mm• ROE: 12.7%
• Established in 2012• 98.98% owned by parent• 4 branches• N5.08bn invested by parent
• H1 2016 PBT: (N38mm)• ROE: -2.3% 25
GTB Gambia
GTB Sierra Leone
GTB Liberia
GTB Cote D’Ivoire
GTB Kenya
GTB Rwanda
GTBank Ghana
Geographical Presence

26
87.7
2.91.1 0.590.72
0.350.16
(0.038)
GTBank
Plc
(Nigeria)Ghana
Sierra
Leone
Kenya
GroupGambia Liberia
United
Kingdom
Cote
D’Ivoire
H1 2016
Group PBT
91.4
H1 2016 PBT – Group (N’bn)
Group PBT Breakdown
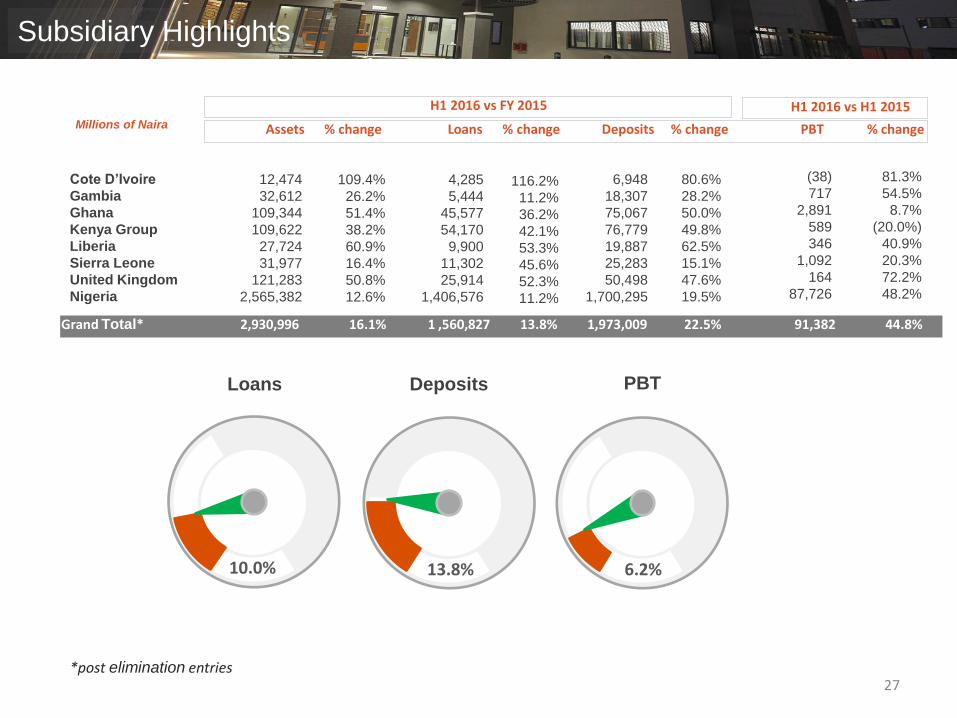
Grand Total* 2,930,996 16.1% 1 ,560,827 13.8% 1,973,009 22.5% 91,382 44.8%
Assets % change Loans % change Deposits % change PBT % change
*post elimination entries
Millions of Naira
27
H1 2016 vs FY 2015 H1 2016 vs H1 2015
Cote D’Ivoire
Gambia
Ghana
Kenya Group
Liberia
Sierra Leone
United Kingdom
Nigeria
12,474
32,612
109,344
109,622
27,724
31,977
121,283
2,565,382
109.4%
26.2%
51.4%
38.2%
60.9%
16.4%
50.8%
12.6%
4,285
5,444
45,577
54,170
9,900
11,302
25,914
1,406,576
116.2%
11.2%
36.2%
42.1%
53.3%
45.6%
52.3%
11.2%
6,948
18,307
75,067
76,779
19,887
25,283
50,498
1,700,295
80.6%
28.2%
50.0%
49.8%
62.5%
15.1%
47.6%
19.5%
(38)
717
2,891
589
346
1,092
164
87,726
81.3%
54.5%
8.7%
(20.0%)
40.9%
20.3%
72.2%
48.2%
10.0%
Loans Deposits PBT
13.8% 6.2%
Subsidiary Highlights

H2 2016 Guidance and Plans

29
Alignment to Global Practices
Remain the best-run bank in the industry
Corporate governance and compliance policies
Subsidiaries
Increase Subsidiaries’ contribution to Group’s PBT
Focus on optimizing revenue and minimizing cost of all subsidiaries.
Sustainable Profitability and
Returns
ROE above 25%
FY 2016 PBT of N125billion
Operating Cost Efficiency
Cost-to-income ratio (CIR) below 45%
Leverage technological advancement to keep cost low.
Lowering cost of funds and maintain margins
Committed to Growing Retail and
SME Business
Quality Credits
Grow risk assets of our Institutional Banking Business
NPL below 5%
H2 2016 Guidance and
Plan
Guidance and Plans for H2 2016

This presentation is based on Guaranty Trust Bank Plc (“GTBank” or “Bank”)’s audited financial results as of and for the h a l f year ended
June 30, 2016 prepared in accordance with International Financial Reporting Standards (“IFRS”) as promulgated by the International
Accounting Standards Board. The Bank has also obtained certain information in this presentation from sources it believes to be reliable.
Although GTBank has taken all reasonable care to ensure that such external information are accurate and correct, the Bank makes no
representation or warranty, express or implied, as to the accuracy, correctness or completeness of such information.
Furthermore, GTBank makes no representation or warranty, express or implied, that its future operating, financial or other results will be
consistent with results implied, directly or indirectly, by information contained herein or with GTBank’s past operating, financial or other results.
Any information herein is as of the date of this presentation and may change without notice. GTBank undertakes no obligation to update the
information in this presentation. In addition, some of the information in this presentation may be condensed or incomplete, and this
presentation may not contain all material information in respect of GTBank.
This presentation may also contain “forward-looking statements” that relate to, among other things, GTBank’s plans, objectives, goals,
strategies, future operations and performance. Such forward-looking statements may be characterised using words such as “estimates,” “aims,”
“expects,” “projects,” “believes,” “intends,” “plans,” “may,” “will” and “should” and other similar expressions which are not the exclusive means of
identifying such statements. Such forward-looking statements involve known and unknown risks, uncertainties and other important factors that
could cause GTBank’s operating, financial or other results to be materially different from the operating, financial or other results expressed or
implied by such statements. Furthermore, GTBank makes no representation or warranty, express or implied, that the operating, financial or other
results anticipated by such forward-looking statements will be achieved. Such forward-looking statements represent, in each case, only one
of many possible scenarios and should not be viewed as the most likely or standard scenario. GTBank undertakes no obligation to update the
forward-looking statements in this presentation.
30
Disclaimer

Thank You