powerpoint presentationjax.s3.amazonaws.com/4601/jacksonville_visitor_economic_impact_jan... · 3 ....
TRANSCRIPT

January 2014
The Economic Impact of Tourism in Jacksonville, FL

2
Highlights
Tourism is a vital component of the Jacksonville, Florida economy.
More than 22,000 jobs, with associated income of $684 million, were sustained by visitors to Jacksonville in FY2013.
These jobs represent 5.7% of total employment in Jacksonville; 1 in every 17.7 jobs in Duval County is sustained by the tourism economy.
Including indirect and induced impacts, tourism in Jacksonville generated $180 million in state and local taxes of which $93 million went directly to local taxing authorities.
In the absence of the state and local taxes generated by tourism, each Jacksonville household would need to pay $550 to maintain the current level of government services.

3
Key trends
Visitor Spending within Jacksonville rose to 4.0% in FY2013 to $1.5 Billion and has averaged increases of more than 4% in the past five years.
Visitor Spending has increased 18% since 2009
Growth in overnight visitation remains strong. In FY2013, Duval County room demand grew 2.6%.
With the increase in occupancy, the hotel industry was able to raise room rates by 2.4%.
Including indirect and induced Business Sales, Tourism has generated $2.2 Billion in Revenue in FY2013.

Spending Results

5
A recovery in visitor spending Visitor spending
within Jacksonville rose 4.0% in fiscal 2013.
More overnight stays along with higher prices pushed lodging spending up 5.1% in 2013.
Growth has averaged more than 4% per annum in the past 5 years.
Sector 2009 2010 2011 2012 2013 % ChangeLodging $310.1 $306.3 $321.2 $339.1 $356.4 5.1%
Transp w/in destination $182.4 $206.7 $226.7 $231.2 $228.6 -1.1%Food/bev $340.2 $353.4 $372.5 $396.7 $419.1 5.7%
Retail $243.8 $250.4 $255.2 $275.2 $287.5 4.5%Recreation $158.2 $168.1 $168.3 $171.8 $179.4 4.4%
Visitor Spending $1,234.7 $1,284.9 $1,343.9 $1,414.0 $1,471.0 4.0%% Change 4.1% 4.6% 5.2% 4.0%
Tourism Industry Sales(US$ Million)
1,235
1,285
1,344
1,414
1,471
0%
1%
2%
3%
4%
5%
6%
1,100
1,150
1,200
1,250
1,300
1,350
1,400
1,450
1,500
2009 2010 2011 2012 2013
Visitor Spending
% Change$
6
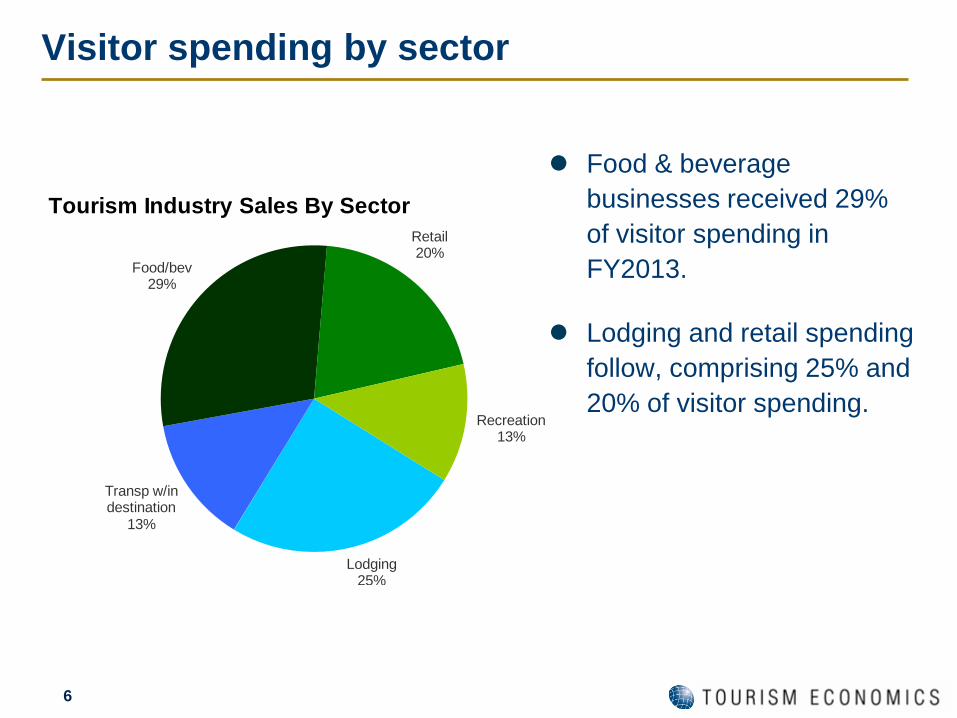
Visitor spending by sector
Food & beverage businesses received 29% of visitor spending in FY2013.
Lodging and retail spending follow, comprising 25% and 20% of visitor spending.
Lodging25%
Transp w/in destination
13%
Food/bev29%
Retail20%
Recreation13%
Tourism Industry Sales By Sector

7
Visitor spending by sector
$310 $306 $321 $339 $356
$182 $207 $227 $231 $229
$340 $353 $373 $397 $419
$244 $250$255
$275 $288$158 $168$168
$172 $179
$0
$200
$400
$600
$800
$1,000
$1,200
$1,400
$1,600
2009 2010 2011 2012 2013Lodging Transp w/in destination Food/bev Retail Recreation
Jacksonville's Tourism Industry Sales by Year, Millions of $
Visitor spending in Jacksonville has increased more than 18% since 2009.
Lodging sales have increased by $46 million and are now 15% above the low seen in 2009.
Spending at restaurants and other food & beverage providers has increased by nearly $80 million since 2009.

8
Visitor spending by sector Lodging’s share of
visitor spending fell sharply in 2010 as hoteliers dropped prices to increase demand but has grown since then.
The high variability in transportation costs, let by gas prices, is evident in the share of the visitor dollar going to transportation over time.
$310 $306 $321 $339 $356
$182 $207 $227 $231 $229
$340 $353 $373 $397 $419
$244 $250 $255 $275 $288
$158 $168 $168 $172 $179
0%
10%
20%
30%
40%
50%
60%
70%
80%
90%
100%
2009 2010 2011 2012 2013
Recreation
Retail
Food/bev
Transp w/indestinationLodging
Jacksonville's Tourism Industry Sales by Year, Share of Total

Area Tourism Impacts

10
How visitor spending generates impact
Lastly, the induced impact is generated when employees whose incomes are generated either directly or indirectly by tourism, spend those incomes in the Jacksonville economy.
• Travelers create direct economic value within a discreet group of sectors (e.g. recreation, transportation). This supports a relative proportion of jobs, wages, taxes, and GDP within each sector.
• Each directly affected sector also purchases goods and services as inputs (e.g. food wholesalers, utilities) into production. These impacts are called indirect impacts.

11
Tourism sales
Business Day
Direct Indirect Induced TotalAgriculture, Fishing, Mining - 0.8 0.2 1.0 Construction and Utilities - 17.1 3.9 21.0 Manufacturing - 10.8 6.0 16.7 Wholesale Trade - 15.0 17.8 32.8 Air Transport 36.8 0.6 0.7 38.0 Other Transport 38.4 15.7 6.8 60.9 Retail Trade 287.5 2.0 29.1 318.6 Gasoline Stations 105.5 0.1 1.9 107.6 Communications - 41.6 15.7 57.3 Finance, Insurance and Real Estate 48.0 91.0 118.9 257.9 Business Services 9.0 116.9 26.4 152.3 Education and Health Care - 0.7 67.6 68.3 Recreation and Entertainment 160.5 6.2 5.2 171.9 Lodging 356.4 0.2 0.2 356.8 Food & Beverage 419.1 16.9 24.1 460.1 Personal Services 9.9 12.5 15.0 37.4 Government - 12.6 4.5 17.0 TOTAL 1,471.0 360.8 343.8 2,175.6 * Direct sales include cost of goods sold for retail sectors
Tourism-Generated Sales(US$ Million)
Including indirect and induced business sales, tourism generated $2.2 billion in revenue in FY2013.

12
All business sectors of the Jacksonville economy benefit from tourism activity directly and/or indirectly.
Sectors that serve the tourism industry, like business services, gain as suppliers to a dynamic industry.
Tourism sales
050
100150200250300350400450500
F&B
Lodg
ing
Ret
ail T
rade
FIR
E
Rec
reat
ion
Bus
. Ser
vice
s
Gas
Edu
catio
n
Oth
er T
rans
p
Com
m.
Air
Tran
spor
t
Per
sona
l Ser
v.
InducedIndirectDirect
Tourism SalesBy Industry, $ million
Significant indirect benefits
Note: Direct sales include cost of goods sold for retail
FIRE = finance, insurance and real estate

13
Tourism employment surging (direct)
With the cumulative growth in spending over the past five years, tourism businesses has been hiring for three years to meet customer demand.
Tourism employment grew nearly 6% in fiscal 2013, growing nearly 3.5 percentage points faster than overall Duval County employment.
2009 2010 2011 2012 2013Employment 15,197 14,811 15,027 15,517 16,431
% Change -2.5% 1.5% 3.3% 5.9%
Tourism Industry Employment
15,197
14,811
15,027
15,517
16,431
-3%
-2%
-1%
0%
1%
2%
3%
4%
5%
6%
7%
14,000
14,500
15,000
15,500
16,000
16,500
17,000
2009 2010 2011 2012 2013
Employment
% Change$

14
Tourism impact on employment (total)
Direct Indirect Induced TotalAgriculture, Fishing, Mining - 5 2 7 Construction and Utilities - 96 20 116 Manufacturing - 29 9 38 Wholesale Trade - 66 79 145 Air Transport 122 2 2 127 Other Transport 415 161 64 640 Retail Trade 1,686 28 392 2,105 Gasoline Stations 111 1 18 131 Communications - 128 39 167 Finance, Insurance and Real Estate 228 460 417 1,105 Business Services 69 1,191 291 1,551 Education and Health Care - 12 700 712 Recreation and Entertainment 1,998 90 73 2,161 Lodging 4,515 3 2 4,520 Food & Beverage 7,152 304 429 7,885 Personal Services 135 161 268 565 Government - 100 28 128 TOTAL 16,431 2,839 2,832 22,102
Tourism Employment
The tourism sector directly and indirectly supported 22,102 jobs, or 5.7% of all employment in Jacksonville last year.

15
Day 0
1
2
3
4
5
6
7
8
F&B
Lodg
ing
Rec
reat
ion
Ret
ail T
rade
Bus
. Ser
vice
s
FIR
E
Edu
catio
n
Oth
er T
rans
p
Per
sona
l Ser
v.
Com
m.
Who
lesa
le T
r.
Gas
Thousands
InducedIndirectDirect
Tourism Employment
Significant indirect and induced benefits
Tourism impact on employment (total)
As a labor intensive collection of services, tourism-related sectors are significant Jacksonville employers.
The more than 22,000 tourism-supported jobs in Jacksonville span every sector of the economy, either directly or indirectly.
The most significant indirect impacts are in business services and finance, real estate & insurance.

16
Business Day
4%
8%
20%
38%
99%
0% 20% 40% 60% 80% 100%
Total
Retail
Food & bev.
Recreation
Lodging
Tourism Employment Intensity by Industry
Tourism is a significant part of several industries – tourism directly supports nearly all employment in lodging, 38% of recreation, and 20% of food and beverage employment.
Tourism share of key industry employment

17
Tourism personal income
Business Day
Direct Indirect Induced TotalAgriculture, Fishing, Mining - 0.1 0.0 0.1 Construction and Utilities - 6.1 1.2 7.2 Manufacturing - 1.7 0.7 2.4 Wholesale Trade - 6.0 7.1 13.1 Air Transport 6.9 0.1 0.1 7.1 Other Transport 19.8 8.0 3.1 30.9 Retail Trade 47.1 1.0 13.4 61.4 Gasoline Stations 7.2 0.1 1.2 8.4 Communications - 12.7 3.7 16.4 Finance, Insurance and Real Estate 10.1 21.3 19.4 50.8 Business Services 3.5 62.0 14.8 80.2 Education and Health Care - 0.4 38.8 39.2 Recreation and Entertainment 66.6 3.0 2.3 71.9 Lodging 96.2 0.1 0.0 96.3 Food & Beverage 148.5 6.4 9.9 164.9 Personal Services 5.8 8.1 8.4 22.4 Government - 8.6 2.3 10.9 TOTAL 411.6 145.5 126.4 683.5
Tourism Labor Income (Compensation)(US$ Million)
Employees in Jacksonville earned $684 million as a result of visitor activity in FY2013.

18
Tourism personal income
The larger employment numbers in F&B and recreations support significant labor income in those industries.
Higher wages support labor income in supplier industries.
Day 020406080
100120140160180
F&B
Lodg
ing
Bus
. Ser
vice
s
Rec
reat
ion
Ret
ail T
rade
FIR
E
Edu
catio
n
Oth
er T
rans
p
Per
sona
l Ser
v.
Com
m.
Who
lesa
le T
r.
Gov
.
InducedIndirectDirect
Tourism Labor IncomeBy Industry, $ million
Significant indirect and induced benefits

19
Tourism tax generation
Taxes of $327 million were directly and indirectly generated by tourism in 2013.
State and local taxes alone tallied $180 million.
Each household in Jacksonville would need to be taxed an additional $550 per year to replace the tourism taxes received by state and local governments.
Business Day
Tax Type Direct Indirect/ Induced
Total
Federal Taxes Subtotal 90.9 56.1 147.0Corporate 11.2 9.3 20.5Indirect Business 16.3 5.4 21.7Personal Income 23.9 16.0 39.9Social Security 39.5 25.4 65.0
State and Local Taxes Subtotal 143.4 36.7 180.1Corporate 1.4 1.2 2.6Personal Income 0.0 0.0 0.0Sales 74.9 17.6 92.5Lodging 15.4 0.0 15.4
Local 15.4 0.0 15.4State 0.0 0.0 0.0
Property 41.7 13.8 55.5Excise and Fees 9.5 3.9 13.4State Unemployment 0.5 0.3 0.8
TOTAL 234.3 92.8 327.1
All Traveler Generated Taxes(US$ Million)

20
Tourism tax generation Of the $180 million in state
and local taxes, $93 million accrues to local taxing authorities.
In Duval County, the total sales tax rate is 7%. Of that, 6% is the general state sales tax and 1% is the county discretionary surtax.
The state portion of the sales tax provides the majority of tourism-related state revenues.
Key local revenue streams are property, bed and sales taxes.
Business Day
Tax Type Direct Indirect/ Induced
Total
State Tax Subtotal 69.2 17.8 87.1Corporate 1.4 1.2 2.6Personal Income 0.0 0.0 0.0Sales 64.2 15.1 79.3Lodging 0.0 0.0 0.0Property 0.0 0.0 0.0Excise and Fees 3.2 1.3 4.5State Unemployment 0.5 0.3 0.8
Local Tax Subtotal 74.1 18.9 93.0Corporate 0.0 0.0 0.0Personal Income 0.0 0.0 0.0Sales 10.7 2.5 13.2Lodging 15.4 0.0 15.4Property 41.7 13.8 55.5Excise and Fees 6.3 2.5 8.9State Unemployment 0.0 0.0 0.0
Traveler Generated Taxes - State and Local Government Revenues
(US$ Million)
21
Fun facts
Visitor spending in Duval County surpassed $1.4 billion in 2013. This is larger than the City of Jacksonville budget ($953 million) and nearly as large as the Duval County School System budget ($1.6 billion in 2013).
If employed by a single business, tourism’s 16,430 employees would rank 3rd in employment in Jacksonville behind the Naval Air Station and Duval County schools and ahead of the City of Jacksonville and Baptist Health System. http://www.jaxdailyrecord.com/showstory.php?Story_id=533987

Methodology and Background

23
By monitoring tourism’s economic impact, policy makers can make informed decisions regarding the funding and prioritization of tourism development.
It can also carefully monitor its successes and future needs.
In order to do this, tourism must be measured in the same categories as other economic sectors – i.e. tax generation, employment, wages, and gross domestic product.
Why quantify the tourism economy?

24
What is this a challenge?
Most economic sectors such as financial services, insurance, or construction are easily defined within a country’s national accounts statistics.
Tourism is not so easily measured because it is not a single industry. It is a demand-side activity which affects multiple sectors to various degrees.
Tourism spans nearly a dozen sectors including lodging, recreation, retail, real estate, air passenger transport, food & beverage, car rental, taxi services, travel agents…

25
• Fiscal year 2013 is defined as October 2012 – September 2013.
• Domestic visitor expenditure estimates are provided by Longwoods International’s representative survey of US travelers. These are broken out by sectors (lodging, transport at destination, food & beverage, retail, and recreation), by purpose (business and leisure), and by length of stay (day and overnight).
• Tourism Economics then adjusts these levels of spending based on a range of known measures of tourism activity:
• Industry data on employment, wages, GDP, and sales (source: BEA, BLS, Census)
• Smith Travel Research data on hotel revenues
• Bed tax receipts
• Overseas visitor spending (source: OTTI, TE)
• Canada visitor spending (source: Statistics Canada, TE)
• Spending on air travel which accrues to all airports and locally-based airlines
• Gasoline purchases by visitors (source: TE calculation)
Methods and data sources

26
• An IMPLAN model was compiled for the Duval County, Florida. This traces the flow of visitor-related expenditures through the local economy and their effects on employment, wages, and taxes. IMPLAN also quantifies the indirect (supplier) and induced (income) impacts of tourism.
• All results are benchmarked and cross-checked and adjusted based on the following:
• US Bureau of Labor Statistics and Bureau of Economic Analysis (employment and wages by industry)
• US Census (business sales by industry)
• The source of the employment and wage data is the Regional Economic Information System (REIS), Bureau of Economic Analysis, U.S. Department of Commerce. All employment rankings are based on Bureau of Labor Statistics (ES202/QCEW) data.
Methods and data sources

27
Selected recent economic impact clients Cities Baltimore, MD Columbus, OH Kansas City, MO London, United Kingdom New York City Omaha, NE Orlando, FL Philadelphia, PA Pittsburgh, PA Rockford, IL Countries / Provinces Bahamas Bermuda Cayman Islands Dubai Ontario Canada St. Lucia United Kingdom
Associations / Companies Center for Exhibition Industry Research (Economic Impact of Visa Restrictions)
DMAI (Event Impact Calculator for 80 CVBs)
US Travel Association (Impact of travel promotion)
InterContinental Hotels
States California Georgia Maryland New York North Carolina Ohio Pennsylvania Wisconsin

28
About Tourism Economics
Tourism Economics, headquartered in Philadelphia, is an Oxford Economics company dedicated to providing high value, robust, and relevant analyses of the tourism sector that reflects the dynamics of local and global economies. By combining quantitative methods with industry knowledge, Tourism Economics designs custom market strategies, project feasibility analysis, tourism forecasting models, tourism policy analysis, and economic impact studies.
Our staff have worked with over 100 destinations to quantify the economic value of tourism, forecast demand, guide strategy, or evaluate tourism policies.
Oxford Economics is one of the world’s leading providers of economic analysis, forecasts and consulting advice. Founded in 1981 as a joint venture with Oxford University’s business college, Oxford Economics is founded on a reputation for high quality, quantitative analysis and evidence-based advice. For this, it draws on its own staff of 40 highly-experienced professional economists; a dedicated data analysis team; global modeling tools; close links with Oxford University, and a range of partner institutions in Europe, the US and in the United Nations Project Link.
For more information: [email protected].

29
For more information:
Adam Sacks, Managing Director [email protected]
Christopher Pike, Director of Impact Studies