powerweb: a tool for evaluating economic and reliability ...€”this paper describes a web-based...
TRANSCRIPT

1
Abstract—This paper describes a web-based electric power
market simulation tool called POWERWEB. It can be used as an experimental economics research tool to evaluate the economic and reliability impacts of given market designs as well as to train and educate students, industry professionals and policy makers. It is unique in its ability to combine the human behavior characteristics of a market structure with the operational and reliability aspects of the underlying power system.
Index Terms—Power system economics, power system simulation, software tools.
I. INTRODUCTION
ODAY’s ever evolving power industry requires tools that are able to incorporate the human behavior in electric power markets with the complexities of operating the
physical system. Most existing tools for the simulation of power system operations and electricity markets do not include the interface to allow human decision makers, playing various roles in the market, to interactively respond and react to the information provided by the simulations. Similarly, other tools used for experimental economics work in the area of electricity markets typically use very simple underlying models of the physical system. While useful for certain studies, they are not able to inform regarding the effects of market behavior on the reliability and operation of more realistic networks.
POWERWEB is designed to be a tool that brings together these two aspects of energy markets and physical system characteristics. It is an Internet based platform, with a web browser interface, that simulates an environment with real human decision makers participating in markets with complex underlying engineering models of the network. An earlier version of the software was described in [1].
It’s primary use, to date, has been as an experimental economics research tool. However, it can also be used very
This work was supported in part by the Power Systems Engineering
Research Center (PSERC) and the Consortium for Electric Reliability Technology Solutions (CERTS) program on Reliability and Markets at the U.S. Department of Energy.
R. D. Zimmerman is with the School of Electrical and Computer Engineering and the Department of Applied Economics and Management, Cornell University, Ithaca, NY 14853 USA (e-mail: [email protected]).
R. J. Thomas is with the School of Electrical and Computer Engineering, Cornell University, Ithaca, NY 14853 USA (e-mail: [email protected]).
effectively as an educational tool, both in the university classroom as well as to train industry professionals and policy makers. POWERWEB is also an ideal test bed for other software tools. Market monitoring and visualization tools can be tested in these simulated markets and the wide range of inputs seen in the context of auction experiments provide a great opportunity to test the robustness and performance of optimization algorithms such as optimal power flow solvers.
Regarding the first application area mentioned, experimental economics research, there are a number of reasons why it is desirable to evaluate market structures and rules experimentally using a tool such as POWERWEB.
First, it is widely known in the field of experimental economics that market structures and institutions which are equivalent according to theory, often exhibit very different characteristics in practice.
Second, some market structures are simply too complex to evaluate analytically, so experimental study is the only option. This is especially true in electricity markets which have many network externalities.
Third, empirical analysis of the performance of real world markets is greatly hindered by lack of information and lack of control. In laboratory experiments, specific market features can be isolated and studied in a controlled environment where all information is known by the experimenters.
And fourth, trying out untested markets in the real world, in essence experimenting on the public (as with the California experiments), is an extremely expensive way to study the economic and reliability impacts of market designs and policies. Using tools like POWERWEB as an inexpensive way to analyze proposed market rules and guide market design has the potential for enormous savings in terms of social cost.
A typical economics experiment involves a number of human decision makers making choices in a market setting. Each has an incentive to make the choices which will maximize their profits, since their experimental earnings in the market are converted through an exchange rate to real cash which they take with them at the end of the experiment. This incentive is essential to drive behavior consistent with what would be observed in real markets.
In a POWERWEB experiment, the participants might each represent the owner of a generating company with several generators. They offer their capacity into an auction, which is then cleared according to the specified market rules. For example, given an underlying transmission network, an
POWERWEB: A Tool for Evaluating Economic and Reliability Impacts of Electric Power
Market Designs Ray D. Zimmerman, Member, IEEE, and Robert J. Thomas, Fellow, IEEE
T
2
optimal power flow program might be used to compute the allocation of generation and the corresponding nodal prices. Based on the schedule obtained from the OPF each firm sees their earnings for the period and has the opportunity to respond to a new set of conditions in the next period with an updated offer strategy.
II. POWERWEB ARCHITECTURE
The name POWERWEB is used to refer to the overall platform used to conduct the electricity related market tests. It is an interactive Internet-based application with a web browser interface. The POWERWEB server employs a scalable distributed architecture, with a number of processes running on multiple computers.
While experiments are typically run with a group of participants in a computer laboratory, the web-based interface makes it possible to conduct experiments without the need to gather all of the participants together in a single physical location. Due to the web interface, the only requirement is a computer with an Internet connection and a standard web browser. There is no need to install any additional software.
A. Communications Architecture
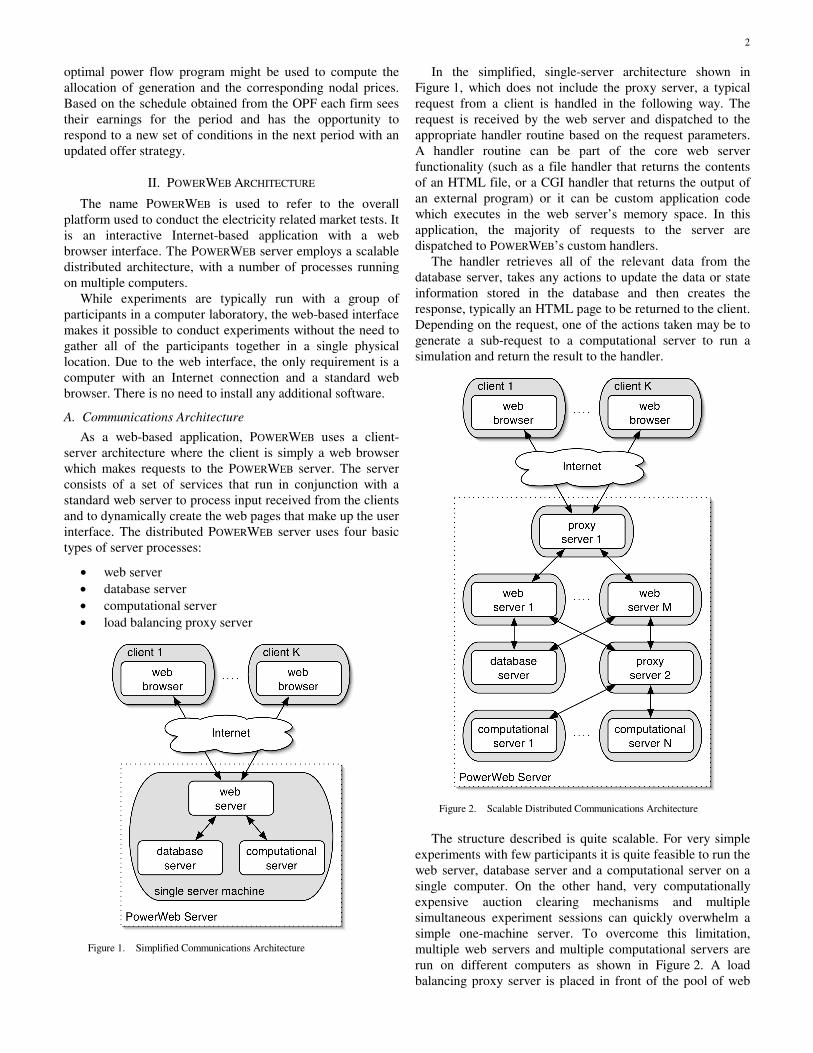
As a web-based application, POWERWEB uses a client-server architecture where the client is simply a web browser which makes requests to the POWERWEB server. The server consists of a set of services that run in conjunction with a standard web server to process input received from the clients and to dynamically create the web pages that make up the user interface. The distributed POWERWEB server uses four basic types of server processes:
• web server • database server • computational server • load balancing proxy server
Figure 1. Simplified Communications Architecture
In the simplified, single-server architecture shown in Figure 1, which does not include the proxy server, a typical request from a client is handled in the following way. The request is received by the web server and dispatched to the appropriate handler routine based on the request parameters. A handler routine can be part of the core web server functionality (such as a file handler that returns the contents of an HTML file, or a CGI handler that returns the output of an external program) or it can be custom application code which executes in the web server’s memory space. In this application, the majority of requests to the server are dispatched to POWERWEB’s custom handlers.
The handler retrieves all of the relevant data from the database server, takes any actions to update the data or state information stored in the database and then creates the response, typically an HTML page to be returned to the client. Depending on the request, one of the actions taken may be to generate a sub-request to a computational server to run a simulation and return the result to the handler.
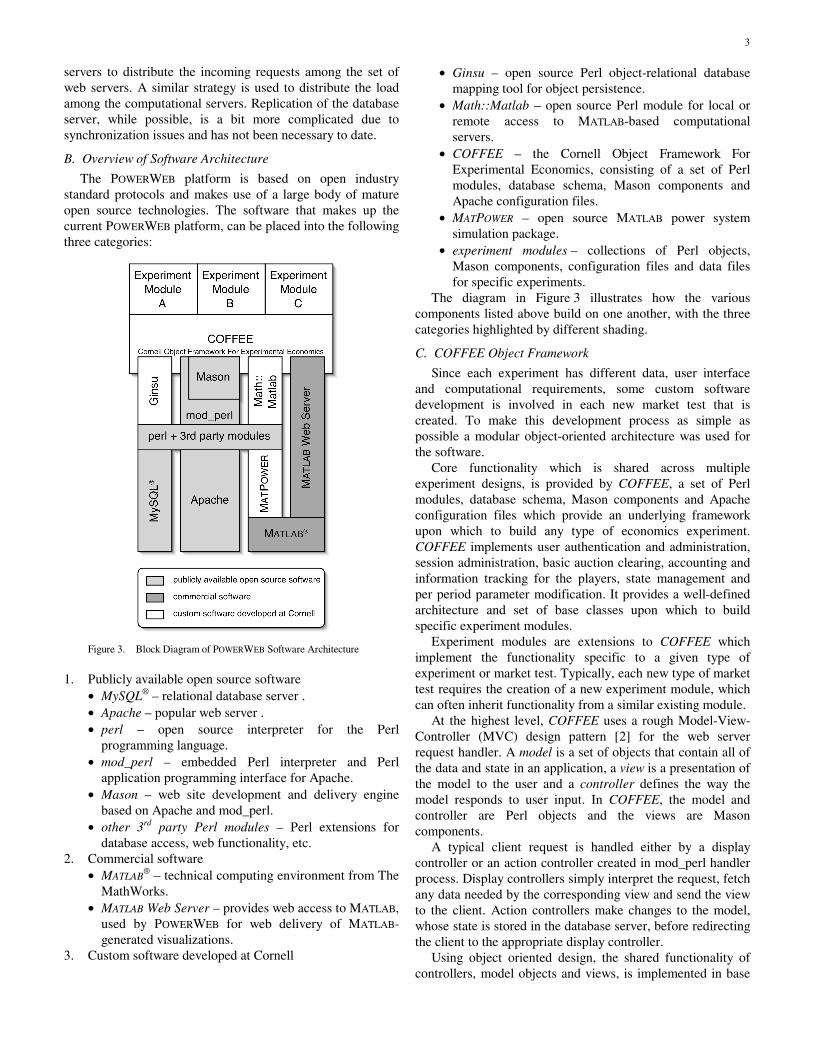
Figure 2. Scalable Distributed Communications Architecture
The structure described is quite scalable. For very simple
experiments with few participants it is quite feasible to run the web server, database server and a computational server on a single computer. On the other hand, very computationally expensive auction clearing mechanisms and multiple simultaneous experiment sessions can quickly overwhelm a simple one-machine server. To overcome this limitation, multiple web servers and multiple computational servers are run on different computers as shown in Figure 2. A load balancing proxy server is placed in front of the pool of web
3
servers to distribute the incoming requests among the set of web servers. A similar strategy is used to distribute the load among the computational servers. Replication of the database server, while possible, is a bit more complicated due to synchronization issues and has not been necessary to date.
B. Overview of Software Architecture
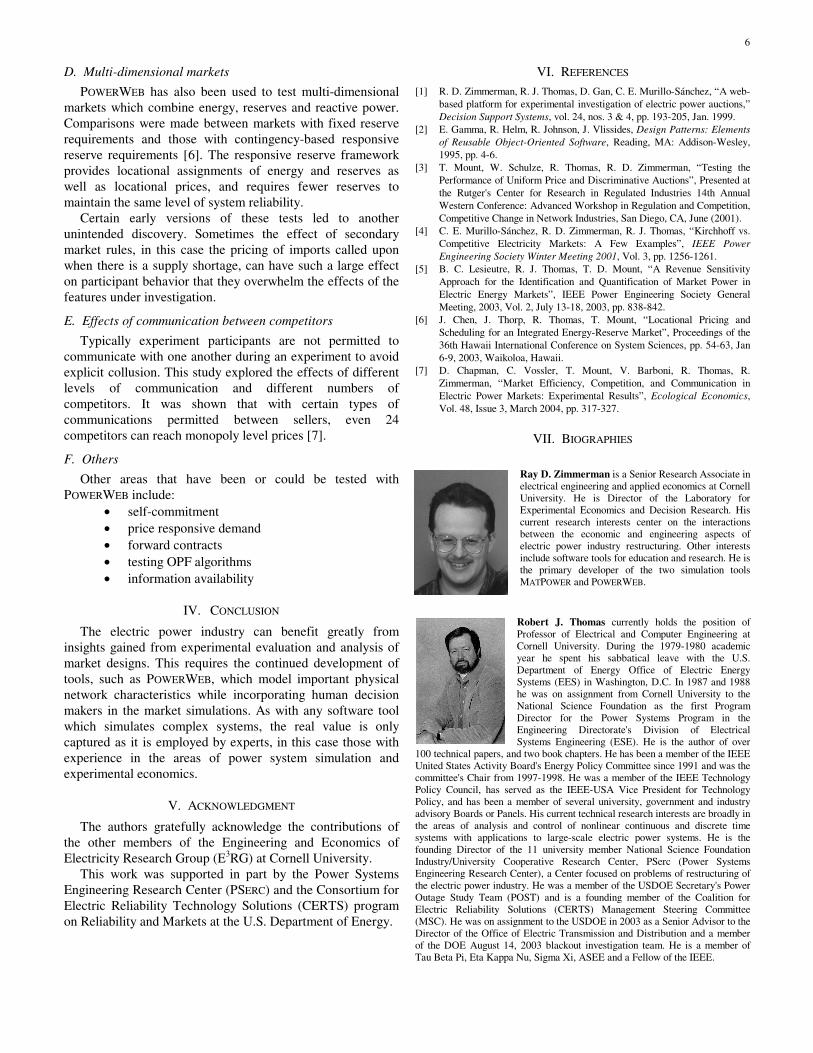
The POWERWEB platform is based on open industry standard protocols and makes use of a large body of mature open source technologies. The software that makes up the current POWERWEB platform, can be placed into the following three categories:
Figure 3. Block Diagram of POWERWEB Software Architecture
1. Publicly available open source software
• MySQL® – relational database server . • Apache – popular web server . • perl – open source interpreter for the Perl
programming language. • mod_perl – embedded Perl interpreter and Perl
application programming interface for Apache. • Mason – web site development and delivery engine
based on Apache and mod_perl. • other 3rd party Perl modules – Perl extensions for
database access, web functionality, etc. 2. Commercial software
• MATLAB® – technical computing environment from The
MathWorks. • MATLAB Web Server – provides web access to MATLAB,
used by POWERWEB for web delivery of MATLAB-generated visualizations.
3. Custom software developed at Cornell
• Ginsu – open source Perl object-relational database mapping tool for object persistence.
• Math::Matlab – open source Perl module for local or remote access to MATLAB-based computational servers.
• COFFEE – the Cornell Object Framework For Experimental Economics, consisting of a set of Perl modules, database schema, Mason components and Apache configuration files.
• MATPOWER – open source MATLAB power system simulation package.
• experiment modules – collections of Perl objects, Mason components, configuration files and data files for specific experiments.
The diagram in Figure 3 illustrates how the various components listed above build on one another, with the three categories highlighted by different shading.
C. COFFEE Object Framework
Since each experiment has different data, user interface and computational requirements, some custom software development is involved in each new market test that is created. To make this development process as simple as possible a modular object-oriented architecture was used for the software.
Core functionality which is shared across multiple experiment designs, is provided by COFFEE, a set of Perl modules, database schema, Mason components and Apache configuration files which provide an underlying framework upon which to build any type of economics experiment. COFFEE implements user authentication and administration, session administration, basic auction clearing, accounting and information tracking for the players, state management and per period parameter modification. It provides a well-defined architecture and set of base classes upon which to build specific experiment modules.
Experiment modules are extensions to COFFEE which implement the functionality specific to a given type of experiment or market test. Typically, each new type of market test requires the creation of a new experiment module, which can often inherit functionality from a similar existing module.
At the highest level, COFFEE uses a rough Model-View-Controller (MVC) design pattern [2] for the web server request handler. A model is a set of objects that contain all of the data and state in an application, a view is a presentation of the model to the user and a controller defines the way the model responds to user input. In COFFEE, the model and controller are Perl objects and the views are Mason components.
A typical client request is handled either by a display controller or an action controller created in mod_perl handler process. Display controllers simply interpret the request, fetch any data needed by the corresponding view and send the view to the client. Action controllers make changes to the model, whose state is stored in the database server, before redirecting the client to the appropriate display controller.
Using object oriented design, the shared functionality of controllers, model objects and views, is implemented in base

4
classes where it can be inherited or overridden by individual experiment modules.
D. Generic Description of Core Objects
An economics experiment, as envisioned by the COFFEE framework, can be thought of generically as consisting of a forum in which the communications between participants have economic consequences. Each set of messages may be repeated in a sequence of similar communications.
In COFFEE, the forum for each set of communications is called a Forum and each participant is a Player. Each Player in a Forum has a particular role. The Forum has a State which is used to sequence the events and communications between players of various roles for a given set of messages and outcomes.
Each Message is recorded along with any corresponding outcomes. An outcome of a set of communications in a Forum can be recorded as a Transaction that specifies an amount of a Product transferred into, out of, or between the various Account objects belonging to the Players.
The sequence of Forums, the relationships between them, the Players in each and their corresponding Accounts are coordinated by the Session and its State object.
In a session, a single Player object may be used throughout all of the Forums. Each Player belongs to a Firm which in turn has a User or Group designated as the owner. A Player may also be assigned a SWAgent which is a software agent that sends messages on its behalf. If a Player does not have a SWAgent, any User having ownership of the Player's Firm (either directly or via a Group) is authorized to make decisions for that Player. The details of the data and behavior of a Player is defined by a (possibly) shared PI (PlayerImplementation) object.
E. An Example
The process of creating a new experiment module involves defining the core objects, which begins with answering a set of key questions. The process is illustrated for a simple experiment module implementing a repeated single-sided energy supply auction.
Who are the players in a forum? There are two types of players, the generators, who act as
sellers, and the ISO (independent system operator) who acts as the single buyer as well as the market coordinator.
What are the products being exchanged? The two main products are electric energy and
experimental dollars, the second of which obviously appears in nearly every experiment. A third product, real dollars, is used to represent the actual payments to participants.
What accounts do the various players need? The ISO and each generator need an account to track
energy and one to track experimental dollars. Generators also have an account for real dollars to track actual payouts.
What are the attributes of the players? Generators have a minimum and maximum capacity,
status, fixed cost, variable cost and an experimental to real dollars exchange rate. The ISO has attributes which specify
forecasted and actual demands, the auction clearing mechanism and the network model with the locations of each generator. E.g. Use an AC optimal power flow to compute allocation and prices in the context of a 30 bus network with the demand distributed in specified percentages among the 20 load buses.
What is the ownership structure of the players? Each user is assigned to a firm owning three generators.
The ISO does not need an owner since all of its decisions are handled by a software agent.
What is the basic sequence of interactions between the players in a forum?
First, the ISO supplies a demand forecast. Second, each generator submits an offer to sell energy. Third, after receiving an offer from each generator, the ISO computes the allocation and pricing of energy sold by the generators to the ISO. This translates directly into a sequence of forum states (READY, BIDDING, CLEARING, DONE) used to synchronize the actions of the players.
What is the content of each player interaction in the forum? I.e. what are the details of the messages and transactions?
Forecasted demand is a single number. An offer is a message consisting of an ordered list of price and quantity pairs which define a marginal offer function. The energy sales computed by the ISO are communicated back to the generators as cleared offer messages, which are also lists of price and quantity pairs. Each energy sale is also recorded as a transaction which transfers energy from generator to ISO and money from ISO to generator. Each energy sale triggers a variable cost transaction from the generator’s experimental dollars account. A fixed cost transaction is also recorded for each generator regardless of sales.
What is the overall structure of the session, that is, the sequence of forums?
The session consists of a predetermined fixed number of periods which are arranged sequentially. Each period has its own independent forum. By contrast, a more complex experiment could be arranged as a multidimensional sequence of forums. E.g. A repeated sequence of a single day-ahead market followed by 24 hourly markets.
What varies and what stays constant from one forum to the next?
All generator and ISO parameters are constant except the ISO’s demand forecast and actual demand which take on prespecified period-specific values.
Figure 4. Sample Offer Submission Page

5
Figure 5. Sample Result Page
What are the sequence of screens seen by each user? In each period, each user begins with an offer submission
page which shows the forecasted demand, the cost parameters for each generator owned and fields for entering their price and quantity offers. After submitting the offer, a “please wait” page is displayed until all offers have been submitted and the market is cleared. Then the results are shown, including amount sold, market clearing price, costs incurred, revenue and earnings. After the first period a history table is displayed at the bottom of all offer, wait and result pages summarizing the results of previous periods. In the process of designing an experiment module, each of these screens is sketched out in detail. Figure 4 and Figure 5 show examples of offer submission and result screens from an actual experiment, slightly different from the one outlined here.
III. SELECTED APPLICATIONS
A. Comparing auction pricing mechanisms
This study focused on type of pricing mechanism used, comparing uniform price auctions, discriminative auctions, and hybrid or “soft cap” auctions [3]. The results of the first treatment, which used a uniform price auction, showed that, contrary to the standard used by federal agencies, even six competitors is not sufficient to make a market competitive when demand is inelastic and stochastic. The results of this treatment replicated the type of price volatility observed in real energy markets.
The discriminative auction used in the UK and the soft cap auction adopted in California in January 2001 based on an order issued by the FERC were considered as possible approaches to making prices more competitive. If generators used the same offer strategies as they do for uniform price, these auctions would work quite well. However, our experiments showed that when generators anticipate a high price, they submit all of their capacity at high prices, resulting in average prices that are above those seen in the uniform price auction.
On the other hand, adding a small amount of price response to the demand, in the form of interruptible load, was effective in reducing average prices.
This set of experiments was also found to be a very effective tool for training a group of regulators in the effects of market rules on seller behavior.
B. Market power
The current electric power network, being a legacy network whose growth and design was based on marginal cost operation of a certain rather fixed pattern of generation, does congest and does operate at various limits under market operation. Having market power is having the means to raise the price of electricity above a competitive level. There are several means to raise prices available to generators in electricity markets and some exist because of the way the interconnecting network works. For example, market power exists from time to time because of a pattern (location) and/or size of ownership, an ability to withhold generation from the market in order to create load pockets (referred to as physical withholding), and/or an ability to shift patterns of flow in the network by inflating offers thus creating market power through congestion. However, the literature on market power has, for the most part, ignored the transmission network and its role in determining supply dispatch and prices paid.
POWERWEB is an ideal tool for investigating the effects of network externalities on market behavior and vice-versa. Using an underlying transmission constrained network, a set of experiments was run that showed that sellers were quickly able to exploit the market power arising from network congestion to raise prices well above competitive levels. As market power was exploited, price volatility increased as well, resulting in greater fluctuations in the dispatch pattern. This latter effect has implications for system reliability in systems where, for example, relays are set based on stable generation patterns. Early versions of these experiments also demonstrated other interesting network related phenomenon, such as cascading market power, price differentials arising from voltage constraints, units with market power due to VAr requirements, and nodal prices above the highest offer in the market [4].
C. Market monitoring
Identifying the potential for explointing market power by including network effects is important. It is a properly designed network that can enable markets to function and, if not properly matched to the market design, dysfunction. Since current networks are legacy networks and current markets are incomplete, there are many scenarios that can cause market dysfunction. One way to identify some of them is to create metrics based on the network. Sensitivity-based metrics intended for real-time monitoring are presented in [5]. These metrics have been implemented in POWERWEB so markets can be monitored during experiments. This provides a way to both test the metrics for usefulness and a mechanism to monitor and detect market power behavior in the experiments. Note, some experiments are designed to test the extent to which market power may be a problem so there is ample opportunity to test the metrics.
6
D. Multi-dimensional markets
POWERWEB has also been used to test multi-dimensional markets which combine energy, reserves and reactive power. Comparisons were made between markets with fixed reserve requirements and those with contingency-based responsive reserve requirements [6]. The responsive reserve framework provides locational assignments of energy and reserves as well as locational prices, and requires fewer reserves to maintain the same level of system reliability.
Certain early versions of these tests led to another unintended discovery. Sometimes the effect of secondary market rules, in this case the pricing of imports called upon when there is a supply shortage, can have such a large effect on participant behavior that they overwhelm the effects of the features under investigation.
E. Effects of communication between competitors
Typically experiment participants are not permitted to communicate with one another during an experiment to avoid explicit collusion. This study explored the effects of different levels of communication and different numbers of competitors. It was shown that with certain types of communications permitted between sellers, even 24 competitors can reach monopoly level prices [7].
F. Others
Other areas that have been or could be tested with POWERWEB include:
• self-commitment • price responsive demand • forward contracts • testing OPF algorithms • information availability
IV. CONCLUSION
The electric power industry can benefit greatly from insights gained from experimental evaluation and analysis of market designs. This requires the continued development of tools, such as POWERWEB, which model important physical network characteristics while incorporating human decision makers in the market simulations. As with any software tool which simulates complex systems, the real value is only captured as it is employed by experts, in this case those with experience in the areas of power system simulation and experimental economics.
V. ACKNOWLEDGMENT
The authors gratefully acknowledge the contributions of the other members of the Engineering and Economics of Electricity Research Group (E3RG) at Cornell University.
This work was supported in part by the Power Systems Engineering Research Center (PSERC) and the Consortium for Electric Reliability Technology Solutions (CERTS) program on Reliability and Markets at the U.S. Department of Energy.
VI. REFERENCES [1] R. D. Zimmerman, R. J. Thomas, D. Gan, C. E. Murillo-Sánchez, “A web-
based platform for experimental investigation of electric power auctions,” Decision Support Systems, vol. 24, nos. 3 & 4, pp. 193-205, Jan. 1999.
[2] E. Gamma, R. Helm, R. Johnson, J. Vlissides, Design Patterns: Elements of Reusable Object-Oriented Software, Reading, MA: Addison-Wesley, 1995, pp. 4-6.
[3] T. Mount, W. Schulze, R. Thomas, R. D. Zimmerman, “Testing the Performance of Uniform Price and Discriminative Auctions”, Presented at the Rutger's Center for Research in Regulated Industries 14th Annual Western Conference: Advanced Workshop in Regulation and Competition, Competitive Change in Network Industries, San Diego, CA, June (2001).
[4] C. E. Murillo-Sánchez, R. D. Zimmerman, R. J. Thomas, “Kirchhoff vs. Competitive Electricity Markets: A Few Examples”, IEEE Power Engineering Society Winter Meeting 2001, Vol. 3, pp. 1256-1261.
[5] B. C. Lesieutre, R. J. Thomas, T. D. Mount, “A Revenue Sensitivity Approach for the Identification and Quantification of Market Power in Electric Energy Markets”, IEEE Power Engineering Society General Meeting, 2003, Vol. 2, July 13-18, 2003, pp. 838-842.
[6] J. Chen, J. Thorp, R. Thomas, T. Mount, “Locational Pricing and Scheduling for an Integrated Energy-Reserve Market”, Proceedings of the 36th Hawaii International Conference on System Sciences, pp. 54-63, Jan 6-9, 2003, Waikoloa, Hawaii.
[7] D. Chapman, C. Vossler, T. Mount, V. Barboni, R. Thomas, R. Zimmerman, “Market Efficiency, Competition, and Communication in Electric Power Markets: Experimental Results”, Ecological Economics, Vol. 48, Issue 3, March 2004, pp. 317-327.
VII. BIOGRAPHIES
Ray D. Zimmerman is a Senior Research Associate in electrical engineering and applied economics at Cornell University. He is Director of the Laboratory for Experimental Economics and Decision Research. His current research interests center on the interactions between the economic and engineering aspects of electric power industry restructuring. Other interests include software tools for education and research. He is the primary developer of the two simulation tools MATPOWER and POWERWEB.
Robert J. Thomas currently holds the position of Professor of Electrical and Computer Engineering at Cornell University. During the 1979-1980 academic year he spent his sabbatical leave with the U.S. Department of Energy Office of Electric Energy Systems (EES) in Washington, D.C. In 1987 and 1988 he was on assignment from Cornell University to the National Science Foundation as the first Program Director for the Power Systems Program in the Engineering Directorate's Division of Electrical Systems Engineering (ESE). He is the author of over
100 technical papers, and two book chapters. He has been a member of the IEEE United States Activity Board's Energy Policy Committee since 1991 and was the committee's Chair from 1997-1998. He was a member of the IEEE Technology Policy Council, has served as the IEEE-USA Vice President for Technology Policy, and has been a member of several university, government and industry advisory Boards or Panels. His current technical research interests are broadly in the areas of analysis and control of nonlinear continuous and discrete time systems with applications to large-scale electric power systems. He is the founding Director of the 11 university member National Science Foundation Industry/University Cooperative Research Center, PSerc (Power Systems Engineering Research Center), a Center focused on problems of restructuring of the electric power industry. He was a member of the USDOE Secretary's Power Outage Study Team (POST) and is a founding member of the Coalition for Electric Reliability Solutions (CERTS) Management Steering Committee (MSC). He was on assignment to the USDOE in 2003 as a Senior Advisor to the Director of the Office of Electric Transmission and Distribution and a member of the DOE August 14, 2003 blackout investigation team. He is a member of Tau Beta Pi, Eta Kappa Nu, Sigma Xi, ASEE and a Fellow of the IEEE.