pozuelo de alarcón is the city with the highest level of ... · pdf file30 june 2015...
TRANSCRIPT
30 June 2015
Urban Indicators (Urban Audit) (1/19)
Urban Indicators (Urban Audit) Year 2015
Pozuelo de Alarcón is the city with the highest level of income and lowest unemployment rate of the 109 analyzed
Sanlúcar de Barrameda has the highest unemployment rate and Torrevieja the lowest level of income
Rubí has the highest proportion of people employed in Industry and the lowest in the Services sector
Urban Indicators is a selection of the content of the Urban Audit European project. Of the list of indicators compiled, 34 were chosen from different domains. The purpose of the project is compiling, estimating and publishing statistical data of social-economic nature with the purpose of understanding and measuring living standards (social well-being) in a certain number of territorial areas.
The basic geographic unit for data collection is the city, while other territorial supra and sub-municipal levels have been defined. The list of cities covered by the project is selected from population density data and size of its urban center. For Spain, it consists of 109 cities.
The 15 cities with the highest population(at 1 January 2014)
TotalMadrid 3,165,235Barcelona 1,602,386Valencia 786,424Sevilla 696,676Zaragoza 666,058Málaga 566,913Murcia 439,712Palma de Mallorca 399,093Palmas de Gran Canaria, Las 382,283Bilbao 346,574Alicante/Alacant 332,067Córdoba 328,041Valladolid 306,830Vigo 294,997Gijón 275,735

Urban Indicators (Urban Audit) (2/19)
For its part, the conurbation ("Greater City") is an urban delimitation of the project, necessary when the urban center extends beyond the administrative boundaries of the city. A city is in such a situation if more than 25% of the population of its urban center is located outside the municipal borders of the city. There are currently about 26 conurbations defined for the European Union, such as Paris, London, Athens, Lisbon, Milan and Dublin. In Spain there are currently only two defined: Barcelona and Bilbao.
Net income
This indicator takes into account two components: annual net disposable income whose source is the Tax Agency, and the number of households obtained by estimate for the cities studied. Information is available for the 109 cities, with the exception of those belonging to the Chartered Community of Navarre and the Basque Country.
In 2012, the three cities with the highest average net income of households belonged to the Community of Madrid: Pozuelo de Alarcón (54,543 euro), Las Rozas de Madrid (45,223 euro) and Majadahonda (44,023 euro).
By contrast, those showing lower income were Torrevieja (7,985 euro), Elche/Elx (12,193 euro) and Fuengirola (13,630 euro).
Conurbations. Population at 01 January 2014
TotalConurbation of Barcelona 3,176,357Conurbation of Bilbao 777,787
Ranking of cities according to average net household income. Year 2012Highest income Lowest incomePozuelo de Alarcón 54,543.78 Santa Coloma de Gramenet 19,117.22Rozas de Madrid, Las 45,223.27 Parla 18,991.19Majadahonda 44,023.45 Talavera de la Reina 18,437.35Sant Cugat del Vallès 41,475.80 Elda 18,098.49Alcobendas 35,464.25 Arrecife 17,421.03Ceuta 30,854.65 Gandia 17,076.79San Sebastián de los Reyes 30,194.24 Santa Lucía de Tirajana 16,575.31Toledo 29,161.36 Marbella 16,493.09Madrid 28,634.86 Sanlúcar de Barrameda 15,985.93Santiago de Compostela 27,778.58 Torremolinos 15,934.17Cerdanyola del Vallès 27,219.82 Benidorm 14,999.06Barcelona 27,168.89 Línea de la Concepción, La 13,924.67Burgos 26,988.94 Fuengirola 13,630.33Melilla 26,914.55 Elche/Elx 12,193.27Castelldefels 26,505.43 Torrevieja 7,985.67
Urban Indicators (Urban Audit) (3/19)
Unemployment and activity rates
One of the most innovative elements of the Urban Indicators project is that average annual unemployment and activity rates are estimated for each of the cities and conurbations.
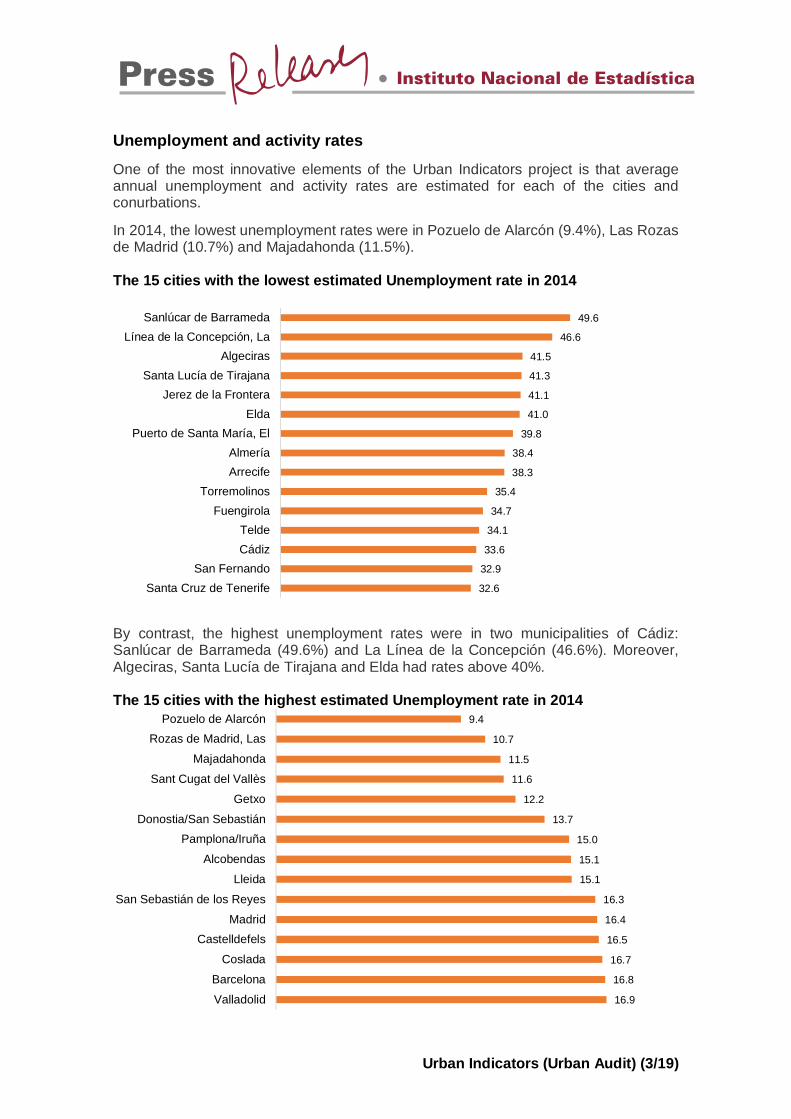
In 2014, the lowest unemployment rates were in Pozuelo de Alarcón (9.4%), Las Rozas de Madrid (10.7%) and Majadahonda (11.5%). The 15 cities with the lowest estimated Unemployment rate in 2014
By contrast, the highest unemployment rates were in two municipalities of Cádiz: Sanlúcar de Barrameda (49.6%) and La Línea de la Concepción (46.6%). Moreover, Algeciras, Santa Lucía de Tirajana and Elda had rates above 40%. The 15 cities with the highest estimated Unemployment rate in 2014
32.6
32.9
33.6
34.1
34.7
35.4
38.3
38.4
39.8
41.0
41.1
41.3
41.5
46.6
49.6
Santa Cruz de TenerifeSan Fernando
CádizTelde
FuengirolaTorremolinos
ArrecifeAlmería
Puerto de Santa María, ElElda
Jerez de la FronteraSanta Lucía de Tirajana
AlgecirasLínea de la Concepción, La
Sanlúcar de Barrameda
16.9
16.8
16.7
16.5
16.4
16.3
15.1
15.1
15.0
13.7
12.2
11.6
11.5
10.7
9.4
Valladolid
Barcelona
Coslada
CastelldefelsMadrid
San Sebastián de los Reyes
Lleida
Alcobendas
Pamplona/IruñaDonostia/San Sebastián
Getxo
Sant Cugat del Vallès
Majadahonda
Rozas de Madrid, LasPozuelo de Alarcón

Urban Indicators (Urban Audit) (4/19)
As for activity rates1, the highest in 2014 were in three cities in the Community of Madrid: Parla (69.9%), Fuenlabrada (68.9%) and Torrejón de Ardoz (67.2%). The 15 cities with the highest estimated activity rate in 2014
On the opposite side, the lowest activity rates were in León (51.4%), Ferrol (51.9%) and Gijón (52.1%). The 15 cities with the lowest estimated activity rate in 2014
1 The activity rate is defined as the ratio between the active population (which is the sum of employed and unemployed) and the total population.
63.964.064.064.364.5
65.165.2
65.665.6
66.166.3
66.867.2
68.969.9
Alcalá de HenaresGirona
ViladecansRubí
Sant Cugat del VallèsCoslada
Palma de MallorcaCastelldefels
ArrecifeRozas de Madrid, Las
San Sebastián de los ReyesSanta Lucía de Tirajana
Torrejón de ArdozFuenlabrada
Parla
54.654.5
54.254.054.0
53.953.8
53.553.3
52.952.8
52.752.1
51.951.4
OviedoPalencia
BilbaoGetxo
Donostia/San SebastiánTorrevieja
CádizValladolidSantander
SalamancaOurense
AvilésGijón
FerrolLeón

Urban Indicators (Urban Audit) (5/19)
Proportion of employment by sector (Industry and Services)
The highest proportion of people employed in the industrial sector in 2014 was recorded in Rubí (with 42.0%). Followed by Elda (39.1%), Avilés and Gijón (both with 25.7%).
On the opposite side, the proportion of people employed in Industry nearly reached 1% in Benidorm and Majadahonda.
In the Services sector, the highest proportions of employees were in Pozuelo de Alarcón (95.2%), Majadahonda (94.8%) and Toledo (94.0%). All cities, except Rubí, exceeded 50%.
Ranking of cities according to proportion of employment in the industry (NACE Rev.2 B-E). Year 2013Highest proportion of employment in industry Lowest proportion of employment in industry Rubí 42.0 Palmas de Gran Canaria, Las 3.7Elda 39.1 Valencia 3.6Avilés 25.7 Getxo 3.4Gijón 25.7 Toledo 3.3Vigo 22.3 Torremolinos 3.2Elche/Elx 22.0 San Fernando 3.2Irun 20.8 Santa Lucía de Tirajana 3.1San Sebastián de los Reyes 20.4 Rozas de Madrid, Las 2.9Burgos 20.3 Torrevieja 2.3Granollers 20.1 Almería 2.0Vilanova i la Geltrú 19.6 Fuengirola 1.8Alcobendas 19.2 Melilla 1.8Getafe 18.8 Pozuelo de Alarcón 1.8Fuenlabrada 18.6 Majadahonda 1.0Sant Boi de Llobregat 18.1 Benidorm 1.0
Ranking of cities according to proportion of employment in services (NACE Rev.2 G-U). Year 2013Highest proportion of employment in services Lowest proportion of employment in servicesPozuelo de Alarcón 95.2 Albacete 73.5Majadahonda 94.8 Dos Hermanas 72.6Toledo 94.0 Terrassa 72.3Benidorm 93.4 Cornellà de Llobregat 71.8Rozas de Madrid, Las 93.3 Burgos 70.9Melilla 90.4 Vigo 70.6Santander 90.1 Sant Boi de Llobregat 70.2Valencia 90.0 Vilanova i la Geltrú 69.7Palmas de Gran Canaria, Las 89.9 Irun 69.7Getxo 89.5 Elche/Elx 68.6Sant Cugat del Vallès 89.0 Fuenlabrada 68.6Algeciras 88.9 Avilés 65.2Cádiz 88.9 Gijón 65.0Ferrol 88.8 Elda 55.4Sevilla 88.8 Rubí 49.9
Urban Indicators (Urban Audit) (6/19)
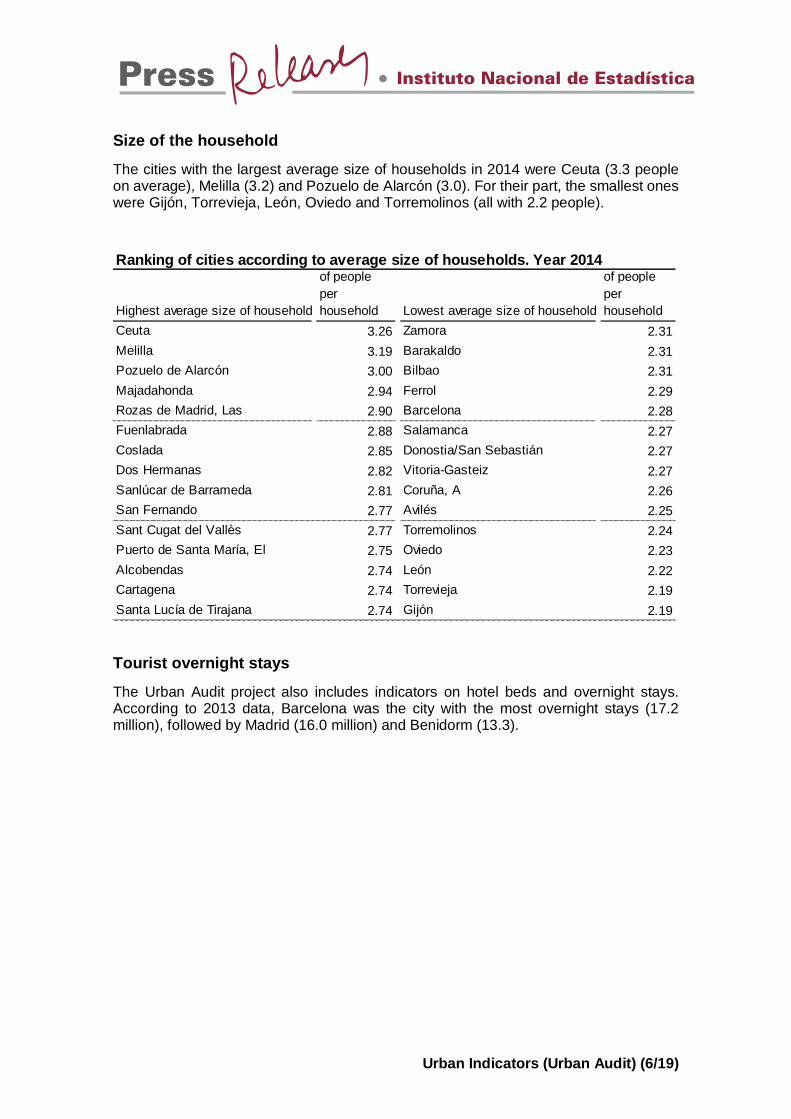
Size of the household
The cities with the largest average size of households in 2014 were Ceuta (3.3 people on average), Melilla (3.2) and Pozuelo de Alarcón (3.0). For their part, the smallest ones were Gijón, Torrevieja, León, Oviedo and Torremolinos (all with 2.2 people).
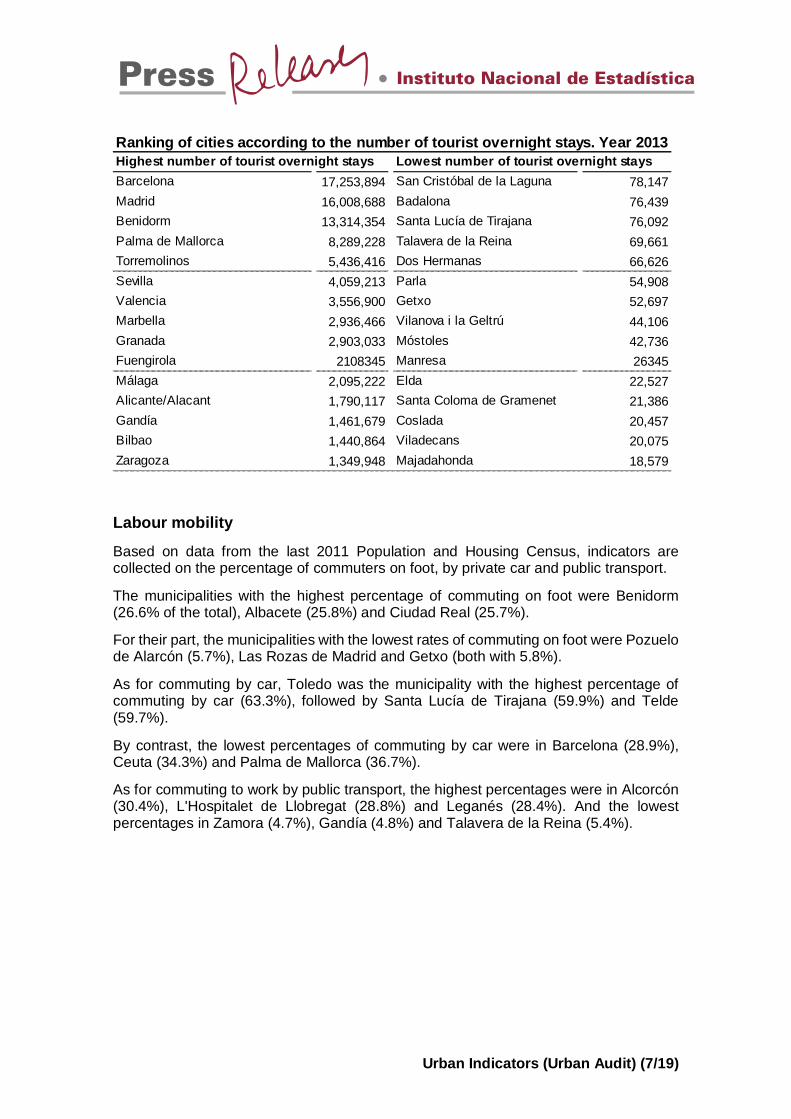
Tourist overnight stays
The Urban Audit project also includes indicators on hotel beds and overnight stays. According to 2013 data, Barcelona was the city with the most overnight stays (17.2 million), followed by Madrid (16.0 million) and Benidorm (13.3).
Ranking of cities according to average size of households. Year 2014
Highest average size of household
of people per household Lowest average size of household
of people per household
Ceuta 3.26 Zamora 2.31Melilla 3.19 Barakaldo 2.31Pozuelo de Alarcón 3.00 Bilbao 2.31Majadahonda 2.94 Ferrol 2.29Rozas de Madrid, Las 2.90 Barcelona 2.28Fuenlabrada 2.88 Salamanca 2.27Coslada 2.85 Donostia/San Sebastián 2.27Dos Hermanas 2.82 Vitoria-Gasteiz 2.27Sanlúcar de Barrameda 2.81 Coruña, A 2.26San Fernando 2.77 Avilés 2.25Sant Cugat del Vallès 2.77 Torremolinos 2.24Puerto de Santa María, El 2.75 Oviedo 2.23Alcobendas 2.74 León 2.22Cartagena 2.74 Torrevieja 2.19Santa Lucía de Tirajana 2.74 Gijón 2.19
Urban Indicators (Urban Audit) (7/19)
Labour mobility
Based on data from the last 2011 Population and Housing Census, indicators are collected on the percentage of commuters on foot, by private car and public transport.
The municipalities with the highest percentage of commuting on foot were Benidorm (26.6% of the total), Albacete (25.8%) and Ciudad Real (25.7%).
For their part, the municipalities with the lowest rates of commuting on foot were Pozuelo de Alarcón (5.7%), Las Rozas de Madrid and Getxo (both with 5.8%).
As for commuting by car, Toledo was the municipality with the highest percentage of commuting by car (63.3%), followed by Santa Lucía de Tirajana (59.9%) and Telde (59.7%).
By contrast, the lowest percentages of commuting by car were in Barcelona (28.9%), Ceuta (34.3%) and Palma de Mallorca (36.7%).
As for commuting to work by public transport, the highest percentages were in Alcorcón (30.4%), L'Hospitalet de Llobregat (28.8%) and Leganés (28.4%). And the lowest percentages in Zamora (4.7%), Gandía (4.8%) and Talavera de la Reina (5.4%).
Ranking of cities according to the number of tourist overnight stays. Year 2013Highest number of tourist overnight stays Lowest number of tourist overnight staysBarcelona 17,253,894 San Cristóbal de la Laguna 78,147Madrid 16,008,688 Badalona 76,439Benidorm 13,314,354 Santa Lucía de Tirajana 76,092Palma de Mallorca 8,289,228 Talavera de la Reina 69,661Torremolinos 5,436,416 Dos Hermanas 66,626Sevilla 4,059,213 Parla 54,908Valencia 3,556,900 Getxo 52,697Marbella 2,936,466 Vilanova i la Geltrú 44,106Granada 2,903,033 Móstoles 42,736Fuengirola 2108345 Manresa 26345Málaga 2,095,222 Elda 22,527Alicante/Alacant 1,790,117 Santa Coloma de Gramenet 21,386Gandía 1,461,679 Coslada 20,457Bilbao 1,440,864 Viladecans 20,075Zaragoza 1,349,948 Majadahonda 18,579

Urban Indicators (Urban Audit) (8/19)
Functional Urban Areas
For the purposes of the Urban Audit project, metropolitan areas of influence, known as Functional Urban Areas (FUA) are defined for the main European cities. Each FUA consists of a city and the municipalities that make up its functional environment, specifically of labour influence2.
The objective is to have an area with a significant part of occupied resident population that commutes to work in the city under study. A municipality belongs to the FUA of a city if 15% or more of its working population commutes to this city for work.
In 2014, the FUA with the highest population were Madrid (with about 6.53 million people) and Barcelona (with 4.89 million).
For their part, Valencia, Seville and Bilbao had more than a million people each.
Net income per household by functional urban areas
The average net household income in 2012 was lead by the Functional Urban Area of Madrid (with 28,172 euro). Followed by Burgos, Toledo and Barcelona (all with more than 26,000 euro).
2 Refer to Methodological Notes for details on the composition of the FUA. In previous editions of the Urban Audit project, it was known as Large Urban Zone (LUZ).
List of the 45 Functional Urban Areas by population. Year 2014 FUA of Madrid 6,529,700 FUA of Vitoria-Gasteiz 268,620FUA of Barcelona 4,891,249 FUA of Elche/Elx 260,176FUA of Valencia 1,619,196 FUA of Cádiz 259,560FUA of Sevilla 1,416,933 FUA of Castellón de la Plana/Castelló de la Plana 236,691FUA of Bilbao 1,025,109 FUA of Cartagena 235,903FUA of Málaga 851,006 FUA of Huelva 229,262FUA of Zaragoza 754,347 FUA of Almería 223,688FUA of Palma de Mallorca 668,447 FUA of Jerez de la Frontera 219,316FUA of Palmas de Gran Canaria, Las 636,103 FUA of Tarragona 216,617FUA of Murcia 618,398 FUA of León 215,706FUA of Granada 548,539 FUA of Salamanca 203,773FUA of Vigo 544,291 FUA of Burgos 201,290FUA of Santa Cruz de Tenerife 481,990 FUA of Santiago de Compostela 199,856FUA of Alicante/Alacant 462,130 FUA of Logroño 193,135FUA of Valladolid 426,469 FUA of Albacete 191,794FUA of Coruña, A 408,697 FUA of Lleida 186,796FUA of Santander 385,117 FUA of Badajoz 178,735FUA of Pamplona/Iruña 368,575 FUA of Jaén 161,017FUA of Córdoba 361,229 FUA of Ourense 150,050FUA of Donostia/San Sebastián 336,192 FUA of Toledo 149,400FUA of Oviedo 315,052 FUA of Algeciras 140,965FUA of Marbella 307,964 FUA of Reus 120,500FUA of Gijón 301,255

Urban Indicators (Urban Audit) (9/19)
The lowest average income was recorded in the FUA of Elche/Elx (12,460 euro), followed by Marbella (13,963 euro) and Málaga (19,420 euro).
Unemployment and activity rates by FUA
The FUA which recorded the lowest unemployment rates for the 2014 average were Donostia/San Sebastián (14.1%), Pamplona/Iruña (15.1%) and Lleida (15.2%).
The 15 functional urban areas with the lowest unemployment rates. Year 2014
Ranking of FUA according to average net household income. Year 2012Highest income Lowest incomeFUA of Madrid 28,172.22 FUA of Badajoz 22,211.21FUA of Burgos 27,130.20 FUA of Santa Cruz de Tenerife 22,139.25FUA of Toledo 26,564.60 FUA of Murcia 22,109.14FUA of Barcelona 26,018.07 FUA of Almería 22,014.47FUA of Santiago de Compostela 25,964.66 FUA of Palmas de Gran Canaria, Las 21,791.09FUA of Coruña, A 25,259.22 FUA of Huelva 21,608.71FUA of Zaragoza 25,165.26 FUA of Castellón de la Plana/Castelló de la Plana21,586.90FUA of Valladolid 24,890.59 FUA of Cartagena 21,578.43FUA of Oviedo 24,805.66 FUA of Alicante/Alacant 21,550.02FUA of León 24,141.32 FUA of Algeciras 21,544.13FUA of Albacete 23,996.57 FUA of Granada 21,088.37FUA of Tarragona 23,790.57 FUA of Jerez de la Frontera 19,442.11FUA of Logroño 23,648.92 FUA of Málaga 19,420.14FUA of Santander 23,638.15 FUA of Marbella 13,963.18FUA of Salamanca 23,544.80 FUA of Elche/Elx 12,460.00
20.119.819.8
19.419.2
18.818.518.3
17.917.8
17.217.0
15.215.1
14.1
FUA of GijónFUA of Oviedo
FUA of BarcelonaFUA of Santiago de Compostela
FUA of SantanderFUA of Madrid
FUA of Coruña, AFUA of LogroñoFUA of BurgosFUA of Bilbao
FUA of ValladolidFUA of Vitoria-Gasteiz
FUA of LleidaFUA of Pamplona/Iruña
FUA of Donostia/San Sebastián

Urban Indicators (Urban Audit) (10/19)
On the opposite side, Jerez de la Frontera was the FUA with the highest average unemployment rate (41.4%), followed by Algeciras (40.2%) and Almería (38.3%).
The 15 functional urban areas with the highest unemployment rates. Year 2014
As for activity rates, the highest were in the FUA in Palma de Mallorca (65.0%), Tarragona (63.2%) and Madrid (62.3%).
The 15 functional urban areas with the highest activity rates. Year 2014
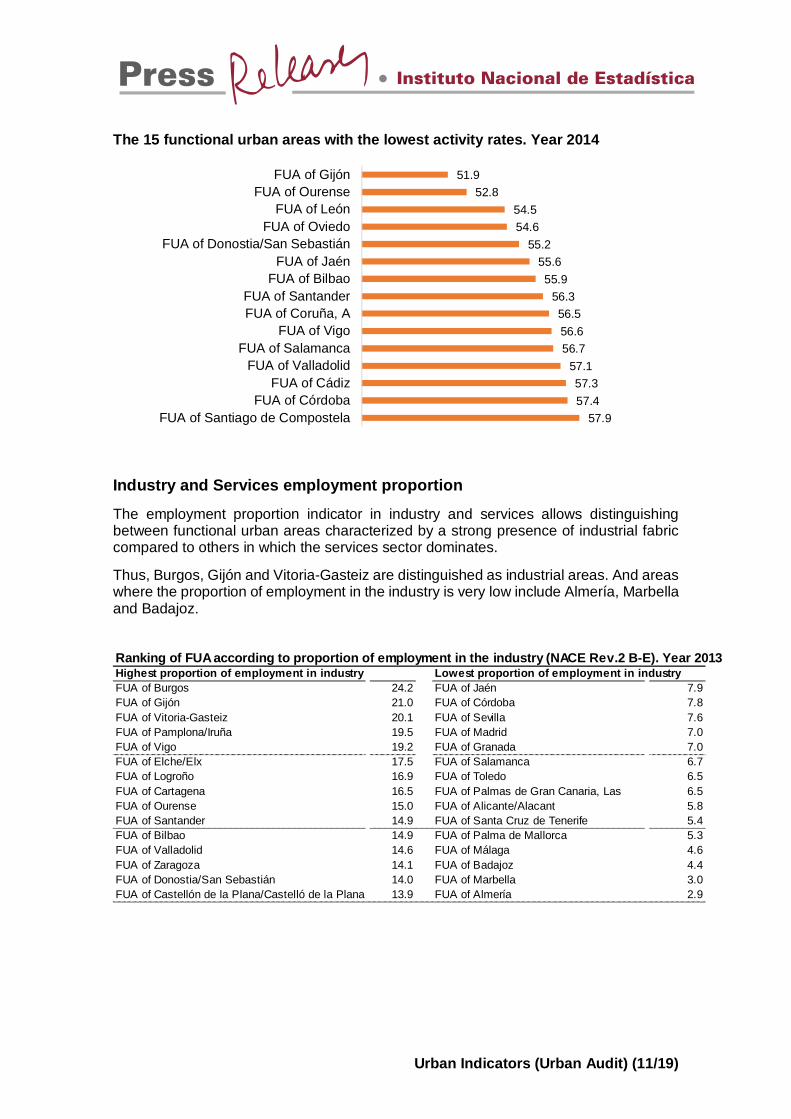
By contrast, the lowest activity rates were recorded in the FUA of Gijón (51.9%), Ourense (52.8%) and León (54.5%).
27.328.828.929.629.7
31.331.932.132.3
33.734.2
35.738.3
40.241.4
FUA of MurciaFUA of Jaén
FUA of BadajozFUA of CórdobaFUA of Marbella
FUA of Santa Cruz de TenerifeFUA of HuelvaFUA of Sevilla
FUA of MálagaFUA of Palmas de Gran Canaria, Las
FUA of CádizFUA of GranadaFUA of Almería
FUA of AlgecirasFUA of Jerez de la Frontera
60.260.260.360.460.560.760.861.061.261.361.4
61.862.3
63.265.0
FUA of MarbellaFUA of Castellón de la…
FUA of CartagenaFUA of Palmas de Gran Canaria,…
FUA of AlbaceteFUA of Santa Cruz de Tenerife
FUA of BarcelonaFUA of LleidaFUA of Reus
FUA of ToledoFUA of AlmeríaFUA of MurciaFUA of Madrid
FUA of TarragonaFUA of Palma de Mallorca
Urban Indicators (Urban Audit) (11/19)
The 15 functional urban areas with the lowest activity rates. Year 2014
Industry and Services employment proportion
The employment proportion indicator in industry and services allows distinguishing between functional urban areas characterized by a strong presence of industrial fabric compared to others in which the services sector dominates.
Thus, Burgos, Gijón and Vitoria-Gasteiz are distinguished as industrial areas. And areas where the proportion of employment in the industry is very low include Almería, Marbella and Badajoz.
57.957.457.3
57.156.756.656.5
56.355.9
55.655.2
54.654.5
52.851.9
FUA of Santiago de CompostelaFUA of Córdoba
FUA of CádizFUA of Valladolid
FUA of SalamancaFUA of Vigo
FUA of Coruña, AFUA of Santander
FUA of BilbaoFUA of Jaén
FUA of Donostia/San SebastiánFUA of Oviedo
FUA of LeónFUA of Ourense
FUA of Gijón
Ranking of FUA according to proportion of employment in the industry (NACE Rev.2 B-E). Year 2013Highest proportion of employment in industry Lowest proportion of employment in industry FUA of Burgos 24.2 FUA of Jaén 7.9FUA of Gijón 21.0 FUA of Córdoba 7.8FUA of Vitoria-Gasteiz 20.1 FUA of Sevilla 7.6FUA of Pamplona/Iruña 19.5 FUA of Madrid 7.0FUA of Vigo 19.2 FUA of Granada 7.0FUA of Elche/Elx 17.5 FUA of Salamanca 6.7FUA of Logroño 16.9 FUA of Toledo 6.5FUA of Cartagena 16.5 FUA of Palmas de Gran Canaria, Las 6.5FUA of Ourense 15.0 FUA of Alicante/Alacant 5.8FUA of Santander 14.9 FUA of Santa Cruz de Tenerife 5.4FUA of Bilbao 14.9 FUA of Palma de Mallorca 5.3FUA of Valladolid 14.6 FUA of Málaga 4.6FUA of Zaragoza 14.1 FUA of Badajoz 4.4FUA of Donostia/San Sebastián 14.0 FUA of Marbella 3.0FUA of Castellón de la Plana/Castelló de la Plana 13.9 FUA of Almería 2.9
Urban Indicators (Urban Audit) (12/19)
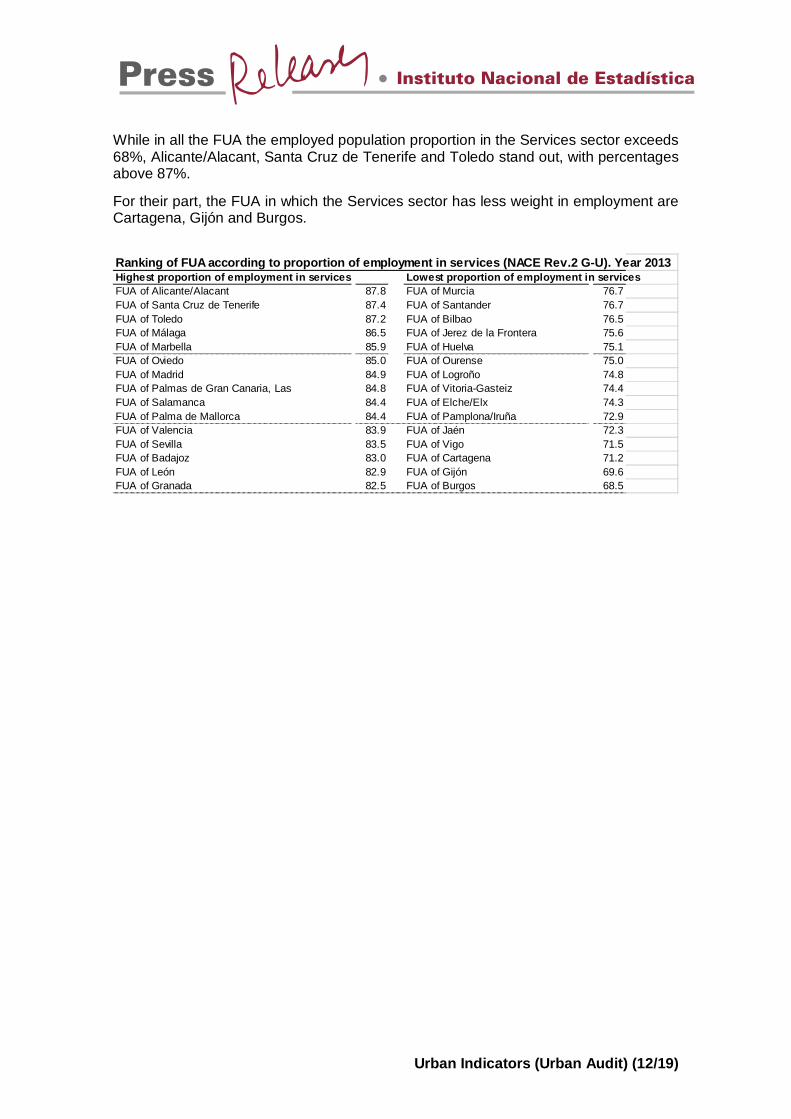
While in all the FUA the employed population proportion in the Services sector exceeds 68%, Alicante/Alacant, Santa Cruz de Tenerife and Toledo stand out, with percentages above 87%.
For their part, the FUA in which the Services sector has less weight in employment are Cartagena, Gijón and Burgos.
Ranking of FUA according to proportion of employment in services (NACE Rev.2 G-U). Year 2013Highest proportion of employment in services Lowest proportion of employment in servicesFUA of Alicante/Alacant 87.8 FUA of Murcia 76.7FUA of Santa Cruz de Tenerife 87.4 FUA of Santander 76.7FUA of Toledo 87.2 FUA of Bilbao 76.5FUA of Málaga 86.5 FUA of Jerez de la Frontera 75.6FUA of Marbella 85.9 FUA of Huelva 75.1FUA of Oviedo 85.0 FUA of Ourense 75.0FUA of Madrid 84.9 FUA of Logroño 74.8FUA of Palmas de Gran Canaria, Las 84.8 FUA of Vitoria-Gasteiz 74.4FUA of Salamanca 84.4 FUA of Elche/Elx 74.3FUA of Palma de Mallorca 84.4 FUA of Pamplona/Iruña 72.9FUA of Valencia 83.9 FUA of Jaén 72.3FUA of Sevilla 83.5 FUA of Vigo 71.5FUA of Badajoz 83.0 FUA of Cartagena 71.2FUA of León 82.9 FUA of Gijón 69.6FUA of Granada 82.5 FUA of Burgos 68.5

Urban Indicators (Urban Audit) (13/19)
Methodological note
The Urban Indicators publications, derives from the European Urban Audit Project, which collects information on living conditions in European Union cities and candidate countries. This is a project launched by the Directorate General of Urban and Regional Policy (DG REGIO), coordinated by Eurostat and developed by the Statistical Office of the participating States.
Its objective is compiling, estimating and publishing comparable statistical data of social-economic nature with the purpose of understanding and measuring living standards in a certain number of territorial areas concerning urban areas.
It originated in the late 90s and responds to the need to address the urban phenomenon as a result of the high degree of urbanization that has been occurring in Europe in recent decades. Cities play an increasingly important role as growth engines, making European regional policy become aware of this reality and, therefore, has included the urban dimension in many programs and projects financed with structural funds.
In this context, the project known as Urban Audit has been created, with an experimental pilot phase launched in 1998 whose outcome allowed its continuity over time based on cycles or phases of information collection of about three years each.
It is currently in its sixth cycle of data collection and throughout its more than 15 years, despite many methodological and territorial changes, it has gained maturity and has managed to become one of the most important Urban information database in the European Union.
Urban Audit started obtaining more than 300 variables covering nine domains or components of living standards: demographics, social and economic aspects, social participation, education and training, environment, communication and transport, information, culture and leisure society. Over time the number of variables has been decreasing gradually: the project has improved the setting of its objectives with better adaptation to the reality of the information available and giving greater weight to information from official sources from which other less comparable sources derived. Currently, it contains 187 variables and 63 indicators that are collected for the years 2013 and 2014.
In recent collections, on the one hand, the number of variables not directly collected by official statistics has been reduced significantly; On the other hand, the methodology and the base information for the delimitation of urban areas has substantially improved with the 2011 census and geo-referencing of the population.
Thus, the necessary conditions are provided for the INE to publish these urban indicators whose usefulness seems beyond doubt. The INE also introduced the operation "Urban Indicators (Urban Audit)" as a statistical operation included in the 2009-2012 National Statistical Plan, approved by the RealDecreto1663/2008, and the 2013-2016 National Statistical Plan approved by the RealDecreto1658/2012.

Urban Indicators (Urban Audit) (14/19)
109 cities and two conurbations
The city is the base of the Urban Indicators (Urban Audit) project. Its definition is based on the presence of an urban center. The latter is identified from a population grid.
This methodology on "degree of urbanization" has its origin in the 90s with the aim of classifying the area where the population resided. Three types of areas were distinguished: densely populated, intermediate and sparsely populated. The definition was based on population, density and contiguity of the LAU3 level 2 (municipalities, in the Spanish case).
This method however distorted results by big differences in size between said LAU, reducing the comparability between countries, even within the same.
As of 2010, the European Commission introduced a new urban-rural regional typology derived from the OECD method, based on a grid of cells of 1km 2. As these cells are of identical size, the distortion mentioned above is eliminated. It is, in short, a commonly accepted method that part of a regular geographical grid of cells of 1km 2 area allowing abstracting from the administrative boundaries.
Said cell network incorporates population data and all those with density more than 1,500 inhabitants per km2 are grouped forming a cluster, which must also maintain a continuous basis once certain spatial coherence criteria is applied.
If the population sum of these adjacent cells exceeds 50,000 inhabitants, it is considered that this population constitutes an "urban center".
The municipalities that encompass these urban centers constitute the list of cities, which currently amount to 109. Consequently, a city is a LAU-2 (municipality in the Spanish case) or group of LAU-2, if over 50% of its population lives in a high-density urban cluster, defined from a population grid, according to the above methodology of "degree of urbanization". Currently, in the Spanish case, the list consists of 109 cities.
In addition to the cities, for the purposes of this project, a statistical unit is created called "Greater City" which has been translated as "conurbation" necessary to resolve the situation that exists in some cities in which this urban center calculated without taking into account the administrative boundaries clearly expands beyond the boundaries of a city. In the case of Spain, today, there have been two: Barcelona and Bilbao.
In the map below, the shaded areas represent the urban centers or high density clusters clearly expanding beyond the municipal boundaries of Barcelona and Bilbao.
3 LAU is short for Local Administrative Unit used in the context of the European Union to designate an administrative subdivision that in the case of Spain corresponds to the municipality. For further information: http://ec.europa.eu/eurostat/web/nuts/local-administrative-units

Urban Indicators (Urban Audit) (15/19)
SOURCE: DG Regio. European Commission
Supramunicipal level: functional urban areas
A Functional Urban Area (FUA) is a grouping of municipalities around the city, linked with it for work. Initially, 45 Functional Urban Areas have been created in Spain, so that they included all Urban Audit cities that exceeded 100,000 inhabitants in 2011.
Each FUA consists of a city and the municipalities that make up its functional environment, specifically of labour influence. It is, therefore, an aggregation of territorial units LAU level 2 (municipalities in the Spanish case). The objective is to have an area with a significant part of occupied resident population that commutes to work in the city under study.
A municipality belongs to the FUA of a city if 15% or more of its working population commutes to the city for work. This is the main criterion but there are others such as contiguity. For very small municipalities there are exceptions to the general rule.
In Spain, the 15% threshold applies to all municipalities with more than 2,000 inhabitants. Below that population size, the following scale is used:
1000 to 2000, if 25% of employees commute to the city.
500 to 1,000, threshold 35%
100 to 500, threshold 45%
0 to 100, threshold 50%

Urban Indicators (Urban Audit) (16/19)
The source of information on place of residence and place of work is the 2011 Population and Housing Census.
Submunicipal level (division of the municipality into districts or similar). The information at sub-municipal level is an essential part of the Urban Audit project. They are referred to as SCD (Sub-City Districts) and consist of a subdivision of the city with the restriction that each SCD has between 5,000 and 40,000 inhabitants.
In this publication, the SCD level has only been considered for municipalities with more than 250,000 inhabitants. The divisions have been created on the proposal of the INE in collaboration with each Municipality concerned.
Both the delimitation of the FUA and the conurbations are created in a harmonized way by the DG Regio of the European Commission.
Overall, the list of cities, conurbations and functional areas is:
Temporal and thematic areas
Regarding the temporal scope, annual data has been collected since 2001. In the different collection cycles, according to the variable of reference, the annual collection of data has been combined with collection only for certain specific years.
The Urban Indicators publication aims to provide a part of indicators that are considered most useful or representative. The number of indicators collected is contained in this summary:
Annual data is provided with the idea of creating a time series that began in 2010. Not all indicators provide information for all years. This depends on the Eurostat requirements according to the collection cycle, since, as has been mentioned, the publication aims to be a subset of project information.
Territorial unitsCities Albacete, Alcalá de Henares, Alcobendas, Alcorcón, Algeciras, Alicante/Alacant, Almería, Arrecife,
Avilés, Badajoz, Badalona, Baracaldo, Barcelona, Benidorm, Bilbao, Burgos, Cáceres, Cádiz,Cartagena, Castelldefels, Castellón de la Plana, Cerdanyola del Vallès, Ceuta, Ciudad Real,Córdoba, Cornellá de Llobregat, Coruña (A), Coslada, Donostia-San Sebastián, Dos Hermanas,Elche/Elx, Elda, Ferrol, Fuengirola, Fuenlabrada, Gandía, Getafe, Getxo, Gijón, Girona, Granada,Granollers, Guadalajara, Huelva, Irun, Jaén, Jerez de la Frontera, Las Palmas de Gran Canaria,Leganés, León, L'Hospitalet de Llobregat, Línea de la Concepción, Lleida, Logroño, Lugo, Madrid,Majadahonda, Málaga, Manresa, Marbella, Mataró, Melilla, Mollet del Vallès, Móstoles, Murcia,Ourense, Oviedo, Palencia, Palma de Mallorca, Pamplona/Iruña, Parla, Ponferrada, Pontevedra,Pozuelo de Alarcón, Prat de Llobregat (El), Puerto Santa María (El), Reus, Rozas de Madrid (Las),Rubí, San Cristóbal de la Laguna, San Sebastián de los Reyes, Sabadell, Salamanca, San Fernando,Sanlúcar de Barrameda, Sant Boi de Llobregat, Sant Cugat del Vallès, Santa Lucía de Tirajana,Santander, Santiago de Compostela, Sevilla, Santa Coloma de Gramenet, Santa Cruz de Tenerife,Talavera de la Reina, Tarragona, Telde, Terrassa, Toledo, Torrejón de Ardoz, Torremolinos,Torrevieja, Valencia, Valladolid, Vigo, Viladecans, Vilanova i la Geltrú, Vitoria/Gastéiz, Zamora yZaragoza.
Conurbations Barcelona y Bilbao
Functional Urban Areas
Albacete, Algeciras, Alicante/Alacant, Almería, Badajoz, Barcelona, Bilbao, Burgos, Cádiz, Castellón dela Plana, Córdoba, Coruña (A), Donostia-San Sebastián, Elche/Elx, Gijón, Granada, Huelva, Jaén,Jerez de la Frontera, Las Palmas de Gran Canaria, León, L'Hospitalet de Llobregat, Lleida, Logroño,Madrid, Málaga, Marbella, Murcia, Ourense, Oviedo, Palma de Mallorca, Pamplona/Iruña, Reus,Salamanca, Santa Cruz de Tenerife, Santander, Santiago de Compostela, Sevilla, Tarragona, Toledo,Valencia, Valladolid, Vigo, Vitoria/Gastéiz y Zaragoza.
Cities with SCDs
Alicante/Alacant, Barcelona, Bilbao, Córdoba, Gijón, Las Palmas de Gran Canaria, L'Hospitalet deLlobregat, Madrid, Málaga, Murcia, Palma de Mallorca, Sevilla, Valencia, Valladolid, Vigo y Zaragoza.

Urban Indicators (Urban Audit) (17/19)
The initial version of the publication provides data for 2010, 2011 and 2012, 2013 and 2014, depending on availability. The objective is to obtain the most current information
The information is broken down into seven domains:
DEMOGRAPHICS
Resident population Proportion of population aged 0-14 (%) Proportion of population aged 15-64 (%) Proportion of population aged >65 (%) Median age of the population Proportion of nationals out of the total population (%) Proportion of natives out of the total population (%) Proportion of foreign-born out of the total population (%) Proportion of foreigners out of the total population (%) Total number of households Average size of households Proportion of households of a person out of total households (%)
For the four indicators related to the total population and by age group, data was obtained from the Register as at 1 January, for all territorial levels except for national whose source is "Population figures".
The median age of the population is calculated using the Census population at 1 January for city, conurbation and supramunicipal area levels. In the national case, the value published in the "Basic Demographic Indicators" of the INE is taken.
The four indicators relating to nationality are obtained with the Census population at 1 January, data obtained from the "Continuous Census Statistics" for all territorial levels except national whose source is "Population figures".
The three indicators for households are estimates from the 2001 Census, 2011 Census and EPA.
SOCIAL ASPECTS
Number of conventional dwellings according to the Cadastre Number of conventional dwellings according to the Census Proportion of empty dwellings (%) Crude birth rate (‰) Crude mortality rate (‰)
Territorial area No Maximum number of indicators
City 109 34Conurbation 2 32Functional Urban Area 45 32Cities with SCDs 16 17National 1 34

Urban Indicators (Urban Audit) (18/19)
The number of dwellings according to the 2011 Census, derives from the same source indicated, and the proportion of empty dwellings.
Crude birth and death rates derive from the statistics of the Natural Population Movement of the INE, considering in the denominator the average population (population at 1 July of the corresponding year). In the national case values derive from the "Basic Demographic Indicators" elaborated by the INE.
ECONOMIC ASPECTS
Unemployment rate (%) Proportion of employees aged 20-64 out of the active population (%) Activity rate (%) Proportion of employment in services (NACE Rev. 2 G-U) (%) Proportion of employment in industry (NACE Rev. 2 B-E) (%) Average net annual household income (euro)
The unemployment rate, the proportion of employees aged 20-64 out of the active population and the activity rate are calculated as average value of the year by estimation techniques of small areas. These are estimates based on 2011 Census data, the active Population Survey (EPA) and the data on unemployment registered in the State Public Employment Service (SEPE). Both the numerator and denominator take into account the population aged 16 or older.
The proportion of employment in services and industry is sourced from the Central Companies Directory (DIRCE) of the INE.
The average gross annual household income is sourced from information provided by the Tax Agency (AEAT) for non-regional territories.
TRAINING AND EDUCATION
Proportion of children aged 0-4 in day care out of the population aged 0-4 (%) Proportion of population aged 25-64 with highest level of education ISCED 0, 1
or 2 (%) Proportion of population aged 25-64 with highest level of education ISCED 3 or
4 (%) Proportion of population aged 25-64 with highest level of education ISCED 5 or
6 (%)
The proportion of children aged 0-4 in day care out of the population aged 0-4 is calculated using data from the Census and the Ministry of Education, Culture and Sports.
Education levels for the population group 25-64 are obtained from the 2011 Census.
LAND USE
Total area (Km2)
The area of the territorial units is provided by measurements made with ArcGis, so the aggregation performed from the lower units require maintaining reasonable spatial coherence.

Urban Indicators (Urban Audit) (19/19)
TRAVEL AND TRANSPORTATION
Percentage of commutes to work by car (%) Percentage of commutes to work on foot (%) Percentage of commutes to work by public transport (%) Average time of commute to work (minutes)
The four variables of the domain "Travel and transportation" are sourced from the 2011 Census.
TOURISM
Annual number of tourist overnight stays Number of bedplaces available in tourist establishments
The two variables of tourism, overnight stays and number of bedplaces are sourced from the tourism survey of the INE.
For further information see INEbase-www.ine.es/en/ All press releases at: www.ine.es/en/prensa/prensa_en.htm Press Office: Telephone numbers: 91 583 93 63 / 94 08 – Fax: 91 583 90 87 - [email protected] Information Area: Telephone number: 91 583 91 00 – Fax: 91 583 91 58 – www.ine.es/infoine/?L=1