ppt spurs projet 0504-client presen
TRANSCRIPT

Spurs Home Game Ticket Sales Analysis
Renkoh KatoGuang LiJia Yu
Master of StatisticsCornell University
May 4, 2011
Agenda
Client & Problem
Key Assumptions
Influencing FactorAnalysis
Introduction1 Data Description2 Models and Analysis3
Project Objective
4 Summary
Preliminary Analysis
Ticket Sales Prediction
Sold-out Games PredictionTimeline & Approach
Overview Interactive Excel Tool
Recommendations
Limitations
2

Agenda
Client & Problem
Key Assumptions
Variables
Introduction1 Data Description2 Models and Analysis3
Project Objective
4 Summary
Preliminary Analysis
Multivariate Linear Regression
Logistic RegressionTimeline & Approach
Overview Excel Demo
Recommendations
Limitations
3

Introduction-Client
Who are the Spurs?
• 4 NBA Championships
• Third highest winning percentage in NBA
history
• Moved to AT&T Center in 2002. Seats
approximately 18,000 people
4

Introduction-Client’s Problem & Project Objective
Client’s Problem
The Spurs wants to explore the factors driving the ticket sales so that they can better predict the ticket demand, maximize ticket revenue and improve operation efficiency
Project Objective
Study and identify the most significant factors which affect ticket demand
Forecast ticket sales for home games during the regular season
Deliver measurable results to support strategic pricing for the Spurs in today’s dynamic market
5

Introduction-General Approach
Periodical Review and Adjustment
Brainstormed influential factors from both micro and macro levels Communicated with client on a regular basis and adjusted project approach accordingly Collected data both from client and public resources
Verified the data with the client and within the team Conducted preliminary analysis and graphs to understand the data Identified and eliminated outliers Modeling: general trend, linear regression and logistic regression models
Excel interactive model based on results generated from SAS Business recommendations based on statistical analysis Presentation Written reports
6
Phase 1 Oct. 2010- Dec. 2010
Identify influential factors and data
collection
Phase 2 Jan. 2011- Mar. 2011
Data cleaning and model building
Phase 3Apr. 2011- May 2011Recommendations
and final deliverables
Project Objective:Ticket Sales Forecast

Agenda
Client & Problem
Key Assumptions
Variables
Introduction1 Data Description2 Models and Analysis3
Project Objective
4 Summary
Preliminary Analysis
Multivariate Linear Regression
Logistic RegressionTimeline & Approach
Overview Excel Demo
Recommendations
Limitations
7

Ticket Sales Data from the Spurs
Influential Factors
Data from the Spurs
Data from research
Date of the game Game number Time of the game Opponent Sold-out game Promotion TV Rankings
Opponent team performance Spurs team performance Economic condition Weather
Brain Storming Client Communication Desk Research Expert Interview
8
Data Description- Data Overview
Season ticket (~70%)
Advance ticket (~11%)
Day of game ticket (~2%)
Night walkup ticket (~1%)
Group ticket (~16%)
328 home games
02-03 season~ 09-
10 season
41 games in each

Data Description- Variable Details
Predictor Variables
Response Variables
Data Transformation
Assigned dummy variables to categorical variables such as weather conditions, time of the game and sold-out games
Clustered variables such as day of week and opponents, and then assigned dummy variables to each cluster
Data Analysis
Validated ticket sales data for each type
Plotted the data to explore ticket sales trend
9
Variable Name Variable Type Source Sample Data
Season ticket Numeric Spurs 10,469
Advance ticket Numeric Spurs 4,547
Day of Game ticket Numeric Spurs 140
Night walkup ticket Numeric Spurs 47
Group ticket Numeric Spurs 1,393
Variable Name Variable Type Source Sample Data
Time of game Character Spurs Afternoon
Day of the week Character Research 7
Weekend indicator Character Research 1
Game number Numeric Spurs 57
Soldout game indicator Character Spurs 1
Opponent Character Spurs Sacramento Kings
Opponent group Character Research 3
Spurs winning % last 10 Numeric Research 90%
Opponent winning % last 10 Numeric Research 70%
Spurs winning % Numeric Research 70%
Opponent winning % Numeric Research 68%
Average temperature °F Numeric Research 50
Weather condition Character Research 1
Unemployment rate % Numeric Research 6.3

32
Identify other outliers
Data Description- Identifying Outliers
Sold out game, when sales>16,000
161 sold-out games in total
Ticket sales reached the limit for such games and thus may mislead the models
Ticket Sales vs Opponent Winning Percentage
Ticket Sales vs Spurs Winning Percentage
Spurs Winning% vs Date
Opponent Winning% vs Date Date
10
Kick out first 4 games in each season
1
Kick out sold-out games
Final dataset for
multivariate linear
regression
Calculated Cook’s distance; cook’s distance >1?
Researched on such games; big promotion event, the first home game after a long time, etc. ?
Kick out these outliers

Agenda
Client & Problem
Key Assumptions
Variables
Introduction1 Data Description2 Models and Analysis3
Project Objective
4 Summary
Preliminary Analysis
Multivariate Linear Regression
Logistic RegressionGeneral Approach
Overview Excel Demo
Recommendations
Limitations
11

Modeling and Analysis- Preliminary Analysis
Advance Ticket
Total Paid Ticket Season Ticket
Day of Game Ticket
Time series of ticket sales by different ticket types
Preliminary Conclusion: Overall fluctuations of ticket sales for different types within each season seem to be decreasing Sales for day of game and advance tickets are decreasing from 02-03 season to 09-10 season Sales for season tickets, which accounts for ~70% of total tickets sales, varied significantly by year.
12

Modeling and Analysis- Preliminary Analysis
Total Paid Ticket
Time series of ticket sales by different ticket types
13
Preliminary Conclusion: Higher unemployment rate, lower saleSales for season tickets increased after 04-05 season, the Spur NBA championship year. Therefore, we anticipate that changes in season ticket sales are more sensitive to expectations on team performance
3.0%
3.5%
4.0%
4.5%
5.0%
5.5%
6.0%
6.5%
7.0%
7.5%
8,000
8,500
9,000
9,500
10,000
10,500
11,000
11,500
12,000
2002-2003 2003-2004 2004-2005 2005-2006 2006-2007 2007-2008 2008-2009 2009-2010
Unemployment Rate
SeasonTickets
Sold
Unemployment Rate vs. Season Tickets Sold

Average ticket sales trend by type from 02-03 season to 09-10 season
Season
Average of
Season Ticket
Average of
Group Ticket
Average of
Advance Ticket
Average of Day
of Game Ticket
Average of Night
Walkup Ticket
Average of
Total Tickets
2002-2003 10,341 3,209 1,963 469 252 14,629
2003-2004 9,898 4,500 2,510 413 160 15,231
2004-2005 9,828 5,149 2,452 423 166 15,444
2005-2006 11,257 5,432 2,008 272 86 16,339
2006-2007 11,134 5,836 1,734 278 117 16,181
2007-2008 11,799 5,249 1,307 246 104 16,081
2008-2009 11,205 5,295 1,302 217 120 15,491
2009-2010 10,086 5,906 1,258 182 148 14,627
Average 10,694 5,072 1,817 312 144 15,503
Preliminary Conclusion: Gate Tickets (advance, day of game, and night walkup) show a downward trend while group tickets have been showing an upward trend Percentage of group ticket has been rising from 10.97% (02-03 season) to 20.19% (09-10 season). Advance ticket sales have become less significant in total tickets sales, percentage decreasing from 13.42% (02-03 season) to 8.60% (09-10 season) Percentage of other types of tickets remains relatively constant in the past 8 seasons
14
Season
Average of
Seasonal Ticket
Average of
Group Ticket
Average of
Advance Ticket
Average of Day
of Game Ticket
Average of Night
Walkup Ticket
Average
of Total Tickets
2002-2003 70.69% 10.97% 13.42% 3.21% 1.72% 100%
2003-2004 64.99% 14.77% 16.48% 2.71% 1.05% 100%
2004-2005 63.64% 16.67% 15.88% 2.74% 1.07% 100%
2005-2006 68.90% 16.62% 12.29% 1.66% 0.52% 100%
2006-2007 68.81% 18.03% 10.72% 1.72% 0.72% 100%
2007-2008 73.37% 16.32% 8.13% 1.53% 0.65% 100%
2008-2009 72.33% 17.09% 8.41% 1.40% 0.77% 100%
2009-2010 68.96% 20.19% 8.60% 1.24% 1.01% 100%
Average 68.98% 16.36% 11.72% 2.02% 0.93% 100%
Modeling and Analysis- Preliminary Analysis

Analysis of ticket sales and corresponding day of week
Preliminary Conclusion: Most sold-out games are held on Fridays and Saturdays, which is in line with common sense Most home games happen on Wednesdays, Fridays and SaturdaysDay of the week has a significant influence on total tickets sales. As we can see more tickets sales occur during the weekend.We expect ticket sales to fluctuate with respect to different days of the week Group ticket sales change contributes to the major difference of total tickets sales for different days of the week One fact worth noting is that the Spurs have great ticket sales Thursdays. However, compared with 74 games scheduled on Wednesdays, only 25 games happened on Thursdays during the past 8 seasons
Day of the
week
Total sold-
out games
Number
of games
Average of
total ticket
Average of
season ticket
Average of
group ticket
Average of
advance ticket
Average of day
of game ticket
Average of
night ticket
Sunday 13 25 15,486 10,795 2,269 1,927 347 147
Monday 6 26 14,712 10,754 2,180 1,256 343 178
Tuesday 18 53 15,085 10,725 2,232 1,639 334 155
Wednesday 26 74 15,106 10,527 2,406 1,708 313 153
Thursday 13 25 15,809 10,855 2,067 2,486 283 118
Friday 42 67 15,959 10,808 2,909 1,840 268 133
Saturday 43 58 16,094 10,605 3,026 2,005 328 130
Average 23 47 15,503 10,694 2,536 1,817 312 144
15
Modeling and Analysis- Preliminary Analysis
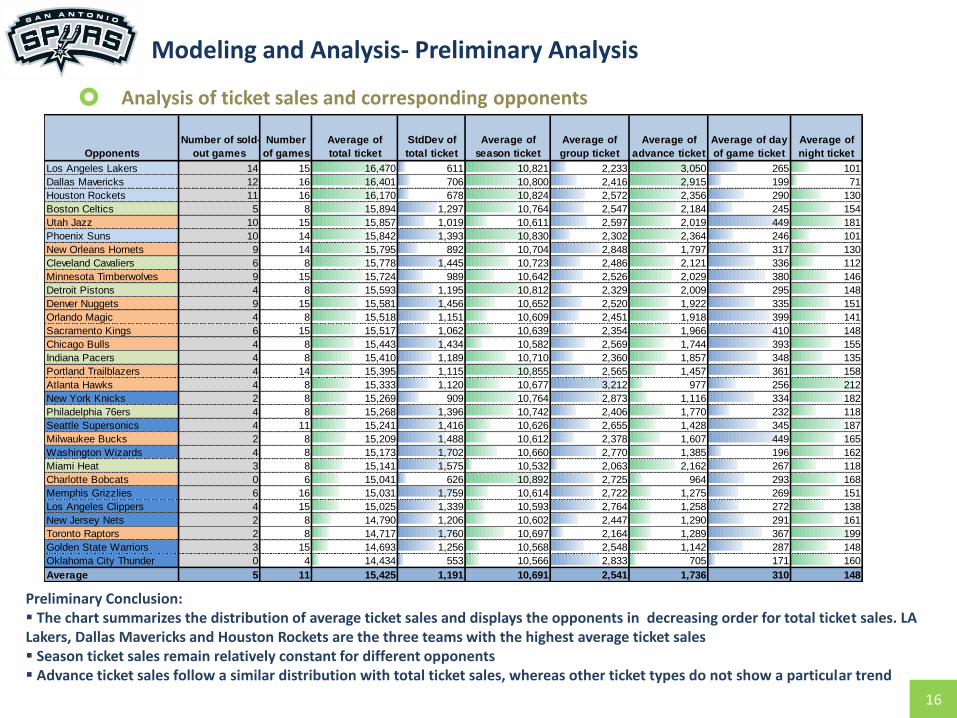
Analysis of ticket sales and corresponding opponents
Preliminary Conclusion: The chart summarizes the distribution of average ticket sales and displays the opponents in decreasing order for total ticket sales. LA Lakers, Dallas Mavericks and Houston Rockets are the three teams with the highest average ticket sales Season ticket sales remain relatively constant for different opponents Advance ticket sales follow a similar distribution with total ticket sales, whereas other ticket types do not show a particular trend
16
Opponents
Number of sold-
out games
Number
of games
Average of
total ticket
StdDev of
total ticket
Average of
season ticket
Average of
group ticket
Average of
advance ticket
Average of day
of game ticket
Average of
night ticket
Los Angeles Lakers 14 15 16,470 611 10,821 2,233 3,050 265 101
Dallas Mavericks 12 16 16,401 706 10,800 2,416 2,915 199 71
Houston Rockets 11 16 16,170 678 10,824 2,572 2,356 290 130
Boston Celtics 5 8 15,894 1,297 10,764 2,547 2,184 245 154
Utah Jazz 10 15 15,857 1,019 10,611 2,597 2,019 449 181
Phoenix Suns 10 14 15,842 1,393 10,830 2,302 2,364 246 101
New Orleans Hornets 9 14 15,795 892 10,704 2,848 1,797 317 130
Cleveland Cavaliers 6 8 15,778 1,445 10,723 2,486 2,121 336 112
Minnesota Timberwolves 9 15 15,724 989 10,642 2,526 2,029 380 146
Detroit Pistons 4 8 15,593 1,195 10,812 2,329 2,009 295 148
Denver Nuggets 9 15 15,581 1,456 10,652 2,520 1,922 335 151
Orlando Magic 4 8 15,518 1,151 10,609 2,451 1,918 399 141
Sacramento Kings 6 15 15,517 1,062 10,639 2,354 1,966 410 148
Chicago Bulls 4 8 15,443 1,434 10,582 2,569 1,744 393 155
Indiana Pacers 4 8 15,410 1,189 10,710 2,360 1,857 348 135
Portland Trailblazers 4 14 15,395 1,115 10,855 2,565 1,457 361 158
Atlanta Hawks 4 8 15,333 1,120 10,677 3,212 977 256 212
New York Knicks 2 8 15,269 909 10,764 2,873 1,116 334 182
Philadelphia 76ers 4 8 15,268 1,396 10,742 2,406 1,770 232 118
Seattle Supersonics 4 11 15,241 1,416 10,626 2,655 1,428 345 187
Milwaukee Bucks 2 8 15,209 1,488 10,612 2,378 1,607 449 165
Washington Wizards 4 8 15,173 1,702 10,660 2,770 1,385 196 162
Miami Heat 3 8 15,141 1,575 10,532 2,063 2,162 267 118
Charlotte Bobcats 0 6 15,041 626 10,892 2,725 964 293 168
Memphis Grizzlies 6 16 15,031 1,759 10,614 2,722 1,275 269 151
Los Angeles Clippers 4 15 15,025 1,339 10,593 2,764 1,258 272 138
New Jersey Nets 2 8 14,790 1,206 10,602 2,447 1,290 291 161
Toronto Raptors 2 8 14,717 1,760 10,697 2,164 1,289 367 199
Golden State Warriors 3 15 14,693 1,256 10,568 2,548 1,142 287 148
Oklahoma City Thunder 0 4 14,434 553 10,566 2,833 705 171 160
Average 5 11 15,425 1,191 10,691 2,541 1,736 310 148
Modeling and Analysis- Preliminary Analysis

Sold out game analysis
Preliminary Conclusion: Ha lf of the games are sold out games, indicating outliers accounts for 50% of total data Sold out percentages in different week days and different seasons are consistent with the average ticket sales analysis With the season approaching the end, there is a larger possibility that it is a sold out game 93% of LA Lakers games are sold out! The sold out probability differs for different time periods of the season
Sold out game vs day of week
17
Opponent
Number of
games
Number of sold
out games
Sold out
percentage
Atlanta Hawks 8 4 50%
Boston Celtics 8 5 63%
Charlotte Bobcats 6 0 0%
Chicago Bulls 8 4 50%
Cleveland Cavaliers 8 6 75%
Dallas Mavericks 16 12 75%
Denver Nuggets 15 9 60%
Detroit Pistons 8 4 50%
Golden State Warriors 15 3 20%
Houston Rockets 16 11 69%
Indiana Pacers 8 4 50%
Los Angeles Clippers 15 4 27%
Los Angeles Lakers 15 14 93%
Memphis Grizzlies 16 6 38%
Miami Heat 8 3 38%
Milwaukee Bucks 8 2 25%
Minnesota Timberwolves 15 9 60%
New Jersey Nets 8 2 25%
New Orleans Hornets 14 9 64%
New York Knicks 8 2 25%
Oklahoma City Thunder 4 0 0%
Orlando Magic 8 4 50%
Philadelphia 76ers 8 4 50%
Phoenix Suns 14 10 71%
Portland Trailblazers 14 4 29%
Sacramento Kings 15 6 40%
Seattle Supersonics 11 4 36%
Toronto Raptors 8 2 25%
Utah Jazz 15 10 67%
Washington Wizards 8 4 50%
Total 328 161 49%
Day of the Week Number of games Number of sold out games Sold out percentage
Sunday 25 13 52%
Monday 26 6 23%
Tuesday 53 18 34%
Wednesday 74 26 35%
Thursday 25 13 52%
Friday 67 42 63%
Saturday 58 43 74%
Total 328 161 49%
Sold out game vs opponent
Sold out game vs game number
Modeling and Analysis- Preliminary Analysis

Modeling and Analysis- Multivariate Linear Regression
Influential factors and coefficients for 5 ticket types
Conclusion Unemployment rate, Spurs winning percentage and day of the week are the most significant variables in almost all 5 models for different ticket types Opponent team is not significant because we classified them as outliers and eliminated all sold out games in the linear regression models
18
Factor Effect Coefficients
Season Ticket Spurs WL Negative -2,063.48
Game Number Positive 6.36
Unemployment rate Negative -451.84
Advance Ticket Unemployment rate Positive 206.78
Spurs WL Positive 3,303.23
Opponent WL Positive 1,108.72
If weekend Positive 147.37
Day of Game Ticket Spurs WL Positive 1,070.57
Opponent WL L10 Positive 205.37
If weekend Positive 32.91
Night Walkup Ticket Unemployment rate Positive 18.90
Spurs WL Positive 278.81
Avg Temp Negative -1.83
Group Ticket Unemployment rate Negative -204.00
Spurs WL Negative -2,365.65
Opponent Group Positive
If weekend Positive 176.59

Logistic Regression for Sold Out Games
Conclusion: Logistic regression results line up with our preliminary analysis that variables day of week, game number and team performance are significant influential factors for sold out probability forecast
Modeling and Analysis- Logistics Regression
19
Factor Effect CoefficientsDay of week
Sunday Positive 0.150Monday Negative -1.410Tuesday Negative -0.650
Wednesday Negative -0.910Thursday Negative -0.610Friday Positive 1.220
Saturday Positive 2.210Game number Positive 0.024Opponent winning % last 10 Positive 2.370Spurs winning % Positive 5.960Opponent group
Opponent Group=1 Positive 1.920Opponent Group=2 Negative -0.002Opponent Group=3 Negative -0.404Opponent Group=4 Negative -1.514
Unemployment rate Negative -0.953

Agenda
Client & Problem
Key Assumptions
Variables
Introduction1 Data Description2 Models and Analysis3
Project Objective
4 Summary
Preliminary Analysis
Multivariate Linear Regression
Logistic RegressionGeneral Approach
Overview Excel Demo
Recommendations
Limitations
20

Prediction for the ticket sales Summary- Prediction in blind test data
Prediction for sold out game
Predict
Actual
Sold Out Non Sold Out
Sold Out 3 0
Non Sold Out 2 21
The overall accuracy rate is 92%
9,000
11,000
13,000
15,000
17,000
1 6 11 16 21 26
Game Number
Total Paid Tickets
21

Excel Tool for Interactive Analysis
We developed an interactive excel model with embedded prediction models.
It enables the client to input model parameters and get directly from this tool the prediction for sold out game probability, sales prediction for each ticket type and summary of ticket sales history
22
Click Here to Explore the Tool

Summary- Recommendations
Arrange more games on the weekends (Thursday, Friday and Saturday night) rather than Wednesdays
Hold more promotional events at the beginning of each season due to smaller sold-out probability for those games and more tickets available to sell
Season tickets sales account for the largest percentage (more than 60%) of total paid tickets sales and fluctuate most significantly. We advise the Spurs to focus on forecasting season ticket attendance for each game
23

Summary- Limitations
Limited access to ticket price data and current pricing strategies. Therefore, our team was not able to formulate suggestions on optimal price and revenue optimization
Kicking out all sold out games may bias the multivariate linear regression model
Inevitably, our team might miss some important factors for ticket sales due to time constraints and data availability (team roster, player transactions, detailed promotion campaign, competing games in other sport league etc.)
The sample size for training data is relatively small (328 games in total)
Prediction model is limited for long-term prediction due to possible changes on internal and external factors. Also, there are time lags when updating some predictor variables such as unemployment rate
24

Thank you!
Q&A
25
Renkoh KatoGuang LiJia Yu
Master of StatisticsCornell University