pqri.orgpqri.org/wp-content/uploads/2015/08/pdf/white paper.pdf · plore the scale-up and...
TRANSCRIPT

1 23
AAPS PharmSciTechAn Official Journal of the AmericanAssociation of Pharmaceutical Scientists e-ISSN 1530-9932 AAPS PharmSciTechDOI 10.1208/s12249-014-0087-x
Best Practices for the Development, Scale-up, and Post-approval Change Control ofIR and MR Dosage Forms in the CurrentQuality-by-Design Paradigm
Glenn A. Van Buskirk, Satish Asotra,Christopher Balducci, Prabir Basu,Gerald DiDonato, Angelica Dorantes,W. Mark Eickhoff, et al.

1 23
Your article is published under the Creative
Commons Attribution license which allows
users to read, copy, distribute and make
derivative works, as long as the author of
the original work is cited. You may self-
archive this article on your own website, an
institutional repository or funder’s repository
and make it publicly available immediately.

White Paper
Best Practices for the Development, Scale-up, and Post-approval Change Controlof IR and MR Dosage Forms in the Current Quality-by-Design Paradigm
Glenn A. Van Buskirk,1,28 Satish Asotra,2 Christopher Balducci,3 Prabir Basu,4 Gerald DiDonato,5
Angelica Dorantes,6 W. Mark Eickhoff,7 Tapash Ghosh,6 Mario A. González,8 Theresa Henry,9
Matthew Howard,10 Jason Kamm,11 Steven Laurenz,12 Ryan MacKenzie,13 Richard Mannion,14
Patrick K. Noonan,15 Terrance Ocheltree,6 Umesh Pai,16 Richard P. Poska,12 Michael L. Putnam,17
Ramani R. Raghavan,18 Colleen Ruegger,3 Eric Sánchez,19 Vinod P. Shah,20 Zezhi Jesse Shao,21
Russell Somma,22 Vijay Tammara,23 Avinash G. Thombre,24 Bruce Thompson,7 Robert J. Timko,25
Satyam Upadrashta,26 and Sivakumar Vaithiyalingam27
Received 14 October 2013; accepted 17 January 2014
Abstract. In this whitepaper, the Manufacturing Technical Committee of the Product Quality ResearchInstitute provides information on the common, best practices in use today in the development of high-quality chemistry, manufacturing and controls documentation. Important topics reviewed include Inter-national Conference on Harmonization, in vitro–in vivo correlation considerations, quality-by-designapproaches, process analytical technologies and current scale-up, and process control and validationpractices. It is the hope and intent that this whitepaper will engender expanded dialog on this importantsubject by the pharmaceutical industry and its regulatory bodies.
KEY WORDS: CMC; ICH; IVIVC; PAT; QbD.
INTRODUCTION
In 1991–1992, three scientific organizations—the Ameri-can Association of Pharmaceutical Scientists, the Food &Drug Association (FDA), and the United States Pharmaco-peia (USP)—collaborated to organize two workshops to ex-plore the Scale-Up and Post-approval Change (SUPAC)principles for (1) immediate-release oral solid dosage forms(1991) and (2) oral extended-release dosage forms (1992).
Proceedings from both workshops were published in 1993(1,2) and have been used as guidance to the industry andregulatory bodies. The proceedings of both workshopsdiscussed and defined the impact of (1) formulation or com-positional changes, (2) process variable changes, (3) processscale changes, and (4) process site changes on the finishedquality parameters of these products. Each area of change wasfurther divided to reflect a hierarchy of “significance” andhence aided in establishing post-approval change filing
This document represents a consensus of the personal views of theauthors and does not necessarily represent the views of the author’srespective company or organization, nor does it represent the policiesor guidelines of those companies or organizations.1 Nonclinical Drug Development Consulting Services, LLC, BaskingRidge, New Jersey 07920, USA.
2AHI Inc., Brampton, Ontario, CanadaL6W 4K4.3 Novartis Pharmaceuticals, East Hanover, New Jersey 07936, USA.4 National Institute of Pharmaceutical Technology and Engineering(NIPTE), Prospect, Illinois 60056, USA.
5 Bristol-Myers Squibb Co., Pennington, New Jersey 08534, USA.6 Food & Drug Administration, Silver Spring, Maryland 20993, USA.7Merck & Co., West Point, Pennsylvania 19486, USA.8 P’Kinetics International, Inc., Pembroke Pines, Florida 33027, USA.9Old Greenwich, Connecticut 06870, USA.10McNeil Consumer Healthcare, Ft. Washington, Pennsylvania, USA.11 Summit Pharma Solutions, LLC, SouthWindsor, Connecticut, USA.12AbbVie, North Chicago, Illinois 60064, USA.13 Janssen Research & Development, LLC, Spring House, Pennsylvania19477, USA.
14 Purdue Pharma LP, Cranbury, New Jersey 08512, USA.15 PK Noonan & Associates, LLC, Williamsburg, Virginia 23188,USA.
16 Sun Pharma USA, Cranbury, New Jersey 08512, USA.17 Boehringer-Ingelheim VetMedica, Inc., Saint Joseph, Missouri64506, USA.
18 Genentech, South San Francisco, California 94080, USA.19 Janssen Ortho, LLC., Gurabo, 00778, Puerto Rico.20 North Potomac, Maryland 20878, USA.21 Arena Pharmaceuticals, San Diego, California 92121, USA.22 Somma Tech Consulting, Somerset, New Jersey 08873, USA.23 Nuron Biotech Inc., Exton, Pennsylvania 19341, USA.24 Pfizer Inc., Groton, Connecticut 06340, USA.25 AstraZeneca LP, Wilmington, Delaware 19850, USA.26 Millennium Pharmaceuticals, Cambridge, Massachusetts 02139,USA.
27 Teva Pharmaceuticals, Pomona, New York 10970, USA.28 To whom correspondence should be addressed. (e-mail:
AAPS PharmSciTech (# 2014)DOI: 10.1208/s12249-014-0087-x
1530-9932/14/0000-0001/0 # 2014 The Author(s). This article is published with open access at Springerlink.com

documentation. In the case of the extended-release dosageforms, the potential need for the conduct of one or morepivotal bioavailability/bioequivalence (BA/BE) studies wasrecognized and, as a result, included a recommended decisiontree to determine when a BE study would be needed to proveequivalence.
Although these documents continue to have utility insupporting post-approval changes, it has been recognized thatthere have been many improvements implemented in thescale-up and control of both immediate-release and extend-ed-release oral solid dosage forms in the last two decades. It isthe goal of the authors of this whitepaper to provide a conciseupdating of important development principles currently avail-able to those in the industry involved in the development ofsuch products. Accordingly, this whitepaper will present com-prehensive chemistry, manufacturing, and controls (CMC)information to those involved in the development and reviewof oral solid dosage form dossiers. It is our hope that theadded information will lead to improved process for post-approval changes. While much of this information is availablein official guidance documents, for example, InternationalConference on Harmonization (ICH) and quality-by-design(QbD) documents, it is a goal of this whitepaper to bring allof the independent pieces into a unified document to facilitateimproved understanding and implementation.
This whitepaper, sponsored by the Product Quality Re-search Institute, is a result of that thinking and is designed toengender additional discussion and commentary from expertswithin the industry, academia, and worldwide regulatory bod-ies. Although the document retains the spirit of the originalworkshop reports, it encourages the inclusion of new tools forthe development, testing, and control of oral solid dosageforms. The use of tools and approaches such as process ana-lytical technologies (PATs), QbD, in vitro–in vivo correlation(IVIVC), and more thorough excipient characterizationshould improve the robustness of the finished products andminimize or prevent unintended drift in the quality of theaffected commercial drug products.
It should be noted that these best practices, as outlined inthis paper, are only applicable to QbD-based applications.They cannot be used for legacy or mature products whichwere not developed using the new systematic and life cycleapproaches. The principles of QbD are mainly in use in Can-ada, Europe, Japan, and the USA, but are gaining recognitionin other countries as well.
REVIEW OF THE 1993 ORAL SOLID DOSAGE FORMWORKSHOP REPORT FINDINGS
We begin our oral solid whitepaper with a brief review ofthe salient findings of the 1993 publications.
Compositional Variables
In 1993, it was recognized that oral solid dosage formscontained both “noncritical” and “critical” components andthat it was the job of the formulating scientist to establish(with data) which excipients fell into each category. Further-more, it was recognized that for noncritical excipients, for bothimmediate- and extended-release (ER) products, “certaincompositional adjustments (to formulations) were determined
to be acceptable, without further justification” (2). The reportalso noted that “there is, however, an additional considerationfor extended-release dosage forms: the inclusion of a criticalrelease component(s) which enables the extended release ofactive ingredients. Thus, for extended-release dosage forms,consideration must be given as to whether the component iscritical or not critical to drug release” (2). The passage of timehas certainly confirmed the validity of these statements.
The authors have undertaken within this whitepaper toinclude a review of the current tools in place that allow phar-maceutical scientists and regulators to evaluate whether achange is critical or not critical.
Using tools in place today such as QbD approaches thatexplore and understand the relationships between target prod-uct parameters and end product quality attributes, our con-tributors believe that more robust products will result. We alsofeel that the use of the current improved statistical designpackages when combined with QbD approaches can affordsubstantial information about the allowable range of bothminor excipients/components and those that are critical toproduct performance. In addition, the use of these approacheswhen combined with improved testing techniques associatedwith PAT and enhanced finished product testing such asin vitro release can and should be used to facilitate reviewand approval of post-approval CMC submissions involvingcompositional variables. Each of these techniques will bediscussed fully in subsequent sections of this whitepaper.
Process Variables
Since 1993, substantial progress has been made by thepharmaceutical industry in the development of robustmanufacturing processes. Techniques such as PAT are becom-ing more common in process control of manufacturing opera-tions and in continual feedback and feed-forward loops thatadjust manufacturing operations, thereby providing a moreconsistent end product. In parallel, improvements to endproduct testing results, including enhanced statistical tools,have further increased the ability of companies to manufac-ture more consistent products and to monitor and controlvariation. Today’s pharmaceutical scientist also has greatlyimproved statistical design tools with which to proactivelydevelop and test formulation and manufacturing process pa-rameters. Our collaborators have elaborated on these controlstrategies in several sections of this whitepaper.
In Vitro Tests
In vitro testing was common in 1993 and was regarded as“a basic quality control tool used along with stability data tocontrol scale-up and post-approval changes” (1). In thiswhitepaper, we review modernization of those techniquesand the testing equipment used to monitor in vitro drug re-lease, with an end goal of facilitating the development ofIVIVCs that can be used to expedite post-approval changes.
In Vitro/In Vivo Correlation
The 1993 Workshop Report on extended-release dosageforms stated that “in order to utilize an IVIVC, the adequacyof the in vitro method to act as a surrogate for in vivo testing
Van Buskirk et al.

must be demonstrated” (2). In the two decades that havefollowed, a number of IVIVCs have been developed. Thecurrent state-of-the- art approaches to IVIVC developmentare reviewed within this whitepaper in order to encouragefurther development of this important tool.
In addition to providing a brief review of all of the majortools in place today that are useful to the pharmaceuticalscientist involved in the development of immediate- and ex-tended-release oral solid dosage forms, our whitepaper con-tributors have included brief commentary on what they see asdeveloping trends that could bring new exciting tools to bearon these issues in the next 3–5 years.
CURRENT PRINCIPLES THAT AFFECT IR AND MRPRODUCT DEVELOPMENT
Introduction and Current State
The Federal Food, Drug, and Cosmetic Act and the Codeof Federal Regulations (Section 314.70(a)(2)) state that theapplicant holds the final responsibility for determining theeffects of a change on the drug product as it relates to theproduct’s safety and efficacy before distributing the drug prod-uct made with a manufacturing change. When the safety as-pect of the product is brought into question as a result of achange, a prior approval supplement is called for, irrespectiveof the suggested filing category for that change. Other than forminor editorial changes such as spelling corrections orreformatting batch records, etc., the applicant must notifythe FDA about each change that is made beyond the rangethat is allowed for that change in the approved application(Section 314.70(a)(1)).
A Supplement or Annual Report must include a list of allchanges contained in the document. The list must describeeach change in sufficient detail so that the agency can makean objective assessment on the appropriateness of thereporting category used. For supplements, the list must beprovided in the cover letter (Section 314.70(a)(6)); for annualreports, the list should be included in the SummarySection (Section 314.81(b)(2)(i)). Each change must be de-scribed in complete detail inside the document.
Available post-approval regulatory documents in theUSA cover a range of topics, but are more focused on drugproduct and changes associated with drug product manufac-ture. There are some regulatory guidance documents in theUSA that cover drug substance changes, but are fairly limitedin scope. A few FDA guidance documents issued were specificto drug substance, e.g., Bulk Active Compound Post-approvalChange (BACPAC) 1, but have since been withdrawn. Thus,there is a pressing need for active pharmaceutical ingredient(API)-focused guidance documents for post-approval changesin the USA.
Changes to the drug substance control strategy may besubject to post-approval change requirements, as stipulated inFDA guidance documents. For example, changes to the drugsubstance manufacturing process require the submission of aprior approval supplement as defined under computer-assisted NDA (CANDA) requirements, unless the change iscovered by an approved design space in the New Drug Appli-cation (NDA).
The availability of ICH Q7 and Q11 guidance documentshas relieved the current gap in a limited way. However, post-approval changes and submissions pathways to handle thosechanges are quite regional in nature, and these guidance doc-uments do not address that issue. Several guidance documentshave been issued by non-US regulatory agencies [e.g., ECcommunication on variations (3) and Health Canada guidanceon post-notice of compliance (NOC) changes (4)] that offervaluable insight into the regulatory pathways (ex-US) to sub-mitting post-approval changes.
ICH Initiatives (Q8, Q9, Q10, Q11)
The FDA’s Critical Path Initiative (5) triggered the de-velopment of new quality paradigms in the pharmaceuticalindustry, including the concept of QbD. The FDA’s ultimategoal was to transform its CMC review practices into a scienceand risk-based pharmaceutical quality assessment systemwhich could potentially lead to an increase in the number ofsuccessful new applications and a reduction in the number ofpost-approval supplements.
Specifically, the FDA’s objectives were to:
– Encourage early adoption of new technological advances bythe pharmaceutical industry– Facilitate industry application of modern quality manage-ment techniques, including implementation of quality systemsapproaches, to all aspects of pharmaceutical production andquality assurance– Encourage implementation of risk-based approaches thatfocus both industry and the agency attention on critical areas– Ensure regulatory review and inspection policies are basedon state-of-the-art pharmaceutical science– Enhance consistency and coordination of the FDA’s drugquality regulatory programs, in part, by integrating enhancedquality systems approaches into the agency’s business process-es and regulatory policies concerning review and inspectionactivities
These objectives are reflected in the ICH’s Q8, Q9, andQ10 guidance documents.
Any discussion on QbD necessitates defining pharmaceu-tical quality, which is rather subjective. ICH defines drugquality as the ability of a product to satisfy stated needs,including identity, strength, and purity, without undesired sideeffects (6).
Historically, the relationship of product quality to productattributes has not been well defined or understood. As aconsequence, the FDA has ensured product quality via tightspecifications based on the observed properties of clinical and/or technical batches and by limiting the changes that can bemade within manufacturing processes (7).
In considering post-approval changes to an approvedNDA or abbreviated New Drug Application (ANDA), cur-rent guidelines do not readily allow for the consideration ofrisk-based and science-based approaches for regulatory deci-sion making. The guidelines were not developed based on athorough understanding of the manufacturing process, priorknowledge and experience from similar types of products, andoverall quality in determining whether a submission is re-quired. Current guidelines recommend manufacturers to as-sess the effects of manufacturing changes on identity, strength,
Development, Scale-Up and Post-approval Control of IR & MR Dosage

quality, purity, and potency of a drug as they relate to thesafety or effectiveness of a product.
This rather prescriptive approach has contributed topharmaceutical companies being reluctant to change theirmanufacturing processes and equipment from time to timefrom a continuous improvement perspective. The currentSUPAC Guidance for Immediate- and Modified-Release solidoral dosage forms permits manufacturers to determine thesubmission requirements and category based on a predefinedalgorithm of information and data.
The introduction of the ICH Quality Guidelines, Q8 (R2),Q9, and Q10, and Q11 are intended to help develop a science-and risk-based approach to quality and, at the same time, en-courage continuous improvement as part of a product’s life cyclethrough an effective pharmaceutical quality control system.
Furthermore, the FDA’s Manual of Policies and Proce-dures (MAPP), specifically MAPP5016.1, outlines and clar-ifies how the CMC reviewers in the Office of New DrugQuality Assessment in the Office of Pharmaceutical Scienceshould apply the guidance recommendations to the review ofregulatory submissions (8).
Since the ICH Guidance documents have been reviewedextensively elsewhere, they are assumed to be part of the work-ing knowledge of our readers and will not be reiterated withinthis whitepaper other than to list their main topic areas, namely,
– ICH Q8 (R2)—Pharmaceutical Development (9)– ICH Q9—Quality Risk Management (10)– ICH Q10—Pharmaceutical Quality System (11)– ICH Q11—Development and Manufacture of Drug Sub-stances (Chemical Entities and Biological/Biological Entities)(12)
The concept of design space for pharmaceutical manufac-ture was suggested in the Guidance for Industry—PAT—AFramework for Innovative Pharmaceutical Development,Manufacturing and Quality Assurance (13). The definition ofdesign space was provided in ICH Q8 (R2) as a multidimen-sional combination and interaction of input variables such asmaterial attributes and process parameters that have been dem-onstrated to provide assurances of quality. Working within sucha design space should not be considered a change. The identifi-cation of the material attributes and critical process parametersis important in describing the boundary of a design space.
Movement outside a design space is generally considereda change which would normally initiate a regulatory post-approval change process. Using the principles in ICH Q9,the level of risk when assessing a change scenario requiressufficient information and detail on how the risks were iden-tified, characterized, and evaluated to clearly convey a fullunderstanding of the decision-making process and the impactof any subsequent decision in a given product or processchange. Combining these risk principles to assess control,communicate, and review quality risks, with prior knowledgeand understanding, it should be possible under the principlesof a robust quality system as outlined in Q10 to determine,using sound scientific knowledge and judgment, the potentialimpact on patient safety and efficacy.
This should provide opportunities for determining theappropriate regulatory approach to a given product or processchange and still meet the requirements as outlined in the 21CFR 314.70 which outlines current requirements for changes
to an approved NDA or ANDA (Prior Approval Supplement,CBE/CBE-30 or Annual Report) (14).
FDA Guidance
Changes to an Approved NDA or ANDA
An FDA-issued guidance (15,16) makes recommenda-tions for post-approval changes in components and composi-t ion, manufacturing sites , manufacturing process ,specifications, container closure system and labeling, as wellas multiple related changes. This guidance does not providerecommendations on specific information required to assessthe effect of changes to identity, strength, purity, or potency ofa drug product. In general, it discusses three types of changes:major changes which have a substantial potential to have anadverse effect on product quality attributes of identity,strength, quality, purity, or potency as they relate to the safetyand efficacy of a drug product; moderate changes which havea moderate potential to affect product quality attributes; andminor changes which would have a minimal potential to ad-versely impact product quality attributes.
CMC Post-approval Manufacturing Changes Reportable inAnnual Reports
In an attempt to reduce the number of manufacturingsupplements in recent years, in connection with FDA’s Phar-maceutical Product Quality Initiative, and incorporating arisk-based approach to the CMC review process, a list ofpost-approval manufacturing changes (16) that can be report-ed in an Annual Report was developed. This listing includeschanges to components and compositions, manufacturing sitesand processes, along with specifications, container closuresystems, and miscellaneous changes.
Canada, Europe, Japan, and the Rest of the World’sCountries
While the SUPAC Guidance is specifically considered aUS-only guidance, it is viewed favorably by some other regu-latory authorities, and aspects of it are incorporated as part oftheir country-specific post-approval change regulatoryrequirements.
As many companies develop products with a global per-spective, there are other guidance documents that may beconsidered when making post-authorization changes to ap-proved immediate- and modified-release products.
Canada
NOC Changes—Quality Guidance Appendix 1 for Hu-man Pharmaceuticals, Canada Ministry of Heath, Health Prod-ucts and Food Branch. This guidance, implemented 17October 2011 (4), outlines the categorization of post-approvalchanges and makes recommendations for supporting docu-mentation based on the level of risk. This revised documentsimplifies the process for submitting post-authorization chang-es in manufacturing and chemistry which require Health Can-ada approval. This revision eliminates level II (NotifiableChange) and moves higher-risk submissions to level I while
Van Buskirk et al.

moving lower-risk changes to level III. The intent of thisrevision was to provide greater clarity for filing requirementsof supplements without affecting safety and efficacy.
The data requirements associated with the changesoutlined in the PNOC-QD are based on (commensurate to)the level of existing knowledge and established assurance ofquality of a product afforded by an NOC and, in many cases,also by market manufacturing experience.
Where there are differences between Health Canada datarequirements to support pre- and post-NOC changes, spon-sors are expected to include information and data in theirsubmission in accordance with pre-NOC guidance documents(17,18) rather than with the PNOC-QD.
European Medicines Agency
In the EU, amendments to an approved application arecalled variations. In 2003 (19), the Variations Guidance wasamended; the intent was to simplify reporting procedures and,at the same time, provide the same regulatory framework forchanges in both the mutual recognition and the centralizedprocedures.
There are three categories of post-approval variations(3). Type 1A variations are considered minor changes. Suchchanges are simply administrative in nature or other modifi-cations which do not affect the quality, safety, or efficacy of theproduct. There are two subcategories of 1A variations, whichhave clearly defined document requirements and set of con-ditions for the change
Type 1A variations are “do and tell.” Generally, the IAvariations can be submitted within 12 months of implementa-tion. These 1A variations will be equivalent to the US annualreports. There is also a type IA(IN) variation where immedi-ate notification is required upon implementation. This is sim-ilar to the US CBE.
Type 1B variations require notification of changes beforeimplementation. Regulatory approval is expected within30 days of submission for changes that are considered morescientifically minor in impact. Type 1B variations are given asexamples rather than as set criteria and conditions. There is a1B default classification for changes that are neither a 1A nora type II variation. The idea behind type 1B changes is to createflexibility for industry, but with that flexibility come the chal-lenges due to the lack of clearly defined requirements. Type 1Bvariations are essentially equivalent to the US CBE 30.
There is also an “unforeseen” variation approach forthose variations that are not listed in either the guideline orthe regulation and for which the type IB by default is uncer-tain or controversial and believed to be a lower category thana type II variation. The Ministry of Health may request theCMDh (Co-ordination Group for Mutual Recognition andDecentralised Procedures—Human) to provide a recommen-dation on the classification of the variation according to Arti-cle 5 of the regulation. Timings of this process can beequivalent to timings of a type II change, so one really needsto make sure there is a need to have a change classified.
Type II variations are for major changes not meeting thecriteria for minor variations and line extensions. Type II var-iations are the severest category and will be prior approvalchange, similar to the US SNDA. The approval timing for atype II variation is typically 3–6 months.
In an attempt to further simply these variation classifica-tions, the European Commission (EC) has proposed currentamendments to the current regulations (20).
One difficulty in dealing with the EU is that there are anumber of different marketing approvals that exist in Europe,i.e., centralized, decentralized, and national, and the adminis-trative reporting burden varies with the different approvalprocesses.
Japan
Japan revised its pharmaceutical Affairs Law in 2002which amended its procedures for post-approval changes. De-pending on the nature of the change, the requirements can bequite extensive, with a lengthy review time. Items noted asminor do not require pre-approval and can be submitted asnotifications (21).
Quality By Design Principles
Importance of TPPs and QTPPs in Product Development
Proactive Identification and Definition of Desired TargetProduct Quality. A quality target product profile (QTPP)relates to the required quality of a drug product or drugsubstance that is necessary to deliver a desired therapeuticeffect. When prepared proactively, the QTPP serves as aset of predefined objectives establishing product and pro-cess deliverables that will provide the greatest benefit forattaining the critical attributes that impact drug productquality. These predefined QTPPs evolve over time duringdrug development and may be modified to incorporatenew knowledge, as is warranted by ongoing clinical stud-ies; such as dose effect and toxicology data that are oftenconducted in parallel with a product’s developmentalactivities.
Clinical, Patient, Marketing Alignment. The QTPP com-prised all the necessary attributes a product needs todeliver in order to meet its intended use. A product’sQTPP provides guidance for linking its process, formula-tion, and incoming materials with therapeutic patient out-comes. Examples of clinically relevant QTPPs include, butare not limited to, dosage form and biorelevant data,dosing regimen that achieves a predefined clinical result,pharmacokinetics (PK), bioequivalence, and establishedefficacy and safety profiles (9). In order to maximizeultimate product performance, other attributes of a drugproduct may also be considered, such as product identify(tablet size, shape, and color) and intended patientpopulation.
QTPP and Risk Assessment. Once all of the componentsof a QTPP have been defined, a preliminary risk assessmentshould be completed before starting development activities.This allows for revision of the QTPP, if needed, and guidesdevelopment activities prior to investment of major develop-ment resources. It is important to note that risk assess-ments should be updated as further knowledge is gainedduring development.
Development, Scale-Up and Post-approval Control of IR & MR Dosage

Importance of CQAs in Product Development
Align with QTPP. Once a product’s QTPP is defined,the appropriate formulation and process characteristics ofthe product can be developed around it. The attributesthat assess the quality of the drug product or drug sub-stance aligned with the QTPP are referred to as thecritical quality attributes (CQAs). They link the product’squality with its desired therapeutic performance. Similarto QTPPs, when CQAs are proactively identified, estab-lishment of target process deliverables can be preparedand alignment with therapeutic targets achieved. WhereQTPPs are derived based on desired clinical responses,CQAs are those characteristics that reflect the final pro-cess and product quality. For example, where bioavailabil-ity is an element of a product’s QTPP, dissolution may beits associated CQA. Although the CQAs are deemedproduct quality- and/or process-relevant, it is importantto understand how they can potentially affect patienttherapeutic outcomes when establishing ”acceptable” spec-ification ranges. In this manner, the QTPP guides theselection of appropriate CQA specifications (or specifica-tion ranges) based on those critical attributes ultimatelynecessary for delivering the desired patient effect.
Changes made to the QTPP during development willnecessitate corresponding changes to the product’s criticalmanufacturing attribute(s) (CMAs), critical process parame-ters (CPPs) and CQAs.
Process-Delivered Responses. The CQAs that define thedrug product QTPP typically include assay, dissolution results,stability, impurity profile, microbial burden, and physical ap-pearance. Presently, CQAs are similar to the drug product anddrug substance release and stability specifications as theytraditionally reflect the desired patient deliverables. However,CQAs are potentially influenced by multivariate parameters,which themselves may interact with other parameters or ma-terial attributes throughout the manufacturing process. There-fore, as the development process evolves, new knowledge maybe uncovered that challenges earlier conclusions. This re-quires that CQAs are updated throughout the product devel-opment processes. An example is the possible shift of a CQAfrom dissolution to disintegration time (DT) for an immediate-release (IR) dosage form. As development proceeds and addi-tional knowledge gained, it may become apparent that DT is abetter quality surrogate than the traditional dissolution.
Correlation to CPPs. Process understanding throughidentification of potentially influential variables (such asprocess parameters, material attributes, drug substancequality, etc.) on CQAs is an integral aspect of the phar-maceutical development process. Those variables thathave an impact (i.e., elicit a significant response) on aCQA(s) are deemed “critical.” When assessing criticality,it is helpful to have predetermined criteria for signifi-cance. For example, is a 3% impact on dissolution of anIR or modified-release (MR) product considered signifi-cant or can the impact be explained by the inherentvariability of the analytical method? In-process attributesmay be more challenging to define. Examples such asblend or granulation flowability (via Carr index or
Hausner ratio), while easy to quantify, may be difficultto establish as a predetermined critical metric, especially ifsuch attributes are not commonly monitored/studied andtherefore no basis of comparison is available. It is impor-tant for the formulation scientist to evaluate how muchvariability in the associated attribute could elicit a re-sponse which can ultimately impact product quality. Un-derstanding the main effects that critical process parameters,material attributes, and their mutual interactions have on aproduct’s defined CQA(s) is important in order to establishcontrol of the CQAs and, ultimately, the final product quality(22).
Importance and Demonstration/Determination of CPPsand Resulting Design Space
Correlation and Alignment to Specific CQAs (Cause/Ef-fect Relationship). CQAs provide the link between criticalformulation and process parameters with clinical product per-formance. Therefore, all critical sources of variability inherentin a formulation or process should be identified and under-stood and a rationale established on how they will be managedgoing forward.
Once an understanding of critical process parameters andmaterial attributes is established for those variables that affectrespective CQAs, deeper knowledge can be developed re-garding the magnitude of effects. Ultimately, this helps estab-lish the appropriate ranges of the multivariate design space. Inorder to attain this level of cause–effect understanding, oneneeds to establish a correlation of the CPP and/or CMAwithits associated response on the design space. This becomeseven more relevant when striving to attain real-time releasetesting (RTRT), where surrogates for therapeutic perfor-mance are correlated not only with analytical release testsbut optimally to a specific process parameter(s) or materialattribute(s) that impacts that analytical response. It is inthese cases where mitigation of risk and optimal deliveryof product performance can be delivered because thedirect influence on quality can be measured. Additionalinformation on RTRT can be found in subsequent sectionsof this paper.
Identifying Current Process Risk and Variability UsingSystematic, Multivariate Design of Experiments and Cross-Dis-cipline Team. The risks associated with a product, whetherduring development or commercial scale, are tied to theamount of incoming variability caused by materials and pro-cess conditions (i.e., parameters, equipment scale, means ofoperation, etc.). Distinguishing critical parameters from thosevariables whose impact is minimal or totally insubstantial isthe essence of pharmaceutical development. Cross-functionalteams composed of a wide array of disciplines (i.e., processdevelopment experts, formulators, statisticians, analysts, tech-nicians, etc.) provide a varied perspective on the importantformulation risks.
Traditionally, criticality evaluation has been performedby varying one condition at a time. Using this methodology,experiments are conducted by varying one parameter whilekeeping all others constant (fixed) and then assessing theresponse (impact). This manner at which variable perfor-mance is studied one factor at a time (OFAT) is not necessarily
Van Buskirk et al.
how parameters behave during routine production. Theshortcoming of this methodology is that it fails to providethe experimenter with an understanding of interactionsbetween variables. Oftentimes, these interactions go unno-ticed and can result in synergistic affects when multiplevariables are allowed to vary collectively, thereby resultingin a magnitude of effect that renders the initial parameterrange suboptimal.
In contrast, the design of experiment (DoE) approachis designed to evaluate systematic variation of multiplefactors (i.e., variables) within the context of one experi-mental design. DoEs can, thereby, be used to identifycriticality of variables and ultimately create mathematicalmodels of the process being examined aimed at predictingprocess performance (23).
Once a relationship between a CPP and CQA isdemonstrated, the variable that demonstrated impact ona CQA should be further evaluated with the goal ofunderstanding how much variability can be induced (i.e.,how far the parameter range can be) in relation to otherparameters as they collectively deliver acceptable productquality. Finding the technical edge of failure is not alwaysnecessary when evaluating criticality factors, especiallywhen the range of the factor is unrealistically wide as itwill likely not be employed in production. Therefore,when constructing a DoE, it is important to keep in mindthe level of desired variability induced in order to learn asmuch as possible about a process within the given re-source constraints.
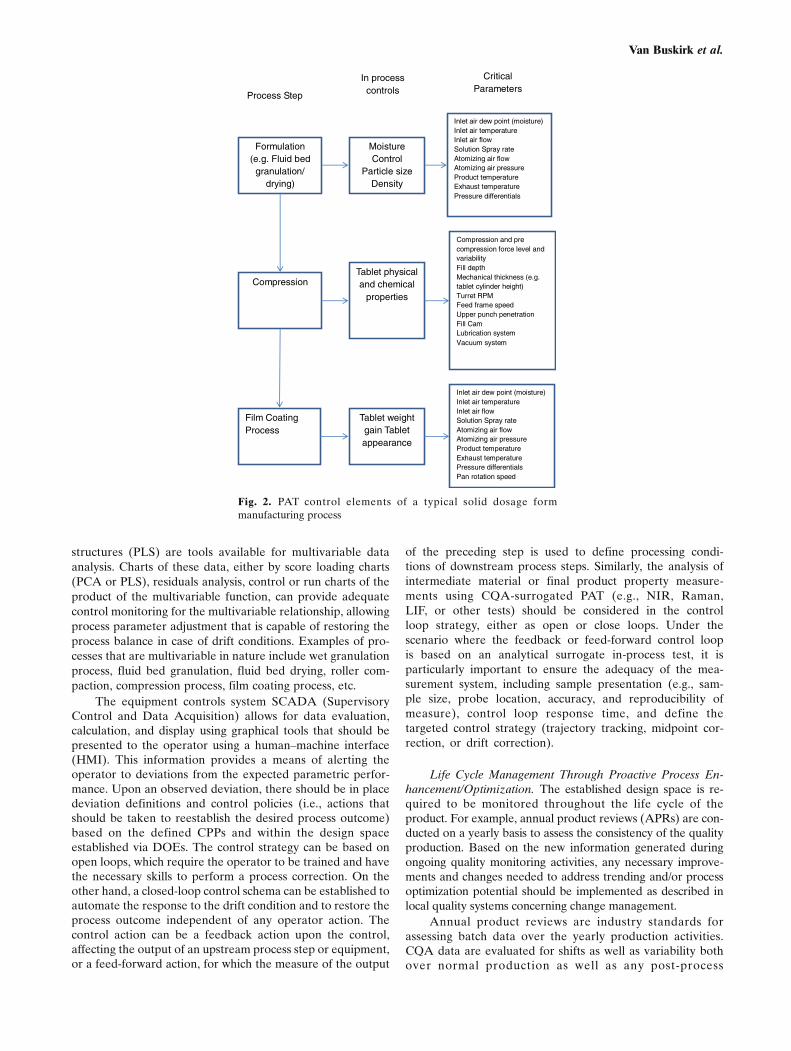
The complex relationship between formulation designfactors, manufacturing unit operations, and their correspond-ing quality attributes is shown in Fig. 1. It is the responsibilityof the development team to identify, and set control limits for,the attributes that are found to be critical to the quality of theproduct (22,23).
Assessment of Significance. Statistical significance resultswhen the factors of a study cause an impact to the identifiedCQAs. It should be noted that although variables can havestatistical significance, the practical significance must also beevaluated. If a sample size is large enough, variables willundoubtedly demonstrate statistical significance. The scien-tist must evaluate what practical meaning this effect has onCQAs.
One way of accessing practical significance is to evaluatethe magnitude of effect the critical variable has on a givenCQA. For example, if particle size distribution is statisticallysignificant, it should only be deemed critical if the magnitudeof the affect is large enough to be of practical concern. This iswhere establishing predetermined criteria for significance be-comes valuable (as previously discussed).
Prior to the DoE and execution, the scientist shouldclearly define how much variability in particle size distributionis considered practically significant, in that the variability overthis predetermined range would likely have an impact on drugproduct quality. While determination of statistical significancemay be generated from statistical packages (i.e., SAS, JMP,MiniTab, etc.), practical significance determination should bemade with the CQAs and patient effects in mind. While avariable may significantly impact an in-process attribute (i.e.,particle size distribution, density, flow, etc.), the final CQAs
may not necessarily be impacted. This is commonly seen withparticle size distribution of granulation that may be impactedby variability in upstream conditions (i.e., granulator speed,time, etc.), but ultimately the overall manufacturing process(such as milling, blending operations) is robust enough tomitigate or eliminate these effects and no ultimate effect isdemonstrated on final product quality.
Combining Input Variables and Process Parameters thatHave Been Demonstrated to Provide Assurance ofQuality. Prior knowledge, proactive team-based risk assess-ments, multivariate experiments, use of PATs (discussed inlater subsection), and continual improvements are used todevelop process understanding to a level necessary to estab-lish a design space for a drug product or drug substance. Thedesign space reflects the product understanding as a multivar-iate area where the impact on product quality is understoodand controlled based on the variability of critical processingparameters and/or material attributes within a known range.A distinction between a design space and proven acceptableranges (PARs) should be clearly made. PARs lack the capa-bility to provide understanding of potential interactionsamong other parameters throughout the drug productmanufacturing process. These interactions (either synergisticor antagonistic) can potentially affect a process and may notnecessarily be determined if studied one at a time in a univar-iate manner.
Essentially, the manufacturing process runs in a multivar-iate environment (i.e., numerous factors are simultaneously inoperation). Therefore, the parameters of that process shouldbe studied in order to fully understand their effects on thedesign space.
Defining an Appropriate Control Strategy
Mitigating Risk Through Maintenance of CPPs and Ad-herence to Design Space to Ensure Product Quality. Once aprocess is developed and transferred to commercial scale,generally, the scope changes from inducing process vari-ability in order to elicit an effect to monitoring the normalvariability in the process and establishing/maintaining pro-cess control. Critical parameters that make up a designspace should be controlled and continually monitored fortrends and shifts that could occur over time in order toavoid significant deviation which could ultimately impactproduct CQAs. The design space is held within specifica-tions via a control strategy, which is defined as “a plannedset of controls, derived from current product and processunderstanding that ensures process performance and prod-uct quality” (9).
The establishment of a control strategy is necessary toensure that the compliance of the drug product or drug sub-stance processing parameters is delivered and that materialattributes are consistently met and remain within theirpredefined settings. It is important to note that the controlstrategy should be developed specifically for the individualprocess that it monitors. A control strategy should includeappropriate elements that will provide monitoring and/or con-trolling potential positioned at strategic junctures of a processwhere criticality has been demonstrated. Typically, a controlstrategy includes items such as additional in-process testing,
Development, Scale-Up and Post-approval Control of IR & MR Dosage

use of PAT tools/probes, IT/software programs (i.e., feedbackloops and automated recipes), well-defined batch records,specifications, etc. For example, if incoming raw material var-iability has been demonstrated to be critical to a CQA [i.e.,disintegrant, particle size distribution (PSD) impact on disso-lution], a supplier change could alter the incoming PSD char-acteristics that affect CQAs even though routine suppliersourcing evaluation is followed and specifications met. It isin this manner that true process monitoring is attained and, ifperformed far enough upstream, intervention possible.
Means of Constant Process Observation Using Technologyand Science. Multivariate Data Analysis: As previously men-tioned, criticality is determined by assessing the magnitude ofimpact a variable (parameter or material attribute) has on aresponse (CQA). Therefore, the relationship between the pa-rameter and CQA needs to be understood. Multivariate dataanalysis (MVDA) is a form of statistics that helps to understandthe relationships between variables, observations, and their rel-evance to each other (using principal component analysis, PCA)as well as relationships between variables and responses (usingpartial least squares, PLS). When coupled with process knowl-edge and criticality understanding, PLS and/or PCAmodels canbe used to construct multivariate statistical process control
(MSPC) charts in order to identify deviations from targetedbehavior. MVDA uses established algorithms to create linearmodels comprising an approximation function and level of con-comitant noise. MVDA models are designed to assess andensure (in near real-time) that the progression of a batch isevolving within the defined design space during processing,thereby ultimately yielding material meeting predefined criticalquality attributes. By this methodology, the process parametersare summarized by a few critical variables (“scores”) instead of avast number of individual process parameters with limitedsignificance.
Generally, these variables are defined by production of aseries of target batches manufactured within normal operatingrange (NOR) parameters. NOR conditions are generallytighter than the encompassing design space and representthe day-to-day parameter settings where slight variability isallowed. Since the behavior of these batches is understood andeven desired, target batches are normally used to build thereference model. Batches that were produced in other areas ofthe design space, generally at greater extremes, are eitherexcluded from batch monitoring models or used to challengethe model for sensitivity. Consequently, batch quality can bedepicted graphically and deviations of process variables from
Potential Critical IPCQuality Attributes
FormulationDesign
Material Parameters
Pre-blending
Process Parameters
Granulation &Milling
Process Parameters
Blending & FinalBlending
Process Parameters
Compression
Process Parameters
Film-Coating
Process Parameters
Excipient Functionality
Roll Pressure/TorqueSpeed
Excipient Grade
Physical Compatibility
Pre-Blend Uniformity
Roll Speed/Tip Speed
Crusher Speed/RotorSpeed
Blend Time
Lube Time
Final Blend Uniformity
Force
Tablet ContentUniformity
Appearance
Spray Rate
Disintegration
Potential CriticalMaterial Attributes
Potential Critical ProcessParameters
Moisture Content
Granulation ParticleSize Distribution
Appearance
Weight
Hardness
Dissolution
Potential Critical QualityAttributes of Finished Product
Exhaust Air Temp
Pre-blend Time
Pre-Blending
Granulation
Milling
Blending
Screen Size
Sieving
Lubrication
Inlet Air Flow
Pan Speed
Atom. Pressure
Sieving
Screen Size
Impeller Speed
QUALITY ATTRIBUTES
Excipient Particle Size
Excipient Surface Area
Excipient MolecularWeight/
Polymerization/Viscosity
Particle Size
API Attributes
Particle Shape
Density
Cohesivity
Compressibility
ExcipientAttributes
API-ExcipientCompatibility
Chemical Compatibility
Screen SizeFlowability
Tablet ContentUniformity
Disintegration
Weight
Hardness
Moisture Content
Purity
Fig. 1. Relationship between formulation design factors and CQAs
Van Buskirk et al.
their expected range can be visualized online in real time,allowing for immediate attention and adjustment.
Process Analytical Technology. Process analytical tech-nology (PAT) is defined as “a system for designing and con-trolling manufacturing through timely measurements (i.e.during processing) of critical quality and performance attri-butes for raw and in-process materials and also processes withthe goal of ensuring final product quality”(13). PAT toolsinclude spectrographic equipment such as near-infrared(NIR) and Raman, but can also include software enhance-ments that lead to a greater understanding of process execu-tion. Some examples include power consumption, ΔT(difference in drying temperature used in wet granulation),and the MSPC models described above. The one elementthese examples of PAT have in common is their connectionto the dynamic process data of a specific parameter andresulting data. These technologies allow for innovative devel-opment means by providing fundamental understanding ofdrug product processes.
Advances in technology have made available many toolsthat provide effective means for acquiring information tofacilitate scientific understanding, continuous improvementand development of risk-managed pharmaceutical develop-ment, manufacture, and quality assurance. One of the mostcommon PATs is the utilization of multivariate tools for de-sign, data acquisition, and analysis: For example, design ofexperiments and multivariate data analysis seek to measurethe interactions between multiple process variables simulta-neously. Interactions between process variables are the mostfrequent attributable cause of process failures and are nottypically detected, and thus a major pitfall of the univariatedesign. When used appropriately, multivariate tools enablethe identification and evaluation of product and processvariables that may be critical to product quality and per-formance. These tools may also identify potential failuremodes and mechanisms and help quantify their effects onproduct quality. Therefore, PAT is part of an overallstrategy of continuous improvement that enables continu-ous learning through data collection and analysis over theproduct life cycle.
PAT Process Controls, Controls Integration, and Informa-tion Management. Process Controls and Model-Based Sys-tems : In today ’s highly automated manufacturingenvironment, parametric controls are a critical component ofthe process control strategy and are fundamental to the pro-cess information and knowledge base.
Multiple components in pharmaceutical manufacturingmachinery have elements of performance control, monitoring,and measurement; however, only the relevant control ele-ments that are influential to CQAs are typically included aspart of the process control strategy.
The evaluation of the equipment–product interaction is akey element of risk management analysis. Analyzing equip-ment–product interaction as part of the risk management toolsallows for the determination of what is important to measureand control. ICH guideline Q9 provides risk analysis tools thatcan be used in the determination of the equipment–productinteraction risk elements.
Typically, a pharmaceutical manufacturing process hasequipment components that fit the need for the type of controldesign, either discrete, batch, continuous, or a combination ofthem. Figure 2 shows a diagram of the equipment train of atypical solids manufacturing process. Note that each piece ofequipment in the figure includes a list of the equipment para-metric control elements that are commonly agreed as processperformance or safety controls. Filtering the quantum of para-metric information into a critical parameter list requires theanalysis of the equipment–process interaction with respect toavailable process knowledge and the criticality analysis onproduct quality. The criticality analysis of the process para-metric space results in a failure mode hypothesis that needsempirical confirmation. The empirical confirmation of thefailure modes often requires experimental evaluation, partic-ularly in a new product or process design; otherwise, historicaldata or a combination of DOE and historical data shall lead tothe definition of the critical process parameters.
Upon DOE execution, the hypothetical failure modesand their control definitions are either confirmed as criticalor regarded as noncritical for the product CQAs. The confor-mance of the quality attributes satisfying the target productprofile expectation may then be defined in a design spacerelevant to critical (equipment) process parameters (CPPs)that become part of the equipment control strategy.
The availability of a multivariate DOE-based processfingerprint shall be used in the establishment of process em-pirical models that relate relevant CPPs to the product CQAs.The initial goal for the use of the DOE data is to establishcontrol loops, or limits of manual adjustments by equipmentoperators. In particular, when combined with CQA-surrogat-ed process analytical technology (e.g., NIR, Raman, or fluo-rescent spectroscopy), the empirical model can become aprocess/product performance predictive model with real-timerelease capabilities that could enable dynamic control strate-gies. An expected subsequent improvement of the controlstrategy should include the analysis of process relationshipsto fundamental theoretical models that explain the observedprocess performance with mathematical accuracy (e.g., firstprinciple and thermodynamic models, population balancemodels, mass balance models, diffusion models, etc.). Theintegration of the empirical data and the fundamental mathe-matical modeling along with the in-process analytical technol-ogy is a powerful tool that should become the ultimate goal ofthe control strategy when possible. This is particularly truewhen material quality attributes are well established and con-trolled and previous knowledge regarding model systems rel-evant to the pharmaceutical manufacturing process areconsidered.
Controls Integration and Information Management: Theprocess control inputs, when defined relevant to the CQAs,are part of the PAT toolset and contain statistically significantpredictive information that should be monitored and used aspart of the control strategy. Univariate parametric informationcan be established as a first line of defense against processvariation that could be detrimental to product performance.Charting techniques using statistically defined limits (e.g., runcharts, moving average, moving range, or Shewhart controlcharts) can serve this purpose. Multivariate analysis of para-metric data can also be important. Multiple regression analy-sis, PCA, and partial least squares or projections to latent
Development, Scale-Up and Post-approval Control of IR & MR Dosage
structures (PLS) are tools available for multivariable dataanalysis. Charts of these data, either by score loading charts(PCA or PLS), residuals analysis, control or run charts of theproduct of the multivariable function, can provide adequatecontrol monitoring for the multivariable relationship, allowingprocess parameter adjustment that is capable of restoring theprocess balance in case of drift conditions. Examples of pro-cesses that are multivariable in nature include wet granulationprocess, fluid bed granulation, fluid bed drying, roller com-paction, compression process, film coating process, etc.
The equipment controls system SCADA (SupervisoryControl and Data Acquisition) allows for data evaluation,calculation, and display using graphical tools that should bepresented to the operator using a human–machine interface(HMI). This information provides a means of alerting theoperator to deviations from the expected parametric perfor-mance. Upon an observed deviation, there should be in placedeviation definitions and control policies (i.e., actions thatshould be taken to reestablish the desired process outcome)based on the defined CPPs and within the design spaceestablished via DOEs. The control strategy can be based onopen loops, which require the operator to be trained and havethe necessary skills to perform a process correction. On theother hand, a closed-loop control schema can be established toautomate the response to the drift condition and to restore theprocess outcome independent of any operator action. Thecontrol action can be a feedback action upon the control,affecting the output of an upstream process step or equipment,or a feed-forward action, for which the measure of the output
of the preceding step is used to define processing condi-tions of downstream process steps. Similarly, the analysis ofintermediate material or final product property measure-ments using CQA-surrogated PAT (e.g., NIR, Raman,LIF, or other tests) should be considered in the controlloop strategy, either as open or close loops. Under thescenario where the feedback or feed-forward control loopis based on an analytical surrogate in-process test, it isparticularly important to ensure the adequacy of the mea-surement system, including sample presentation (e.g., sam-ple size, probe location, accuracy, and reproducibility ofmeasure), control loop response time, and define thetargeted control strategy (trajectory tracking, midpoint cor-rection, or drift correction).
Life Cycle Management Through Proactive Process En-hancement/Optimization. The established design space is re-quired to be monitored throughout the life cycle of theproduct. For example, annual product reviews (APRs) are con-ducted on a yearly basis to assess the consistency of the qualityproduction. Based on the new information generated duringongoing quality monitoring activities, any necessary improve-ments and changes needed to address trending and/or processoptimization potential should be implemented as described inlocal quality systems concerning change management.
Annual product reviews are industry standards forassessing batch data over the yearly production activities.CQA data are evaluated for shifts as well as variability bothover normal production as well as any post-process
Formulation (e.g. Fluid bed
granulation/ drying)
Moisture Control
Particle sizeDensity
Inlet air dew point (moisture)Inlet air temperatureInlet air flowSolution Spray rateAtomizing air flowAtomizing air pressureProduct temperature Exhaust temperaturePressure differentials
Process Step
In process controls
Critical Parameters
CompressionTablet physical and chemical
properties
Compression and pre compression force level and variabilityFill depthMechanical thickness (e.g. tablet cylinder height)Turret RPMFeed frame speedUpper punch penetrationFill CamLubrication systemVacuum system
Film Coating Process
Tablet weight gain Tablet appearance
Inlet air dew point (moisture)Inlet air temperatureInlet air flowSolution Spray rateAtomizing air flowAtomizing air pressureProduct temperature Exhaust temperaturePressure differentials Pan rotation speed
Fig. 2. PAT control elements of a typical solid dosage formmanufacturing process
Van Buskirk et al.

optimization implementation initiatives that may have takenplace. Statistical assessment of data can provide a more rep-resentative account of CQAvariability. Statistical measures ofprocess quality capability, such as ANOVA, Cpk, and Ppk,assess variability around a mean and can therefore quantifythe magnitude of variability of release data. DoE batcheswould not be used to calculate process capability because ofthe induced variability a DoE introduces to a process for thepurpose of impact assessment. Cpk is designed to evaluatenormal variability of a process (i.e., at set point or targetconditions). Although CQA impact assessment provided bya DoE is beneficial from a CPP establishment perspective, thebatch results should not be used for Cpk calculation becausethe inherent process variability cannot be assessed accurately.When none of the DoE parameters studied have an impact ona CQA, then all the DOE batches can be assessed collectively,as noncritical parameters. Hence, only the batches that weremade with the same process conditions (i.e., target batches)are included in the Cpk calculation.
Another component of life cycle management is the uti-lization of continued process cerification (CPV) to proactivelymonitor routine production. The goal of continued processverification is to assure that the manufacturing process con-tinuously remains within a predetermined state of controlduring routine commercial manufacture. Through CPV, un-planned deviations as well as trends in input variables, in-process control (IPC) results, and final product quality aredetected and an assessment made regarding necessary im-provements throughout the life cycle of the product.
A successful CPV program has systems in place whichhave the ability to proactively identify potential issues beforethey become critical. For example, statistically evaluating an-alytical release data which may be within specification buttrending low or increasing in total variability can result inthe avoidance of an ultimate failure if the cause of variabilitycan be discovered and rectified prior to it reaching a signifi-cant magnitude.
Statistical process control techniques and data collec-tion plans may also assist with the evaluation process asto the cause of variability. Statistical analysis of releaseand in-process data coupled with in-depth process knowl-edge obtained through risk assessment and criticality anal-ysis can provide the means of identifying opportunities tooptimize the current process and/or identify areas whereenhanced detection mechanisms are needed to ultimatelyimprove end product quality.
Use of PAT in Supporting Post-approval Changes to IRand MR Products. Quality risk management is a key part ofPAT implementations by identifying potential quality con-cerns and implementing appropriate controls. The combina-tion of risk management and PAT has allowed the ability notonly to identify potential quality concerns but also implementways to improve the likelihood of detection and/or control ofthe product/process. This section discusses PAT applications,how changes can be made to PAT applications, how they canbe added or removed from processes, and how they can beused to support post-approval changes to an IR/MR product.Rather than identifying specific controls required, examplesare provided and quality risk management is used to guide theappropriate requirements for changes.
R&D Requirements for a PAT Application In Orderto Support Post-approval Changes: As part of product andprocess development, PAT methods can be used to sup-port process understanding and facilitate scale-up andcommercial site transfer. This information would be in-cluded in the filing as part of the process justification.The methods used for process understanding or designspace development may not be validated or required forcommercial manufacturing. Existence of these methodsand reference to them in the filing may facilitate usingthe methods again for a site transfer, additional scale-up,or other post-approval changes. It is expected that PATmethods utilized in product/process development may sup-port the post-approval change through inclusion of previ-ous data and greater process understanding.
There are also scenarios where an online or at-line meth-od is developed during development as a surrogate for atraditional high-performance liquid chromatography (HPLC)test . However, due to l imited number of batchesmanufactured during development, the method would requireadditional updates before full commercial implementation. Asdefined by the PAT method maintenance strategy, after theproduct is approved and commercial manufacturing begins,data from commercial batches are used to update the PATmethod and demonstrate its capability to support the commer-cial-scale process as intended. Assuming the defined outcomesare achieved with regard to predefined acceptance criteria,online/in-line might then become the primary commercial testmethod.
It is possible to have an in-process PAT method in-troduced to measure an attribute at an intermediate stepand eliminate the need for the measurement of that attri-bute in the final product. In this case, it is not a directsubstitution but is a way of testing for a product attributeat the appropriate manufacturing step and enables a feed-forward or feedback control loop that could assist withachieving consistent product quality by adjusting the ap-propriate process parameter(s). PAT measurements at in-termediate steps reduce product risk because they allowfor a process control and parameter adjustment to ensurethe final product meets a predefined quality specification.Such a control scheme would also require sufficient com-mercial-scale data prior to full implementation. This mayrequire, similar to what is mentioned above, completion ofmethod development by the development team and meth-od inclusion in the filed documentation.
For the two cases above, predefined acceptance criteriaare needed prior to the filed submission and need to be agreedupon by all accountable organizations or departments. Inaddition, the methods proposed would be developed andvalidated through collaboration between the developmentand commercial organization. The expectation is that thesemethods would be consistent with the sponsor’s validationpolicy. In addition, discussion with the regulatory agency priorto the filed submission is recommended to insure alignment ofexpectations for the method validation, implementation, andmaintenance.
Support of Changes from Previously Filed PAT: PATmethods are integral to continuous improvement and moni-toring of a manufacturing process. It is expected that the PATmethod will itself evolve and require continual improvement.
Development, Scale-Up and Post-approval Control of IR & MR Dosage

As such, the quality system for the PAT method should in-clude a procedure for updating the method with respect toincreasing process understanding through greater process ex-perience which captures variability associated with raw mate-rials and non-product quality-related changes in the process.The requirements for updating the PAT method will varydepending upon the overall significance of the PAT methodto the process control strategy and the assessed impact of thechanges to method robustness. Simplified, the higher the crit-icality of the PAT method to a product CQA, the greater theexpected level of detail for any changes to the PAT method.This criticality is best determined by reviewing established riskassessments. For example, a real-time release method, whichis considered a direct substitute for a traditional laboratoryrelease method, is a high-impact method, and changes to themethod would be expected to capture the performance attri-butes critical to the CQA.
Complementary medium-impact methods (design space-related methods that are not sole indicators of product qual-ity) and low-impact methods (for process understanding anddevelopment) would be expected to demonstrate perfor-mance attributes aligned to the intended use of the method.
Some level of expectation for PATmethod evolution can beset at the development stage of the PAT method based onprocess and method development history. Ultimately, the PATmethodmaintenance strategy needs to be specified as part of themethod’s quality systemdocumentation at the site. A descriptivesummary of themaintenance strategy should be included in fileddocumentation to align expectations for method evolution withagency guidance documents. In limited situations, where sup-ported by a risk assessment, comparability protocols may bespecified in filed documentation. Although, due to the complex-ity of comparability protocols, the preferred approach is toinclude the strategy for anticipated update(s) as part of thedocumented PAT method maintenance.
Post-approval of New PATApplications: The continuousimprovement and monitoring of a manufacturing process islikely to provide the opportunity to implement or improvePAT where it was previously not available or considered.The determination of the regulatory filing category shouldbe based on the level of risk associated with the unit operationor attribute for which PAT is being utilized combined with therequired filing category for associated changes. The followingexamples are provided to demonstrate the different degrees ofrisk and potential regulatory filing requirements.
Case 1 The current blending unit operation for a solid oraldosage form includes blending of ingredients for aset number of revolutions at a set speed. In order toincrease process understanding and gain additionalknowledge about the blending process, NIR mon-itoring is added to the blending process to betterunderstand blend uniformity throughout the unitoperation. There is no change to themanufacturingprocess as the blending unit operation process pa-rameters remain unchanged. The addition of NIReither maintains or reduces the current risk leveland would not require regulatory approval.After gaining sufficient experience/data with NIRmonitoring of the blending step, it is determined
that controlling the completion of blendingthrough NIR rather than a set number of revolu-tions ensures blend uniformity and a reduction inblending time. Therefore, it is desired to changethe control of the blending step to utilize NIR.Additional continuous process verification wouldbe added to ensure no change in the uniformity ofdosage units CQA; therefore, the risk level ismaintained or reduced. As a result of the changeto the manufacturing process, the change wouldrequire regulatory approval (CBE/CBE30).
Case 2 The process of spraying drug substance onto a coretablet is currently monitored using HPLC to deter-mine the end-point prediction of the spray coatingprocess. In addition, assay testing is performed atrelease for the finished product. A NIR method isdeveloped to monitor drug substance growth on thecore tablet, allowing rapid analysis and monitoringfor the completion of spray coating. The level of riskis reduced due to the increased monitoring throughthe coating end point, allowing for a more preciseend point determination. The change to the processcontrol would require regulatory approval (CBE/CBE 30). After sufficient data are obtained usingNIR to determine end point through a PQS-ap-proved continuous process plan, it is desired to useNIR to replace finished product assay testing. Therisk level would be maintained or reduced, and thechange to specifications would require regulatoryapproval through a CBE/CBE30.In most situations, the implementation of PATwill result in either a reduction of risk or main-taining the current level, in which case prior ap-proval (PAS) would not be required. Thisassessment is in line with the current Guidancefor Industry Changes to an Approved NDA orANDA (edition date, April 2004), which states“A change in methods or controls that providesincreased assurance that the drug substance ordrug product will have the characteristics of iden-tity, strength, quality, purity, or potency that itpurports or is represented to possess” be submit-ted as Changes Being Effected (CBE). The datarequirements for the CBE should include submis-sion of the PAT methodology and its validation.In addition, batch data demonstrating that theproduct manufactured with the new or improvedcontrols continues to meet the existing specifica-tions should be provided. The need for stabilitydata should be dependent upon the degree ofchange to the process and the potential thechange has to impact the stability profile of theproduct.
Removal of PAT Based on Practical and Scientific Con-siderations: PAT developed and implemented during productdevelopment stage serves as a key driver (or component) forrationalization of the manufacturing processes, knowledge-based production, and enhanced assurance of product qualityafter product approval (or launch). Following knowledge ac-cumulation during commercial production, PAT may be
Van Buskirk et al.

removed or reduced under certain circumstances based onconsideration of extent of product and process understanding,nature and role of the PAT, complexity of the product andprocess, availability, and life cycle cost of instrumentation. Forinstance, the following scenarios may prompt evaluation ofpossibly removing or replacing (or downsizing) PAT for com-mercial production:
– When statistical process control demonstrates that removalof the PAT does not result in a decrease in process capability.– Change of manufacturing site where PAT transfer may bechallenging due to instrument availability, need for equipmentretrofit, method transfer, and cost.– For products or processes that are controlled using a multi-modal PAT, reduction of modality (e.g., to a single sensor) hasbeen proven to provide sufficient (or equivalent) process con-trol. In general, reduction, replacement, or removal of PAT isfeasible (or can be considered) for a production operation thatis fully under control, anddemonstrates robustness of the manufacturing processes andan understanding of the interplays between the process in-volved and raw material properties, scale, and type of equip-ment, etc.shows consistent correlation between parameters of in-line oronline analytical systems (e.g., NIR) and a non-PAT in-processcontrol (e.g., number of revolution of a blending operation)within its design space.
When removing PAT, caution should be exercised for acomplex manufacturing process and/or drug product, such asmodified-release or amorphous solid dispersions, or wherethe replacement process control is purely empirical in na-ture (e.g., a combination of mixing time and liquid volumefor determining the end point of a wet granulation pro-cess). Risk assessments should be revisited and updated tojustify any reductions, replacements, or removal of PAT.
Use of PAT in Supporting Post-approval Changes to IRand MR Products: The principles for the SUPAC QbD ap-proach are based on product-specific risk assessment of chang-es which may impact approved design spaces within theframework of the approved control strategy to ensure consis-tent product quality and performance. The changes and re-quirements are less prescriptive compared to the SUPAC IR/MR approach, although they require a detailed and docu-mented understanding of the formulation and process with afocus on continuous learning and improvement. These generalprinciples for application of the QbD approach include no re-quirements for regulatory notification for changes within ap-proved design spaces. Under this latter scenario, alldocumentation to support the proposed changes would bemanaged through the PQS and be available for submissionor review when requested. This documentation includes:changes to batch records, risk assessments with technicaljustifications to support process qualification testing, extend-ed dissolution/bioequivalence requirements, stability and con-tinuous verification plans. Use of the proposed QbDapproach incorporating specific PAT in the control strategyis illustrated by several examples in Table I below for com-parison to the traditional SUPAC IR/MR approach. Theexamples are general in nature, but specific scenarios under
the general cases were developed in order to further dem-onstrate the QbD principles.
Table I provides a comparison of the current SUPAC IR/MR requirements and the proposed requirements that resultwhen an IR or MR product has been developed using QbD.Included in the table are the following SUPAC change controlconcepts:
– Types of changes– Risk evaluation– Filing documentation– Manufacturing documentation– Application of compendial release documentation– Stability documentation– Dissolution documentation– In vivo bioequivalence documentation
The following examples provide further detail on theinformation found in Table I.
Example 1 SUPAC IR Level 1—Batch size change <10×biobatch (final blend size)
Current SUPAC Requirements: Annual notification with up-dated batch records, one lot on long-term stability; release viacompendial/application specificationsProposed QbD Approach: No notification if within approvedblending design spaces or uniformity is controlled with in-lineNIR; documentation managed internally through PQS, includ-ing documented risk assessment and justification for stability,extended testing beyond release, and continuous process ver-ification planRationale: No stability requirement since no expected changeto stability indicating CQA; plan to monitor stability indicat-ing CQA (moisture) and content uniformity using NIR (ifapplicable). No additional dissolution testing required basedon risk assessment. Default to SUPAC requirements if noadequate technical justification can be developed, for exam-ple, no stability indicating CQA can be documented in riskassessment
Example 2 SUPAC IR Level 2—Batch size change >10×biobatch (final blend size)
Current SUPAC Requirements: Changes being effected sup-plement with updated batch records; one batch with 3 months’accelerated stability data and one batch on long-term stability;multipoint dissolution profile comparison in the application/compendial medium versus pre-change/reference lotProposed QbD Approach: No notification if within approvedblending design spaces or uniformity is controlled with scale-independent approach such as in-line NIR; documentationmanaged internally through PQS, including documented riskassessment and justification for stability, extended testing be-yond release, and continuous process verification planRationale: No stability requirement since no expected changeto stability indicating CQA; plan to monitor stability indicat-ing CQA (e.g., moisture) and content uniformity using NIR.No additional dissolution testing required above release withapproved clinically relevant dissolution method and specifica-tions or if process remains within the blending design space.Default to SUPAC requirements if no adequate technicaljustification can be developed, for example, no approvedblending design spaces or scale-independent control strategycan be documented in risk assessment
Development, Scale-Up and Post-approval Control of IR & MR Dosage

Example 3 SUPAC IR Level 2—Change in granulationprocess, e.g., change in roller compaction rollpressure set point outside of filed/validatedrange
Current SUPAC Requirements: Changes being effected sup-plement with updated batch records; one batch on long-termstability; multipoint dissolution profile comparison in the ap-plication/compendial medium versus pre-change/reference lotProposed QbD Approach: No notification if within approvedroller compaction design spaces or if ribbon attributes con-trolled within approved in-process controls, for example, usinga validated and approved at-line or online ribbon density PATmeasurement technique, e.g., NIR or GeoPyc; SUPAC docu-mentation managed internally through PQS, including docu-mented risk assessment and justification for stability, extendedtesting beyond release, and continuous process verificationplanRationale: No stability requirement since no expected changeto stability indicating CQAs or technical justification of nostability impact with change in ribbon density within designspace; plan to monitor downstream controls (e.g., tablet hard-ness and weight uniformity) and ribbon density within designspace in addition to the continuous process verification planfor monitoring CQAs. No additional dissolution testing re-quired above release with approved clinically relevant disso-lution method and specifications or if process remains withinthe roller compaction design space. Default to SUPAC re-quirements if no adequate technical justification can be
developed, e.g., outside of approved roller compaction designspaces or no ribbon attribute-based control can be document-ed in risk assessment
Example 4 SUPAC MR Level 2—Change in coatingquantity of rate controlling excipient (ERmembrane coating) between 5% and 10%(w/w) of the tablet mass
Current SUPAC Requirements: Prior approval supplement (allinformation including accelerated stability data) and updatedexecuted batch records; stability for non-narrow therapeuticrange drugs: one batch with 3 months’ accelerated stabilitydata reported in prior approval supplement and long-termstability data of first production batch reported in annualreport; extended-release dissolution requirement: in addi-tion to application compendial release requirements,multipoint dissolution profiles should be obtained in threeother media, for example, in water, 0.1 N HCl, and USPbuffer media at pH 4.5 and 6.8 for the changed drugproduct and the biobatch or marketed batch (unchangeddrug product) using appropriate statistical comparison,e.g., f2 similarityCurrent QbD Approach: No notification if change is withinmembrane quantity design spaces or if quantity is con-trolled within approved in-process controls using a validat-ed and approved at-line or online PAT measurementtechnique, for example, NIR, Raman spectroscopic tech-niques; documentation managed internally through PQS,including documented risk assessment and justification for
Table I. Use of PAT in Supporting Post-approval Changes
Change control element Current SUPAC IR/MR Proposed QbD approach
Change controlmanagement
Highly specified in guidancedocuments for most elements
Follow principles outlined in ICH Q10 for PQS.
Types of changes Highly prescriptive, independentof product sensitivities
Product specific related to changes impacting design spaceand control strategy as outlined in ICH Q8(R2) and ICH Q11
Risk evaluation Highly prescriptive based onlevel 1, 2, and 3 changes
Customized based on principles outlined in ICH Q9 forQRM. Example, assess level of risk such as FMEA toolbased on prior knowledge and science with technical justification.
Filing documentation Highly prescriptive basedon level of change
No filing documentation required for changes within designspace. Changes outside of design space would follow currentregulatory requirements. May need to consider changes toany control strategy element from QRM approach
Manufacturingdocumentation
Specified for most changes Managed through PQS
Application of compendialrelease documentation
Specified for most changes Managed through PQS. May need to consider additional extendedtesting and validation requirements such as continuous processverification based on QRM approach
Stability documentation Highly prescriptive basedon level of change
Customized based on risk assessment and product sensitivities.May need to consider the impact of any change to a controlstrategy element that could impact stability-indicating CQAs
Dissolution documentation Highly prescriptive basedon level of change
Customized based on risk assessment and product performancesensitivities
May need to consider the impact of any change to a controlstrategy element that could impact clinically relevant CQAs
In vivo bioequivalencedocumentation
Highly prescriptive basedon level of change
Customized based on risk assessment and product performancesensitivities. May need to consider the impact of any changeto a control strategy element that could impact clinicallyrelevant CQAs
PAT process analytical technologies, QBD quality by design, CQA critical quality attributes, QRM quality risk management
Van Buskirk et al.

stability, extended testing beyond release, and continuousprocess verification planRationale: No stability requirement since no expected changeto stability indicating CQA or technical justification of nostability impact with changes in coating quantity within theapproved design space; plan to monitor critical coating param-eters and film thickness/quantity within design space in addi-tion to the continuous process verification plan for monitoringCQAs. No additional dissolution testing required above re-lease with approved clinically relevant dissolution method andspecifications or if process remains within the coating quantitydesign space. Default to SUPAC requirements if no adequatetechnical justification can be developed, for example, outsideof approved coating quantity design spaces or insufficientcoating quantity in-process control with clinically relevantdissolution assessment that can be documented in riskassessment
Example 5 SUPAC MR Level 3—Change in site ofmanufacture
Current SUPAC Requirements: Prior approval supplement (allinformation including accelerated stability data) and updatedexecuted batch records; stability with significant body of in-formation not available: three batches with 3 months’ acceler-ated stability data reported in prior approval supplement andlong-term stability data of first three production batches re-ported in annual report; extended-release dissolution require-ment: in addition to application compendial releaserequirements, multipoint dissolution profile for the changeddrug product and the biobatch or marketed batch (unchangeddrug product) using appropriate statistical comparison, e.g., f2similarity. Bioequivalence documentation: a single-dose bio-equivalence study. The bioequivalence study may be waivedin the presence of an established IVIVC.Proposed QbD Approach: Notify via Changes Being EffectedSupplement (CBE-30) with no changes to approved designspaces and control strategy compared to the original approvedsite; documentation managed internally through PQS, includ-ing documented risk assessment and justification for stability,extended testing beyond release, and continuous process ver-ification plan. Emphasis should be on demonstrating equiva-lent quality and performance in the supplement through directconfirmation of design spaces at the new site, with additionalemphasis on demonstrating equivalent in-process controls andattributes from the approved in-process tests using the at-lineor in-line PAT tests (if applicable).Rationale: Consider the change in location of an extended-release coating process to another site. All design spaces wereconfirmed at the new site without changes to the approvedcontrol strategy. From the risk assessment, it was determinedthat there was no stability CQAs for the drug product thatcould be monitored or which could be predicted. Therefore,the first three process qualification lots are put on acceleratedstability and 3-month data included in the supplement. How-ever, it was demonstrated that control of the controlled-re-lease membrane was found to be equivalent via the approvedin-process PAT methods for the controlled-release attribute,film thickness, which was previously shown in development tobe clinically relevant and which correlated with dissolution.Consequently, there were no demonstrated changes to therate-controlling step and, therefore, no bioequivalence study
is required. No additional dissolution testing required aboverelease with approved clinically relevant dissolution methodand specifications or if process remains within all designspaces. The continuous verification plan would monitor CQAsas well as any in-process controls for the rate-controlling step.Default to SUPAC requirements if all design spaces cannot beconfirmed without changes to the approved control strategyfrom the original site.
Improvement in the Control and Characterization of APIs(Analysis and Recommendations Based on Post-approvalChange Guidance Documents)
Evolution of Drug Substance Control Strategy. Before theintroduction of QbD concepts to pharmaceutical manufactur-ing, the approach to quality control was to test the drugsubstance to certain predetermined standards. Product qualitywas assured by ensuring conformance to current goodmanufacturing practices (GMPs) and end product testing. Itneeds to be noted that these principles still remain the corner-stone to the quality standards of today and continue to bevalid.
ICH has developed guidelines that seek to redefine thetraditional approach to ensuring quality by introducing qual-ity-by-design principles. Readers are encouraged to familiar-ize themselves with the principles of ICH Q8, Q9, Q10, andQ11 in order to gain the needed perspective on developmentpractices.
Drug Substance Quality as a Function of DrugProduct. Drug product quality and performance consider-ations are very important to consider in determining theintended quality of drug substance. QTPPs and CQAs ofthe drug product (as defined in ICH Q8) and previousexperience from related products can be helpful in iden-tifying potential CQAs of the drug substance. Quality riskmanagement (QRM; ICH Q9) and knowledge manage-ment (ICH Q10) can be used to facilitate manufacturingprocess development and design of the manufacturingprocess.
Quality by Design: Beginning with the End in Mind…andWorking Backwards. QbD principles ensure quality throughthe entire product life cycle and encompass manufacturingchanges both pre- and post-approval. API processes devel-oped through product and process knowledge can result inwell-defined and understood material attributes, quality attri-butes, process parameters, and control strategies that assureproduct quality throughout the product life cycle.
– Less reliance on end product testing to assure quality– Efficient use of supply chain infrastructure, thereby enhanc-ing one’s ability to expeditiously respond to changes in prod-uct demand– Better innovation and continuous improvement– Opportunities for post-approval regulatory flexibility bydemonstration of product quality within the proposed designspace
The ICHQ11 guidance document (12) describes two differentapproaches to developing a drug substance: “traditional” and
Development, Scale-Up and Post-approval Control of IR & MR Dosage

“enhanced.” A sponsor may choose either approach to drug sub-stance development or a combination of both.
In the “traditional” approach, set points and operatingranges for process parameters are defined and the drug sub-stance control strategy is based on the demonstration of pro-cess reproducibility and testing to meet established acceptancecriteria. NORs and PARs for process parameters may beestablished under the traditional approach by use of univari-ate design/analysis of process attributes.
In the “enhanced” approach, risk management principlesand scientific knowledge are used more extensively to identifyand understand process parameters and unit operations thatimpact the CQAs and develop appropriate control strategiesthat are applicable over the life cycle of the drug substance,which may include the establishment of a “design space.”
Design space is submitted to the FDA as part of themarketing application and subject to approval by the agency.In principle, any movement within the approved design spacedoes not constitute a change and, hence, does not need to bereported to the FDA. Conversely, changes that are outside ofthe approved design space have to be submitted to the FDAfor review and approval before the product is distributed.Regulatory flexibility is realized by ensuring that the processoperates within the design space, as approved in the originalapplication. The QbD approach enunciates six principal stepsin development that should be done in the following order:
– Develop the quality target product profile– Identify critical quality attributes– Perform a risk assessment– Develop design space– Define control strategy– Continuous improvement/life cycle management
A well-understood manufacturing process/product perfor-mance with a robust control strategy and a nimble manufacturingand supply chain infrastructure that can accommodate varyingproduct demand during development through post-approvalwhile at the same time ensuring lean, just-in-time manufacturingare among the desired attributes of a successful product.
Factors Impacting Drug Substance Quality—CPPs andCQAs. A CQA for the drug substance is a physical, chemical,biological, or microbiological property or characteristic thatshould be within an appropriate limit, range, or distribution toensure the desired product quality. Drug substance CQAstypically include attributes that affect the identity, purity, bio-logical activity, and stability. Potential CQAs for the drugsubstance include chemical purity, enantiomeric purity (if ap-plicable), impurities including genotoxic impurities, polymor-phic form, particle size, and other attributes that have a directrelationship to the manufacturability, quality, and perfor-mance of the drug product. The list of CQAs can be modifiedas the knowledge of the drug substance and the manufacturingprocess increase during development
There are many factors that impact the quality of the drugsubstance and hence need to be part of the overall controlstrategy, including but not limited to
– Manufacturing site– Material attributes (e.g., of starting materials, raw materials,reagents, solvents, intermediates, process aids, etc.).
– Manufacturing process including in-process controls andprocess parameters (e.g., route of synthesis, order of additionof reagents, etc.).– Analytical methodologies used in the testing of materials(raw materials, starting materials, intermediates, solvents,etc.) and final drug substance– Drug substance specification (release testing)– Drug substance container-closure system
Assessment of CQAs and Continuum of CriticalityThroughout the API Product Life Cycle: Scientific knowl-edge based on development experience and first principlesand QRM techniques are used to reach a decision on theCPPs and CQAs for a given drug substance manufacturingprocess. In this context, it is important to understand therelationship between risk and criticality of quality attributesand process parameters (10). The criticality of a qualityattribute is primarily based upon the severity of harm anddoes not change as a result of risk management. Criticality ofa process parameter is linked to the parameter’s effect onany critical quality attribute. It is based on the probability ofoccurrence and detectability and therefore can change as aresult of risk management.
The drug substance control strategy can be determinedby either a traditional approach based on material specifica-tions and process parameter ranges or using an enhancedapproach via risk management and scientific knowledge. Theiterative nature of product and process development requiresthat attention is given as early as possible in development, torefine the QTPP, the initial list of potential CQAs, and tomove toward the proposed list of CQAs and establishingacceptance criteria for the critical material attributes. Aneffective control strategy for the drug substance that linkschanges in drug substance attributes to finished productsafety and efficacy ensures that the API manufacturingprocess consistently produces a product that meets thoseQTPP and CQAs throughout its life cycle, as shown inFig. 3 (24).
Design space is typically developed at a small scale andhence has to be supplemented by an effective control strategyto manage the risk after development and implementation.
Development of the design space greatly relies onexisting body of knowledge on the drug substance and itsmanufacturing process. The level of variability present in thehistorical data will influence the ability to develop a designspace, and additional studies should be considered in suchcases. A design space may also be determined per unit oper-ation (e.g., crystallization, reaction, distillation, filtration, etc.)or a combination of selected unit operations. The unit opera-tions included in such a design space should be selected basedon their impact on the drug substance CQAs.
Drug Substance Control Strategy: A control strategy is aplanned set of controls, derived from current product andprocess understanding that assures process performance andproduct quality (9). The control strategy for API can includeany or all of the following:
– Controls on material attributes– Manufacturing process controls including unit operations(order of addition of reagents, rate of addition, temperature,agitation speed, etc.)– In-process controls
Van Buskirk et al.

– Final release testing of the drug substance
The control strategy should ensure that each of the drugsubstance CQAs is within the appropriate range, limit, ordistribution to assure quality of the drug substance that meetsall the performance objectives for the drug product. The drugsubstance specification is only one part of a total controlstrategy.
The control strategy is typically developed during theclinical research stage of development and undergoes fur-ther refinement as further manufacturing experience isgained during clinical development through commerciali-zation. It should be continually evaluated as developmentprogresses and/or when changes are made. The complexityof the process; changes in scale (scale-up or scale-down);differences in the manufacturing process including equip-ment, facilities, sites, etc.; and change in raw materialattributes due to supplier changes, etc., are some impor-tant considerations in ongoing evaluations of the drugsubstance control strategy.
Advancements in Instruments and Methods Used in Control andC h a r a c t e r i z a t i o n o f A c t i v e P h a r m a c e u t i c a lIngredients—PAT. PAT is a system for designing, analyzing,and controlling manufacturing outputs through timely measure-ments (i.e., during processing) of critical quality and perfor-mance attributes of raw and in-process materials and processeswith the goal of ensuring final product quality (25,26). Rapidadvances in PAT tools have brought about paradigm shifts intraditional methods and approaches to ensuring drug substancequality.
The underlying principle behind PAT is the belief thatquality cannot be tested into the products; it should be built-inor should be by design.
Drug Substance Process Understanding: Structured prod-uct and process development on a small scale, using experi-mental design and use of online or in-line instruments tocollect data in real time, can provide increased insight andunderstanding for process development, optimization, scale-up, technology transfer, and control. Process understanding
then continues in the production phase when other variables(e.g., environmental and supplier changes) may possibly beencountered. A manufacturing process is generally consideredwell understood when
– All critical sources of variability are identified andexplained.– The variability is managed by the process controls.– API product quality attributes can be accurately and reli-ably predicted over the design space established for materialsused, process parameters, manufacturing, environmental, andother conditions.
Focus on process understanding can reduce the burdenfor re-validation of systems by providing more options forjustifying and qualifying systems intended to monitor andcontrol the biological, physical, and/or chemical attributes ofmaterials and processes.
Methods and Tools: The last three decades have seensignificant progress with respect to methods and tools forchemical attributes (e.g., identity and purity); however,methods and tools to characterize certain physical andmechanical attributes of pharmaceutical ingredients arenot necessarily well understood. As a consequence, inherent,undetected variability of rawmaterials may bemanifested in thefinal product.
Establishing effective processes for managing physicalattributes of raw and in-process materials requires a funda-mental understanding of attributes that are critical to productquality. Such attributes (e.g., particle size and shape variationswithin a sample) of raw and in-process materials may posesignificant challenges because of inherent complexities relatedto collecting representative samples.
Many pharmaceutical processes are based on time-de-fined end points based on prior experience and knowledgederived from process development. However, differences inmaterial attributes and other process conditions can result invariability in API quality attributes that may not necessarilycorrelate well with the aforementioned time-defined endpoints. Use of PAT tools and principles can provide valuable,
CriticalityAssessment
Continuous Improvement / Lifecycle Management
QTPPPotential Impact
to Safety andQuality?
Non-Critical
Severity
CQAs
Lo
No
High
Low
Low Risk
HighRisk
Fig. 3. Assessment of the impact of API CQAs on product quality
Development, Scale-Up and Post-approval Control of IR & MR Dosage
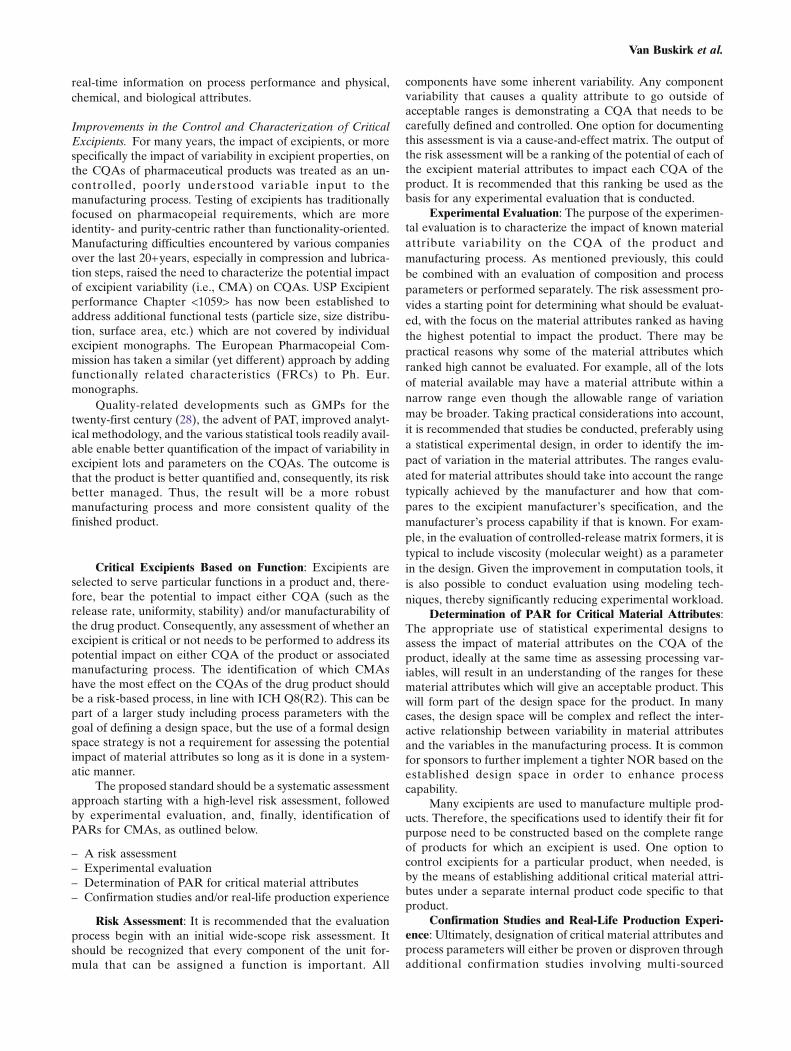
real-time information on process performance and physical,chemical, and biological attributes.
Improvements in the Control and Characterization of CriticalExcipients. For many years, the impact of excipients, or morespecifically the impact of variability in excipient properties, onthe CQAs of pharmaceutical products was treated as an un-controlled, poorly understood variable input to themanufacturing process. Testing of excipients has traditionallyfocused on pharmacopeial requirements, which are moreidentity- and purity-centric rather than functionality-oriented.Manufacturing difficulties encountered by various companiesover the last 20+years, especially in compression and lubrica-tion steps, raised the need to characterize the potential impactof excipient variability (i.e., CMA) on CQAs. USP Excipientperformance Chapter <1059> has now been established toaddress additional functional tests (particle size, size distribu-tion, surface area, etc.) which are not covered by individualexcipient monographs. The European Pharmacopeial Com-mission has taken a similar (yet different) approach by addingfunctionally related characteristics (FRCs) to Ph. Eur.monographs.
Quality-related developments such as GMPs for thetwenty-first century (28), the advent of PAT, improved analyt-ical methodology, and the various statistical tools readily avail-able enable better quantification of the impact of variability inexcipient lots and parameters on the CQAs. The outcome isthat the product is better quantified and, consequently, its riskbetter managed. Thus, the result will be a more robustmanufacturing process and more consistent quality of thefinished product.
Critical Excipients Based on Function: Excipients areselected to serve particular functions in a product and, there-fore, bear the potential to impact either CQA (such as therelease rate, uniformity, stability) and/or manufacturability ofthe drug product. Consequently, any assessment of whether anexcipient is critical or not needs to be performed to address itspotential impact on either CQA of the product or associatedmanufacturing process. The identification of which CMAshave the most effect on the CQAs of the drug product shouldbe a risk-based process, in line with ICH Q8(R2). This can bepart of a larger study including process parameters with thegoal of defining a design space, but the use of a formal designspace strategy is not a requirement for assessing the potentialimpact of material attributes so long as it is done in a system-atic manner.
The proposed standard should be a systematic assessmentapproach starting with a high-level risk assessment, followedby experimental evaluation, and, finally, identification ofPARs for CMAs, as outlined below.
– A risk assessment– Experimental evaluation– Determination of PAR for critical material attributes– Confirmation studies and/or real-life production experience
Risk Assessment: It is recommended that the evaluationprocess begin with an initial wide-scope risk assessment. Itshould be recognized that every component of the unit for-mula that can be assigned a function is important. All
components have some inherent variability. Any componentvariability that causes a quality attribute to go outside ofacceptable ranges is demonstrating a CQA that needs to becarefully defined and controlled. One option for documentingthis assessment is via a cause-and-effect matrix. The output ofthe risk assessment will be a ranking of the potential of each ofthe excipient material attributes to impact each CQA of theproduct. It is recommended that this ranking be used as thebasis for any experimental evaluation that is conducted.
Experimental Evaluation: The purpose of the experimen-tal evaluation is to characterize the impact of known materialattribute variability on the CQA of the product andmanufacturing process. As mentioned previously, this couldbe combined with an evaluation of composition and processparameters or performed separately. The risk assessment pro-vides a starting point for determining what should be evaluat-ed, with the focus on the material attributes ranked as havingthe highest potential to impact the product. There may bepractical reasons why some of the material attributes whichranked high cannot be evaluated. For example, all of the lotsof material available may have a material attribute within anarrow range even though the allowable range of variationmay be broader. Taking practical considerations into account,it is recommended that studies be conducted, preferably usinga statistical experimental design, in order to identify the im-pact of variation in the material attributes. The ranges evalu-ated for material attributes should take into account the rangetypically achieved by the manufacturer and how that com-pares to the excipient manufacturer’s specification, and themanufacturer’s process capability if that is known. For exam-ple, in the evaluation of controlled-release matrix formers, it istypical to include viscosity (molecular weight) as a parameterin the design. Given the improvement in computation tools, itis also possible to conduct evaluation using modeling tech-niques, thereby significantly reducing experimental workload.
Determination of PAR for Critical Material Attributes:The appropriate use of statistical experimental designs toassess the impact of material attributes on the CQA of theproduct, ideally at the same time as assessing processing var-iables, will result in an understanding of the ranges for thesematerial attributes which will give an acceptable product. Thiswill form part of the design space for the product. In manycases, the design space will be complex and reflect the inter-active relationship between variability in material attributesand the variables in the manufacturing process. It is commonfor sponsors to further implement a tighter NOR based on theestablished design space in order to enhance processcapability.
Many excipients are used to manufacture multiple prod-ucts. Therefore, the specifications used to identify their fit forpurpose need to be constructed based on the complete rangeof products for which an excipient is used. One option tocontrol excipients for a particular product, when needed, isby the means of establishing additional critical material attri-butes under a separate internal product code specific to thatproduct.
Confirmation Studies and Real-Life Production Experi-ence: Ultimately, designation of critical material attributes andprocess parameters will either be proven or disproven throughadditional confirmation studies involving multi-sourced
Van Buskirk et al.

excipients. Vendor-to-vendor excipient differences will behighlighted, if any, through excipient qualification studiesand, when warranted, confirmation batches of the drug prod-uct. As routine production commences using more excipientbatches, real-life data can be evaluated to confirm selectedNOR or revised accordingly in the spirit of continued processverification, as outlined in the FDA guidance on processvalidation issued in January 2011 (27,28).
Additional Considerations Other Than Functionality: Al-though excipients are selected based on their intended function-ality, many times, minor impurities associated with excipientsbring unanticipated challenges to a drug product’s long-termperformance. It is common knowledge that peroxides, anhy-drides, and other organic solvents associated with excipientscan interact with the API, forming degradation products, there-by causing stability concerns. These impurities and residualsolvents can be either inherent from the excipient source (i.e.,natural products), formed during the excipient manufacturingprocess, or liberated from the excipient during the drug productmanufacturing process. Regardless, vigilance should be paid tothe evaluation of such excipient impurities or residual solventsas part of stressed manufacturing process studies (e.g., knownsusceptibility at extremes of temperature or force) or stressedstability conditions. If needed, control of the levels of theseimpurities or residual solvents would warrant incoming specifi-cations to assure long-term drug product performance.
Role of IVIVC in the Development and Scale-Up of IR andMR Products
The term in vitro–in vivo correlation (IVIVC) refers tothe establishment of a rational relationship between an in vivoparameter derived from drug plasma concentrations producedby a dosage form (e.g., Cmax or AUC) and an in vitro charac-teristic of the same dosage form (e.g., dissolution) (29). Thequantitative relationship between the in vivo and in vitroproperties is an IVIVC. The most important utilization of anIVIVC is that of predictability of the clinical performance of adosage form based on dissolution data. In some cases, theactual drug plasma concentration profile may be predictedfrom in vitro dissolution data. If prediction cannot be accom-plished, it does not mean that the in vitromethod is necessarilyinvalid. If a relationship cannot be established between thedissolution and bioavailability of a dosage form, an in vitro–-in vivo “relationship” or “association” can still be of greatvalue to a formulation group when the dissolution method ispredictive of in vivo behavior.
Historically, IVIVC analysis has been more successful formodified-release products than for immediate-release dosageforms. This difference in success probably reflects the appli-cation of specific data analysis techniques and interpretationthat require dissolution rate-limited drug absorption and thatthe release of drug from extended-release dosage forms canbe significantly affected by the drug product formulation.Numerous attempts have been made to correlate variousin vivo PK parameters with in vitro dissolution data. Single-point correlations show that increasing or decreasing thein vitro dissolution rate of a modified-release dosage formcan result in a corresponding directional change in thein vivo performance of the product (e.g., Cmax or AUC in-crease with an increase in the dissolution rate). However, such
single-point correlations do not revealmuch information regard-ing the overall plasma concentration–time profile. Thus, corre-lation methods that utilize all available plasma drugconcentration and in vitro data are preferred. There are threecorrelation levels available that utilize dissolution and plasmadata, but there are significant differences in the quality of thecorrelation obtained with each procedure. These methods orcorrelation levels are outlined below in terms of the advantagesof each along with its potential utility as a predictive tool.
Three correlation levels have been defined and catego-rized in descending order of the quality of predictability (29–31). The concept of correlation level is based upon the abilityof the correlation to reflect the entire plasma drug concentra-tion–time curve that will result from administration of thegiven dosage form. It also relates the entire in vitro dissolutioncurve to the entire plasma concentration–time profile; thestrength of this relationship defines its inherent predictability.
Level A Correlation
Level A correlation is the highest category of correlation. Itrepresents a point-to-point relationship between the in vivo inputrate (absorption rate) and in vitro dissolution of the drug. For alevel A correlation, a product’s in vitro dissolution curve is com-pared to its in vivo input curve. This in vivo curve, produced bydeconvolution of the plasma profile, may be accomplished usingmass balance model-dependent techniques, such as the Wagner–Nelson or Loo–Riegelman methods, or by model-independentmathematical deconvolution. Ideally (though not an absoluterequirement), the in vitro and in vivo curves are superimposableor may be made to be superimposed by the use of a constantoffset value of the timescale, and therefore the equations describ-ing each curve are the same. Such a relationship is most oftenfound with those modified-release dosage systems that demon-strate an in vitro release rate that is independent of the dissolutionmedia and stirring speeds employed in a dissolution apparatus.The advantages of a level A correlation are as follows:
– A point-to-point correlation utilizes every plasma level anddissolution point collected at different time intervals and, thus,reflects the complete plasma level curve. With a level A correla-tion, the in vitro dissolution curve may serve as a surrogate forin vivo performance. Therefore, changes in manufacturing site,method of manufacture, raw materials, minor formulation modi-fications, and even product strength using the same formulationcan be justified without the need for additional bioavailability/bioequivalence studies so long as the product’s dissolution profileis unaffected.– The in vitro dissolution method is validated as a qualitycontrol procedure that is meaningful and predictive of a dos-age form’s in vivo performance.– The extremes of the in vitro quality control standards for aproduct (e.g., TPP) can be justified either by convolution(simulating the plasma level profile from the dissolutioncurve) or by a deconvolution procedure (utilizing the upperand lower confidence interval limits).
Level B Correlation
This correlation utilizes the principles of statistical mo-ment analysis. The mean in vitro dissolution time is compared
Development, Scale-Up and Post-approval Control of IR & MR Dosage

to either the mean residence time or the mean in vivo disso-lution time. As with a level A correlation, level B utilizes all ofthe in vitro and in vivo data, but is not a point-to-point corre-lation. It does not correlate the actual in vivo plasma profiles,but rather a parameter that results from statistical momentanalysis of the plasma profile such as mean residence time.Because there are a number of different plasma profiles(shapes) that will produce similar mean residence time values,it is not possible to rely upon a level B correlation alone topredict a plasma profile from in vitro dissolution data. Also,in vitro data from a level B correlation cannot be used tojustify the extremes of a product’s quality control standards.
Level C Correlation
This category relates one dissolution time point (t50%, t90%,etc.) to a single pharmacokinetic parameter such as AUC,Cmax, orTmax. Similar to a level B correlation, a level C correlation repre-sents a single-point correlation and does not reflect the completeshape of the plasma profile which best defines the performance ofmodified-release products. Since this type of correlation is notpredictive of actual in vivo product performance, it is generallyonly useful as a guide in formulation development or as a produc-tion quality control procedure. Because of its obvious limitations, alevel C correlation has limited usefulness in predicting in vivo drugperformance and is subject to the same caveats as a level B corre-lation in its ability to support product and site changes as well asjustification of quality control standard extremes.
Correlation for IR Dosage Forms
Since the mechanisms for release of drug from immedi-ate-release dosage forms are simpler than that for modified-release dosage forms (which are more complex and variable),one might expect that an IVIVC would be easier to developwith IR formulations. However, most of the correlation effortsto date with immediate-release dosage forms have been basedon the correlation level C approach, although there also havebeen efforts employing statistical moment theory (level B).Although it is conceivable that the same level A correlationapproach may be utilized with immediate-release dosageforms, until data have been gathered to support this concept,levels B and C are the best approaches that can be recom-mended with these dosage forms.
General Considerations for Developing IVIVCs
The following concepts were adopted from the FDAIVIVC Guidance (29). General considerations for developingand evaluating a level A in vitro–in vivo correlation include
– Human data should be used for regulatory consideration.– IVIVCs should utilize sufficient subjects (a statisticallypowered sample) to adequately characterize the drug productperformance. Crossover studies are preferred, but appropri-ately powered parallel studies may be acceptable.– It is expected that, in order to develop a correlation be-tween a drug product’s PK and its dissolution, several formu-lations with different release rates may need to be evaluated.These formulations should have at least a 10% difference indissolution rates.
– The IVIVC should be demonstrated consistently, with twoor more formulations with different release rates that result incorresponding differences in absorption profiles. Although anIVIVC can be defined with a minimum of two formulationswith different release rates, three or more formulations withdifferent release rates are recommended in order to establisha more robust relationship.– Predictability of the IVIVC should be assessed. An averageabsolute percent prediction error of 110% or less for Cmax andAUC is preferred.
Use of IVIVC in Post-approval Change Justification
Use of Biowaiver Options in Post-approval Changes forIR and MR Products. The following section on biowaivers iswritten based on the current US FDA guidance(s) and perti-nent CFRs. The Biopharmaceutical Classification System(BCS) and other related guidances are in the process of being(or soon will be) updated; therefore, guidelines to requestbiowaivers may change accordingly in the future.
Regulatory Applications of Biowaivers. In many cases,in vivo bioequivalence studies can be replaced by in vitrodissolution studies in regulatory applications. The applicationcan be based on BCS or IVIVC biowaivers or simply on adissolution profile comparison. Both BCS and IVIVCbiowaivers can be utilized to support post-approval changesin drug product composition, manufacturing site, or produc-tion method.
Approval of new, lower strengths or some minor changesto the drug product can sometimes be applied for and justifiedbased solely on the dissolution profile comparison without theneed for IVIVC or BCS-based biowaivers. In such cases, inorder to assure bioequivalence, the new dose strength or newformulation should have a similar dissolution profile to that ofthe drug formulation already on the market. Examples ofbiowaiver applications are
& Biowaivers for comparative bioavailability studies in sup-port of a New Drug Application
& Biowaivers for comparative bioavailability studies in sup-port of the bioequivalence of subsequent-entry products tothe US market
& Biowaivers for bridging studies where the formulation to bemarketed is different from the formulation used in the piv-otal clinical trials
& Biowaivers for studies in support of significant post-approv-al changes and product line extensions
General Considerations. Waiver of in vivo studies fordifferent strengths of a drug product can be granted underSection 320.22(d)(2) when the following requirements aremeet: (1) the drug product is in the same dosage form, but ina different strength; (2) this different strength is proportionallysimilar in its active and inactive ingredients to the strength ofthe product for which the same manufacturer has conductedan appropriate in vivo study; (3) there is evidence of linearkinetics in the proposed dosing range; and (4) the newstrength meets appropriate in vitro dissolution and similarityf2 tests.
Van Buskirk et al.

The “proportionally similar” requirement is defined inthe following ways:
& All active and inactive ingredients are in exactly the sameproportion between different strengths (e.g., a tablet of 50-mg strength has all the inactive ingredients, exactly half thatof a tablet of 100-mg strength, and twice that of a tablet of25-mg strength).
& Active and inactive ingredients are not in exactly the sameproportion between different strengths as stated above, butthe ratios of inactive ingredients to the total weight of thedosage form are within the limits defined by the SUPAC-IRand SUPAC-MR guidances up to and including level II.
& For drug products, where the amount of the active drugsubstance in the dosage form is relatively low compared tothe excipients, the total weight of the dosage form remainsnearly the same for all strengths (within +10% of the totalweight of the strength on which a bio-study was performed),the same inactive ingredients are used for all strengths, andthe change in any strength is obtained by altering theamount of the active ingredients and one or more of theinactive ingredients. The changes in the inactive ingredientsare within the limits defined by the SUPAC-IR and SUPAC-MR guidances up to and including level II.
& In interpreting the guidance, it is important to note thatcombination products (i.e., bilayer tablets, etc.) are consid-ered to be one formulation even though they consist of twoseparate layers with different formulations. In assessing theproportional similarity of the different strengths, all compo-nents of both layers have to be proportionally similar. Thefact that only one layer is proportionally similar and theother is not clearly indicates that the product (whole tablet)is not proportionally similar. In many instances, there mightbe interactions among the different tablet layers that mightbe different across different strengths due to the differentsizes of the layers and the varying amounts of excipientspresent in each layer.
& Exceptions to the above definitions may be possible, ifadequate justification is provided.
Biowaivers for IR and MR solid oral products can beclassified under three major categories, as described in thefollowing section:
Biowaivers Without n IVIVC. Immediate-Release For-mulations (Capsules, Tablets, and Suspensions): Dissolutionprofiles should be generated for all strengths. If an appropri-ate dissolution method has been established and the dissolu-tion results indicate that the dissolution characteristics of theproduct are not dependent on the pH and product strength,then dissolution profiles in one medium are usually sufficientto support waivers of in vivo testing. Otherwise, dissolutiondata in at least three media (e.g., pH 1.2, 4.5, and 6.8) areneeded. The f2 test should be used to compare profiles fromthe different strengths of the product. An f2 value >50 indi-cates a sufficiently similar dissolution profile such that furtherin vivo studies are not needed. For an f2 value <50, furtherdiscussions with the appropriate review division may helpdetermine whether an in vivo study is needed. The f2 approachis not suitable for rapidly dissolving drug products (e.g., >85%dissolved in 15 min or less).
Biowaivers for Lower-/Higher-Strength Products: Whenseveral strengths of the same dosage form are proportionallysimilar in their active and inactive ingredients, an in vivowaiver can be granted for the lower strength(s) based oncomparability of the dissolution profiles and an acceptablein vivo BA or BE study on the highest strength. Similarly, itis also possible to get a waiver for a higher strength based onthe assessment of (1) clinical safety and/or efficacy data on theproposed dose and the need for the higher strength, (2) line-arity of the pharmacokinetics over the therapeutic dose range,(3) the higher strength is compositionally proportionally sim-ilar to the lower strength,1 and (4) the same dissolution pro-cedures being used for all strengths and similar dissolutionresults are obtained.
Biowaivers for Over-encapsulation of Clinical Trial For-mulations: During the course of drug development, sponsorssometimes have to blind the formulations that they use in theclinical trials. In certain situations, the only difference betweenthe market and clinical trial formulation is that the tablet mixor the tablet itself is put into a capsule. This is done mainly forblinding purposes. It is thus possible to obtain a waiver for thebioequivalence study that links the market and clinical trialformulation provided that no other excipients are added to thecapsule that are known to affect the release of the active drugfrom the capsule. The waiver of this in vivo bioequivalencestudy is granted based on the comparability of the dissolutionprofile in three media: 0.1 N HCl and phosphate bufferspH 4.5 and 6.8.
Biowaivers During Scale-Up and Post-approval Changes:Certain formulation changes in components and composition,scale-up, manufacturing site change, manufacturing process,or equipment changes may be made post-approval. Depend-ing on the possible impact of the manufacturing change on therelease of the active ingredient and its bioavailability fromthat formulation, certain manufacturing changes for IR prod-ucts can be approved solely based on comparability of thedissolution profiles between the post-change and pre-changeformulations. Information on biowaivers (and the require-ments of in vitro dissolution and in vivo BE studies) forimmediate-release drug products is provided in the FDA’sSUPAC IR Guidance for Industry: Immediate-Release SolidOral Dosage Forms: Scale-Up and Post-approval Changes:Chemistry, Manufacturing, and Controls, In Vitro DissolutionTesting, and In Vivo Bioequivalence Documentation (31).
Biowaivers for Modified-Release Formulations: Informa-tion on alternative methods to demonstrate bioequivalencefor modified-release drug products approved in the presenceof specified post-approval changes is provided in an FDAguidance for industry entitled SUPAC-MR: Modified-ReleaseSolid Oral Dosage Forms: Scale-Up and Post-approvalChanges: Chemistry, Manufacturing, and Controls, In VitroDissolution Testing, and In Vivo Bioequivalence Documenta-tion (32). The same principles described in the guidance maybe applied to pre- and post-approval changes.
Beaded Capsules: Lower/Higher Strength: For extended-release beaded capsules where the strength differs only in the
1 If the formulations of all the strengths are not compositionallyproportional, a biowaiver can be granted for the middle strengthsbased on acceptable BA or BE data for both the highest and thelowest strengths in the in vitro multimedia comparative dissolutionprofiles and f2 data.
Development, Scale-Up and Post-approval Control of IR & MR Dosage

number of beads containing the active moiety, a single-dose,fasting PK or BE study, as appropriate, should be carried outon the highest strength, with a request for a waiver of thein vivo studies for the lower strengths based on comparativedissolution profiles. The dissolution profile for each strengthshould be generated using the recommended dissolutionmethod. If the dissolution method has not been finalized, thendissolution profiles should be generated in at least three media(e.g., pH 1.2, 4.5, and 6.8). In vivo BE studies for higherstrengths may not be necessary based on (1) clinical safetyand/or efficacy data on the proposed dose and the need for thehigher strength, (2) linearity of pharmacokinetics over thetherapeutic dose range, and (3) the same dissolution proce-dures being used for all strengths and similar dissolution re-sults obtained. The f2 test can be used to compare profiles forthe different strengths of the product. An f2 value of >50 canbe used to confirm that further in vivo studies are not needed.
ER Tablets—Lower Strength: For extended-release tab-lets, when the drug product is in the same dosage form but in adifferent strength and when (1) drug exhibits linear PK, (2)the various strengths are proportionally similar in its activeand inactive ingredients,2 and (3) has the same drug releasemechanism, an in vivo BA or BE determination of one ormore lower strengths can be demonstrated based on dissolu-tion profile comparisons, with an in vivo BA or BE study onlyon the highest strength. The dissolution profile for eachstrength should be generated using the recommended disso-lution method. If the dissolution method has not been final-ized, then dissolution profiles should be generated in at leastthree media (e.g., pH 1.2, 4.5, and 6.8). The dissolution profileshould be generated on the test and reference products of allstrengths using the same dissolution test conditions.
Biowaivers Based on IVIVC. With a predictive IVIVC,in vitro dissolution would not only be a tool to assure theconsistent performance of the formulation from lot to lot butwould also become a surrogate for the in vivo performance ofthe drug product. The ability to predict the plasma concentra-tion time profile from in vitro data will reduce the number ofstudies required to approve and maintain a drug product onthe market, therefore reducing the regulatory burden on thepharmaceutical industry.
Once an IVIVC has been established, it is possible towaive the requirements for bioavailability/bioequivalencestudies. For example, a biowaiver can be granted for pre-and post-approval level 3 manufacturing and process changes,approval of lower strengths, or level 3 formulation changeswith complete removal or replacement of excipients (bothnon-release and release-controlling excipients).
If the IVIVC is developed with the highest strength,waivers for changes made with the lowest strengths are possi-ble if these strengths are compositionally proportional orqualitatively the same, the in vitro dissolution profiles aresimilar, and all the strengths have the same releasemechanism.
An IVIVC cannot be used to gain the approval of (a) anew formulation with a different release mechanism, (b) adosage strength higher or lower than the doses that have beenshown to be safe and effective in the clinical trials, (c) anothersponsor’s oral controlled-release product even with the samerelease mechanism, and (d) a formulation change involving anexcipient that will significantly affect drug absorption.
For modified-release formulations, it is possible to obtainin vivo bioavailability/bioequivalence waivers based onin vitro dissolution for changes in formulations that usuallyrequire an in vivo study. The regulatory criteria for grantingbiowaivers are outlined in the previously cited FDA guidanceon this topic. Basically, the mean predicted Cmax and AUCfrom the respective in vitro dissolution profiles should differfrom each other by more than 20%.
For information on IVIVC waivers, refer to the FDAGuidance for Industry: Extended-Release Oral DosageForms: Development, Evaluation, and Application of InVitro/In Vivo Correlations (33).
Biowaivers Based on the Biopharmaceutical ClassificationSystem. The BCS is a scientific framework for classifying drugsubstances based on two fundamental properties of a drugsubstance, i.e., its aqueous solubility and intestinal permeabil-ity. A drug substance can have either a high or low aqueoussolubility as well as either a high or low intestinal permeability.In addition, the BCS also takes into account the drug productdissolution which can be either rapid or slow. Thus, the BCStakes into account three major factors that govern the rate andextent of drug absorption from IR solid oral dosage forms:dissolution, solubility, and intestinal permeability (includinggastric stability).
In the USA, a BCS-based biowaiver is limited only toclass 1 (high solubility–high permeability) drug substances. ABCS biowaiver is acceptable for BCS class I drugs formulatedas rapidly dissolving immediate-release products. In that case,the application may be based on in vitro dissolution andpermeability data together with scientific justification of linearpharmacokinetics, a proof that the drug does not have anarrow therapeutic index and that the excipients do not havepharmacokinetic interactions with the drug.
BCS-based biowaivers are meant to reduce the need forestablishing in vivo bioavailability/bioequivalence in situationswhere in vitro data may be considered to provide a reasonableestimate of the in vivo performance of the immediate-releasesolid oral pharmaceutical drug products. For information onBCS waivers, refer to the FDA Guidance for Industry: Waiverof In Vivo Bioavailability and Bioequivalence Studies forImmediate-Release Solid Oral Dosage Forms Based on aBiopharmaceutics Classification System.
The approach outlined in the BCS guidance can be usedto justify biowaivers for highly soluble and highly permeabledrug substances (i.e., class 1) in IR solid oral dosage forms thatexhibit rapid in vitro dissolution using the recommended testmethods (21 CFR 320.22(e)). A drug substance is consideredhighly soluble when the highest dose strength is soluble in250 mL or less of aqueous media over the pH range of 1–7.5. In the absence of evidence suggesting instability in thegastrointestinal tract, a drug substance is considered to behighly permeable when the extent of absorption in humans is
2 If the formulations of all the strengths are not compositionallyproportional, a biowaiver can be granted for the middle strength(s)based on acceptable BA or BE data as appropriate, for both thehighest and the lowest strengths, and the in vitro multimedia disso-lution comparison profiles and f2 data.
Van Buskirk et al.

determined to be 90% or more of an administered dose basedon a mass balance determination or in comparison to anintravenous reference dose. Alternatively, nonhuman systemscapable of predicting the extent of drug absorption in humanscan be used (e.g., in vitro epithelial cell culture methods). Inthe BCS guidance, an IR drug product is considered rapidlydissolving when no less than 85% of the labeled amount of thedrug substance dissolves within 30 min, using USPApparatus Iat 100 rpm (or Apparatus II at 50 rpm) in a volume of 900 mLor less in each of the following media: (1) 0.1 N HCl orsimulated gastric fluid USP without enzymes; (2) a pH 4.5buffer; and (3) a pH 6.8 buffer or simulated intestinal fluidUSP without enzymes.
Examples of cases where this guidance applies are
& Biowaivers for comparative bioavailability studies in sup-port of New Drug Application
& Biowaivers for comparative bioavailability studies in sup-port of the bioequivalence of subsequent-entry products tothe US market
& Biowaivers for bridging studies where the formulation to bemarketed is different from the formulation used in the piv-otal clinical trials
& Biowaivers for studies in support of significant post-approv-al changes and product line extensions
In all these cases, samples should be collected at asufficient number of intervals to characterize the dissolu-tion profile of the drug product (e.g., 10, 15, 20, and30 min). When comparing the test and reference products,dissolution profiles should be compared using a similarityfactor (f2). Two dissolution profiles are considered similarwhen the f2 value is ≥50. However, when both test andreference products dissolve 85% or more of the labelamount of the drug in <15 min using all three dissolutionmedia recommended above, the profile comparison withan f2 test is unnecessary.
Improvements in the Control of Product Scale-Upand Validation
Introduction
Process validation was often achieved by the statisticallyunsound practice of demonstrating that three batches could bemade, within specifications, at commercial scale and at thecommercial manufacturing site. This may or may not havebeen preceded by a trial batch to demonstrate the ability toscale-up.
Current regulatory authority and industry expectations,however, are for an approach which integrates scale-up andvalidation with product development and process understand-ing. This is aligned with the risk-based development and QbDapproaches discussed in previous sections of this publication.This can be envisioned as a two-step process. First, use ascientific, statistics-based system to characterize materials, for-mulations, and processes and the factors which influence thepotential of a product to meet CQAs during development;second, connect and utilize this information in the scale-upand validation process.
The concept of integrating development and validationactivities is addressed in the EMEA Guidance Document onProcess Validation, made effective in September 2001 andbrought more up to date with the FDA Guidance document“Process Validation, General Principles and Practices,” issuedin January 2011 (34). This document highlights the continuumfrom development to commercialization and how knowledgegained throughout this process should be used to ensure thatthe product continues to have the desired CQAs.
Integration with the Development Program
The scale-up of the drug product manufacturing processneeds to be aligned with the rest of the development program.The mandatory requirement is that scale-up and validation becompleted prior to commercialization, but in practice, aspectssuch as meeting the requirements to supply product for thepivotal clinical program often move the manufacturing pro-cess scale-up much earlier in the project timeline.
If the intention is to perform pivotal clinical studies withthe to-be-marketed product, then this can provide an anchorpoint for the scale-up activities around which the rest of theprogram can be constructed.
There are many good reasons to move scale-up prior tothe pivotal studies. It will often make the development pro-gram simpler and remove the need for a BE study to link theclinical and commercial formulations; it will also enable thescientists to gain more knowledge of the commercial processthan if scale-up were performed at the end of the developmentprocess (and provides more time to address any issues identi-fied) and will provide material for pivotal stability studies.
The negative aspects include, in many cases, the scale-upactivity being performed in parallel with the phase 2 clinicalprogram, where projects have the highest probability of ter-mination. In addition, other aspects, such as development ofthe API, may need to be moved forward and the range ofdoses included in the scale-up program may be wider thanthose eventually commercialized.
Scale-Up
For most drug products, practical reasons dictate that themajority of studies to obtain knowledge about how materialattributes and process parameters impact the CQAs of thedrug product will be performed at a scale significantly smallerthan commercial. However, conclusions relating to acceptableranges for process parameters and material attributes need tobe drawn from these studies. Importantly, the impact of ma-terial attribute differences that may result from multiple sup-pliers needs to be assessed. The impact of scale on acceptableranges will be specific for each attribute or parameter andneeds to be thought through using a combination of acquiredproduct-specific knowledge and information on the operatingprinciples of the equipment.
In order to better address the impact of changes in scale,it is strongly recommended that companies integrate their lab-, pilot-, and production-scale equipment around specific oper-ating principles as much as possible. For example, if the pro-duction facility has top-drive granulators, then use similar, butsmaller, top-drive granulators in development. Similarly, if theproduction facility has bin blenders, then use smaller, but
Development, Scale-Up and Post-approval Control of IR & MR Dosage

equivalent, blenders in development. Introducing a change inequipment type at the transfer to production scale adds anunnecessary level of variability.
The scale-up process should be risk-based and begin with abaseline of product knowledge acquired from prior stages of thedevelopment program. It should also begin with the final com-mercial process in mind—including an estimated commercialscale of manufacture and probable manufacturing site. Potentialsuppliers of each of the excipients should be identified, with anydifferences in physical or quality characteristics (e.g., grade,density, particle size, crystal habit) fully evaluated in any assess-ments of risk, and API representative of that which will be usedcommercially should be available. If the API development pro-cess is not at a stage where API is representative of commercial,then thematerial available for the scale-up activities will becomethe target for the commercial process. Whether this is a reason-able risk to take depends on the specific API and drug product.
The general pattern that the scale-up activities will followshould be known prior to conducting the risk assessment. Themost typical approach is to perform blocks of studies wherethe number of experiments and ranges evaluated decrease asthe scale increases. Therefore, following a risk assessment, theoutput will be assessed to determine what can meaningfully beevaluated at a small scale. A large number of lab-scale batchesare typically conducted as a series of statistical experimentaldesigns whereby the ranges for parameters are wider thananticipated at commercial scale. If many parameters are beingevaluated, these may be simple, two-level screening-type de-signs. The knowledge obtained on the design space from thelab-scale studies then provides a foundation for a smallernumber of batches at a larger (pilot) scale, with fewer param-eters and attributes being evaluated and those that are evalu-ated having narrower ranges. Parameters found not to becritical at lab scale may not be evaluated at pilot or commer-cial scale. Statistical designs at pilot scale are typically morepowerful, enabling a more detailed assessment of the designspace to be obtained. Simple designs are adequate to screenand select variables, whereas more powerful designs allow theoptimization of these same variables.
The assessment of the data from the pilot-scale studiescould include a comparison with the data from lab-scale stud-ies to characterize the impact of scale. There are severalpotential benefits of this. The most obvious one would bethe opportunity to use lab- or pilot-scale experiments, ratherthan commercial scale, to assess the impact of desired changesto a commercial process.
After an assessment of the data from these pilot-scale stud-ies, the plans for process evaluation at commercial scale areprepared, with fewer parameters being evaluated and narrowerranges than pilot scale. In most cases, limitations such as APIavailability and cost will restrict evaluations at this scale to a verysmall number of batches, which may be made at extremes (e.g.,corner points of the design space) of the ranges for commercialmanufacture. The number of batches possible is unlikely to belarge enough for a statistical experimental design. The parametersevaluated should include any parameter thought to be difficult toassess at a scale smaller than commercial.
A clear understanding of how a process changes with scaleis critical to being able to conduct the risk assessments anddetermine which parameters to evaluate at each scale. In some
cases, e.g., milling, a result obtained as the acceptable range for aparameter at lab scale may be directly transferable to commer-cial scale, whereas in others, e.g., granulation, the impact of scaleis more complex, and although small-scale studies may show theextent to which a process is robust, direct conclusions regardingprocess parameters such as impeller speeds are not usuallypossible. For this reason, continuous unit operations such asdry granulation are gaining in popularity since scale-up is facil-itated by the transferability of small-scale data.
Potential interactions between parameters or parametersand material attributes must also be taken into consideration.An example of this which is easy to visualize is the interactionbetween duration and capacity or duration and material densityfor a blending process. An experimental design that includesassessment of the interactions between both parameters andmaterial attributes can often uncover important interactions.
Throughout the scale-up process, extensive monitoring ofthe batches should be performed. This will be process-depen-dent, but could include blend uniformity testing at multipleblending times, extensive stratified sampling for uniformityduring compression or encapsulation, or monitoring of pro-cesses in real time using PAT techniques. The focus should beon areas considered to be high potential risks to successfulcommercial manufacture. This will add to the body of processknowledge available.
Validation
The FDAGuidance document “Process Validation—GeneralPrinciples and Practices” (34) introduced the concept of threestages of validation with an emphasis on acquiring and using pro-cess knowledge in each successive step. The three stages are
Stage 1 Process Design: The commercial manufacturingprocess is defined during this stage based onknowledge gained through development andscale-up activities.The development and scale-up activities de-scribed in earlier sections of this whitepaper ad-dress stage 1 requirements.
Stage 2 Process Qualification: During this stage, the pro-cess design is evaluated to determine whether theprocess is capable of reproducible commercialmanufacturing.This is the section which most closely parallels theconcept of making three consecutive successfulbatches at commercial scale. The FDA guidancedocument (35) refers to the verification that productscan be successfully manufactured at commercialscale as Process PerformanceQualification andman-dates that the decision to begin commercial distribu-tion of a product must be supported by data fromcommercial-scale batches. The commercial-scalebatches included in the scale-up of themanufacturingprocess could provide the basis for this section, butthe number of batches needed should be specific forthe product and process and additional batches maybe required to verify ranges for example.
Stage 3 Continued Process Verification: Ongoing assur-ance is gained during routine production thatthe process remains in a state of control.
Van Buskirk et al.
The third stage of validation relates to data col-lection during routine production to continuous-ly monitor the process. The data should becollected and statistically analyzed to look fortrends. This database also facilitates problemsolving and simplifies trouble shooting. Manycompanies were routinely doing this prior to theFDA Guidance document in order to determineprocess capability, anticipate potential problems,and provide a database which could be statisti-cally mined in the event of any process trouble-shooting being needed.
Improvements in Finished Product Testing
Real-Time Testing Approaches
The aim of QbD is to make more effective use of inno-vative science, technology, and engineering principles in orderto obtain and maintain process knowledge throughout the lifecycle of a product (25).
This knowledge provides the potential for regulatory re-lief that can be realized starting from initial product approval(i.e., through replacement of batch end product testing withRTRT) as well as continued relief throughout the product’slife cycle (i.e., through flexible introduction of post-approvalchanges without prior approval). Identification of CPPscoupled with a robust control strategy designed to assureadherence of the design space to its predetermined rangesinvolves close to real-time process assessment to ensure thatthe process is operating in conditions to deliver predeterminedend product quality, thereby reducing the need, and moreimportantly the value, of end product testing. Release basedon manufacture and control within the design space alone,however, is not sufficient to assure quality of the drug productduring the manufacturing process. In order to support RTRT,appropriate surrogates for affected CQAs as a function ofquantified in-process parameters and/or material attributesneed to be established and included in release specifications(25).
Improvements in Post-approval Testing Schemes
Critical parameters identified and monitored at pertinentjunctures of the process as part of a control strategy allow for ashift in the focus of quality assessment from end producttesting to the testing of surrogate process steps, parameters,and inputs further upstream that have been demonstrated tobe directly linked with product performance. As previouslymentioned, correlation of a CPP with its specific CQA isessential when establishing impact and mitigating risk to DPquality. Once this correlation is determined, optimization ex-periments can be done to deepen the understanding of therelationship to the point where correlation evolves into cau-sation and, ultimately, prediction of a response with certainfactor conditions is possible. Causal relationships betweenparameters and quality attributes allow for surrogate substi-tution of release testing with parameter values further up-stream of the process . When str iv ing for RTRT,quantification of the release data needs to be replaced with
quantification of another parameter/value. For example, tra-ditional dissolution release testing could be replaced by disin-tegration time determination, if sufficient knowledge isattained and correlation established.
Incoming raw material specifications can be valuable incorrelating with final drug product quality attributes. This isespecially true when functional excipients are considered. Theeffect main excipients have on DP quality should be assessedduring product development. It is here that the theoreticalimpact and potential for affect are investigated and demon-stration of actual impact determined. This is important be-cause the attributes of the excipient should not beconsidered alone (i.e., magnesium stearate can affect dissolu-tion). Rather, the technology platform (i.e., dry blend versuswet granulation) should be considered along with the drugsubstance characteristics, level of excipient in the composition,as well as drug load. The collection of physical and chemicaleffects allow for a robust understanding of material character-istics that do indeed affect ultimate quality. Once established,quantification of the excipient’s specific attribute causing theresponse can be established. For example, the particle sizedistribution of a disintegrant may be critical for one drugproduct due to a relatively high quantity present in the for-mulation or particle size distribution variability which affectsthe way in which the excipient behaves during processing.Raw material controls represent one of the earliest interven-tion and control capabilities in a process.
In-process controls are samples taken at various time pointsin any unit operation. They are designed to test for a specificattribute of the current operating step. For example, loss ondrying (LOD) is a traditional method of establishing how muchwater is present in a wet granulation and is used to determinethe end point of drying processes. As LOD sampling is knownfor its inherent variability based on procedure, operator, andexperience, it highlights that IPCs are only as valuable as theaccuracy of the information they assess. Generally, IPCs aredesigned to evaluate the current unit operation quality. Whenstriving for RTRT, one must consider how a specific IPC affectsnot only the current unit operation but the ultimate drug prod-uct as well. For example, disintegration time (DT) is commonlyused in pharmaceutical compression operations to assess hard-ness characteristics and the likelihood a tablet will dissolvewithin an appropriate time frame in order to support targetdissolution profiles. If it is possible to understand the relation-ship between DT and dissolution, demonstration can be per-formed that if the DT specification is met then the resultantdissolution will be acceptable; one can propose that controltablet DT is adequate for assuring acceptable drug release.
As discussed in the previous section, there are manyexamples of PAT tools used to enhance process knowledgeduring pharmaceutical development and production. Howev-er, when these tools are desired for use as elements of acontrol strategy, selection of a particular technology as wellas appropriate placement of probes at relevant operation stepsare decisions that should be made with consideration given toa specific product/process. RTRT strategy involving PATshould be individualized based on adequate level of control,assessment potential with specific CQA for which the technol-ogy is a surrogate, and quantification potential that will re-place the traditional end product test to demonstrateacceptable process progression and ultimate product quality.
Development, Scale-Up and Post-approval Control of IR & MR Dosage

PAT affords innovative methods for retrieving dynamicprocess data in real time or close to real time. Ideally, whendeveloping a control strategy that involves PAT tools, align-ment with critical process parameters as it relates to the directoutput of a specific unit operation as well as relation to finalproduct quality should be attained. In short, DoEs establishthe correlation between a process parameter and specificquality attributes, and PAT provides the means of detectionand/or control of the parameter assuring acceptable qualityoutput. Positioning of PAT tools in-line, at-line, or off-line canalso be assessed for their potential in identifying, explaining,and/or managing process variability. For example, PAT toolssuch as NIR or Raman can be used during hot melt extrusionfor assessing polymer layer thickness in multi-polymer systemsand the crystal form of the drug (36). When placed online, thedata collected can be used for process adjustment upstream(via a feedback loops) or downstream (via feed-forwardloops) based upon process knowledge of how the parameterand related output affect the final product quality.
Developing Improvements that Hold Future Promise
Batch Versus Continuous Processing
Background. Pharmaceutical production can be brokeninto two possibilities: batch and continuous. Traditionally,pharmaceutical production is batch-oriented. True continuousprocessing is just being developed to current regulatory stan-dards and is still relatively unknown in pharmaceutical pro-duction. Adoption of continuous processing is challenged bytraditional production facilities, operational processes, andequipment, but offers a mechanism for rationalizing manycurrent regulatory concepts.
Current pharmaceutical technology is grounded in batchproduction processes. Fixed amounts of materials are addedto large blending equipment and mixed as a batch prior to thenext processing step. Production continues in this manner,with the entire batch completing each process step prior tocontinuing to the next operation. This method generally re-quires relatively large equipment, large operational facilities,and some risk that any deviation will introduce quality issuesto the entire batch.
While current pharmaceutical production is considered abatch process, common production trains are often a mix ofbatch and semi-continuous operations. Blenders, mixers, andfluid bed dryers are generally designed to contain the entireproduct lot and are obviously batch operations. Units such asmills, extruders, tablet presses, and fillers can be viewed ascontinuous or semi-continuous. Testing is commonly per-formed over the entire batch, as is QA review and release.Quality issues at any part of the batch may result in the entirebatch being rejected.
With continuous processing, material is constantly addedand removed from the process train. Multiple activities (e.g.,dry blending, wetting, granulation, extrusion) can occur simul-taneously inside a single piece of equipment. Individual con-tinuous processing equipment generally has a smallerfootprint than its batch equivalent and only contains a smallfraction of the product “batch” at any given time. Batch sizecan be flexible and is based on the throughput rate and runtime. With appropriate in-line testing, the process will stop if/
when the product goes outside of the desired quality param-eters, limiting potential loss. Consequently, continuous pro-cessing is being explored today by some pharmaceuticalcompanies and research institutions.
Batch Size. The Food and Drug Administration21CFR210.3 defines a lot as a batch, or a specific identifiedportion of a batch, having uniform character and quality withinspecified limits, or, in the case of a drug product produced bycontinuous process, it is a specific identified amount produced ina unit of time or quantity in a manner that assures its havinguniform character and quality within specified limits (37).
Continuous processing equipment matches the raw mate-rial input with the processed product’s output. The unit willgenerate material at a controlled rate until the raw materialsare exhausted or the process is stopped. Batch size is thereforevariable and must be established by the manufacturer. Batchsize is important in controlling potential liability (e.g., productrecalls) and identifying the extent of release and stabilitytesting required. Limiting a continuous process to a time range(e.g., 5 h or 5 days), introduction of new lots of raw materials(e.g., “batch” defined as the amount of product producedprior to a lot change in any raw material), or desired output(e.g., 500 kg) are all possible definitions that could be appliedby a manufacturer.
Processors. Throughput with continuous systems is con-trolled by the equipment size and processing speed. Continu-ous processing has often meant large-scale equipment capableof producing metric tons of material a month. Recently, phar-maceutical equipment manufacturers have begun producinglaboratory- or pilot-scale units for use in development andshort-run production areas where flexibility is the desiredgoal. This equipment is often designed with quick-changeproduct contact parts, allowing rapid production shifts. Small-er equipment also means the same units used for developmentmay be adaptable to short-run production, thus eliminatingscaling differences. These smaller units also allow more rapidprototyping with less material, reducing the cost and time ofdeveloping a design space.
Feeders. Maintaining appropriate control of raw materialinputs is critical for continuous processing. An imbalance inmaterial entering the unit will cause variation in processingconditions and output, potentially changing production unifor-mity. Feed rate control is usually accomplished by the use ofhighly accurate loss-in-weight feeders. Modern feeders can feedas little as 20 g/h and can operate with software capable ofcompensating for material powder flow issues inside the hopper.
Process Analytical Technology. PAT is critical to pharma-ceutical continuous processing. Due to the need to modulatethe process, in-line and real-time product testing with feed-back loops to the controller is essential. PAT can also be usedat other points in the process, with the potential to drasticallyreduce throughput times. For example, PAT tools such asnear-IR could be applied to the raw material hoppers toprovide within-drum and across-lot test data. This could beexpanded to allow for online raw material release, eliminatingor drastically reducing the wait time for chemical testing. PAT
Van Buskirk et al.

also increases the need for full electronic batch records tocollate the sensor data streams and maintain correlation withprocessing parameters. The value of PAT application alongthe continuous process stream is obvious, monitoring productquality to meet the needs of continuous validation.
Quality by Design. QbD is an integral component ofcontinuous processing, as is design of experiments. Continu-ous equipment allows for the effects of changes to processingspeeds and materials to be rapidly assessed. Building thedesign space with continuous processing is more rapid due tothe ability to change parameters and produce product more orless on the fly while consuming smaller amounts of material.With the low material holdup in most continuous systems,parameter or material changes can often be evaluated in amatter of minutes using minimal amounts of material. Thisstatement will also be true of production systems, although thequantity of materials will increase with larger units.
Scale-Up. When appropriate-sized equipment is used inthe developmental trials, process scale-up with continuoussystems can be as simplistic as just running the unit forlonger periods of time. This makes all of the design spacedata directly applicable to production operations with noneed for extrapolations of the effects of larger equipmentor different operating conditions. If larger equipment isnecessary, more detailed validation can still be accomplishedwith less wasted material than under batch conditions.
Production. Production with continuous processing willresemble scale-up, with a further run time extension. All priordata are directly relevant and meaningful to the productionoperation. Changes to API or excipient can be evaluateddirectly on the production unit, but with significantly reducedrisk compared to full-scale batch operations.
Continuous equipment can allow highly flexible operationswith significantly reduced manufacturing floor space. Thisequipment will be much more automated than existing batchsystems and could operate in near “lights out” conditions. Ap-propriate PAT development to allow in-line rawmaterial testingand release would allow just-in-time raw material deliverieswithout the need to wait for QC testing. PATapplied to finishedproduct coupled with complete electronic batch record informa-tion and automated data review could allow for real-time onlinerelease, reducing or eliminating the need for manual batchrecord review and release. With processors designed for rapidchangeover, it is conceivable to operate in a lean environmentand produce product to meet current consumer demand ratherthan to a predefined market forecast.
Systems. Vendors are beginning to produce systems ca-pable of meeting the demands of continuous processing sys-tems. Turnkey systems can be purchased for wet granulationand direct compression tablets, including operations throughcompression and coating. Equipment for semi-solids and someliquids have been developed, although usually as unique one-up systems. Computer systems capable of handling the widerdata streams generated by modern PAT units, equipmentinputs, and processing system control are more available andless expensive. These systems are capable of delivering the
concept of continuous process validation. As PAT, comput-ing systems, and production equipment improve, the poten-tial for continuous processing equipment will expand.
Issues Affecting Implementation. While significant efforthas been put into the development of continuous process-ing, commercial implementation is still limited. Gainingacceptance of PAT and full electronic batch recordimplementations has been challenging and is critical forthe implementation of continuous systems. Some applica-tions, e.g., lyophilization, are not normally applied in acontinuous manner and present special equipment chal-lenges. Existing capacity in batch facilities and equipmentsuggests that the cost of changeover to continuous systemsis relatively high, resulting in pushback from currentstakeholders. The lack of availability of these systems indevelopmental laboratories also reduces the likelihood ofrapid implementation. The pharmaceutical industry is stillwaiting on the advent of breakthrough product or two tobring continuous processing to the forefront.
Glossary of Scientific Terms Used in This Whitepaper
ANDA Abbreviated new drug applicationAPI Active pharmaceutical ingredientAPR Annual product reviewBA BioavailabilityBACPAC Bulk active compound post-approval changesBCS Biopharmaceutics Classification SystemBE BioequivalenceCANDA Computer-aided NDACBE Changes being effectedCMA Critical manufacturing attributeCMC Chemistry, manufacturing and controlCMDh Coordination Group for Mutual Recognition &
Decentralized Procedures—Human (CanadianMinistry of Health)
CPP Critical process parameterCPV Continued process verificationCQA Critical quality attributeDoE Design of experimentsDS Design spaceDT Disintegration timeEC European CommissionEMEA European Medicines AgencyFDA Food & Drug AdministrationFMEA Failure mode effect analysisFRC Functionally related characteristicsHMI Human–machine interfaceHPLC High-performance liquid chromatographyICH International Conference on HarmonizationIPC In-process controlIR Immediate releaseIVIVC In vitro–in vivo correlationLOD Loss on dryingMAPP Manual of Policies & Procedures (FDA)MR Modified release or extended releaseMSPC Multivariate statistical process controlMVDA Multivariate data analysis
Development, Scale-Up and Post-approval Control of IR & MR Dosage

NDA New drug applicationNIR Near-infraredNOC Notice of change (Canadian Ministry of Health)NOR Normal operating rangeOFAT One factor at a timePAR Proven acceptable rangesPAS Prior approval supplementPAT Process analytical technologyPCA Principal component analysisPLS Partial least squaresPNOC Post-notice of compliance changes (Canadian
Ministry of Health)PSD Particle size distributionQbD Quality by designQRM Quality risk managementQTPP Quality target product profileRTRT Real-time release testingSCADA Supervisory Control and Data AcquisitionTPP Target product profile
Open Access This article is distributed under the terms ofthe Creative Commons Attribution License which permits anyuse, distribution, and reproduction in any medium, providedthe original author(s) and the source are credited.
REFERENCES
1. Skelly JP, Van Buskirk GA, Savello DR, Amidon GL, Arbit HM,Dighe S, et al. Scaleup of immediate release oral solid dosageforms. Pharm Res. 1993;10:313–6.
2. Skelly JP, Van Buskirk GA, Arbit HM, Amidon GL, AugsburgerL, Barr WH, et al. Scaleup of oral extended-release dosage forms.Pharm Res. 1993;10(12):1800–5.
3. Communication from the Commission—Guideline on the detailsof the various categories of variations to the terms of marketingauthorizations for medicinal products for human use and veteri-nary medicinal products. Off J Eur Union, 22.1.2010, C17/1-41.http://ec.europa.eu/health/files/eudralex/vol-2/c17_1/c17_1_en.pdf.
4. Post-Notice of Compliance (NOC) Changes—quality guidanceappendix 1 for human pharmaceuticals. Canada Ministry ofHealth, Health Products and Food Branch, Implementation 10/17/2011. http://www.hc-sc.gc.ca/dhp-mps/alt_formats/hpfb-dgpsa/pdf/prodpharma/applic-demande/guide-ld/postnoc_change_apresac/noc_pn_quality_ac_sa_qualite-eng.pdf.
5. FDA challenges and opportunities report—innovation or stagna-tion: challenge and opportunity on the critical path to new med-ical products. US Department of Health and Human Services,Food and Drug Administration, March 2004. http://www.fda.gov/ScienceResearch/SpecialTopics/Crit icalPathInit iative/CriticalPathOpportunitiesReports/ucm077262.htm.
6. International Conference on Harmonization Guideline ICHQ6A: test procedures and acceptance criteria for new drug sub-stances and new drug products: chemical substances. October 1999.h t t p : / / www. f d a . g o v /D r u g s /G u i d a n c eC omp l i a n c eRegulatoryInformation/Guidances/ucm134966.htm.
7. Lionberger RA, Lee SAU, Lee L, Rau A, Yu LX. Quality bydesign: concepts for ANDAs. AAPS J. 2008;10(2):268–88. doi:10.1208/s12248-008-9026-7.
8. FDA manual of policies and procedures. Center for Drug Eval-uation and Research, Office of Pharmaceutical Science, MAPP5016.1—Applying ICH Q8(R2), Q9, and Q10 principle to CMCreview. February 2011. http://www.fda.gov/downloads/AboutFDA/CentersOffices/CDER/ManualofPoliciesProcedures/UCM242665.pdf.
9. International Conference on Harmonization Guideline ICHQ8(2)—Pharmaceutical development. November 2008. http://www.fda.
gov/downloads/Drugs/GuidanceComplianceRegulatoryInformation/Guidances/UCM073507.pdf.
10. InternationalConferenceonHarmonizationGuideline ICHQ9—qual-ity risk management. November 2005. http://www.fda.gov/downloads/Drugs/GuidanceComplianceRegulatoryInformation/Guidances/UCM073511.pdf.
11. International Conference on Harmonization Guideline ICHQ10—Pharmaceutical quality systems. June 2008. http://www.fda.gov/downloads/Drugs/GuidanceComplianceRegulatoryInformation/Guid-ances/UCM073517.pdf.
12. InternationalConference onHarmonizationGuideline ICHQ11—De-velopment and manufacture of drug substances (Chemical entities andbiotechnological/biological entities). May 2012. http://www.fda.gov/downloads/Drugs/GuidanceComplianceRegulatoryInformation/Guid-ances/UCM261078.pdf.
13. Guidance for Industry: PAT—a framework for innovative phar-maceutical development, manufacturing, and quality assurance.September 2004. http://www.fda.gov/downloads/Drugs/…/Guid-ances/ucm070305.pdf.
14. United States Code of Federal Regulations, Title 21—Food anddrugs. Chapter 1—Food and Drug Administration Department ofHealth and Human Services, Subchapter D—Drugs for humanuse, Part 314—Applications for FDA approval to market a newdrug, Subpart B—Applications, Section 314.70—Supplementsand other changes to an approved application.
15. Guidance for Industry: Changes to an approved NDA or ANDA,Revision 1. April 2004. http://www.fda.gov/downloads/Drugs/GuidanceComplianceRegulatoryInformation/Guidances/UCM077097.pdf.
16. Draft Guidance for Industry: CMC post-approval manufacturingchanges reportable in annual reports. June 2010. http://www.fda.gov/downloads/DrugsGuidanceComplianceRegulatoryInformation/Guid-ances/UCM217043.pdf
17. Health Canada Draft Quality (Chemistry and Manufacturing)Guidance: New drug submissions (NDSs) http://www.hc-sc.gc.ca/dhp-mps/alt_formats/hpfb-dgpsa/pdf/prodpharma/qual_ndsands_pdnpadn_07-01-eng.pdf.
18. Abbreviated New Drug Submissions (SNDSs) rather than thePMNOC-QD, or stability data requirements as per Health Can-ada Guidance Stability Testing of Existing Drug Substances andProduct http://www.hc-sc.gc.ca/dhp-mps/alt_formats/hpfb-dgpsa/pdf/prodpharma/stabt_stabe-eng.pdf.
19. Post Authorization Procedural Advice on Variation Regulation(EC) No. 1234/2008. EMA/40404/2010 http://www.emea.europa.eu/docs/en_GB/document_library/Regulatory_and_procedural_guideline/2010/01/WC500060512.pdf.
20. Public Consultation Paper—Review of the variations guidelinesregulation (EC) No. 1234/2008 Article 4: Review of the variationsguidelines European Commission, Health and ConsumersDirectorate—General Health Systems and Products Medicinalp r o d u c t s—A u t h o r i z a t i o n s , E M A , B r u s s e l s ,Sanco.ddg1.d.5(2012)817838. http://ec.europa.eu/health/files/betterreg/2012_06_11_public_consultation_en.pdf.
21. Guideline for descriptions on application forms for marketing ap-proval of drugs, etc. under the revised pharmaceutical affairs law,PFSB/ELDnotification no. 0210001, February 10, 2005. http://www.pmda.go.jp/english/service/pdf/guideline_application-2.pdf.
22. Balducci C, LoBrutto R, RoyceA, Cheney J, XiangD,DarmuzeyO,Valthorsson H. Quality by design and compression. In: Celik M,editor. Pharmaceutical powder compaction technology—2nd edition.Informa Healthcare; 2011.
23. SAS Global Forum. In: Figard S, editor. Paper 284-2009: Thebasics of experimental design for multivariate analysis. AbbottPark: Abbott Laboratories; 2009.
24. ISPE Product Quality Lifecycle Implementation (PQLI) Guide:Overview of product design, development and realization: a sci-ence- and risk-based approach to implementation. http://www.ispe.org/index.php/ci_id/38143/la_id/1.htm.
25. Garcia T, Cook G, Nosal R. PQLI key topics—criticality, designspace, and control strategy. J Pharm Innov. 2008;3:60–8.
26. Michaels JN, Bonsignore H, Hudson-Curtis BL, Laurenz S, LinH-RH, Mathai T, et al. Attribute-based design space: material-science-based quality-by-design for operational flexibility andprocess portability. J Pharm Innov. 2011;6:193–201.
Van Buskirk et al.
27. Colgan ST, Watson TJ, Nosal R, Cunningham E. LeveragingAPI product knowledge and process understanding for suc-cessful development and commercialization. AAPS AnnualMeeting. 2009.
28. 21 CFR 314.50 (d) (1)(ii)(a). http://www.accessdata.fda.gov/scripts/cdrh/cfdocs/cfcfr/CFRSearch.cfm?fr=314.50.
29. Pharmaceutical cGMPs for the 21st Century—A risk-based approach:second progress report and implementation plan. http://www.fda.gov/Drugs/DevelopmentApprovalProcess /Manufactur ing/QuestionsandAnswersonCurrentGoodManufacturingPracticescGMP-forDrugs/UCM071836.
30. Guidance for Industry: Extended release oral dosage forms: de-velopment, evaluation, and application of in vitro/in vivo corre-l a t i o n s . h t t p : / / w ww. f d a . g o v / d o w n l o a d s / D r u g s /GuidanceComplianceRegulatoryInformation/Guidances/UCM070239.pdf.
31. USP 34 General Chapter <1088> In vitro and in vivo evaluationof dosage forms. 2011.
32. Guidance for Industry: Immediate release solid oral dosage formsscale-up and postapproval changes: chemistry, manufacturing,and controls, in vitro dissolution testing, and in vivo bioequiva-lence documentation. http://www.fda.gov/downloads/Drugs/
GuidanceComplianceRegulatoryInformation/Guidances/UCM070636.pdf.
33. Guidance for Industry: SUPAC-MR: modified release solid oraldosage forms scale-up and postapproval changes: chemistry,manufacturing, and controls; in vitro dissolution testing andin vivo bioequivalence documentation. http://www.fda.gov/down-loads/Drugs/GuidanceComplianceRegulatoryInformation/Guid-ances/UCM070640.pdf.
34. Guidance for Industry:Waiver of in vivo bioavailability and bioequiv-alence studies for immediate-release solid oral dosage forms based ona biopharmaceutics classification system. http://www.fda.gov/down-loads/Drugs/GuidanceComplianceRegulatoryInformation/Guid-ances/UCM070246.pdf.
35. Guidance for Industry: process validation: general principles andp r a c t i c e s . h t t p : / / www. f d a . g o v / d own l o a d s /D r u g s /GuidanceComplianceRegulatoryInformation/Guidances/UCM070336.pdf.
36. Process analytical technology—particle sciences technical brief2012: volume 7. http://www.particlesciences.com/news/technical-briefs/2012/process-analytical-technology.html.
37. CFR 210.3. http://www.gpo.gov/fdsys/pkg/CFR-2011-title21-vol4/pdf/CFR-2011-title21-vol4-sec210-3.pdf.
Development, Scale-Up and Post-approval Control of IR & MR Dosage