pr14 review: discussion paper on findings
TRANSCRIPT

August 2021
PR14 Review: Discussion paper on findings

PR14 Review: Discussion paper on findings
1
PR14 Review: Discussion paper on findings
About this document
This discussion paper presents our findings on the impact the 2014 price review (PR14) had on the sector during the 2015-20 period. We have undertaken a targeted review of PR14 and as such we have not assessed every element or policy as part of this review. This complements the ’Reflections on the price review’ which we published shortly after PR14 final determinations which set out sector views on the PR14 process.
We welcome any comments or feedback you may have on the findings we present in this paper. We will reflect on any feedback we receive in our final report which will be published towards the end of 2021 and it will be considered as we develop the draft PR24 methodology. Feedback must be received by Ofwat no later than 5 pm on 22 September 2021.
If you wish to provide feedback, please submit this by email to [email protected] or post it to: PR14 review findings response Ofwat Centre City Tower 7 Hill Street Birmingham, B5 4UA
We will publish responses to this consultation on our website at www.ofwat.gov.uk, unless you indicate that you would like your response to remain unpublished. Information provided in response to this document, including personal information, may be published or disclosed in accordance with access to information legislation – primarily the Freedom of Information Act 2000 (FoIA), the General Data Protection Regulation 2016, the Data Protection Act 2018, and the Environmental Information Regulations 2004. For further information on how we process personal data please see our privacy policy.
If you would like the information that you provide to be treated as confidential, please be aware that under the FoIA there is a statutory ‘Code of Practice’ which deals, among other things, with obligations of confidence. In view of this, it would be helpful if you could explain to us why you regard the information you have provided as confidential. If we receive a request for disclosure of the information, we will take full account of your explanation, but we cannot give an assurance that we can maintain confidentiality in all circumstances. An automatic confidentiality disclaimer generated by your IT system will not, of itself, be regarded as binding on Ofwat.

PR14 Review: Discussion paper on findings
2
Contents
Executive Summary 3
1. Introduction 9
2. High level overview of performance in PR14 11
3. Focus on delivery 18
4. Securing value for money for customers 47
5. Balancing risk and return 60
6. Sustainable use of water resources 86
7. Targeting controls 98
8. Next steps 104

PR14 Review: Discussion paper on findings
3
Executive Summary
Every five years, water companies create plans setting out what they will deliver and the money they will need to collect from customers in return. Part of our role at Ofwat is to set the framework for companies’ plans, scrutinise and challenge the plans, and set the service delivery packages and the revenues companies can collect from customers.
The 2014 price review (PR14) marked a new approach to this process in the water sector. As the 2015-20 period has now ended, we wanted to review what impact the changes we made to our regulatory approach had on the sector during the 2015-20 period. This reflects our ambition to evaluate our effectiveness in order to increase our future impact. This review, in particular, will help us to improve the design of the 2024 price review (PR24) and other future price reviews.
Over the 2015-20 period, prices and services generally improved for consumers and the environment. Our report considers how the PR14 framework helped achieve these outcomes. We have focused on five key areas of change in the framework:
• the introduction of the outcomes framework which helped focus on delivery for customers;
• the approach to securing value for money for customers (including the introduction of ‘totex’ approach);
• the approach to the balance of risk and return; • the approach to sustainable use of water resources; and • the creation of separate targeted wholesale and retail controls.
Focus on delivery for customers
The outcomes framework aimed to increase companies’ focus on outcomes that customers valued rather than outputs. The PR14 approach put a much greater emphasis on customer engagement than in previous price reviews. We required companies to use customer engagement to determine which service delivery outcomes were most important to their customers. Throughout the 2015-20 period companies reported annually on their outcome performance which we measured through performance commitments (PCs). We set associated performance commitment levels (PCLs) that we expected companies to achieve. We also set financial outcome delivery incentives (ODIs) for some PCs to incentivise companies to meet and exceed their PCLs, whereas for others we relied on reputational incentives.
Our review suggests the regime did have a significant impact on the way companies were managed and significantly heightened their focus on customers. Many

PR14 Review: Discussion paper on findings
4
companies told us that the incentives in the outcomes framework helped them align their business operations more closely around the priorities of customers. For example, they began linking performance targets and financial incentives for management and staff, and operational monitoring, reporting and decision-making to customer outcomes. However, it takes time to embed these changes, and the full effects may not have materialised over the 2015-20 period.
Moreover, in this first iteration of the regime, the calibration of the service levels and incentive rates was a challenge in some cases, particularly as companies’ approaches were bespoke so benchmarking was complex. Companies generally exceeded our expectations on how much they could improve, although there were notable exceptions, some of which resulted in us taking enforcement action. In a quarter of cases, PCLs were met or exceeded four years ahead of plan (although this also reflected other factors, including work companies did prior to PR14 to improve their performance). Notably, service levels on leakage were not sufficiently stretching and incentive rates could have been stronger. Some other incentive rates could also have been better calibrated. For example, during 2017-18 we identified that Severn Trent’s external sewer flooding ODI rate was significantly higher than other companies with similar PCs, leading to concerns that the ODI payments might be disproportionate to the benefits delivered to customers.
Our review suggests there could also have been stronger focus on environmental areas and the long term, including asset health – issues which came to the fore in PR19. And while they each had a large number of PCs, in practice most companies focused on a small subset of PCs.
Overall, the sector outperformed two-thirds of all PCLs, with similar proportions of financial and reputational PCs (although companies told us they focused more on financial PCs). ODI under and over performance over the 2015-20 period were roughly balanced.1
Areas of service that improved included: water quality contacts, which fell by 25%; supply interruptions, which fell by 27%; mains bursts, which fell by 10%; and customer satisfaction, which improved by 4%. 73% of bathing waters achieved the ‘excellent’
1 This underrepresents the extent of outperformance as outperformance payments were lower than underperformance payments. Moreover, underperformance included the substantial effect of three large underperformance payments, one of which related to the failure to deliver a scheme and two of which related to behaviours that triggered enforcement action. When these three PCs were excluded, the adjusted net payments to the sector as a whole totalled £241 million (see Figure 3.8 in section 3).

PR14 Review: Discussion paper on findings
5
standard in 2019, up from 67% in 2015. All companies delivered reductions in pollution incidents over the 2015-20 period, with a sector average reduction of 36%.2
But in some areas there was little or no progress. During the 2015-20 period, leakage decreased by 6%, but most reductions were achieved in the final year, after the more stretching PR19 15% leakage reduction challenge was announced. Before that leakage had increased by 1%. Per capita consumption increased by 2% from 139 litres per head per day in 2014-15 to 142 litres per head per day in 2019-20.
Companies made good progress with embedding customer engagement and feedback, and reporting on their delivery against PCs to customers. But we consider there is further to go in these areas.
Securing Value for Money
Companies spent £45 billion (2012-13 prices) over the 2015-20 period, similar to previous price review periods, despite the improved service levels. Average bills still fell by 5% in real terms due to a decline in companies’ financing costs.
Our allowances broadly reflected what companies spent - on average, companies did not get significantly larger allowances than they used. In fact, companies overspent their allowances by 3.7% at the sector level, although this was focused on the last two years and in previous years there was an underspend. This overspend partly reflects expenditure brought forward in preparation for PR19.
The accuracy of the models we used to establish cost allowances for individual companies could have been improved. The CMA’s redetermination of Bristol Water in 2015 supports this view. Nevertheless, our models do not appear less accurate than company business plan forecasts - companies’ individual under or overspend of allowances did not relate systematically to the efficiency challenge we applied to their business plans.
One of the key changes at PR14 was that we moved from an approach where capital expenditure (capex) and operating expenditure (opex) were assessed separately to a total expenditure (totex) wholesale cost allowance approach. The totex framework gave companies more flexibility to choose the best way to provide outcomes for consumers. This helped increase value for money, as it reduced incentives to opt for
2 Our 2019 enforcement case concluded that we could not rely on Southern Water’s reporting of pollution events to us for 2010-17 period. For more details, see: Ofwat, ‘Ofwat’s final decision to impose a financial penalty on Southern Water Services Limited’, October 2019.

PR14 Review: Discussion paper on findings
6
less efficient capex-based solutions. There are some good examples of how this changed behaviour during the period. And, overall, the opex share increased compared to historic levels, reaching 52% compared to 40%-43% in the previous three reviews, suggesting the capex bias did reduce. However, our review suggests there is still further to go to embed the totex approach. For example, the supply chain reported that some companies made more of the totex approach than others, and that totex was often discussed but then not translated to project or procurement level.
However, more generally, there were still concerns about a lack of innovation. We rarely saw innovation trials being adopted or rolled out, and one estimate suggests that since 2011, productivity growth across the water sector has effectively been zero. This compares to productivity improvements of around 0.6% per year seen in similar sectors in the post-financial crisis period.3 This suggests customers could have received even more for their money, as innovation could have created the space for greater bill reductions or service improvements.
Balancing Risk and Return
PR14 aimed to better align investor and management risk and return with customers, with operational performance having a greater impact on returns and financing performance a lesser impact. We found evidence that our approach succeeded in aligning returns with operational performance: the best performers on ODIs and totex also achieved sector-leading returns on regulatory equity (RoRE), and conversely the worst performers in these areas were at the bottom of the cohort in overall RoRE terms.
In hindsight, however, the PR14 allowed return on capital was generous to companies. Assumptions on the cost of debt and the cost of equity both contributed to this. For example, in line with regulatory practice that was commonplace at the time, we used a long trail of historical data to inform certain cost of capital inputs, resulting in allowances which did not anticipate the environment of low and falling finance costs that characterised 2015-20. Financing performance was key to the sector outperforming its allowed return on equity of 5.65% (real, RPI) with a total RoRE performance of 6.30% over 2015-20.
Our financial monitoring framework increased the transparency and comparability of financial metrics reported by companies, making them more accessible to stakeholders and thus improving accountability. However, while some highly-geared
3 Frontier Economics, ‘Productivity Improvement in the Water and Sewerage Industry in England since Privatisation – Final Report for Water UK’, September 2017, p.3, Figure 2.
PR14 Review: Discussion paper on findings
7
companies have already improved their financial resilience by reducing gearing and others plan to do so, our PR19 policy targeting financial resilience may also be responsible for these decisions. We note that several companies have a credit rating that offers limited headroom above the investment grade floor and that these companies tend to be highly geared or with significant exposure to risk from their derivatives portfolio. This underlines the continuing need to monitor financial resilience.
Sustainable Water Resource Use
To encourage sustainable use of water resources, we introduced targeted incentives at PR14 to drive a change in company behaviour in two specific areas: water trading and abstraction from environmentally sensitive sites.
Our incentives to encourage increases in water trading did not deliver material short-term improvements during the 2015-20 period. Only two companies, Portsmouth Water (export to Southern Water) and Thames Water (import from RWE), identified new water trades which qualified for incentive payments. They received a total of £0.6 million from the water trading incentive payments. The remaining water trades made during the 2015-20 period were either in place pre-2015 or did not qualify for the incentive. However, it can take many years to identify viable water trades, so the full impact of this incentive, which has been maintained in PR19, may not have played out within the 2015-20 period. Moreover, while trading incentives increase individual company motivation to trade, they don’t solve co-ordination issues between companies or between regulators which can be significant.4
The abstraction incentive mechanism (AIM) was more effective within the 2015-20 period: it encouraged the reduction of abstraction at low flows by around 15,000 Ml at 38 environmentally sensitive sites. The introduction of AIM in PR14, initially as a reputational incentive, allowed us to move to a financial incentive at PR19, with an increased number of sites being put forward under the mechanism.
Water resource use was also included as part of the outcomes regime, through the leakage and per capita consumption PCs. However, limited progress was made on these. They are examples of areas where the outcomes regime could have been better specified and set more stretching incentives.
4 In PR19, the Regulator’s Alliance for Progressing Infrastructure Development (RAPID) was created to resolve some of the co-ordination issues between companies and between regulators

PR14 Review: Discussion paper on findings
8
Targeted Controls
PR14 marked the first separation of price controls to reflect two distinct activities within the water and sewerage business - wholesale and retail. Wholesale was further separated into water and wastewater services controls. Retail was further separated into residential and business services controls.
The creation of the separate controls was effective at improving transparency and understanding of costs allocated between the water, wastewater, residential retail and business retail services delivered across the sector. It was also essential to facilitating the expansion of competition in the business retail market in April 2017 for customers of companies operating wholly or mainly in England.
The separation of the residential retail control also led to significant efficiency improvements in some companies as well as service improvements. This was because retail services and costs had historically received less focus from companies as they formed a small part of the overall business – but separation of the control increased the visibility and comparability of companies’ retail business, driving efficiencies. However, the separation of wholesale controls between water and wastewater had a much lesser impact because they were already effectively separate before PR14 albeit that this was not legally binding.
Next steps
We welcome any comments or feedback you may have on the findings we present in this paper by 22 September 2021. We will consider any feedback we receive in our final report which will be published towards the end of 2021 and will be considered as we develop the draft PR24 methodology.

PR14 Review: Discussion paper on findings
9
1. Introduction
The 2014 price review (PR14) marked a new regulatory approach for the water sector. We set out a framework for the 2015-20 period that encouraged companies to engage more proactively with customers, and to focus on delivering the services that matter most to customers and the environment in the most cost efficient way.
The 2015-20 period has now ended. During the period, there were a number of wider external factors that have had an impact on the water sector in England and Wales. These included changes to the Climate Change Act in 2016 to include a net zero target, the period of uncertainty following the UK-EU referendum in 2016, three UK General Elections (May 2015, June 2017 and December 2019), Welsh Assembly elections in May 2016, several severe weather incidents with national and regional impacts eg Beast from the East in 2018 and most recently, the Covid-19 pandemic in the final quarter of 2019-20.
We wanted to review what impact the changes we made to our regulatory approach have had on the sector during the 2015-20 period. This complements the ’Reflections on the price review’ which we published shortly after PR14 final determinations which set out sector views on the PR14 process. This review reflects our ambition to evaluate our effectiveness in order to increase our future impact.
It is worth noting at the outset that although there already is much that can be learnt about PR14, the impact of the new framework is unlikely to have fully played out. It can take time for the industry to introduce new ways of working that reflect the new incentives we provided. And the regulatory framework is set up so that some of the benefits to customers are provided in future price control periods. PR14 was also a learning experience for Ofwat, and we have already reflected some of this learning in PR19 and will continue to consider the impact in PR24.
We have undertaken a targeted review of PR14 and as such we have not assessed every element or policy as part of this review. We have focused on five key areas of change in the PR14 price review framework:
• the introduction of the outcomes framework which helped focus on delivery for customers;
• the approach to securing value for money for customers, including the move from an approach where capital expenditure (capex) and operating expenditure (opex) were assessed separately to a total expenditure (totex) wholesale cost allowance approach;
• the approach to the balance of risk and return; • the approach to sustainable use of water resources; and

PR14 Review: Discussion paper on findings
10
• the creation of separate targeted wholesale and retail controls.
The report first highlights the key changes over the 2015-20 period in terms of bill impacts, customer outcomes and company investment and returns. It then looks at the key five areas of the review and considers the extent to which they influenced these outcomes.
We have used a mix of quantitative and qualitative data to assess the extent to which the evidence suggests the changes made at PR14 were effective or not. We have drawn on existing insights into elements of PR14. This includes reviews which informed our 2019 price review (PR19).5 We have built on this by considering data spanning the whole 2015-20 period, such as the annual performance report (APR) data. We have also drawn on responses to the call for input we put out in December 2020 and discussions with stakeholders to capture views and experiences of the 2015-20 period from the sector.6 We thank all the companies and other stakeholders who provided responses or participated in discussions for their contributions.
We welcome any further comments or feedback you may have on the findings we present as part of this targeted review of PR14.
5 For example - KMPG and Aqua Consultants, Innovation and efficiency gains from the totex and outcomes framework, June 2018 and PwC, Refining the balance of incentives for PR19, June 2017. 6 Ofwat, PR14 - Call for input, December 2020.

PR14 Review: Discussion paper on findings
11
2. High level overview of performance in PR14
This section provides a high level overview of outturn performance in PR14. It considers key changes over the period in terms of bill impacts, customer outcomes and returns to shareholders.
Bill impacts
Average customer bills fell by approximately 5% in real terms during the 2015-20 period (see Figure 2.1). This compares to increases of 1% and 16% during the previous price review periods. Companies totex was £45 billion (2012-13 prices), similar to PR04 and PR09, and the reduction was driven by a decline in financing costs.
Figure 2.1: Average combined water and sewerage bills, £ per customer per annum *
* Original figures upon which percentage changes are calculated expressed in 2012-13 RPI real prices.
Percentage changes show the changes in the average bill from one period to the next.
Customers in financially vulnerable households received lower bills. By the end of 2019-20, almost 900,000 such households in England and Wales were receiving help through reduced water bill schemes. This resulted in annual water bill reductions for these customers of approximately £150 million.7 This included about 723,000 households
7 CCW, Water for All: Water affordability and vulnerability report 2019-20, November 2020.
0.00
50.00
100.00
150.00
200.00
250.00
300.00
350.00
400.00
450.00
198
9-9
0
199
0-9
1
199
1-9
2
199
2-9
3
199
3-9
4
199
4-9
5
199
5-9
6
199
6-9
7
199
7-9
8
199
8-9
9
199
9-0
0
200
0-0
1
200
1-0
2
200
2-0
3
200
3-0
4
200
4-0
5
200
5-0
6
200
6-0
7
200
7-0
8
200
8-0
9
200
9-1
0
201
0-1
1
201
1-1
2
201
2-1
3
201
3-1
4
201
4-1
5
201
5-1
6
201
6-1
7
201
7-1
8
201
8-1
9
201
9-2
0
PR14PR09PR04PR99PR94
-5%+1%+16%
-10%+18%

PR14 Review: Discussion paper on findings
12
supported through social tariff schemes, an increase of 597,000 households since 2014-15.8
Customer outcomes
Figure 2.2 below shows how the sector’s average performance has changed across eight areas of service for which there is broadly consistent data across multiple price review periods. We also include the cumulative percentage change achieved over each price review period – this is calculated as the change between the year before the price review period started and the last year of the price review period. For example, for the 2015-20 period (PR14), we calculated the percentage change between 2014-15 and 2019-20.
Figure 2.2: Performance trends in key service areas
Leakage
Mains bursts
Supply interruptions
Water quality contacts
8 CCW, Water for All report 2019-20: Supplementary data, November 2020.

PR14 Review: Discussion paper on findings
13
Per capita consumption
Internal sewer flooding
Customer service (SIM)
Pollution incidents
Source: Ofwat analysis Note: (*) corresponds to the cumulative change starting with the first year available.
In all areas, except for PCC which rose slightly, performance improved during the 2015-20 period. Comparison with past trends is hard given limited data series in some cases. However, as discussed below, on the basis of the data we do have, there was no clear significant improvement relative to past trends across the board. But there were substantial differences between companies underlying these sector trends, with some companies making substantial improvements, while others lagged behind. This included two prominent examples of companies failing to deliver for their customers, which resulted in us taking enforcement action,9 and a sector-wide review into how companies reacted to the 2018 freeze and thaw incident.10
9 See: Ofwat, ‘Ofwat’s final decision to impose a financial penalty on Southern Water Services Limited’, October 2019. Ofwat, ‘Investigation into Thames Water’s failure to meet its leakage performance commitments’, March 2021. 10 For further details, see: Ofwat’s final decision to impose a financial penalty on Southern Water Services Limited; Notice of Ofwat’s imposition of a financial penalty on Thames Water Utilities Limited; and Out in the Cold: Water companies’ response to the ‘Beast from the East’.

PR14 Review: Discussion paper on findings
14
Water quality contacts and customer satisfaction (SIM) are two examples of areas that showed a continuation of the steady progress seen since the early 2010’s. We saw a 25% reduction in the number of water quality contacts over the 2015-20 period, which was equivalent to an annual reduction of about 4.5%, similar to the annual reduction we saw in the 2012-14 period. However, there were large variations between companies. For example, Portsmouth Water and SES Water had a steep reduction in the number of customer contacts regarding water quality over the 2015-20 period, showing a decrease of 54% and 42% respectively. Conversely, the number of water quality contacts for Thames Water increased by 9%. We saw an increase in customer satisfaction of 4% during the 2015-20 period, although this was slower than the improvement rate seen in the previous period (23%).11
Supply interruptions and mains bursts were two other areas where the sector continued to deliver improvements in the 2015-20 period. This was despite the ‘Beast from the East’ which contributed to a spike in 2017-18 for supply interruptions and for 2017-18 and 2018-19 for mains bursts. We saw supply interruptions reducing by 4% a year, on average, equivalent to a cumulative 27% throughout the 2015-20 period, following a reduction of 13% in the two years before AMP6 (equivalent to average annual reductions of 6%).12 Mains bursts reduced by a cumulative 10% throughout the 2015-20 period, although the cumulative reduction in mains bursts in the 2010-15 period was over twice that at 24%. Portsmouth Water had a sizeable decrease in the number of mains bursts over the 2015-20 period, with a 44% reduction in the number of incidents per thousand kilometres of mains. Similarly, Northumbrian Water had a 32% reduction. Only two (out of 17) companies - Dŵr Cymru and Yorkshire Water - had a deterioration over the 2015-20 period with an increase in the cases of mains bursts per thousand kilometres of 7% and 3% respectively.
Sector performance on pollution incidents continued the improving trend started in 2013-14 early in the period, but flattened in the following three years and deteriorated in 2019-20. Some companies delivered significant improvements in performance, with Northumbrian Water and Thames Water achieving reductions of 72% and 61% over the 2015-20 period respectively. Almost every company achieved a reduction of 30% or more in the pollution incidents per 10,000 km of sewers, with pollution incidents across the sector falling by 36% over the 2015-20 period. The exception is Southern Water, for which performance data on pollution incidents during parts of the period have been
11 We note that the customer satisfaction measure (SIM) was replaced in 2019-20 by the shadow year for the customer and developer measures of experience (C-MeX and D-MeX) which were fully introduced for the 2020-25 period. For more details, see: Ofwat, CMeX and DMeX 2019-20 results 12 The annual percentage changes outlined here are simple averages of annual changes over the relevant period.

PR14 Review: Discussion paper on findings
15
found to be unreliable and whose reporting of their performance has been subject to enforcement action by Ofwat and the EA.13
Internal sewer flooding decreased over the 2015-20 period, although it increased in the final year of PR14. Anglian Water and Thames Water reduced internal sewer flooding by 40% and 39% respectively, between 2015 and 2020. Dŵr Cymru reduced internal sewer flooding incidents by 21% over the same period.
In areas relating to water use, lack of progress was concerning. Per capita consumption increased by 2% during the 2015-20 period and leakage increased by 1% in the first four years of PR14 (2015-19). However, in 2019-20 the sector reduced leakage by 7%, a reduction big enough to bring the cumulative reduction over the whole 2015-20 period to 6% overall. Nevertheless, by the end of PR14 (2019-20), the level of leakage was about 21% of the total water supplied by the industry, equivalent to approximately 53 litres per person per day. For context, in 2018-19 average per capita consumption was 143 litres per person per day.14 From 2000-01 to 2019-20, the sector achieved a cumulative leakage reduction of 10%, an annual average of only about 0.5% reduction. These modest reductions contrasted with the significant reductions achieved in the five years following the 1995-96 drought, where the sector achieved a greater than 30% reduction in leakage. Again, the sector trends mask differential levels of performance between companies. While per capita consumption increased for the sector overall, five (out of 17) companies improved their per capita consumption performance over the 2015-20 period. Leakage was reduced by 18% over the 2015-20 period by Bristol Water and Portsmouth Water. Meanwhile Thames Water’s leakage increased by 6% between 2014-15 and 2017-18, resulting in us taking enforcement action.15
There were some concerns about the water companies’ treatment of the environment, despite the improvement in pollution incidents. The Environment Agency rated four out of the nine water and wastewater companies in England as poor or requiring improvement in 2019. This compares to two out of the nine companies being rated as requiring improvement in 2014. And while Natural Resources Wales has seen
13 Our 2019 enforcement case concluded that we could not rely on Southern Water’s reporting of pollution events to us for 2010-17 period. For more details, see: Ofwat, ‘Ofwat’s final decision to impose a financial penalty on Southern Water Services Limited’, October 2019. 14 Leakage, distribution input and population served data from company annual performance reports 2018-19. For context, in 2018-19 average per capita consumption was 143 litres per person per day. 15 Ofwat, ‘Investigation into Thames Water’s failure to meet its leakage performance commitments’, March 2021.

PR14 Review: Discussion paper on findings
16
performance improve for the two Welsh companies in 2019, it nevertheless noted that there was room for both companies to improve their environmental performance.16
Company investment and returns
Total investment across the sector, as measured by regulated capital value (RCV) growth, increased at a rate of 6.8% over the 2015-20 period (see Figure 2.3). At a company level the rate of new investment varied between 0.7% (Northumbrian Water) and 16% (Bristol Water).
Figure 2.3: RCV growth over the period 2015-20
Source: Ofwat analysis
As we explain in Section 6, outturn return on regulatory equity (RORE) for the sector over the 2015-20 period was 6.3% (real, RPI), compared to the allowed return on equity at PR14 of 5.65% (in real, RPI-deflated terms). RORE is a measure of returns that companies earn by reference to the notional capital structure. The actual returns that investors can earn are also impacted by their actual capital structure. Some of these returns are extracted from the company each year via dividends while the remaining balance remains within the company.
Figure 2.4 below shows the average annual nominal return earned by companies during PR14. This is calculated with reference to both notional and actual regulatory equity. The Total Shareholder Return, shown by the full length of each bar, represents the
16 Natural Resources Wales, Annual performance reports for Dŵr Cymru and Hafren Dyfrdwy.
0%
2%
4%
6%
8%
10%
12%
14%
16%
18%

PR14 Review: Discussion paper on findings
17
value attributable to the company’s shareholders for the reporting period (before the distribution of any dividends). The value attributable is built up from a base return set at PR14, an inflation amount and any out- or under-performance for operational and financial activities. The chart also shows the net dividends (i.e. appointee dividends net of payments to fund interest on intercompany loans and restructuring dividends) paid as a proportion of Total Shareholder Return. Affinity paid dividends in excess of its Total Shareholder Return in the 2015-20 period, represented by a negative value.
Figure 2.4: Total Nominal Shareholder Returns, 2015-2020 average
Source: Ofwat Financial monitoring report 2019-20
The level of dividends that companies pay out may take account of profits earned over a period of time, rather than just profits in the year they were declared. High dividends are not necessarily a concern when linked to good performance, but they may become controversial and impact customer trust when they do not correlate with customer outcomes. Although dividends at the start of PR14 were higher than at the end, on average over the period, some companies have taken dividends in excess of the notional equity return assumed at PR14 (i.e. 5.65% in real, RPI-deflated terms). In some cases these levels of dividend reflect outperformance against the determination, but not in all. In Section 5 we explain how company performance, financial returns and the balance of interests between investors and customers became a focus during the period and shaped our approach at the subsequent review, PR19.

PR14 Review: Discussion paper on findings
18
3. Focus on delivery
Key findings
Based on our assessment of the move from an outputs to an outcomes approach during the 2015-20 period, we found that:
• The outcomes framework constituted a major innovation in the regulation of the water sector. The resulting focus on customer outcomes was widely incorporated into companies’ ways of working, including in performance targets and financial incentives for management and staff, and operational reporting and monitoring and decision-making. And the framework encouraged companies to improve service beyond the PCL where that was in customers’ interests, rather than just focusing on cost minimisation.
• However, there may be further to go in fully embedding these changes. And work is needed to further ensure that a longer-term horizon receives greater focus from the sector in future price reviews.
• PCLs could have been more stretching in some cases. In a quarter of cases, PCLs were met or exceeded four years ahead of plan. For PCs set using the historical upper quartile approach, more than half were met in the first year of the price review period. And while companies included and met many environmental PCs, concerns about their treatment of the environment persisted.
• Although companies outperformed a similar proportion of reputational and financial PCs, stakeholders told us that in practice reputational incentives were less effective at driving performance improvement than financial incentives. Companies told us that reputational PCs were most effective when all companies had a common measure that could be reported as part of a league table.
Introduction
The introduction of the outcomes approach at PR14 was designed to focus companies on delivering the outcomes that mattered to their customers, and gave companies the flexibility to choose the most efficient solution to do this. This contrasted with the outputs-based approach at previous price reviews, in which companies committed to delivering specific schemes.

PR14 Review: Discussion paper on findings
19
This new approach also helped to reduce the administrative burden on companies and Ofwat. Companies no longer needed to propose, and Ofwat no longer needed to assess, scheme-level proposals of which there were over 10,000 included in companies’ PR09 business plans.
Companies proposed bespoke PCs which reflected their specific customers’ and local environmental needs, with only two PCs mandated by us (SIM and leakage). Where a company demonstrated that financial incentives were appropriate, service delivery for customers was incentivised via outcome delivery incentives (ODIs). All other PCs were non-financial and had reputational incentives associated with them.
This approach put a much greater emphasis on customer engagement than in previous price reviews, requiring companies to engage with their customers to determine which service delivery outcomes were most important to them. To ensure appropriate independent challenge, each company was required to establish a Customer Challenge Group (‘CCG’), consisting of representatives of consumer and stakeholder groups. Their purpose was to challenge the company and report to Ofwat on the quality of their customer engagement and on how well the proposed outcomes package reflected this customer engagement and wider customer preferences and priorities.
Figure 3.1: PR14 outcomes framework
As set out in Section 2, the sector delivered improvements in most areas of performance during the 2015-20 period. But the rate of improvement did not clearly show a step change in historic trends, and in some cases, such as leakage and per capita consumption, more progress could have been made. Average sector performance masked differences in performance at the level of individual companies.

PR14 Review: Discussion paper on findings
20
In this section, we consider:
• Focus on customer outcomes: whether the outcomes approach increased companies’ focus on the outcomes that matter to customers, including through the use of CCGs.
• Design of the outcomes regime: whether the way we designed and set the parameters of the PCs and ODIs drove performance improvements without causing unintended consequences.
Focus on customer outcomes
This section considers whether the new approach increased companies’ focus on the outcomes that matter to customers. We consider how the new approach influenced companies’ ways of working, including the impact on the supply chain, whether there were any distortive effects and whether CCGs helped companies to focus on delivering for customers during the 2015-20 period.
Influence on company ways of working
In their feedback to us to inform this review, stakeholders were overwhelmingly in agreement that the outcomes framework was a positive development. It encouraged companies to focus on delivering customer priorities to a much greater extent than previous price reviews did using output-based performance indicators, and to improve service beyond the PCL rather than just focus on cost minimisation. This included commitments to deliver improvements to the environment, which were not explicit in the outputs-based approach.
For example, Severn Trent Water told us that the framework was built into all aspects of its business, from weekly team meetings for operational teams to the company bonus. It was able to drive significant operational and performance improvement especially in its wastewater business, which translated into outperformance on its wastewater-focused PCs during the period. South East Water also emphasised the customer focus, saying that having a wide range of customer satisfaction measures developed in partnership between customers and the company really ensured that it put customers at the heart of its business. Anglian Water translated the framework to all colleagues throughout the business through internal communications and incentive arrangements. Southern Water said that the PCs were used as one of the key bases for reporting of operational performance internally and to the executive and Board, through a bespoke ODI dashboard. All PCs had a senior manager owner and executive team sponsor, and delivery of these was a key priority integrated into personal objectives. Thames Water said that the outcomes framework helped to instil a clear

PR14 Review: Discussion paper on findings
21
focus on service delivery company-wide, from front-line employees to management, Executive and the Board.
The link between operational activities and investments to financial and reputational consequences of performance led companies to target changes at areas where they could make the most difference to customer outcomes and ODI payments. It also helped companies to better understand and manage interdependencies across elements of performance for customers, because of the interactions across PCs on ODI payments. For example, South Staffs Water highlighted that, following a supply interruption, returning supplies too quickly may impact on the acceptability of water. The company considered the impact of returning supplies quickly against the impact of reducing the acceptability of water, looking at the net impact of ODIs which reflected customers' preferences.
However, some companies said that the outcomes framework did not in itself change the core operational aspect of delivery for customers, because this already underpinned their main PCs. For example, Portsmouth Water told us that it felt that at PR14, the ODI results were not driving the business, rather they demonstrated the success of its existing strategies. Nevertheless, Portsmouth Water also noted that the outcomes framework did begin to drive better comparability in some areas, and that this was leveraged through the Discover Water reporting. The company said this raised the profile of ODI performance across companies’ Boards, and therefore its profile within the business as PR14 progressed.
Several stakeholders pointed out that financial ODIs tended to attract greater management attention than non-financial ones. Given this, we might have expected to see companies outperforming a greater proportion of their financial PCs compared to their reputational PCs. As discussed below however, by the end of the 2015-20 period the proportion of financial and non-financial PCs that were met by companies was very similar at the sector level. This may be because non-financial PCLs were easier to meet, perhaps because they are harder to benchmark or were a lesser priority in the price review process.
Impact on the supply chain
Most companies deliver their services to customers to a greater or lesser extent in partnership with contractors in the supply chain. Where supply chain performance was directly linked to the delivery of PCs, many companies sought to reflect this in external contracts, including incentivisation and risk-sharing relating to ODI performance. For example, Portsmouth Water built the interruption to supply ODI into the KPIs for its business partner on mains repairs and new connections. The company told us that it saw an improvement in this ODI partly due to their business partner using a new ‘no dig’ approach to mains renewals, which in turn reduced disruption to customers.

PR14 Review: Discussion paper on findings
22
Southern Water included a direct pricing incentive related to SIM performance in their main customer service contract. The company also included performance against SIM and other ODIs in the strategic level incentives for their water and wastewater Repair and Maintenance contracts. However, the company said that its learning from this was not to make the incentive arrangements over-complex. Thames Water’s contracts with its alliance partners also included outcomes-based incentives. In both Southern Water and Thames Water’s cases, it proved more difficult than expected to align incentives with requirements for delivery under the contracts (and in Thames Water’s case this led in part to the significant underperformance in leakage as we set out in our case study 7 later in this section).
Other companies told us that the outcomes framework did not drive their contracting with the supply chain. For example, South Staffs Water said that the main obstacle was that any potential reward for contractors would not be known or realised for five years, as the ODIs were at the end of the period.
The range of company experiences mirrored the mixed experience of stakeholders within the supply chain. On the one hand, we were told that each company’s suite of PCs and associated ODIs gave the supply chain a clear idea of the areas of priority for the companies and their financial exposure to failure to perform and they could design offerings and solutions around these. On the other hand, we received feedback that during the 2015-20 period tenders were still very much price led, with the main focus being low risk, low cost to deliver. We were told that outcomes and ODIs were often ‘buzz words’ that were talked about during the procurement process, but companies were not always clear on what they wanted or did not actually use them in tender evaluation criteria. This reduced the incentives on the supply chain to develop innovative solutions specifically focused on ODI performance.
Potential distortive effects
Although stakeholders were strongly supportive of the outcomes framework, some stakeholders pointed to some potentially distortive effects. The main concern was that it did not sufficiently incentivise a focus on the long-term.
Our intention with the PR14 outcomes framework and totex approach was to encourage a long-term focus on asset health, using short-term incentives as a stepping stone. But many companies commented that, although they set out longer-term strategic contexts in their business plans, they tended to focus on short-term delivery – where incentives were clear – at the expense of longer-term objectives. In particular, some companies said that they delayed spend on capital maintenance in order to focus on delivering against specific PCs by the end of the 2015-20 period. As companies no longer had to report against set asset health metrics as they had at previous price reviews, we had less visibility of companies’ overall asset health performance.

PR14 Review: Discussion paper on findings
23
Under the outcomes regime, such short term behaviour should have negative implications for future price controls, when the lack of investment materialises. Indeed, at PR19, some companies fell short on our expected levels of asset health and had to finance improvements themselves. In addition and as outlined in Section 5 on value for money, many companies began spending money towards the end of the 2015-20 period in anticipation of the more stretching PR19 targets, in particular on leakage. This highlights the potential for the outcomes framework to incentivise companies to focus on their performance beyond the current price review period.
Moreover, companies had flexibility to propose PCs across a range of areas of interest to their customers, including on issues such as asset health. And, outside the outcomes regime, they also have licence obligations relating to asset maintenance, which we have enforced when necessary.
Nonetheless, work conducted by Ofwat, including on PR19, the targeted review of asset health17 and the asset management maturity assessment, has also highlighted that there could have been greater focus on asset health and its role in delivering resilient services in the long term during the 2015-20 period.
One company commented that it is important to ensure incentives for each specific ODI are balanced against each other to ensure there are no perverse incentives – for example, if underperformance payments are overly punitive on one measure it may distort the incentives to reduce activity on other related measures to reduce potential underperformance overall. To the extent that high underperformance payments in one area reflect the importance to consumers, as well as their preference to avoid underperformance rather than attain outperformance, this may be appropriate.
Customer Engagement and Customer Challenge Groups during the 2015-20 period
At PR14, we required companies to engage with their customers to determine which aspects of services mattered most to them. We also required companies to set up Customer Challenge Groups (CCGs) to help scrutinise these efforts. All of the companies kept their CCGs (or equivalents) in place following the PR14 final determinations, to provide additional customer focussed support and challenge during the 2015-20 period. Some groups saw their role as being confined to determining the service delivery outcomes that were most important to customers. Others took on a broader role, challenging their company’s ongoing performance throughout the 2015-20 period.
17 C2HM, ‘Targeted review of asset health and resilience in the water industry’, September 2017.

PR14 Review: Discussion paper on findings
24
Our PR14 review call for input asked to what extent CCGs helped companies focus on delivering for customers during the 2015-20 period. We received mixed views on this. For those companies that maintained regular engagement with their CCGs throughout the 2015-20 period, a number argued that the groups were most effective when used to challenge ongoing performance and transparency for customers as well as business plans. And several companies were of the view that there was increasing challenge throughout the 2015-20 period from the CCGs as they gained a better understanding of the outcomes being delivered.
However, other companies argued that CCGs were more effective when challenging companies on the quality of customer engagement and understanding how it has influenced company business plans. These companies argued that it is the role of company Boards, not CCGs, to drive delivery for customers. And some respondents noted that while ongoing challenge was valuable in some areas, it was often resource intensive for the companies and in some cases, the CCGs did not always focus on the areas which had the most impact for customers.
During the 2015-20 period, companies continued to develop their efforts to embed customer feedback and findings from broader customer engagement into their ‘business as usual’ activities. But CCW suggests that over the 2015-20 period, customer engagement on day-to-day issues has been falling in England, while the trend in Wales has remained largely flat.18 We therefore consider that further work is required to ensure that ongoing customer engagement is fully embedded in ‘business as usual’ across the sector.19
18 CCW, Water Matters Highlights Report 2019-2020, August 2020, P. 9 19 Ofwat, 'Time to act, together: Ofwat's strategy', October 2019. P. 15.

PR14 Review: Discussion paper on findings
25
Focus on customer outcomes key findings
• Outcomes were widely incorporated into companies’ ways of working, including in performance targets and financial incentives for management and staff, and operational reporting and monitoring and decision-making.
• While moving from an outputs focused framework to an outcomes focused framework has sharpened companies’ focus on delivering their customers’ priorities, there was insufficient focus on longer-term horizons.
• The experience of the supply chain was mixed, with some saying the framework resulted in a clearer focus on what mattered to customers and others reporting that the outcomes framework made little difference in practice to procurement or to delivery requirements.
• All companies chose to keep their Customer Challenge Groups in place during the 2015-20 period. Companies made good progress in embedding customer feedback on their delivery against PCs, but there is further to go.
Design of the outcomes regime
This section discusses the design and calibration of the outcomes regime. We first provide an overview of the PCs, looking at the number and type of PCs and incentive rates. We then consider the way in which we set PCs, PCLs, and ODIs and the impact that this had. We then look in detail at the impact of caps, collars and deadbands, and the overall financial exposure in the regime. And finally we consider the overall focus of the regime, including on the environment and vulnerable customers.
We have made use of outcomes data where possible, but the lack of comparability makes analysis complex. We have therefore complemented the assessment with case studies. We explain that, there were many successes with the regime and, as noted above, the outcomes framework encouraged companies to focus on delivering their customer priorities to a greater extent than in previous price reviews. But in some respects the regime could have been more stretching and delivered more benefits for consumers.
Overview of PCs
In PR14, companies proposed as many PCs as they considered appropriate to reflect their customers’ priorities and environmental needs, ranging from 13 to 55 PCs per company. We required companies to have only two mandatory PCs, the Service

PR14 Review: Discussion paper on findings
26
Incentive Mechanism (SIM) and leakage. Overall, companies set themselves a total of 571 PCs in PR14.20 Figure 3.2 provides a breakdown of the key features of these PCs.
Figure 3.2: Breakdown of PCs set in PR14 by key features
Source: Ofwat analysis Note: During the 2015-20 period, there were some mergers in the industry which resulted in some PCs being consolidated accordingly. The numbers presented in this chart refer to the PCs post-mergers. Therefore, these figures may differ from figures presented elsewhere for the same period but referring to the pre-merger companies.
While the outcomes framework was new, many of the PCs that companies set reflected core priorities that had been important to customers over multiple price reviews and which the sector had been monitoring for some time. As well as the two mandatory PCs, these included such things as mains bursts, pollution incidents, water quality contacts and water supply interruptions that many companies’ engagement identified as important to their customers. We refer to these as ‘comparable’ PCs. In total, and as Figure 3.2 shows, these accounted for one in five PCs were comparable. With the exception of SIM, companies also had the flexibility to define their PCs in the way they considered would best reflect their customers’ preferences. For example, one in six PCs were related to customer satisfaction but defined in different ways. A consequence of this was to reduce comparability across companies, even for ‘comparable’ PCs. Also, one in every 20 of the PCs was made up from composites of multiple metrics, which made the interpretation of performance more complex.
About four in five PCs were bespoke. These included the PCs specifically related to environmental performance that many companies committed to deliver at PR14. In
20 Note that at PR14, where relevant, we required companies to report PCs separately for both their retail and wholesale controls. Where this is the case, these appear twice in this chart and those which follow throughout this report (unless otherwise specified).
Sector total, 571 PCs

PR14 Review: Discussion paper on findings
27
some cases bespoke PCs were still more outputs-based (for example relating to delivery of the National Environment Programme or Security and Emergency Measures Direction or other major projects).
For most PCs, we also allowed companies to set their own targets reflecting their level of ambition, which we assessed using comparative assessments where possible.
Companies proposed ODIs in the form of financial or reputational incentives. Companies could propose their own out and underperformance rates for financial incentives. Three in five PCs had financial ODIs and two in five had reputational ODIs. Just over half (56%) of financial PCs had both out and underperformance ODIs attached, a further 43% were under-only, and only 1% were out-only.
Companies could also propose deadbands, which allow for a degree of out and underperformance before a payment was triggered, as well as caps on outperformance payments and collars on underperformance payments. Caps on the level of outperformance payments limit rewards and their consequent impact on customer bills. Collars on underperformance payments limit the company risk of having to make substantial payments for underperformance, without removing companies’ exposure to enforcement action. About 46% of financial ODIs included deadbands. 72% of financial ODIs included caps and collars on the level of payments.
Choice of outcomes and PC measures
One of the key features of PR14 was that PC measures were bespoke. In their responses to our call for input, stakeholders were largely of the view that bespoke PCs were useful in delivering benefits that are specific to local needs, such as local environmental benefits. However, there was a significant degree of similarity across the key outcomes of different companies, suggesting commonality across the key issues that mattered to customers.21 And responses stated that in areas of performance which are common across company boundaries, having measures of performance that allow comparability across companies highlights sub-par performance and enhances the incentives for driving performance improvement.
As the Yorkshire Water internal sewer flooding case study shows, even where some comparison was possible, inconsistency of definitions sometimes limited comparability.
21 See also: Ofwat, ‘Setting price controls for 2015-20 Final price control determination notice: policy chapter A2 – outcomes’, December 2014, p. 16-21

PR14 Review: Discussion paper on findings
28
Case study 1: Yorkshire Water’s internal sewer flooding
In their PR14 business plans, companies proposed different definitions of PCs for internal sewer flooding. For example, while some companies proposed PCs expressed in terms of the number of properties affected by internal sewer flooding, others proposed a PC defined in terms of the total number of internal sewer flooding incidents.
While we accepted the companies’ differing definitions of PCs, we nonetheless attempted to set performance commitment levels based on industry historical upper quartile performance. To do this, we compared companies’ proposed PCs by converting the values into a single standard metric, using a ‘property to incident’ conversion. However, this conversion was based on a limited timeframe of data, and resulted in Yorkshire Water having insufficiently stretching PCLs for internal sewer flooding, which actually increased over the course of the 2015-20 period. As a result, Yorkshire Water was able to earn £25 million in outperformance payments while delivering the worst performance on internal sewer flooding in the sector on a comparable basis (incidents per 10,000 connections).
This shows that the inconsistency of definitions at PR14 limited comparability across companies, and, in this case, resulted in customers paying for poor performance.
Performance Commitment Levels
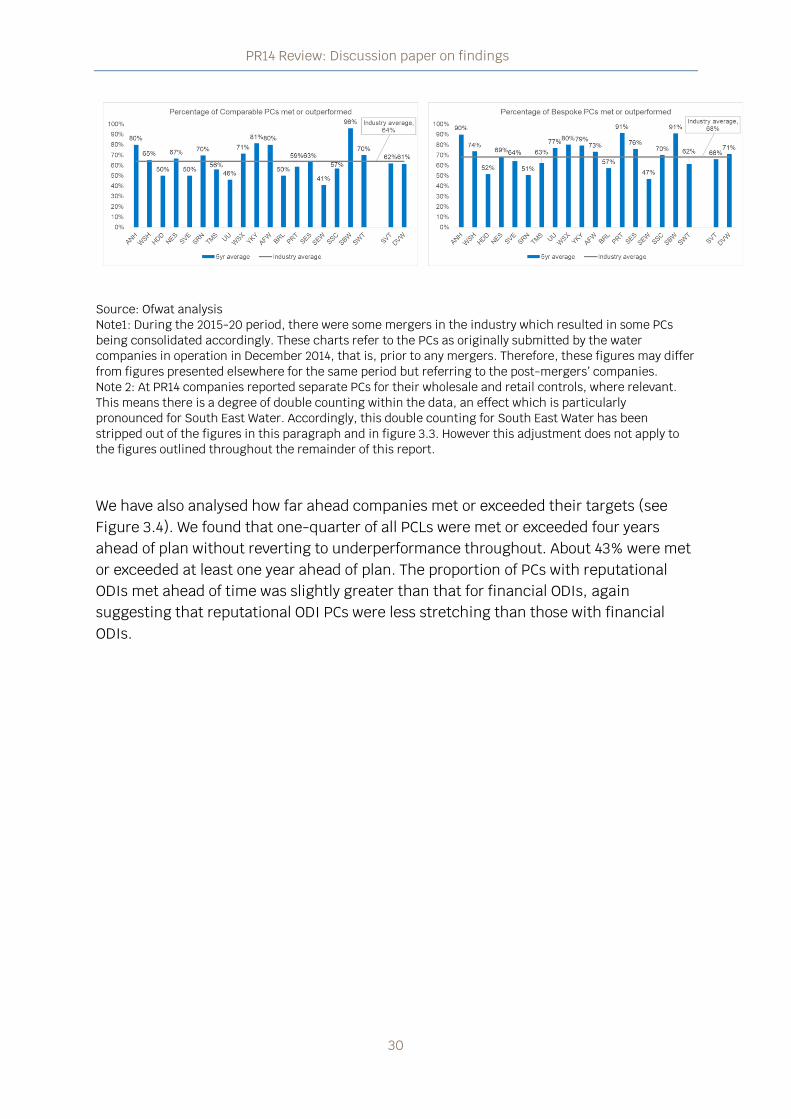
The sector overall met or exceeded 67% of all PC levels they committed to deliver over the 2015-20 period. This is shown in Figure 3.3. The percentage of PCs met or exceeded varied considerably across companies, with one company delivering only 46% and four companies delivering over 80% of all the PC levels to which they had committed.
The sector overall achieved or exceeded a similar proportion of financial and reputational PC levels, but again the differences across companies were substantial. Many companies told us that in practice they focused on the delivery of PCs with more material financial and customer impact. The fact that a similar proportion of reputational PCs were met despite this may suggest that they were set at less stretching levels. This may be because they are harder to benchmark or were a lesser priority in the price review process.

PR14 Review: Discussion paper on findings
29
Companies performed slightly better on their bespoke PCs relative to the comparable PCs.22 The sector delivered 67% of their bespoke PCs and 64% of the comparable PCs over the 2015-20 period.
Figure 3.3: PCs achieved or exceeded in PR14, by companies – average over the 2015-20 period
22 Comparable PCs are: leakage; mains bursts; supply interruptions; water quality claims; water per capita consumption; internal sewer flooding; pollution incidents; and Service Incentive Mechanism (SIM).
PR14 Review: Discussion paper on findings
30
Source: Ofwat analysis Note1: During the 2015-20 period, there were some mergers in the industry which resulted in some PCs being consolidated accordingly. These charts refer to the PCs as originally submitted by the water companies in operation in December 2014, that is, prior to any mergers. Therefore, these figures may differ from figures presented elsewhere for the same period but referring to the post-mergers’ companies. Note 2: At PR14 companies reported separate PCs for their wholesale and retail controls, where relevant. This means there is a degree of double counting within the data, an effect which is particularly pronounced for South East Water. Accordingly, this double counting for South East Water has been stripped out of the figures in this paragraph and in figure 3.3. However this adjustment does not apply to the figures outlined throughout the remainder of this report.
We have also analysed how far ahead companies met or exceeded their targets (see Figure 3.4). We found that one-quarter of all PCLs were met or exceeded four years ahead of plan without reverting to underperformance throughout. About 43% were met or exceeded at least one year ahead of plan. The proportion of PCs with reputational ODIs met ahead of time was slightly greater than that for financial ODIs, again suggesting that reputational ODI PCs were less stretching than those with financial ODIs.

PR14 Review: Discussion paper on findings
31
Figure 3.4: PCs met ahead of time during the 2015-20 period, by type of PC
Source: Ofwat analysis Note: the results presented in this chart refer only to PCs with numerical targets. We considered that a company met or exceeded a PC level target ahead of time if it met or exceeded the target set for a given year and kept meeting or exceeding the targets set for the years that followed.
In some cases, where it was possible to compare PC levels across companies, we intervened to ensure companies delivered an industry upper quartile level of performance. This meant that one-quarter of the companies (four out of 17) were set performance levels for the 2015-20 period which were less stretching than the performance they had historically delivered. Wessex Water’s internal sewer flooding case study illustrates the issues that this can cause if the upper quartile companies are significantly above the historical upper quartile.
Moreover, across all PCs where we intervened to set the targets at the industry historical upper quartile, more than half of the companies achieved the historical upper quartile in the first year of the price control (2015-16), and almost all achieved it at least one year ahead of plan. Although some companies may have improved performance prior to 2015, anticipating the stretch set at PR14, this suggests that the historical upper quartile may have been insufficiently stretching.
A further area where we could have been more stretching is the PCs relating to water use – i.e. leakage and PCC. These are discussed in more detail in section 7 on sustainable use of water resources.

PR14 Review: Discussion paper on findings
32
Case study 2: Wessex Water’s internal sewer flooding performance against industry historical upper quartile
At PR14 we set PCLs for internal sewer flooding at the sector historical upper quartile for the whole 2015-20 period. For Wessex Water, the top performer in 2014-15, this meant that the company’s targets were 44% to 52% less stretching than the level the company achieved in 2014-15. The company received annual outperformance payments totalling £24 million, despite its performance in the 2015-20 period being slightly worse than it was in 2014-15.
It is important for companies to be able to earn outperformance payments, where the outperformance is due to their efforts to deliver for consumers. And unless we set PCLs at the industry frontier, there is always the possibility that some companies may earn ODI outperformance payments despite delivering worse performance than they have achieved historically. However, the scale of Wessex Water's outperformance payments raises questions as to whether the historical upper quartile methodology was insufficiently stretching over the 2015-20 period.
ODI incentives
About 40% of the PR14 PCs had reputational incentives attached. As noted earlier, the sector outperformed an equal proportion of financial and reputational PCs over the 2015-20 period (about 66%). Nevertheless, most stakeholders told us that in practice, reputational incentives were less effective at driving performance improvements than financial incentives. Financial ODIs were also more effective in compensating consumers, as shows in the ‘Beast from the East’ case study below. Stakeholders suggested that reputational incentives were most effective when all companies had a common measure that could be reported as part of a league table.
Case study 3: ‘Beast from the East’23
Following a period of cold weather in late February and early March 2018 (known as the ‘Beast from the East’), the impact of a rapid thaw on the water network resulted in over 200,000 customers in England and Wales being without water for more than four hours and over 60,000 customers being without water for more than 12 hours. Five companies (Bristol Water, Thames Water, Severn Trent, Southern Water and South East Water) indicated that they failed either their supply interruptions or
23 Ofwat, ‘Out in the cold’, June 2018.

PR14 Review: Discussion paper on findings
33
leakage PCs in 2017-18 as a result of the freeze-thaw event. These companies paid out £7 million to customers as a result.
At PR14, companies had the flexibility to define their own ODI rates and they did so based on ‘willingness to pay’ evidence they obtained through engagement with customers. However, such valuation techniques had limitations. This approach resulted in a wide range of estimates of customers’ valuations for similar services across companies. For example, in December 2014 companies’ estimates of customers’ willingness to pay for avoidance of sewer flooding ranged from £25,500 to £434,300 per property.
In addition to being based on a wide variation of valuations, at PR14 the definitions of PCs were different for each company and we did not undertake a comparison of the rates. As the Severn Trent Water external sewer flooding case study below illustrates, a more comparative approach to setting ODI rates may have helped mitigate the risks customers face through ODI misspecification.
Case study 4: Severn Trent Water’s external sewer flooding ODI rate
In 2018, we considered whether Severn Trent Water’s overall cap on ODI outperformance payments for the 2015-20 period, which had been reached, should be increased.24 Otherwise the company would no longer have had any financial incentive to improve its wastewater service.
This work revealed that the company’s ODI rate for external sewer flooding was significantly higher than the ODI rate of other companies with a similar PC. We agreed that the cap could be increased, but we reduced Severn Trent Water’s external sewer flooding ODI rate by 85% to bring it more into line with other companies. We also made the adjustment to Severn Trent's ODI cap conditional on the company also accepting adjustments to the associated PCLs, to improve benefits for customers. This ensured that the level of outperformance payment was proportionate with the benefits delivered to customers and mitigated the risk that the original ODI rate was miss-specified.
This case study suggests that the application of a more comparative approach to setting ODI rates (for example as undertaken at PR19), would have prevented ODI misspecification and the harm to customers that could subsequently arise.
24 Ofwat, ‘Final determination of in-period ODIs for 2018’, December 2018.

PR14 Review: Discussion paper on findings
34
In many cases, companies proposed and we accepted ODI rates that were substantially different on the upside as compared to the downside – ‘asymmetric’ ODI rates.
While asymmetric ODI rates were sometimes justified, for instance because customers did not want to pay for outperformance, in some cases this asymmetry may have limited customer benefits. One example of this might have been Thames Water internal sewer flooding ODIs, outlined in the case study below.
Case study 5: Thames Water’s asymmetric ODI rates for internal sewer flooding
In the 2015-20 period, Thames Water’s ODI rates for internal sewer flooding were asymmetric. The underperformance ODI rate was nearly twice the outperformance ODI. Thames Water started the period as one of the worst performers in the sector in this area, and the high underperformance rate gave Thames a strong incentive to improve and achieve its PCL.
Thames did significantly improve its performance over the period. It had very poor performance in 2015-16 and made a substantial underperformance payment in that year, which would have been greater if not for the PC collar. But, in the following years, its performance improved and it received outperformance payments. However, these were insufficient to offset the underperformance payments and it made net payments of around £6.5 million.
The asymmetric incentive rates would be consistent with customers having “diminishing returns”, such that the impact of each unit reduction in flooding had a greater impact when the company was underperforming than when it was outperforming. However, this seems unlikely to be the case.
This raises a question of whether it might have been appropriate for Thames Water’s outperformance ODI rate to be higher, as the company could have been incentivised to deliver further reductions in sewer flooding.
Deadbands
At PR14, about 46% of financial ODIs included deadbands to allow for a degree of out and underperformance before a payment was triggered.
Some stakeholders were of the view that deadbands were relevant in areas where performance was influenced by factors outside of management control, such as weather conditions. Bristol Water and South East Water said that deadbands protected companies and customers from small variances in performance that might otherwise

PR14 Review: Discussion paper on findings
35
have resulted in an outperformance or underperformance payments, such that immaterial fluctuations from the PCL were not financially incentivised.
However, others noted that deadbands could weaken the incentives to improve performance, particularly when applied to PCs where companies had greater control over the performance they delivered for customers. South Staffs Water and Thames Water said that if set too wide, the cost of investment to go beyond that level may be higher than the benefit that could be achieved. Thames Water and Southern Water were of the view that deadbands worked in water quality compliance and sewerage treatment works compliance, where the targets were set at the statutory requirement of 100% and the deadband became the de facto target for the purpose of accruing ODI payments. To understand the extent to which deadbands impact incentives, we compared companies’ performance level against their deadbands. Figure 3.5 shows the distribution of performance achieved as a percentage of the deadband levels for each PC with deadbands, in any given year of the 2015-20 period. We separated the analysis into two groups, presented in two charts. In the top chart we compared the PCs where companies underperformed in any given year of the 2015-20 period against the underperformance deadbands. In the bottom chart we compared the PCs where companies outperformed in any given year of the 2015-20 period against the outperformance deadbands.
Deadbands seem to have insulated companies more on the downside than on the upside. Performance clustered around the bottom of the deadband, rather than being spread uniformly across the deadband. 8% of PCs where companies underperformed in any given year were concentrated at or just before (i.e. between 0% and 1% distance) the level of the underperformance deadband. This suggests that companies made more limited efforts to improve performance within the underperformance deadband.
We would not expect clustering around the top of outperformance deadband. This is because no ODI payments applied until companies exceeded this threshold, giving them little incentive to stop improving performance once they were near this point. Instead, if companies are not expecting to exceed the deadband, there may be an incentive to reduce effort in improving performance, with performance sinking towards the PCL. However, we do not see this. Indeed, we still see some clustering around the top of outperformance deadbands, although this is less prominent compared to the underperformance deadbands. This suggests that outperformance deadbands may have had a more limited impact on incentives than underperformance deadbands. It is possible that the reputational impact of failing a PCL incentivises companies to exceed it by a margin, even where there is no direct financial incentive.

PR14 Review: Discussion paper on findings
36
Figure 3.5: Distribution of performance achieved annually vs deadbands, 2015-20
Note: A percentage difference of 0% means that underperformance levels were at exactly the level as the bottom of the underperformance deadbands. A difference of 100% means it met the PCL. A negative percentage difference means that the underperformance levels were outside the underperformance deadbands, hence underperformance payments were applied. The analysis excludes compliance PCs.

PR14 Review: Discussion paper on findings
37
Note: A percentage difference of 0% means that the outperformance levels were at the top of the outperformance deadband. A score of -100% means the PCL was met. A positive percentage difference means that the outperformance levels were outside the outperformance deadbands, hence outperformance payments were applied. The analysis excludes compliance PCs.
Source: Ofwat analysis.
In some cases, deadbands were one-sided only. This appears to have led to perverse consequences as illustrated in the case study below, which highlights how one-sided deadbands can lead to customers receiving poorer service while also making outperformance payments.
Case study 6: Northumbrian Water’s one sided supply interruptions deadbands
Northumbrian Water was a top performer for water supply interruptions in 2014-15 and the target levels were set at the sector historical upper quartile, at levels worse than the company had delivered historically. In addition, Northumbrian Water lacked outperformance deadbands for this PC, meaning that any small outperformance was rewarded, while it had a generous underperformance deadband, shielding the company from incurring underperformance payments for underperforming up to a certain level.
Over the 2015-20 period, it received a net outperformance payment of almost £8 million for outperforming its water supply interruption performance levels, despite its

PR14 Review: Discussion paper on findings
38
performance deteriorating by 2.2 minutes per property between 2014-15 and 2019-20.
As with case study 2, it is important for companies to be able to earn outperformance payments, where the outperformance is due to their efforts to deliver for consumers. And unless we set PCLs at the industry frontier, there is always the possibility that some companies may earn ODI outperformance payments despite delivering worse performance than they have achieved historically. Nevertheless, the one-sided deadband may have led to excessive rewards being paid by consumers in this case.
Caps and collars
About 72% of financial ODIs at PR14 included caps on the level of outperformance payments, to limit rewards and their consequent impact on customer bills. Likewise, a similar proportion of ODIs included underperformance payment collars to limit the risk to companies of having to make substantial payments for underperformance (but not removing companies’ exposure to enforcement action).
Stakeholders told us that, overall, caps and collars were a positive feature of the PR14 outcomes framework and on balance, they worked reasonably well at mitigating risks for companies and for customers. Southern Water told us that the existence of caps and collars was important in being able to carry out cost benefit analyses. They said that this would have been far more challenging in the absence of caps or collars with open-ended under or over performance payments. We note that this suggests that the analysis may be ignoring the real impact on consumers of exceeding a cap or falling below the collar, and so distorting their cost benefit analysis.
Collars can also reduce payments for poor performance to consumers and, as with deadbands, both caps and collars can limit incentives for companies to improve performance at times. This is illustrated in the case study below, and in case study 4 above on Severn Trent Water’s external sewer flooding ODI cap.
Case study 7: Thames Water leakage management
In 2018, an Ofwat enforcement investigation found that Thames Water had breached two of its legal obligations through poor leakage management, which fell well below its collar. Notwithstanding the price control incentive mechanisms in any performance area, a company must comply with its legal obligations. And our Final

PR14 Review: Discussion paper on findings
39
Determinations for PR14 made clear that where performance fell below the level of the penalty collar, we would consider enforcement action.
The investigation found that the incentives created by the leakage PC did not appear to sufficiently incentivise Thames Water to have adequate management and oversight of its leakage performance. Some of the papers disclosed in the investigation suggest that the company perceived that the maximum underperformance payment for missing the leakage PC was relatively small compared with the additional investment needed to improve performance. The company did not appear to attach sufficient weight in its assessment of the relative costs of investment to the impact of its performance on customers or its underlying legal duties.
This suggests that collars can distort incentives if companies do not put sufficient weight on wider considerations.
As with deadbands, we compared the performance companies achieved against their caps and collars. We calculated the distribution of performance achieved as a percentage of the cap and collar levels for PCs, with caps and collars in any given year of the 2015-20 period. Figure 3.6 presents the results separated for underperformance collars and Figure 3.7 shows the results for outperformance caps.
Of the 72% of financial ODIs with caps on the level of outperformance payments, in 12% of the cases the level of performance exceeded the cap and customers were protected against paying for this additional performance. Likewise, in 12% of cases companies achieved a level of underperformance which was worse than the collar, and companies were protected from incurring additional underperformance payments (but without removing their exposure to enforcement action).
These levels of protection are in line with our expectation of companies' behaviour, given that in most cases we set caps at the P90 level and collars at the P10 level, which implied that we expected performance to go beyond the caps around 10% of the time and, similarly, below the collars around 10% of the time. This suggests that caps and collars offered the expected level of protection to both consumers (against paying for additional outperformance through their water bills), and also to companies (against incurring additional underperformance payments).
Figure 3.6 also show that where companies underperformed, their performance clustered towards the collars, despite the fact that they would not incur additional underperformance payments beyond that point. This may be because most companies factored in wider considerations, including enforcement action (in contrast to the findings from case study 7). On the outperformance side, Figure 3.7 shows attempts to

PR14 Review: Discussion paper on findings
40
improve performance do seem to have reduced when companies hit the cap, as performance does thin out over that level.
Figure 3.6: Distribution of performance achieved annually vs collars, 2015-20
Source: Ofwat analysis Note: A percentage difference of 0% means that the underperformance levels were at exactly the same level as the collar. A positive (negative) percentage difference means that the underperformance levels were above (below) the collar.
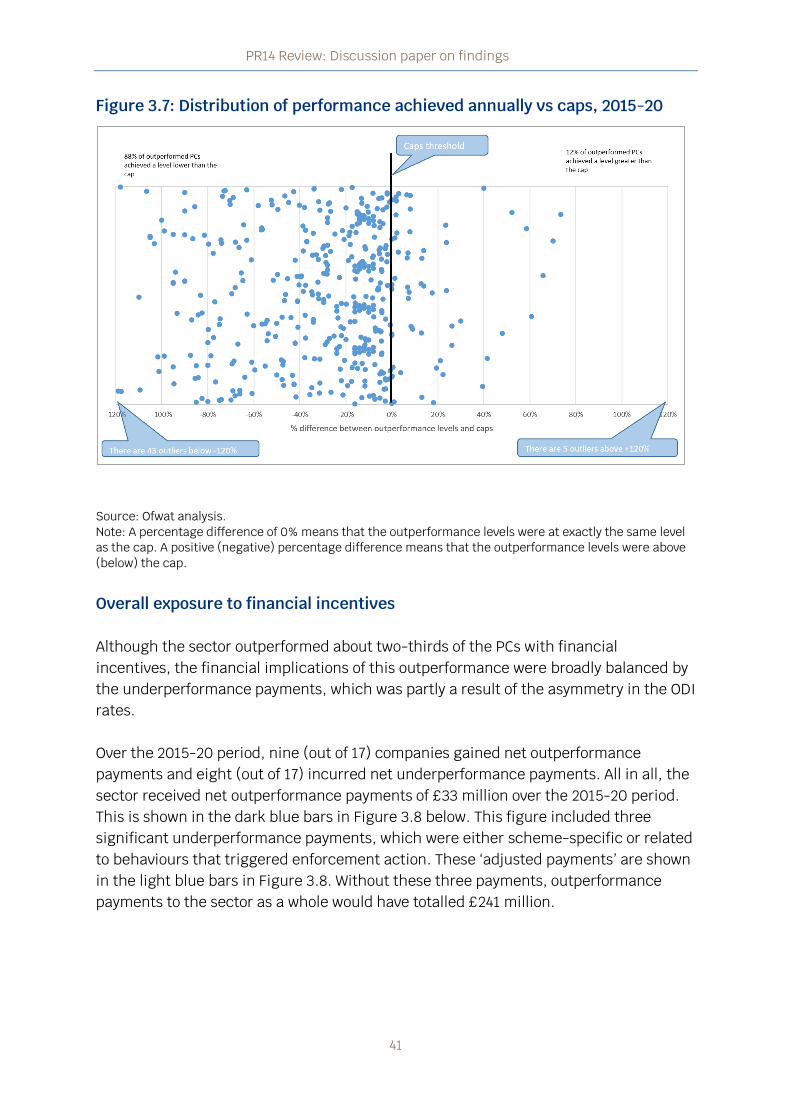
PR14 Review: Discussion paper on findings
41
Figure 3.7: Distribution of performance achieved annually vs caps, 2015-20
Source: Ofwat analysis. Note: A percentage difference of 0% means that the outperformance levels were at exactly the same level as the cap. A positive (negative) percentage difference means that the outperformance levels were above (below) the cap.
Overall exposure to financial incentives
Although the sector outperformed about two-thirds of the PCs with financial incentives, the financial implications of this outperformance were broadly balanced by the underperformance payments, which was partly a result of the asymmetry in the ODI rates.
Over the 2015-20 period, nine (out of 17) companies gained net outperformance payments and eight (out of 17) incurred net underperformance payments. All in all, the sector received net outperformance payments of £33 million over the 2015-20 period. This is shown in the dark blue bars in Figure 3.8 below. This figure included three significant underperformance payments, which were either scheme-specific or related to behaviours that triggered enforcement action. These ‘adjusted payments’ are shown in the light blue bars in Figure 3.8. Without these three payments, outperformance payments to the sector as a whole would have totalled £241 million.

PR14 Review: Discussion paper on findings
42
Figure 3.8: Net payments for financial incentives during PR1425 (2012-13 prices)
Source: Ofwat analysis. Note: The figures include payments for water, wastewater, and retail PCs. SIM payments are not included. The adjusted net payments exclude a £15 million underperformance payment in 2015-16 that was incorporated into enforcement action against Southern Water. They also exclude a cumulative underperformance payment on leakage of £63 million applied to Thames Water over the 2016-20 period, which led to enforcement action as it resulted in the company failing to meet its statutory obligations. Finally, it also excludes an underperformance payment of £130 million by Thames Water for the non-delivery of the Counters Creek strategic sewer scheme.
These net outperformance payments occurred despite companies’ concerns that the asymmetric ODI rates resulted in an expectation of negative ODI payments. We discuss companies’ estimated risk ranges for ODI payments further in section 6 which reviews the balance of risk and return.
Overall focus of the regime
In this section we consider the overall focus of the regime. As we have outlined above, PR14 significantly increased the focus on customer outcomes, and this is widely seen as a key success of the regime. However, as set out above, the longer-term horizon could have been given a greater focus. PR14 also included commitments to deliver improvements to the environment, which were not explicit under the historic outputs-based approach, as well as social issues such as vulnerability. We consider these issues further in this section.
25 This excludes the Service Incentive Mechanism (SIM) which had out/underperformance adjustments equivalent to +6% to -12% of the retail revenue in the 2015-20 period.

PR14 Review: Discussion paper on findings
43
At PR14, companies committed to more than 70 (out of the 571 PCs) PCs to maintain and improve the environment. Nearly all were bespoke and reflected important environmental priorities for companies and their customers. Roughly half had financial ODIs attached.
Overall, where companies had environmental performance commitments, we saw a general improvement during the 2015-20 period. Companies met their over 70% of their PCLs. Despite this, the Environment Agency rated four out of the nine water and wastewater companies in England as poor or requiring improvement in 2019. This compares to two out of the nine companies being rated as requiring improvement in 2014. It stated that companies’ environmental performance in 2019 was ‘simply unacceptable’ with ‘significant improvement’ needed to meet expectations.26 And while Natural Resources Wales has seen performance improve for the two Welsh companies in 2019, it nevertheless, noted that there was room for both companies to improve their environmental performance.27
While these PCs covered a range of activity which is not covered in the Environment Agency’s Environmental Performance Assessment, this may suggest that PC levels could have been more stretching in some of these areas, or that out-performance incentives used for these PCs might have been stronger, perhaps through greater use of financial ODIs.
We provide more details on the progress which has been achieved on environmental issues during the 2015-20 period in the box below.
Progress on environmental issues during PR14
We have considered performance on a subset of PR14 environmental PCs which were comparable between companies:
• Companies had many PCs which measured pollution incidents. This includes those measuring category 3 wastewater pollution incidents, where there was an overall 36% reduction over the 2015-20 period. Meanwhile five companies had PCs that solely measured the more serious category 1 and 2 incidents that were expected to reduce to zero by 2019-20. And two companies had PCs that solely measured pollution incidents for the water network, such as those that can occur at water treatment works. Performance on these has been mixed – while there is a downward trend in serious pollution incidents it is not fast
26 Environment Agency, Annual performance of Water and sewerage companies in England. 27 Natural Resources Wales, Annual performance reports for Dŵr Cymru and Hafren Dyfrdwy.
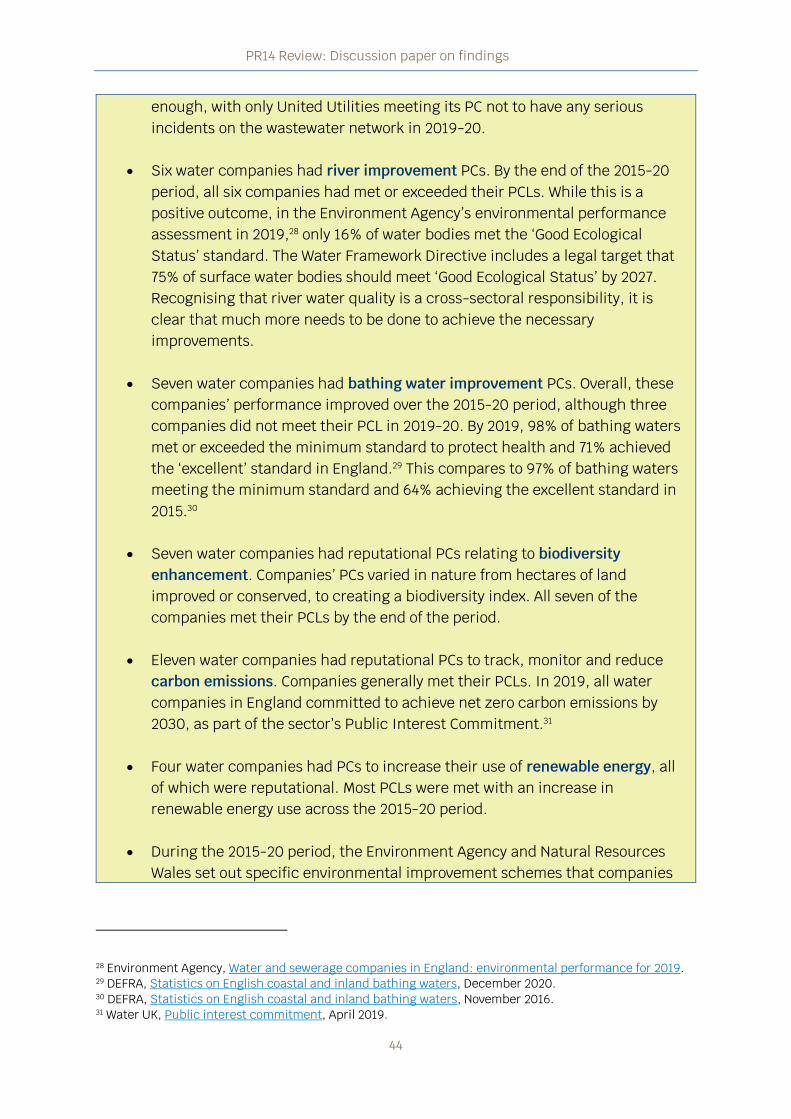
PR14 Review: Discussion paper on findings
44
enough, with only United Utilities meeting its PC not to have any serious incidents on the wastewater network in 2019-20.
• Six water companies had river improvement PCs. By the end of the 2015-20 period, all six companies had met or exceeded their PCLs. While this is a positive outcome, in the Environment Agency’s environmental performance assessment in 2019,28 only 16% of water bodies met the ‘Good Ecological Status’ standard. The Water Framework Directive includes a legal target that 75% of surface water bodies should meet ‘Good Ecological Status’ by 2027. Recognising that river water quality is a cross-sectoral responsibility, it is clear that much more needs to be done to achieve the necessary improvements.
• Seven water companies had bathing water improvement PCs. Overall, these companies’ performance improved over the 2015-20 period, although three companies did not meet their PCL in 2019-20. By 2019, 98% of bathing waters met or exceeded the minimum standard to protect health and 71% achieved the ‘excellent’ standard in England.29 This compares to 97% of bathing waters meeting the minimum standard and 64% achieving the excellent standard in 2015.30
• Seven water companies had reputational PCs relating to biodiversity enhancement. Companies’ PCs varied in nature from hectares of land improved or conserved, to creating a biodiversity index. All seven of the companies met their PCLs by the end of the period.
• Eleven water companies had reputational PCs to track, monitor and reduce carbon emissions. Companies generally met their PCLs. In 2019, all water companies in England committed to achieve net zero carbon emissions by 2030, as part of the sector’s Public Interest Commitment.31
• Four water companies had PCs to increase their use of renewable energy, all of which were reputational. Most PCLs were met with an increase in renewable energy use across the 2015-20 period.
• During the 2015-20 period, the Environment Agency and Natural Resources Wales set out specific environmental improvement schemes that companies
28 Environment Agency, Water and sewerage companies in England: environmental performance for 2019. 29 DEFRA, Statistics on English coastal and inland bathing waters, December 2020. 30 DEFRA, Statistics on English coastal and inland bathing waters, November 2016. 31 Water UK, Public interest commitment, April 2019.

PR14 Review: Discussion paper on findings
45
were required to deliver as part of the National Environment Programme (NEP). Both Welsh companies delivered 100% of their five year expected NEP requirements by 2019-20.32 In England, the Environment Agency noted that in 2019, “sector performance deteriorated to its worst since EPA reporting began” and “only 3 companies… reported 100% delivery of their programme within planned deadlines compared to 8 companies in 2018”.33
PR14 also included some PCs to help vulnerable customers, but these were not used consistently by all companies. However, during the 2015-20 period, we encouraged companies to do more to deliver for customers in vulnerable circumstances outside the price control. And companies responded, making significant progress in improving and expanding the help available to vulnerable customers.
For example, we published our ‘Vulnerability focus report’ in 2016, which outlined our expectation that companies should be delivering a truly inclusive service for all customers. Following the Beast from the East in March 2018, we highlighted that companies were inconsistent in their approach to identifying and supporting customers in vulnerable circumstances. As a result, we said companies should be proactive in understanding the needs of customers in vulnerable circumstances on an ongoing basis, and have the ability to provide tailored support that can be offered during business as usual and emergency situations.34
By the end of 2019-20, about 723,000 households were supported through social tariff schemes, an increase of 597,000 households since 2014-15.35 In April 2019, water companies committed to make bills affordable for all households where water bills account for more than 5% of their disposable income by 2030.36
32 Environment Agency, Environmental Performance Assessments (EPA) results 2019. 33 Environment Agency, ‘Water and sewerage companies in England: environmental performance report for 2019’, October 2020. 34 Ofwat, Out in the Cold, June 2018, p. 27. 35 CCW, Water for All report 2019-20: Supplementary data, November 2020. 36 Water UK, Public Interest Commitment, April 2019.

PR14 Review: Discussion paper on findings
46
Setting parameters key findings
• A majority of companies’ PR14 performance commitments were bespoke. This often made cross company comparisons difficult, and limited our ability to undertake comparative assessments of performance to improve services for customers.
• Performance commitment levels were insufficiently stretching in some cases, in part due to difficulties comparing PCs, as well as the insufficiently challenging historical upper quartile approach which we used to set PCLs for a number of companies’ comparable PCs
• Although companies outperformed similar proportions of reputational and financial PCs, stakeholders told us that in practice reputational incentives were less effective at driving performance improvement than financial incentives. They also noted that reputational PCs were most effective when all companies had a common measure that could be reported as part of a league table.
• ODI rates did incentivise performance improvements and reduced bills where service was not sufficient, but in some cases they could have been better calibrated.
• Caps and collars mitigated risks for companies and for customers, as intended, particularly the risks of either party incurring excessive payments through misspecification of PCL targets and ODI rates. However, they may have distorted incentive to improve.
• Although the outcomes regime increased the focus on the environment relative to the previous outputs regime, we could have incentivised performance improvements more strongly.
• Companies made significant progress in improving and expanding the help available to vulnerable customers during the 2015-20 period, although some progress was achieved outside the scope of the price review.

PR14 Review: Discussion paper on findings
47
4. Securing value for money for customers
Key findings
Based on our assessment of our approach to securing value for money for customers during the 2015-20 period, we found that:
• Companies spent £45 billion (2012-13 prices) over the 2015-20 period. This is broadly in line with PR04 and PR09 (£44 billion) however improved outcomes suggest overall better value for money for customers.
• The move to a totex framework encouraged a more efficient balance of opex and capex solutions, increasing the historically flat opex share by 9 percentage points to 52%. But there is still further to go to encourage companies to deliver efficiency benefits by adopting innovative totex solutions.
• Our allowances were broadly appropriate and in line with aggregated company business plans. While the sector overspent its wholesale allowances by 3.7%, this was at least partly because of expenditure brought forward in the latter part of the period in preparation for PR19. A greater focus on innovation may have reduced costs, and improved value for money further.
Introduction
The sector incurred a total of £45 billion over the PR14 period. This compares with total costs of £44 billion over PR09, £44 billion over PR04 and £40 billion over PR99.37 However, as set out in Section 4, outcomes increased so value for money improved overall.
Here we consider whether our approach at PR14 helped drive this value for money. A key aim of price controls is to ensure that customers only pay efficient costs for the services they receive. This is done by estimating efficient cost allowances. If these estimates are too high, customers pay more than they need to. And if they are too low, companies may not have sufficient funds to cover their costs, which can have knock on impacts on consumers for example created by financeability issues.
37 Figures on expenditure prior to AMP6 show total costs (covering both wholesale and retail), as accounting separation only took place during AMP5. All figures RPI real 2012-13 prices.

PR14 Review: Discussion paper on findings
48
Companies may in practice spend more or less than the cost estimates. In PR14, such over and underspends were shared between companies and customers. This gives companies an incentive to be efficient while also sharing cost uncertainty risk with customers. This reduces bills in PR14 and helps reduce cost estimates in future price controls, such as PR19.
PR14 moved from an approach where capital expenditure (capex) and operating expenditure (opex) were assessed separately to an approach where we set wholesale cost allowances for total expenditure (totex). The totex approach went hand in hand with the move from outputs to outcomes, as it allowed companies more flexibility to deliver customer outcomes in the most efficient way. It sought to address a potential bias towards capex solutions, which companies had tended to favour as they were added to the RCV, by considering capex and opex solutions on a level playing field.
We based the cost allowances on econometric models as well as estimates that companies provided. We incentivised companies to reveal efficient costs in their business plans through business plan incentives, including more favourable cost-sharing rates.
In this section, we consider the extent to which PR14 did deliver value for money. It considers:
• Impact of totex: we first consider the totex regime, which was the key change in PR14, considering whether companies had greater flexibility to deliver for their customers in the most efficient way as a result of moving from capex / opex allowances to totex allowances.
• Estimated allowances: we then consider whether, overall, our approach to estimating costs resulted in customers paying appropriate contributions towards totex.
Impact of totex approach
Stakeholders that responded to our call for inputs were broadly in agreement that the totex framework facilitated a cultural shift away from approaches that are biased towards RCV additions, towards more consideration of whole life cost, with greater flexibility and innovation in solutions that may not have been considered under a capex / opex regime. Some suggested that the totex approach facilitated greater openness towards collaboration and partnership-oriented ways of funding and operating because contract payments would be treated equally with in-house capital expenditure from a regulatory perspective. Only a minority of companies told us that the totex approach did not significantly shift the balance of opex and capex for them because they were already considering investment on a whole life cost basis.
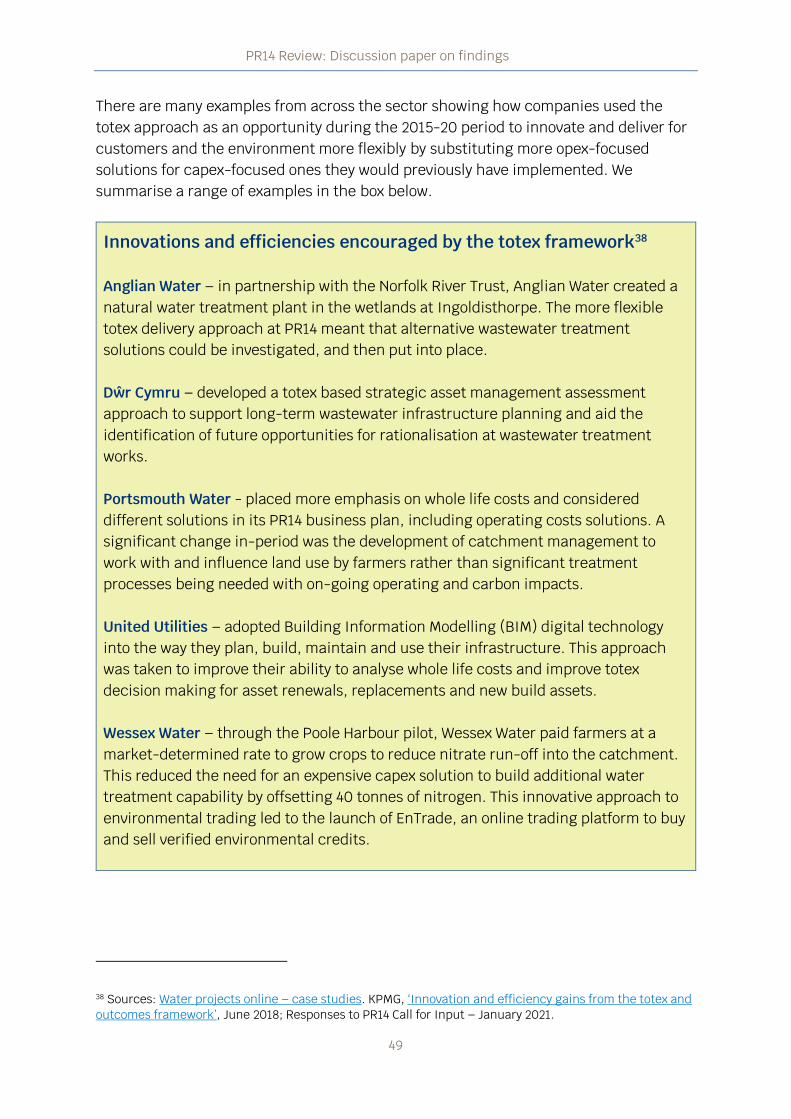
PR14 Review: Discussion paper on findings
49
There are many examples from across the sector showing how companies used the totex approach as an opportunity during the 2015-20 period to innovate and deliver for customers and the environment more flexibly by substituting more opex-focused solutions for capex-focused ones they would previously have implemented. We summarise a range of examples in the box below.
Innovations and efficiencies encouraged by the totex framework38
Anglian Water – in partnership with the Norfolk River Trust, Anglian Water created a natural water treatment plant in the wetlands at Ingoldisthorpe. The more flexible totex delivery approach at PR14 meant that alternative wastewater treatment solutions could be investigated, and then put into place.
Dŵr Cymru – developed a totex based strategic asset management assessment approach to support long-term wastewater infrastructure planning and aid the identification of future opportunities for rationalisation at wastewater treatment works.
Portsmouth Water - placed more emphasis on whole life costs and considered different solutions in its PR14 business plan, including operating costs solutions. A significant change in-period was the development of catchment management to work with and influence land use by farmers rather than significant treatment processes being needed with on-going operating and carbon impacts.
United Utilities – adopted Building Information Modelling (BIM) digital technology into the way they plan, build, maintain and use their infrastructure. This approach was taken to improve their ability to analyse whole life costs and improve totex decision making for asset renewals, replacements and new build assets.
Wessex Water – through the Poole Harbour pilot, Wessex Water paid farmers at a market-determined rate to grow crops to reduce nitrate run-off into the catchment. This reduced the need for an expensive capex solution to build additional water treatment capability by offsetting 40 tonnes of nitrogen. This innovative approach to environmental trading led to the launch of EnTrade, an online trading platform to buy and sell verified environmental credits.
38 Sources: Water projects online – case studies. KPMG, ‘Innovation and efficiency gains from the totex and outcomes framework’, June 2018; Responses to PR14 Call for Input – January 2021.

PR14 Review: Discussion paper on findings
50
Views differed about the scope for efficiency gains through shifting to opex. Some companies considered that in their experience in the medium to long-term, opex and capex are substitutable for most base expenditures and some enhancement expenditures. Others noted that opex solutions had the greatest influence in areas of short-term service delivery and investment where capital solutions are not as viable such as catchment management. There was also a concern that the increase in opex may not always be beneficial in the long term. Concerns about focus on short term are discussed in Section 4.
There was recognition among the stakeholders we engaged with that the totex approach may take time to bed in, and the full impact may not be seen for several price controls. During the early stages of implementation, companies were developing their approaches to totex planning and governance, and there was some potential for their operations, capital delivery, asset management, regulation and finance functions to pull in slightly different directions. Some stakeholders also noted that credit rating agencies continued to treat capex and opex distinctly, with opex having a more detrimental impact on key interest cover ratios.39
Our engagement with members of the supply chain also painted a mixed picture. We heard that there was greater interaction with the supply chain around whole life costs and potentially innovative opex-focused solutions, including making better use of existing assets and proactive maintenance. However, the supply chain reported that adoption varied by company, with some making more of the totex approach than others. They also said that totex was often discussed with supply chain as a key driver of change resulting from regulation, but then not translated down to project or procurement level. We received consistent feedback about the need for culture change on this issue within the industry. We heard that this was not just on the company side: entrenched views exist in the supply chain too, partly depending on the products and services that individual suppliers offer and their capabilities and resources.
The data does suggest that there has been a move to using more opex. Figure 4.1 displays the trend in the share of capex and opex as a percentage of total expenditure. It shows that the capex share of total expenditure for the sector as a whole was just over 58% on average, and barely changed, in the three price review periods prior to PR14. Following the introduction of the totex framework in PR14, the sector’s capex share fell by 9 percentage points from 57% in the 2010-15 period to 48% in the 2015-20 (with the opex share increasing to 52% in 2015-20, up from 43% in 2010-15). These
39 There may also be elements of our framework that still create a bias towards capex. These are discussed in Ofwat, PR24-and-Beyond-Creating-tomorrow-together.pdf (ofwat.gov.uk), May 2021, pp. 97-112.

PR14 Review: Discussion paper on findings
51
long-term trends were similar in wholesale water and wholesale wastewater40 and of a similar magnitude in both capital maintenance and capital enhancement.41
Figure 4.1: Sector share of capex and opex42, PR99 to PR1443
Source: Ofwat analysis
Our analysis at the company level also shows that nearly all companies experienced a drop in their capex share in the 2015-20 period, ranging from 4 to 16% from their levels in the previous price review period. The only exception was Portsmouth Water, whose capex share was unchanged from its PR09 level of 32%, the lowest in the industry (Figure 4.2).
40 In PR14, the capex share in water was 44%, down from 52% in PR09; an 8 percentage points fall. In wastewater, the capex share dropped by 9 percentage points to 53% in PR14, down from 62% in PR09. 41 The drop of 9 percentage points of the sector’s wholesale capex share from PR09 to PR14 was fairly split across capex capital maintenance and enhancement. The share of wholesale capital maintenance on total spend dropped by 5 percentage points from 36% in PR09 to 31% in PR14. The share of enhancement as a percentage of total spend dropped by 4 percentage points from 22% in PR09 to 18% in PR14.
58% 60% 57%
48%
42% 40% 43%
52%
Average PAYG rate for sector in FDs 56%
0%
20%
40%
60%
80%
100%
PR99 PR04 PR09 PR14
Share
(%
)
Total Capex share Total Opex share

PR14 Review: Discussion paper on findings
52
Figure 4.2: Change in capex share from PR09 to PR14,44 percentage points by company
Source: Ofwat analysis using data from the reconciliation models Note: SVE and HDD are excluded from this chart because we could not back calculate the figures with the data we had available.
We recognise that a contributing factor to this apparent rebalancing could also be the accounting reclassification of some infrastructure renewals expenditure (IRE) from capital to operating expenditure. As such, the real world rebalancing of solutions may not be as pronounced as the raw data suggests.
In their PR14 final determinations, ‘pay-as-you-go’ (or PAYG) rates averaged 56% across the sector. These reflected the forecast share of total expenditure that would not be capitalised in the RCV, and as such might be considered a proxy for ex-ante expectations of the outturn share of opex.45 Opex made up 52% of companies’ actual expenditure at PR14. Therefore, it might be argued that that less opex was used across the sector than was expected at the start of the period, although still more than historical spend.
44 To ensure comparability, opex costs exclude retail costs in all price reviews considered in this analysis. 45 One important caveat however is that PAYG also included infrastructure renewals expenditure expensed in year and uplifts for financeability for three companies (although the latter are likely to be immaterial).

PR14 Review: Discussion paper on findings
53
Flexibility to deliver for customers key findings
• The totex framework facilitated a cultural shift towards more consideration of whole life cost, and flexibility and innovation in solutions that may not have been considered under a capex / opex regime.
• However, this is a journey that may take time to fully embed in companies and supply chains, and the full impact of opportunities for more balanced capex/opex solutions may not be seen for several price controls.
• The totex framework encouraged a more efficient balance of opex and capex solutions, increasing the historically flat opex share by 9 percentage points to 52%. But there is still further to go to encourage companies to deliver efficiency benefits by adopting innovative totex solutions.
Estimated allowances
In this section we discuss the accuracy of our overall cost estimates. If these estimates are too high, customers pay more than they need to. And if they are too low, companies may not have sufficient funds to cover their costs, which can have knock on impacts on consumers for example created by financeability issues.
We first compare outturn wholesale spend with companies’ allowances and business plans, finding a slight overspend. We then consider the causes of this overspend, looking at anticipatory investment in PR19, levels of efficiency, the impact of service improvements and the technical specification of the model.
Comparison of business plans, allowances and spend
Figure 4.3 displays companies’ business plan totex forecasts, our allowances and the actual totex spend, for each price control from PR99 to PR1446. All values we discuss in this section are in 2012-13 prices to allow comparability. PR14 costs are wholesale costs only - retail costs are discussed separately in section 7 on targeting controls.
The figure shows that the PR14 wholesale totex allowances aligned with companies’ business plan forecasts, with an efficiency challenge of less than 1%. This contrasts with previous price reviews where we typically set combined capex and opex allowances substantially below what companies forecasted in their business plans. And
46 Price reviews prior to PR99 have been excluded from this analysis due to a lack of comparable and consistent data.

PR14 Review: Discussion paper on findings
54
companies’ revised plans at Final Determinations were even more closely aligned with our views. 47
The PR14 allowance was slightly below what companies spent – with £41 billion spent compared to allowances of £39.5 billion.48 Given cost sharing, customers paid around 50% of this overspend. This contrasts with previous price reviews where companies either underspent or matched their allowances. The overspend was in water, rather than wastewater, with companies spending 11.2% above their allowances and also 10% above what they had forecast. In wastewater, we set allowances at the level companies forecasted in their business plans, and there was an underspend of 3.6%.
Figure 4.3: Business plan totex, allowances and spend, PR99 to PR14 (wholesale), 2012-13 prices
Source: Ofwat analysis using data from the totex reconciliation models.
Figure 4.4 shows the totex over and underspend in the 2015-20 period by company. Around half (eight out of 17) companies overspent their cumulative wholesale
47 Ofwat PR14 Final Determinations Investor Reference Pack, December 2014 48 In December 2020, we published our Service Delivery Report 2019-20 based on the data provided in companies’ annual performance reports. Based on the annual performance report data, the sector overspent its wholesale totex allowance for the 2015-20 period by 1%. However, the data in the annual performance reports is not a final statement on performance. Every year we scrutinise companies’ annual performance report data and where necessary we intervene and make adjustments. The adjustments we make to the totex data are only reflected in the totex reconciliation model at the end of the price review period. Companies do not update their annual performance reports to reflect these adjustments but may reflect updated data in the totex reconciliation models they submit for the price review. Therefore, the totex reconciliation model, not the annual performance reports, provide the final statement on totex spend for the 2015-20 period. The PR14 totex reconciliation model states that the sector overspent its wholesale totex allowance for the 2015-20 period by 3.7%. This is an increase from the 1% before adjustments (as per companies’ annual performance reports).

PR14 Review: Discussion paper on findings
55
allowances by between 2% and 12%. A total of 15 out of 17 companies overspent their cumulative water allowances and ten overspent by more than 5%. In contrast far fewer companies - four out of 11 - overspent their cumulative wastewater allowances and only United Utilities overspent by more than 5%.
Figure 4.4: Totex performance during the 2015-20 period, by company
Source: Ofwat analysis using data from the reconciliation models. Notes: (+) denotes totex overspend while (-) denotes totex underspend.
Investment in anticipation of PR19
Some of the wholesale totex overspend was the result of companies bringing forward investment from the 2020-25 period into 2018-19 and 2019-20. A number of companies reported in their annual performance reports that their overspend was, in whole or

PR14 Review: Discussion paper on findings
56
part, a result of this. 49 Many companies cited investments in the reduction of leakage, in particular, in preparation for meeting the tougher leakage targets set at PR19 and also the sector’s commitment to reduce leakage by 50% (from the 2017-18 levels) by 2050.50 This would explain why the overspend tended to be in water. Some also mentioned anticipatory investment in sewer flooding. Another factor which might have resulted in companies pulling forward expenditure may have been the more favourable cost sharing rates which applied in the 2015-20 period, as compared to those that we set in the PR19 final determination for the 2020-25 period.
Anticipatory investment is also consistent with annual totex performance. As shown in Figure 4.5 the majority of overspend is in the later years. This was true for most individual companies. This contrasts with previous reviews where companies would underspend in the first and last years of the price review, and companies’ cumulative expenditure was typically aligned with their cumulative allowances in the final year.51
Figure 4.5: Annual totex performance as a % of annual allowed totex in PR14, by wholesale control
Sources: Ofwat analysis using data from the reconciliation models. Note: (+) denotes totex overspend while (-) denotes totex underspend.
49 Competition and Markets Authority, '2019/20 data for base cost models – Working Paper', January 2021, p. 6 paragraph 10; and p. 18-19, paragraphs 45 – 51. 50 The 50% reduction in leakage by 2050 was a recommendation from the National Infrastructure Commission, ‘Preparing for a drier future: England’s water infrastructure needs’. April 2018, p. 13. 51 Ofwat, ‘Service delivery report 2019-20’, December 2020, page 8.

PR14 Review: Discussion paper on findings
57
Levels of efficiency
Part of the overspend also represents inefficiency. For example, Thames Water’s overspend of £777 million represents a significant proportion (over 53%) of the industry overspend. This was despite having asked for less than their allowance in their business plan (we capped the modelled water totex allowances at 5% above the company’s business plan totex). The company reports that this was a result of increasing expenditure on leakage and resilience, £90 million of which it acknowledged was a result of inefficient leakage costs.52
There are also more general concerns about a lack of innovation. We rarely saw innovation trials being adopted or rolled out and one estimate suggests that since 2011, productivity growth across the water sector has effectively been zero.53 This compares to productivity improvements of around 0.6% per year seen in similar sectors in the post-crisis period.54 This suggests customers could have received even more for their money, as innovation could have created the space for greater bill reductions or service improvements.55 Moreover, as discussed above, an element of capex bias may remain.
Impact of service improvements
Part of the wholesale totex overspend in the 2015-20 period may have been a result of companies spending more to deliver higher levels of the PCs than they committed to deliver. For example United Utilities, stated that it invested an extra £250 million in resilience, starting in 2016-17, designed to provide additional customer and environmental benefits both in the rest of the 2015-20 period and in the long term.56 It earned £38.86 million in ODI payments over the 2015-20 period.
More generally, we saw in Section 3 that companies did outperform about two-thirds of their PCs. So some fraction of the sector’s overspend during the 2015-20 period may have been efficiently incurred by companies which were attempting to earn ODI outperformance payments. We note however that companies earned £536m in gross outperformance payments over this period. If we take this figure to be an upper estimate for the totex companies efficiently incurred to earn ODI outperformance payments during AMP6, this would still compare to a sector overspend of approximately
52 Thames Water, performance 2019/20 53 Frontier Economics, ‘Productivity Improvement in the Water and Sewerage Industry in England since Privatisation – Final Report for Water UK’, September 2017, p.3, Figure 2. 54 Ofwat, ‘Reference of the PR19 final determinations: Cost efficiency – response to common issues in companies’ statements of case’, May 2020, p. 8 55 We have considered whether there was a correlation with under/over spend and cost sharing rates, but this analysis was inconclusive, and for brevity is not presented here. 56 United Utilities, performance 2019/20

PR14 Review: Discussion paper on findings
58
£1.5 billion.57 And the true sum spent on outperformance is likely to be significantly lower if companies’ underperformance implied an underspend and also because, as set out in Section 3, we consider we could have set more stretching PCLs.
Model accuracy
We have also considered whether the overspend was a reflection of the accuracy of our models. PR14 marked the beginning of econometric benchmarking models as a tool to set totex wholesale allowances. As it also coincided with the separation of price controls, it was the first time that we modelled totex allowances separately for wholesale water and wholesale wastewater.
Stakeholders suggested that our PR14 cost models had several weaknesses and, indeed, the Competition and Markets Authority (CMA) identified a number of limitations and issues with the models in its 2015 final determination for Bristol Water.58 Nevertheless, as shown in Figure 4.3 above, the models did reflect outturn spend quite closely at an industry level. Moreover, our models did not appear to systematically overfund some companies while underfunding others. This is shown in Figure 4.6, which plots the modelled efficiency challenge applied to companies’ business plans against the outturn totex performance. It shows that companies’ under or overspend of their allowances was not related to the efficiency challenge we applied to the totex in their business plans.59
57 Figures in 2012-13 prices. 58 Competition and Markets Authority, ‘A reference under section 12(3)(a) of the Water Industry Act 1991: Report’, October 2015. 59 The correlation between efficiency challenge and totex performance was weak and statistically insignificant, both in water (r=-0.09) and wastewater (r=-0.32).

PR14 Review: Discussion paper on findings
59
Figure 4.6: Totex performance vs modelled efficiency challenge in PR14, by company and price control
Source: Ofwat analysis using data from the totex reconciliation models. Notes: A negative efficiency challenge means that the company received an allowance below its first business plan submission. A positive totex performance means that the company overspent its allowance. The correlation coefficients are statistically insignificant at the 5% level of significance.
Estimated allowances key findings
• Companies’ wholesale costs were £41 billion (2012-13 prices) over the 2015-20 period which compared to a wholesale totex allowances of £39.5 billion - an overspend of 3.7% (of which customers bore around half). This overspend was at least partly because of expenditure brought forward in the latter part of the period in preparation for PR19. This may suggest that our allowances were generally accurate and did not allow companies significantly more than they required, suggesting that customers did not substantially overpay. However, there may have been scope for further efficiency and innovation over the period, which would have enabled companies to deliver more for customers with their allowances.

PR14 Review: Discussion paper on findings
60
5. Balancing risk and return
Key findings
Based on our assessment of the balance of risk and return during the 2015-20 period:
• We intended that returns should be aligned with efficiency and service quality and find evidence that our PR14 approach achieved this. We found a tendency for the best performers on ODIs and totex to achieve sector-leading RoRE, and that the worst performers in these areas were at the bottom of the cohort in overall return on regulatory equity (RoRE) terms.
• The sector’s weighted average RoRE over 2015-20 of 6.30% (real, RPI-deflated) was higher than the base allowed return on equity (5.65%), suggesting the sector overall modestly outperformed the PR14 package.
• This outperformance was mainly due to the various sources of positive. cashflow achieved by companies based on their ex-ante financing decisions (e.g. on embedded debt), rather than in-period risks materialising. Stripping out financing RoRE impacts, the weighted average RoRE would have been 5.35% for the period. This level of performance is consistent with a reasonable balance of risk and return
• In hindsight, the PR14 allowed return on capital was above the return required by companies and their investors. This is primarily due to interest rates being lower than expected at PR14 final determinations and outperformance by most companies on the allowed cost of debt. In line with regulatory practice that was commonplace at the time, we used a long trail of historical data to inform certain cost of capital inputs, resulting in allowances which did not anticipate the environment of low and falling finance costs that characterised 2015-20.
• Our financial monitoring framework increased the transparency and comparability of financial metrics reported by companies, making them more accessible to stakeholders and thus improving accountability.
• While some companies improved their financial resilience by reducing gearing and others plan to, our PR19 policy targeting financial resilience may also be responsible for these decisions. Several companies still have a credit rating that offers limited headroom above the investment grade floor. These companies tend to be highly geared or with significant exposure to risk from their derivatives portfolio. This underlines the continuing need to monitor financial resilience.

PR14 Review: Discussion paper on findings
61
Introduction
PR14 aimed to better align investor and management incentives with customers, with operational performance intended to have a greater impact on returns to investors than previous price reviews.
In making our PR14 determinations, we assessed how company returns might vary using the return on regulatory equity (RoRE) metric. RoRE expresses returns as a percentage of notional equity, providing a degree of standardisation across companies which may have different financing structures. We also drew on scenario-based modelling of RoRE, in order to better understand whether the balance of risk held by customers and shareholders was appropriate. We asked companies for the first time to express a RoRE risk range on a P10/P90 basis for selected building blocks of the price review (eg totex), such that there was a 10% probability of achieving a return below the identified range and an equal 10% likelihood of achieving a return above the identified range.
For wholesale controls, we largely maintained the core features of setting the allowed return from PR09 – i.e. a fixed cost of debt and the use of the Capital Asset Pricing Model (CAPM) to set the allowed return on equity. Two significant changes were the use of a benchmark index to set the allowed return on debt, and the adoption of a net margin60 approach for the newly-created retail controls.
In response to concerns that financing structures adopted by some companies may not be resilient to the full range of potential risks, we adopted a financial monitoring regime. This requires companies to report financial resilience metrics on a periodic basis, allowing stakeholders including ourselves to review and assess the risks to companies posed by companies’ financial structures.
We also launched a programme to put the sector in balance following concerns in 2018 about company performance, returns to investors, financial resilience and the extent to which these were aligned with customers' interests.61 Our objectives and the framework developed in that programme were adopted by our PR19 price review. For
60 Retail net margins were set at 1% for households (and non-households without choice in Wales) and 2.5% for non-households with choice in England and Wales 61 See Ofwat, Putting-the-sector-in-balance-position-statement-on-PR19-business-plans-FINAL2.pdf (ofwat.gov.uk), July 2018.

PR14 Review: Discussion paper on findings
62
example, in relation to dividend policies, our final determinations62 reiterated our expectations that companies should:
• set out details underpinning their approach to dividends and factors that influence dividends transparently in their published dividend policy;
• set out how their approach takes account of delivery for customers; • ensure that their dividend policy is clearly set out in their Annual Performance
Report and is consistent with all other narrative in relation to dividend policy or dividends declared or paid within the remainder of their Annual Performance Report, within their statutory accounts and within any other publication; and
• clearly signal any changes to their dividend policy in their Annual Performance Reports.
We also set out our expectations in relation to explanation of dividends declared or paid. In particular, that companies:
• set out how total dividends declared or paid have been determined and how they are consistent with the company’s dividend policy,
• clearly explain and provide justification for any deviations from the policy.
Our review of the outturn of the 2015-20 period focuses on four areas of risk and return for PR14:
• The overall balance of risk and return: whether PR14 better aligned the incentives of companies and consumer interests, such that companies with the strongest operational performance achieved higher returns than those lagging behind. In addition, whether the PR14 RoRE risk ranges provided a reasonable view of the outturn risks faced by companies over the 2015-20 period.
• The allowed return on capital: whether our approach to setting the base allowed return was reasonable, and supported incentives to raise capital efficiently, whether through equity or debt.
• Financial monitoring regime: whether our regime increased awareness of the risks of financial structures and reduced customers’ exposure to these risks.
• Wholesale Revenue Forecasting Incentive Mechanism (WRFIM): whether the new mechanism was associated with better incentives to forecast demand accurately.
62 Ofwat, PR19 final determinations, aligning risk and return technical annex, December 2019, pp. 117-118.

PR14 Review: Discussion paper on findings
63
The overall balance of risk and return
Our PR14 methodology and final determinations aimed to put in place a regime which would benefit customers by providing meaningful incentives to provide the best service at an efficient cost.
Return on Regulatory Equity (RoRE)
We can now compare outturn RoRE in PR14 with predicted RoRE ranges. This is shown in Figure 5.1, which features outturn RoRE over 2015-20 against our estimates of the RoRE ranges faced by each company that were produced for December 2014 final determinations. The risk ranges are comprised of separate P10 and P90 estimates for ODIs, totex, SIM and financing risks. We produced these estimates after analysing and engaging with companies on their forecast risk ranges and imposing our own assumptions where appropriate.63
The distribution of outturn RoRE performance was more balanced than at PR09. 9 out of 17 PR14 companies (53%) earned above the base RoRE from final determinations. This compares to the final three years of the preceding PR09 (2010-15) period in which 14 out of 18 companies (78%) of the sector outperformed base RoRE64.
Overall the sector earned a higher RoRE than the base RoRE implied by final determinations. The weighted average return on regulated equity (RoRE) over 2015-20 was 6.30%, compared to the PR14 allowed return on equity of 5.65%.65 This suggests that the sector on average modestly outperformed the PR14 package. As discussed in the following sections on totex, ODIs and financing – we attribute most of this outperformance in aggregate to financing outperformance.
63 Ofwat, ‘Final price determination notice: Policy chapter A7 – risk and reward’, p13, Figure A7.1 64 We are limited to using the final three years of the PR09 period due to a lack of sufficiently comparable RoRE data before this period. 65 Figures expressed in RPI-deflated terms assuming RPI of 2.8%

PR14 Review: Discussion paper on findings
64
Figure 5.1: Outturn RoRE and PR14 risk ranges (2015-20)
Note: Lighter colour bars denote the p10 outcome, darker colours the p90 outcome. Assumes PR14 notional gearing of 62.5% Source: Ofwat analysis of PR14 final determinations and Monitoring Financial Resilience (2020)
Companies told us that the fact that roughly half of the sector under- and out-performed base returns showed that PR14 struck a good balance between investors and customers. In support of this view, some responses also noted that only one company appealed its final determination. The Consumer Council for Water (CCW) on the other hand argued that PR14 was too generous to investors at the expense of customers – particularly with respect to the allowed return on capital.
We agree that that most of the sector enjoyed significant outperformance on financing costs, and set out evidence for this in the following sections. This is primarily as our financing RoRE risk ranges did not capture the extent to which factors relating to actual company financing structures were liable to drive out- or under-performance. Figure 5.2 sets out the RoRE contribution of operational (i.e. non-financing) outperformance against the comparable risk ranges we set out at PR14 final determinations. Stripping out financing performance results in a sector weighted-average achieved RoRE of 5.35%, which is more aligned with (and in fact slightly lower than) the allowed return on equity of 5.65%. The change also results in a broadly similar split of under- and outperforming companies, albeit with slightly fewer (7 vs 10) companies earning above base RoRE. We consider that this evidence is consistent with a reasonable balance of risk and return.
0.0%
2.0%
4.0%
6.0%
8.0%
10.0%
12.0%
ODI Totex SIM Financing Outturn Base return

PR14 Review: Discussion paper on findings
65
Figure 5.2: Non-financing outturn RoRE and PR14 risk ranges (2015-20)
Note: Lighter colour bars denote the p10 outcome, darker colours the p90 outcome. Assumes PR14 notional gearing of 62.5% Source: Ofwat analysis of PR14 final determinations and Monitoring Financial Resilience (2020)
Outturn RoRE offers evidence that our PR14 approach aligned returns with the operational performance we were aiming to incentivise. For example, Table 5.1 sets out that in the 2015-20 period, the top 5 performers in terms of overall RoRE were also in the top 5 companies in terms of combined totex and ODI RoRE performance. The bottom 7 companies in RoRE terms were also in the bottom 7 companies in terms of their performance on combined totex and ODI RoRE.
Table 5.1: Comparison of overall RoRE and ‘ODI + totex’ RoRE rankings (2015-20)
Company Total RoRE Total RoRE rank
ODI+totex RoRE ODI+totex RoRE rank
SWB 11.5% 1 2.8% 1
WSX 9.1% 2 1.8% 2
SSC 8.6% 3 1.2% 5
SVE 8.5% 4 1.4% 3
NES 8.0% 5 1.2% 4
NWT 7.0% 6 -0.7% 9
ANH 6.9% 7 1.1% 6
SEW 6.7% 8 1.1% 7
YKY 5.2% 9 -0.1% 8
BRL 4.7% 10 -0.9% 10
AFW 4.5% 11 -2.7% 16
0.0%
2.0%
4.0%
6.0%
8.0%
10.0%
12.0%
ODI Totex SIM Outturn Base return

PR14 Review: Discussion paper on findings
66
SRN 4.4% 12 -1.3% 12
WSH 4.4% 13 -1.1% 11
HDD 4.3% 14 -2.5% 15
SES 4.2% 15 -1.5% 13
TMS 3.8% 16 -3.1% 17
PRT 2.8% 17 -2.1% 14
Note: Green shading denotes top-6 company, red bars denote a bottom 6 company Source: Ofwat analysis of Monitoring Financial Resilience (2020)
We comment on each element of RoRE performance in more detail below.
Totex RoRE
Figure 5.3 depicts companies’ overall totex RoRE performance over 2015-20. This shows a distribution of outcomes around the notional expectation of no out- or under-performance. The RCV-weighted average position for the sector was a RoRE contribution of -0.3%, consistent with our finding in Section 4 that the sector overspent wholesale allowed totex by 3.7%. However, 2019-20 was a high cost year when compared to previous price review periods,66 and (as discussed in Section 5) there is evidence that several companies brought forward material expenditure from 2020-25 into this year.67 This brought-forward spending is not relevant to our assessment of the PR14 review, and we accordingly consider that the totex RoRE figure relevant to assessing PR14 performance is higher than that implied by Figure 5.3.
The distribution of company totex RoRE is broadly consistent with forecast risk ranges. For 17 companies we would expect one or two companies to achieve RoRE outside both the P10 and the P90 levels, on average. This is consistent with the outturn data depicted in figure 5.2, with two companies achieving RoRE above their P90 and one company below its P10.
66 Ofwat, ‘Reference to the CMA: Costs and outcomes – response to provisional findings responses’, p90, Figure A6.1, November 2020 67 Ofwat, ‘Reference to the CMA: 2019-20 data for base cost models – response to working paper’, January 2021, para. 2.3, p3

PR14 Review: Discussion paper on findings
67
Figure 5.3: Totex RoRE performance 2015-20, versus PR14 risk ranges
Source: Ofwat, ‘Monitoring Financial Resilience’, 2019-20
ODI RoRE
Figure 5.4 depicts companies’ ODI RoRE performance over 2015-20 against risk ranges forecast at PR14 final determinations. While there were significant differences between WoCs (largely underperforming) and WaSCs (largely outperforming), weighted-average performance was broadly neutral.
We consider that the figures in Figure 5.4 may understate the RoRE performance relevant to our assessment. The figures in the chart include: a £15 million underperformance payment for Southern Water, a £130 million underperformance payment for Thames Water for non-delivery of Counters Creek, and £63 million of leakage underperformance payments for Thames Water.68 Removing these incidents, which relate to significant management failures or cancellations of schemes within company control (as opposed to risks intended to be captured in the risk range calculations), would increase 2015-20 average sector RoRE by 0.2%.69
In any case, this broadly neutral overall sector performance is in contrast to the forecast (informed by company estimates) from Figure 5.4 suggesting a downward skew in ODI risk ranges. Again, several companies outperformed (or came close to doing so) the optimistic P90 scenario, while none breached their P10 level. One
68 The £63m payment should be considered exceptional as it led to enforcement action due to the company failing to meet its statutory obligations. 69 Calculation is based on dividing the total £208m underperformance payments by 5 (£41.6m) and dividing this by average sector regulated equity (£23,651m).
-4.0%
-3.0%
-2.0%
-1.0%
0.0%
1.0%
2.0%
3.0%
Totex Outperformance Range Totex Underperformance Range Outturn (AMP Average)

PR14 Review: Discussion paper on findings
68
interpretation is that company forecasts may have been excessively pessimistic about the prospects of achieving PR14 performance commitments.
Figure 5.4: ODI performance 2015-20, versus PR14 risk ranges (RoRE)
Source: Ofwat, ‘Monitoring Financial Resilience’, 2019-20
Financing RoRE
Figure 5.5 depicts companies’ financing RoRE performance over 2015-20, compared to forecast risk ranges. Some WoCs – particularly those with expensive historical debt – had underperformance which lay below their forecast range. Overall, however, the picture was of substantial outperformance – with nine companies earning levels of RoRE above the top of their forecast range. This suggests that the original ranges did not capture the extent to which factors relating to actual company financing structures were liable to drive out- or under-performance. We found various reasons for this:
• Definition of financing outperformance: The PR14 forecast risk ranges only considered potential outperformance on new debt relative to the regulatory allowance. Outturn performance in the chart is based on financial flows data from company annual performance reports. The latter definition of outperformance incorporates a much wider range of sources of return – most saliently embedded debt, but also from other sources (eg gearing, tax, impact of swaps).
• Cautious approach: The PR14 final determination allowed cost of embedded debt took a point estimate from the high end of the range, and did not fully reflect the latest evidence on the 10 year trailing average of the benchmark index.70
70 Ofwat, ‘Final price control determination notice: policy chapter A7 – risk and reward’, December 2014, pp. 37-38
-2.5%-2.0%-1.5%-1.0%-0.5%0.0%0.5%1.0%1.5%2.0%
ODI Outperformance Range ODI Underperformance Range Outturn (AMP Average)

PR14 Review: Discussion paper on findings
69
• Unexpectedly benign financing environment: Although the PR14 final determinations point estimate for new debt of 2.00% in RPI terms represented a significant drop relative to the January estimate of 2.65%, the cost of new debt (as proxied for by the iBoxx A/BBB 10 yrs+ non financials index) fell even further over 2015-20: on average it was 0.43% over this period.71
Figure 5.5: Financing performance 2015-20, versus PR14 risk ranges (RoRE)
Source: Ofwat, ‘Monitoring Financial Resilience’, 2019-20
Views on the use of the RoRE metric
Responses to our PR14 review call for input generally supported RoRE as a helpful metric to compare performance across companies on a common basis. Several companies told us that they were using RoRE as a key performance indicator to report to their stakeholders. This notwithstanding, some responses raised issues with the RoRE risk ranges:
• Complexity – one response voiced concerns around the difficulty of robustly conducting and quantifying the impact of scenarios, while another argued that stakeholders’ understanding of RoRE was poor.
• Consistency – several responses suggested that the approach to generating P10 and P90 figures was subjective and not done on a consistent basis, reducing comparability of risk ranges.
71 Source: Ofwat analysis of IHS Markit iBoxx data. In nominal terms the iBoxx A/BBB average was 3.25% over this period, corresponding to 0.43% using the PR14 RPI assumption of 2.8%.
-1.5%
-1.0%
-0.5%
0.0%
0.5%
1.0%
1.5%
2.0%
2.5%
3.0%
Financing Outperformance Range Financing Underperformance Range
Outturn (AMP Average)

PR14 Review: Discussion paper on findings
70
Overall balance of risk and return key findings
• We intended that returns should be aligned with efficiency and service quality and find evidence that our PR14 approach achieved this. We found a tendency for the best performers on ODIs and totex to achieve sector-leading RoRE, and that the worst performers in these areas were at the bottom of the cohort in overall RoRE terms.
• The sector’s weighted average RoRE over 2015-20 of 6.30% (real, RPI-deflated) was higher than the base allowed return on equity (5.65%), suggesting the sector overall modestly outperformed the PR14 package.
• This outperformance was mainly due to the various sources of positive cashflow achieved by companies based on their ex-ante financing decisions (e.g. on embedded debt), rather than in-period risks materialising.
• Stripping out financing performance results in a sector weighted-average RoRE of 5.33%, and a reasonable balance of companies with net outperformance (7) and those with net underperformance (10). This is consistent with a reasonable balance of risk and return.
• The introduction of Return on Regulatory Equity (RoRE) was recognised by companies as a useful metric. Nevertheless, there may be limits on the use of forecast RoRE risk ranges as a guide to the risk-return balance of regulatory settlements. For example, we found that the negative skew predicted by companies and reflected in our forecasts for ODI RoRE did not materialise in the 2015-20 outturn data.
Allowed return on capital
The approach for setting the allowed return at PR14 was very similar to prior price reviews. We set the allowed return on equity with the Capital Asset Pricing Model (CAPM) and retained separate allowances for new and embedded debt.
The main differences relative to our PR09 approach were:
a) An index-led cost of debt allowance: we used a synthetic benchmark index (the average of the ‘A’ and ‘BBB’-rated IHS Markit iBoxx GBP 10 yrs+ non-financials indices) to set the allowed return on embedded and new debt. We made a 0.15% downward adjustment to the index to reflect evidence from outstanding water bonds that the sector was on average able to issue debt at a lower yield than the index.
b) A retail margin: We allowed the retail control a net margin of 1% on turnover instead of applying a weighted average cost of capital (WACC). To avoid double-

PR14 Review: Discussion paper on findings
71
counting retail margin revenues in the Appointee WACC we made a ‘retail margin adjustment’ to derive a wholesale WACC which was applied to the wholesale RCV.
We invited company estimates of the allowed return in their December 2013 business plans. However, these estimates tended to include an allowed return which was higher than market evidence indicated. Therefore, in January 2014 we issued guidance that an RPI-terms return of around 3.85% (6.76% nominal) was reasonable.72. Our final determination allowance set in December 2014 was 3.74% (6.64% nominal), reflecting subsequent changes in two parameters – the cost of new debt and the retail margin adjustment.
For the cost of debt, the allowance for interest costs for the overall cost of debt was 5.36% nominal (2.49% in RPI terms, assuming long-term RPI of 2.8%). This consisted of the following assumptions:
• Embedded debt: 5.52% nominal, 2.65% (real, RPI) • New debt: 4.86% nominal, 2.00% (real, RPI) • Average share of new debt over 2020-25: 25%
Figure 5.6 sets out the implied path of this allowance over 2015-20, reflecting the above point estimate, and comparing against indicative weighted average nominal interest costs from annual performance reports over 2015-20.
72 Ofwat, ‘Setting price controls for 2015-20 – risk and reward guidance’, January 2014

PR14 Review: Discussion paper on findings
72
Figure 5.6: APR cost of debt vs. PR14 allowed cost of debt (nominal, assuming 2.8% RPI)
Source: Ofwat analysis of annual performance report and final determinations data
Note: APR figures have been put on a consistent inflation basis by adjusting the index-linked borrowings
rate for the difference between March RPI and the PR14 long-term assumption of 2.8%.
The simple average interest rate for all companies over 2015-20 was 4.76% nominal, compared to the equivalent PR14 allowed return on debt of 5.36%.73 The median for large companies – which collectively accounted for 97% of March 2020 borrowings - was 4.55%. This suggests that, in hindsight, our index-based PR14 allowance was outperformed by most of the sector, and therefore that our 15 basis point deduction from our benchmark index was insufficient. We estimate that using an embedded debt assumption that placed more weight on actual costs would have reduced outperformance significantly. If we assume that March 2016 actual debt costs were a reasonable proxy for the embedded debt costs of the sector at the start of the control, using the March 2016 WaSC and large WoC median cost of debt as the embedded debt assumption would have reduced revenues by an average of £0.34 billion per year over 2015-20.74 This equates to an annualised average RoRE impact for the sector of approximately -1.3% over this period.75
73 Figure does not include the 10bps issuance and liquidity in order to promote comparability. 74 Calculation uses March 2016 APR figures standardised to the PR14 assumption of 2.8% 75 Based on a revised cost of debt allowance of 1.82% (real, RPI), average sector nominal RCV of £72.0bn. (62.5% x 72.0) x (2.59% - 1.82%) / ((1-62.5%) x 72.0) = 1.3%
0.0%
1.0%
2.0%
3.0%
4.0%
5.0%
6.0%
7.0%
8.0%
Mar-16 Mar-17 Mar-18 Mar-19 Mar-20
Large companies PR14 FD allowance
Small companies WaSC and large WoC median
All company simple average

PR14 Review: Discussion paper on findings
73
Eight companies responding to our call for input commented on the relationship between our use of an index-led approach for the first time and their financing behaviour. Six companies said that our PR14 approach to the cost of debt did not materially affect their financing decisions. One company commented that our approach led to greater commercial pressure on debt raising over 2015-20 through not recognising older instruments (i.e. those raised 15+ years ago). Another company asserted that there was evidence that the use of a 10 year trailing average had encouraged shorter-term issuance.
Figure 5.7 depicts tenor-at-issuance for listed bonds and nominal gilt yields (the latter to illustrate periods of yield curve inversion). While data since 2007 may indicate a trend for lower tenor-at-issuance, this is exaggerated by the unusually long-dated (ie 30+ year tenor) debt issued in the 2006-2007 period, which is more plausibly explained by yield curve inversion76 and companies issuing debt related to financial restructuring. Such a trend would in any case predate the announcing of our PR14 final methodology in July 2013. Considering both bond issuance data and company responses, it is therefore not clear that our PR14 index-led approach had any material impact on company financing decisions.
Figure 5.7: Tenor at issuance for water bonds and selected nominal gilt yields (2000-2021)
76 ie issuing ultra long was a lower-cost option compared to shorter-tenor debt in terms of annualised interest rate.
0
5
10
15
20
25
30
35
40
45
0
1
2
3
4
5
6
Ave
rag
e te
no
r-at-
issu
an
ce (
ye
ars
)
No
min
al Y
ield
Average Tenor 5 Year 10 Year 15 Year 20 Year 25 Year

PR14 Review: Discussion paper on findings
74
Source: Ofwat analysis of Refinitiv, Bloomberg, Capital IQ, and Bank of England data
For cost of equity, we used a point estimate of 8.65% nominal (5.65% in RPI-deflated terms). This consisted of the following point estimates:77
• Risk-free rate: 4.09% nominal, 1.25% RPI • Total Market Return: 9.74% nominal, 6.75% RPI • Asset beta:78 0.30
It is not possible to observe all of the parameters for the cost of equity directly in the market, and therefore it is difficult to assess the level of return required by investors even in hindsight. We note that:
1. Our point estimate for Total Market Return was set at the upper end of our range (6.25% to 6.75% in RPI terms). It drew on historical and forward-looking evidence but clearly assigned more weight to estimates based on long-run historical data.79 It was higher than the point estimate of 6.5% used by the Competition and Markets Authority for its 2013 Northern Ireland Electricity and 2015 Bristol Water redeterminations, and higher than the Civil Aviation Authority’s point estimate of 6.25% for the 2014 Heathrow and Gatwick controls.80
2. Our asset beta of 0.30 was a big reduction from the 0.4 used at PR09 but nonetheless lay at the top end of the 0.27 – 0.30 narrowed range used by the Competition and Markets Authority for its 2015 redetermination of Bristol Water’s price control.81
3. We set a risk-free rate point estimate of 1.25% in RPI terms based on 10 year spot yields adjusted for forward-looking expectations. This was higher than the outturn data for the period and significantly higher than the spot yield on 31/01/2014 of -0.24% for 10 year RPI-linked gilts, equating to a trailing average of around 14 years’ worth of the historical 10 year spot rates. Placing significant weight on historic data was a common approach among UK regulators at the time, and may have reflected concerns that the financing environment responsible for low gilt yields would not persist much further into the control period.
77 Deflated for assumed RPI of 2.8%, the RPI figures were: Risk-free rate 1.25%, TMR 6.75%. 78 For PR14 we did not use a debt beta – this figure is analogous to the ‘unlevered beta’ used for PR19 draft and final determinations. 79 Ofwat, ‘Setting price controls for 2015-20 – risk and reward guidance’, January 2015, p13, Figure1 80 CAA ’Estimating the cost of capital: technical appendix for the economic regulation of Heathrow and Gatwick from April 2014,’ February 2014, p44 81 Competition and Markets Authority, ‘Bristol Water Final Determination: Final report’, para 10.150

PR14 Review: Discussion paper on findings
75
Our estimate of the risk-free rate of 1.25% (real RPI) was in part based on consideration of forward rates.82 Figure 5.8 compares forecasts implied by forward rates of the 10 year index-linked gilt yield, a commonly-used risk-free proxy. We observe that forward rates had poor predictive power over the path of the actual 10 year yield in ensuing years, a finding aligned with CEPA (2016). 83 This in turn suggests that a forward rates approach may not provide better estimates than simply using a short trailing average of recent spot values. Overall, as the allowed risk free rate was above the outturn for its proxy (the 10 year gilts rate) and other parameters were towards the upper end of contemporary regulator ranges, the allowed return on equity was at least sufficient and potentially above required returns.
Figure 5.8: Outturn 10 year RPI-linked gilt yield and 3 year forward 10 year rate
Source: Ofwat analysis of Bank of England yield curve data
A final piece of evidence on the PR14 allowed return on equity is the Market-to-asset Ratio (MAR) for listed companies United Utilities and Severn Trent. This metric is the ratio of enterprise value (ie share capitalisation and net debt) to RCV. It is generally accepted that a MAR above one signifies a market perception that these companies will outperform the regulatory settlement over a long horizon. Figure 5.9 sets out that MARs were significantly higher than the historical average over the PR14 control period, particularly in the period preceding May 2017 to December 2019. This latter period was marked by heightened investor perceptions of nationalisation risk: together with a signalled fall in the PR19 allowed return, this has been recognised as exerting a drag on
82 Ofwat, ‘Setting price controls for 2015-20 – risk and reward guidance’, January 2015, p15 83 CEPA, ‘Alternative approaches to setting the cost of debt for PR19 and H7’, August 2016, p74
-3.50%
-3.00%
-2.50%
-2.00%
-1.50%
-1.00%
-0.50%
0.00%
0.50%
1.00%
1.50%
Mar 2012 Forecast Sept 2012 Forecast Mar 2013 Forecast Sept 2013 Forecast
Mar 2014 Forecast Sept 2014 Forecast Outturn 10 Year rate

PR14 Review: Discussion paper on findings
76
listed company share prices).84 Private equity transactions in water also exhibited historically high premia over this period – averaging a premium of 32% above RCV.85
Figure 5.9: Market-to-asset premia 1993-2020 (United Utilities and Severn Trent composite)
Source: Ofwat analysis of equity analyst calculations
Positive market-to-asset premia are typically the result of multiple factors – one of which may be perceived outperformance on the allowed return on equity. To estimate the scale of this outperformance we commissioned PwC and Europe Economics to remove outperformance from other building blocks of the price review (ie totex, ODIs, SIM, debt financing) from the headline MAR. The results of these exercises were that the residual MAR premium after making this adjustment remained materially above zero. This suggests that outperformance on other regulatory building blocks cannot by itself explain the observed MAR premium, and that a likely explanation for the residual
84 See for instance: S&P Global market intelligence, ‘Specter of nationalization raises risks for UK utility shareholders, creditors’, 14 June 2019 85 PwC, ‘Review of the relationship between financing allowances and water company performance’, October 2020, Figure 4.11, p25
-30%
-20%
-10%
0%
10%
20%
30%
40%
1993 1996 1999 2002 2005 2008 2011 2014 2017 2020
RCV premium Average premium 1993-2020 PR14 Period

PR14 Review: Discussion paper on findings
77
premium is a market expectation of outperformance on the allowed return on equity during the 2015-20 period.86
Allowed return on capital key findings
• With hindsight, the PR14 allowed return on capital was above the required return:
o Assuming RPI inflation of 2.8% for comparability, the simple average company-level cost of debt over 2020-25 was 4.76% nominal. For the median of larger companies it was 4.55%. Both figures are materially lower than our index-based PR14 allowance of 5.36%.
o For the allowed return on equity, the risk-free rate point estimate was well above spot gilt rates – which continued to fall over 2015-20.
• We drew on index data to set the allowed return on debt for the first time at PR14. It is not clear from bond issuance data or company responses that this had any material impact on company financing decisions.
• We observe that forward rates for index-linked gilt yields had poor predictive power over the path of spot yields in ensuing years. This in turn suggests that a forward rates approach for the risk-free rate may not provide better estimates than using a short trailing average of recent spot yields.
Financial monitoring regime
At PR14 we introduced a financial monitoring regime to track company financial performance and the steps that they were taking to manage their finances and financial resilience.
The objectives of the financial monitoring framework87 were to:
• enhance visibility and transparency of financial and capital structures in the sector; • enable Ofwat to monitor the financial stability of the businesses that we regulate;
86 See PwC, ‘Refining the balance of incentives for PR19’, Table 15, p86 which found residual MARs of 1.10 to 1.12. 87 See Ofwat Consultation on financial monitoring framework 2015, p9.

PR14 Review: Discussion paper on findings
78
• identify financial and structural risks which may impact on service delivery over time and prove harmful to customers; and
• help us to determine when we need to use the regulatory tools available to us to intervene to protect customers’ interests.
Since 2016 we have (in addition to more targeted measures focusing on specific companies) published an annual Monitoring Financial Resilience report. This has aimed to enhance the transparency and accessibility of each company’s financial performance and the financial structures in the sector by sharing key metrics. As part of our assessment of monitoring financial resilience, we set out our expectation (for example in the 2017 monitoring financial resilience report)88 that companies would need to ensure their financing arrangements were resilient to changes, including changes that were expected to arise at PR19. We also developed the financial flows metrics which are designed to provide greater transparency and clarity about the returns to equity holders.
Since 2015-16 all companies have also been required to produce an annual long-term viability statement (LTVS) in line with the ‘UK corporate governance code’ (September 2014). The aim of the LTVS is to provide greater transparency about the steps companies take to ensure long term financial resilience, and is monitored and reported on as part of the financial monitoring regime.89 The LTVS sets out an assessment by a company’s Board of directors on its ability to meet its future obligations taking into account the current position of the company. Companies were required to set out the risks to the business over an appropriate length of time, undertake stress testing in a robust manner and determine any mitigating actions required.
As the LTVS was a new requirement for all sectors it took companies time to understand the new requirement leading to inconsistencies in the quality and detail of LTVS. To address this we produced a number of information notices90 throughout the period to set out our expectations of the LTVS. We have subsequently seen an improvement in the quality and robustness of the LTVS – for instance, the period covered in the 2020 LTVS looks ahead over a period of 7-10 years. In 2016 the majority of the sector used 5 years or fewer.91
Responses to our PR14 review call for input resulted in mixed views on the impact of the financial monitoring regime. Responses commented that it was:
88 Ofwat, Monitoring financial resilience, November 2017. 89 See: Monitoring financial resilience - Ofwat 90 Ofwat, Expectations for companies in issuing long term viability 2019 91 Ofwat, ‘Monitoring Financial Resilience Report’, December 2020, p5

PR14 Review: Discussion paper on findings
79
• Helpful in promoting transparency and long-termism: These responses tended to focus on the value of Monitoring Financial Resilience in communicating and comparing issues, and the LTVS required in annual performance reports in requiring companies to consider the longer-term outlook.
• Excessively focused on high-gearing: Some highly geared companies argued that evidence (eg performance following the 2008 financial crisis) showed that such structures were resilient and there were in any case sufficient mechanisms protecting customers from company failure. One company also suggested that its reporting requirements under its whole business securitisation were more stringent than our regime.
• Not obviously responsible for improvements in financial resilience: Several companies argued that the monitoring framework had not obviously affected financial structures, either as they considered that these structures had not materially changed, or because it was difficult to establish that our monitoring framework was responsible for changes.
We agree with respondents to our call for information that gearing is only one of the indicators of financial resilience, and that is why our monitoring regime focusses also on other aspects of financial resilience which include operational performance, financing costs, pension deficits and other financial metrics. However, gearing remains important to the extent that high levels of debt reduce available headroom from a company's earnings than would otherwise be the case and gearing is an important metric that is monitored by credit rating agencies and investors. This matters because these entities influence the cost of finance faced by companies, which in turn tends to affect customer bills.
Following concerns in 2018 about company performance, returns to investors, financial resilience and the extent to which these were aligned with customers' interests we launched a programme to put the sector in balance.92 Our objectives and the framework developed in that programme were adopted by our PR19 price review. For example, in our final determinations93 we reiterated our expectations for dividend policies and that companies should:
• set out details underpinning their approach to dividends and factors that influence dividends transparently in their published dividend policy;
• set out how their approach takes account of delivery for customers; • ensure that their dividend policy is clearly set out in their Annual Performance
Report and is consistent with all other narrative in relation to dividend policy or
92 See Ofwat, Putting-the-sector-in-balance-position-statement-on-PR19-business-plans-FINAL2.pdf (ofwat.gov.uk), July 2018. 93 Ofwat, PR19 final determinations, aligning risk and return technical annex, December 2019, pp. 117-118.

PR14 Review: Discussion paper on findings
80
dividends declared or paid within the remainder of their Annual Performance Report, within their statutory accounts and within any other publication; and
• clearly signal any changes to their dividend policy in their Annual Performance Reports.
We also set out our expectations in relation to explanation of dividends declared or paid. In particular, that companies:
• set out how total dividends declared or paid have been determined and how they are consistent with the company’s dividend policy,
• clearly explain and provide justification for any deviations from the policy.
We note some improvements in companies’ financial resilience over the 2015-20 period. For instance, as set out in Figure 5.10, several highly-geared94 companies had materially reduced gearing by March 2020, and both Anglian Water95 and Thames Water96 have announced plans to reduce gearing. Yet the sector’s gearing rose slightly from 71.4% to 71.7% between March 2016 and March 2020, based on the definition of gearing set out in our reporting guidance. Some companies have used derivatives to improve short term cashflows at the expense of increased future liabilities.97 Risk from derivatives is a significant issue: some companies have large mark-to-market losses on their derivatives portfolios, constraining their credit quality.98 These ongoing concerns highlight the need to continue monitoring financial resilience.
94 Defined as having net debt to RCV of over 70% 95 Fitch, ‘What investors want to know: Anglian Water’s new financing structure’, 30 June 2021 96 Moodys, ‘Thames Water Utilities Ltd’, Credit Opinion, 6 April 2021, p7 97 See e.g. Fitch, ‘Swap Amendments May Increase Issuer’s Debt Burden’, Oct 2019 98 For instance, Yorkshire Water had a negative mark-to-market loss on its derivatives portfolio of £2.8bn as at March 2021 (Source: Management analysis as at 31 March 2021)

PR14 Review: Discussion paper on findings
81
Figure 5.10: Changes in gearing: March 2016 to March 2020
Source: Ofwat Financial monitoring report 2019-20 Notes; Gearing is defined as net debt to RCV *Company is securitised ** South Staffs has a hybrid structure with some securitised debts
We recognise that PR19 policy targeting financial resilience complicates attributing reductions in gearing to our PR14 financial monitoring framework alone. One particularly significant PR19 workstream was the 2018 ‘Back in Balance’ consultation and subsequent position statement,99 which more explicitly aimed to incentivise companies to provide transparency on their financial resilience and to make responsible financing choices and consequently reduce risk to customers of financial distress. As this introduced a mechanism to disincentivise gearing above 70%, it is possible companies were motivated in their decision to reduce gearing to avoid these disincentives.
Figure 5.11 sets out that eleven sector companies have debt with securitised characteristics. Companies with securitised structures tend to have additional reporting requirements to debt providers. This arises because such financing arrangements are designed to accommodate a larger proportion of debt in the financial structure. The resultant reduction in equity headroom and lower free cash flows from taking on more debt justifies additional reporting requirements and covenants to protect creditors.
99 Ofwat, ‘Putting the sector back in balance: Consultation on proposals for PR19 business plans’, April 2018
0%10%20%30%40%50%60%70%80%90%
2016 2020 Notional gearing at PR14 (62.5%) Notional gearing at PR19 (60%)

PR14 Review: Discussion paper on findings
82
It is important that providers of an essential public service adopt capital structures that allow them to maintain financial resilience. As at March 2020, Figure 5.11 sets out that 6 water companies had issuer credit ratings lower than the Baa1 rating most companies targeted as sustainable for long-term financeability and financial resilience at PR19.100 As providers of an essential service, we expect companies to adopt financing arrangements that do not pass excessive risk to customers and provide that companies are able to maintain financial resilience against a backdrop of wider economic or operational changes.
Figure 5.11: England and Wales water company credit ratings 2015-2020
Note: South West Water and Hafren Dyfrdwy are not rated. Chart shows the lowest monitored credit rating,
further upgrades or downgrades may have occurred during the period which are not shown on the chart.
Source: Ofwat Financial monitoring report 2019-20 and Historic Performance data
Our concerns about risky financial structures expressed in this section highlight the importance of our continuing role in monitoring financial resilience. As set out in our financial monitoring reports and the PR19 final determinations, we expect some companies will continue to need to take steps to ensure levels of financial resilience are adequate. We continue to engage with companies where we have concerns about financial resilience and we are taking forward a programme of work to determine what more we should be doing to ensure customers are adequately protected from the financing decisions companies make.
100Ofwat, ‘PR19 draft determinations: Aligning risk and return technical appendix’, July 2019, p. 53, Table 6.2

PR14 Review: Discussion paper on findings
83
Financial monitoring regime key findings
• Our financial monitoring framework increased the transparency and comparability of financial metrics reported by companies, making them more accessible to stakeholders and thus improving accountability.
• While some companies improved their financial resilience by reducing gearing and others have plans to, PR19 policies targeting financial resilience may also be responsible for these decisions.
• We note that several companies have a credit rating that offers limited headroom above the investment grade floor and that these companies tend to be highly geared or with significant exposure to risk from their derivatives portfolio. This underlines the continuing need to monitor financial resilience.
Wholesale Revenue Forecasting Incentive Mechanism
At PR14 we replaced the revenue correction mechanism (RCM) with the wholesale revenue forecasting incentive mechanism (WRFIM). In a similar vein to RCM, the latter mechanism was designed to adjust companies’ allowed revenues at the 2019 price review to take account of differences between actual and projected demand during the 2015-20 period.
WRFIM was designed to share forecasting risks with customers more effectively instead of transferring all associated risks to future customers. It was also intended to increase the incentives on companies to forecast revenues accurately. In particular, WRFIM applied a financial penalty to the excess of recovered wholesale revenue above allowed wholesale revenue, subject to a deadband around the allowed revenue where penalties were not applied.
Figures 5.12 and 5.13 below show the variance between forecast and revenue recovered in the PR09 RCM model and the PR14 WRFIM models. For both wholesale water and wastewater, actual revenue recovery was more in line with forecasts during PR14 in comparison to PR09 where there was a much larger variance in the RCM model than the WRFIM model.
For wholesale water, the absolute variance between allowed and recovered revenues fell from 1.33% to 0.56% at PR14. For wholesale wastewater, the absolute variance fell from 0.89% to 0.03%. This suggests that the sector forecasted revenue more accurately in PR14 in response to these improved incentives. This was likely of some benefit to

PR14 Review: Discussion paper on findings
84
customers through reducing the size of the end-of-period reconciliation, supporting greater stability of bills over time.
Figure 5.12: Allowed minus recovered wholesale water revenues as a proportion of allowed revenues for PR09 (2010-15) and PR14 (2015-20)101
Source: Analysis from Ofwat PR09 RCM and PR14 WRFIM model
Figure 5.13: Allowed minus recovered wholesale wastewater revenues as a proportion of allowed revenues for PR09 (2010-15) and PR14 (2015-20)
Source: Analysis from Ofwat PR09 RCM and PR14 WRFIM model
101 For the purpose of this analysis Hafren Dyfrdwy/Dee Valley have been excluded due to the atypical circumstances of Hafren as mainly a water provider albeit with wastewater services for a small number of customers from the year ending 2019. For instance, the company intentionally under-recovered from its wastewater allowances to maintain manageable bills.
-11.00%
-9.00%
-7.00%
-5.00%
-3.00%
-1.00%
1.00%
3.00%
5.00%
7.00%
RCM WRFIM
-8.00%
-6.00%
-4.00%
-2.00%
0.00%
2.00%
4.00%
6.00%
8.00%
RCM WRFIM

PR14 Review: Discussion paper on findings
85
Wholesale revenue forecasting incentive mechanism key findings
• The Wholesale Forecasting Revenue Incentive Mechanism improved the accuracy of demand forecasts. This reduced the size of the end-of-period reconciliation, supporting greater stability of bills over time.

PR14 Review: Discussion paper on findings
86
6. Sustainable use of water resources
Key findings
Based on our assessment of the approach to encourage sustainable use of water resources during the 2015-20 period, we found that:
• The water trading incentive seems to have had limited impact during the 2015-20 period. Only two companies identified new water trades which qualified for incentive payments totalling £0.6 million. However, it can take many years to identify viable water trades, so the full impact of this incentive, which has been maintained in PR19, may not have played out within the 2015-20 period. Moreover, while trading incentives increase individual company motivation to trade, they don’t solve co-ordination issues between companies or between regulators which can be significant.
• The abstraction incentive mechanism (AIM) appeared more effective during the period than the water trading incentive. Although it only applied to a small number of very specific sites, it seemed to encourage the reduction of abstraction at low flows by 15,000 Ml at 38 environmentally sensitive sites. Although it is possible that companies might have reduced abstraction from these sites even without AIM. We also collected information that allowed us to make further use of the mechanism in PR19.
• The sector could have made more progress on leakage. It reduced by 6% on average across the sector, with five water companies reporting a greater than 10% leakage reduction. But this reduction was no more than the long term historical trend, and progress seems to have mostly been spurred by the announcement of the more stretching PR19 15% leakage reduction challenge.
• Incentives to encourage customers to reduce demand for water also do not appear to have been strong enough. Per capita consumption increased by 2% from 139 litres per head per day in 2014-15 to 142 litres per head per day in 2019-20.
Introduction
One of the objectives of PR14 was to promote a more sustainable use of water resources.
We expected that the totex approach to wholesale costs would encourage more efficient decisions on the use of water resources. As discussed in Section 4, overall

PR14 Review: Discussion paper on findings
87
totex was effective to some extent as companies were incentivised to look for more cost effective solutions and were able to more easily substitute opex-focused solutions for capex-focused ones they would previously have implemented.
But we also introduced two further incentives in specific areas:
• a water trading incentive designed to encourage companies to trade water where it was efficient and cost-effective to do so; and
• the abstraction incentive mechanism (AIM), designed to encourage companies to reduce levels of abstraction at low flows from environmentally sensitive sites.
These mechanisms were seen as complementary. Encouraging more water trading would allow for a better balance of supply and demand by trading water from regions with surplus water to those where water is scarcer. Redistributing water between regions would also contribute towards reducing the need for abstraction in more environmentally sensitive sites in low flow conditions.
There were also two performance commitments, leakage and per capita consumption,102 which encouraged companies to improve water efficiency and focus on a more sustainable use of water resources.
Below, we discuss the effectiveness of these mechanisms in more detail during the 2015-20 period, considering:
• Water trading incentive: whether the water trading incentive resulted in new import or export water trades.
• Abstraction incentive mechanism: whether the incentive mechanism resulted in a reduction in the use of environmentally sensitive sites at low flows.
• Water efficiency performance commitments: whether the leakage and per capita consumption performance commitments resulted in improvements in water efficiency across the sector.
Water trading incentive
The water trading incentive at PR14 was designed to encourage both new water exports and new water imports where beneficial to do so. For new exports during the 2015-20
102 Dŵr Cymru, Northumbrian Water, Thames Water and South East Water did not have per capita consumption performance commitments at PR14.

PR14 Review: Discussion paper on findings
88
period, exporters were allowed to retain 50% of the lifetime economic profits (profits over and above the normal return on capital invested). For new imports, importers were allowed to retain 5% of their costs as well as benefiting from the standard totex efficiency sharing incentives.
The aim of the incentives was to encourage longer term thinking about trades. They were introduced into the development of the PR14 methodology at a point where Water Resource Management Plans were already advanced. Given the lead time to identify and develop a trade, this limited the extent to which companies could include trades in the WRMPs for the 2015-20 period.
In the PR14 review call for input responses, stakeholders were of the view that the opportunities and incentives for new water imports and exports were minimal with the process to identify new trades being complex. In our early thinking for PR19, we also identified that this incentive alone would not be effective at encouraging water trades on a large scale. We identified wider barriers to water trading linked to the uncertainty around future regulatory arrangements that might impact water availability for trading, the balance of security of supply risks, and stranding risks103.
During the 2015-20 period, we saw companies identify and explore a number of potential new trades. However only two new water trades involving incumbent water companies qualified for the incentive payments, Portsmouth Water, a new export to Southern Water, and Thames Water, a new import from RWE. The companies received a total of £0.6 million (2012-13 prices). The two water trading schemes identified by Portsmouth Water and Thames Water were already included in their 2014 water resources plans, and it is unclear to what extent the water trading incentive was material in its further development.
Further trading options were developed during the 2015-20 period that fell outside the scope of the incentive criteria or where the companies involved did not pursue an incentive claim. For example, Portsmouth Water and Southern Water entered into another separate trade towards the end of the 2015-20 period, and Severn Trent Water acquired abstraction rights from Eon.
Overall the total volume of water traded across the sector as a whole during PR14 was 4.2% of the total water distributed (2,957 Ml/day) in line with performance over the last 20 years, where water trading has been relatively stable varying between 4.1% and 4.6%.104 A significant proportion of this traded water is supplied from Wales to England.
103 Deloitte LLP, Water trading – scope, benefits and options, December 2015. 104 Deloitte LLP, Water trading – scope, benefits and options, December 2015, Figure 3, p. 19.

PR14 Review: Discussion paper on findings
89
This suggests that the water trading incentive had limited impact at encouraging new water exports or imports in the short term, reflecting the late introduction of the incentive in the WRMP process. However, it may have influenced the emergence of some projects, most notably the large shared resource options and transfers as part of the most recent round of water resource management plans to provide greater system resilience to severe droughts. These options would enable transfers of more than 400Ml/d.
We reviewed our broader approach to water resources as part of the development of the 2019 price review. We identified that while trading incentives increase individual company motivations to trade, they don’t solve co-ordination issues between companies or between regulators which can be significant. As a result, in addition to maintaining the water trading incentive, we intervened to allow the upfront funding for the development of joint the strategic regional water resource solutions and the Regulators’ Alliance for Progressing Infrastructure Development (RAPID) was created to resolve some of the co-ordination issues between companies and between regulators.105
Water trading incentive key findings
• The water trading incentive seems to have had limited impact during the 2015-20 period, at least in part, reflecting that they were introduced late in the WRMP process. Only two companies, Portsmouth Water and Thames Water, identified new water trades which qualified for incentive payments totalling £0.6 million. The remaining water trades made during the 2015-20 period were either in place pre-2015 or did not qualify for the incentive. However, it can take many years to identify viable water trades, so the full impact of this incentive, which has been maintained in PR19, is unlikely to have played out within the 2015-20 period.
Abstraction Incentive Mechanism
The purpose of AIM was to encourage companies to reduce the environmental impact of abstracting water at environmentally sensitive sites during periods of low flows. This was designed to be a transitional incentive while the Government developed wider
105 RAPID is made up of three water regulators Ofwat, Environment Agency and Drinking Water Inspectorate to help accelerate the development of new water infrastructure to tackle current and future water resource constraints. See RAPID - Ofwat for more information.

PR14 Review: Discussion paper on findings
90
proposals for abstraction reform. It was intended to be complementary to the Environment Agency and Natural Resources Wales abstraction regulation at environmentally sensitive sites. We expected AIM to deliver additional benefits at a smaller number of sites.
By December 2014, the details of how the AIM would work in practice had not been finalised. Further work by the AIM taskforce was completed during 2015, including a consultation with the sector and stakeholders. We published updated guidance on AIM in February 2016,106 with the reputational incentive applied from April 2016. Where a company identified an AIM site, it set a trigger point for the AIM based on environmental assessments and views of local stakeholders. The AIM is considered to be ‘switched on’ when the flow rate of the river is at or below this trigger point. The company used its historic abstraction activity to determine when the AIM would have been ‘switched on’ in the past, ie times when river flows were below the trigger point, to set the AIM baseline. The company then had to capture abstraction data at each AIM site and report this data through its annual performance report.
Based on information from the Environment Agency, Natural Resources Wales and companies provided in October 2015, we expected AIM to apply to 11 of the 17 water companies from 1 April 2016 (see Table 6.1 below). Companies proposed 47 sites of which nine sites were reclassified as non-AIM sites following companies’ discussions with the Environment Agency. Affinity Water had the most AIM sites as all three of its supply regions were designated as areas of ‘serious water stress’ and it had a higher number of abstraction points on environmentally sensitive chalk stream sites. Across the other ten companies the AIM sites were evenly spread. Overall we saw companies reduce abstraction by over 15,000 Ml at 38 environmentally sensitive sites at low flows, although it is possible that companies would have reduced abstraction from these sites even without AIM.
Table 6.1: AIM sites and actual abstraction reduction at AIM sites during the 2016-20 period Company name Sites proposed by
water companies for inclusion in the AIM from 1 April 2016
Sites actually included in the AIM for the 2016-20 period
Total reduction in abstraction at AIM sites during the 2016-20 period (Ml)
Affinity Water 23 19 9,111 Anglian Water 2 2 81 Southern Water 4 1 15 Thames Water 5 4 2,864 South East Water 2 2 277 Yorkshire Water 2 - -
106 Ofwat, Guidelines on the abstraction incentive mechanism, February 2016.

PR14 Review: Discussion paper on findings
91
Wessex Water 1 1 1,299 South Staffs Water 2 3 60 Northumbrian Water
1 1 943
Portsmouth Water 1 1 - United Utilities 4 4 457 Total 47 38 15,106
In response to our call for input, Affinity Water commented that AIM was a clear stepping stone in the path to restoring sustainable abstractions. Wessex Water stated that it changed its approach to water abstraction.
Others commented that AIM could have had a greater impact. Some noted that AIM was skewed towards a limited number of companies with the most environmentally sensitives sites and so had a very narrow focus. Others noted that in PR14, AIM was reputational and that this was not strong enough to incentivise a change in behaviour. During our development of the PR14 methodology we had intended for AIM to be a financial incentive however we could not obtain sufficiently robust data to set a cross-company financial incentive. By setting AIM on a reputational basis we intended to use the information companies reported on annually to help with the development of a financial incentive at PR19.
A number of stakeholders commented that they favoured more holistic approaches backed up by Government initiatives with a focus on reducing overall abstraction, not just at environmentally sensitive sites. This view aligns with DEFRA’s ongoing plans for abstraction reform107 and the creation of RAPID to focus on promoting the development of new national water supply options that are in the best interests of the environment longer term. 108
For PR19, we maintained AIM, with the expectation that all companies participated and applied financial incentives to provide a greater encouragement for companies to reduce abstraction at environmentally sensitive sites at low flows. Companies identified 49 AIM sites with all bar two companies, Hafren Dyfrdwy and Yorkshire Water, having AIM sites for the 2020-25 period. Further assessment of the effectiveness of this incentive should take place during the 2020-25 period to determine if this should be maintained longer term. Future price reviews might consider a more holistic approach to reducing overall abstraction, not just at environmentally sensitive sites.
107 DEFRA, Water abstraction plan 2017, updated September 2020. 108 See RAPID - Ofwat for more information.

PR14 Review: Discussion paper on findings
92
Abstraction incentive mechanism key findings
• Overall we saw companies reduce abstraction by over 15,000 Ml at 38 environmentally sensitive sites at low flows, although it is possible that companies would have reduced abstraction from these sites even without AIM.
• The introduction of AIM in PR14, initially as a reputational incentive, allowed us to move to a financial incentive at PR19, with an increased number of sites being put forward under the mechanism.
Water efficiency performance commitments
During the 2015-20 period two performance commitments, leakage and per capita consumption,109 were intended to encourage companies to improve water efficiency and focus on a more sustainable use of water resources. As we explained in Section 4, although our outcomes approach helped focus companies on customer outcomes, in places our framework could have been more stretching, and this includes on the leakage and per capita consumption PCs.
Leakage
Managing leakage is important for ensuring that water supplies are resilient long term and can help to reduce the need for abstraction if more of the water distributed is not lost from the network.
At PR14 we asked companies to propose performance commitment levels for leakage. Companies in part used an approach called the sustainable economic level of leakage (SELL) to determine the performance commitment levels. SELL was a method of identifying the level of leakage at which further reductions would be more expensive than the cost of abstracting, treating and distributing additional water. A joint report by the Environment Agency, Ofwat and Defra in late 2012 found that SELL tended to
109 Dŵr Cymru, Northumbrian Water, Thames Water and South East Water did not have per capita consumption performance commitments at PR14.

PR14 Review: Discussion paper on findings
93
reinforce the status quo and did not incentivise efficiency or innovation.110 As a result of our concerns with SELL in our PR14 methodology, we asked companies to take a more holistic view on leakage and not rely purely on SELL. Companies were expected to take the joint report recommendations for improving SELL into account in addition to customer views and providing robust evidence to support their proposed leakage reduction levels.
We think the sector could have achieved more on leakage and our framework did not stretch them enough. During the 2015-20 period, we saw leakage on average across the sector reduce by 6% (see Figure 6.1). This is 1% more than the sector committed to deliver at the beginning of the period. However, much of this reduction occurred in the final year, after the more stretching PR19 PCLs were announced, with leakage increasing by 1% on average across the sector by 2018-19, followed by a 7% reduction in the final year of the 2015-20 period. Some companies had significant issues with leakage, most notably Thames Water whose management of leakage led us to take enforcement action.111
Between 2000-01 and 2019-20, the sector achieved an overall leakage reduction of 10%, an annual average reduction of 0.5%, despite large technological improvements over the same period. The modest reductions over the last 20 years, including the 2015-20 period, contrasted to the significant reductions achieved in the four years following the 1995-96 drought, where the sector achieved a greater than 30% reduction in leakage.
110 Environment Agency, Ofwat, Defra, ‘Review of the calculation of sustainable economic level of leakage and its integration with water resource management planning’, October 2012. The report also highlighted that there are many uncertainties that the SELL methodology addressed poorly, namely the lack of consideration of the social and environmental costs of leakage in determining the value of water. The consideration of social and environmental costs of leakage would increase the value placed on water and thereby would reduce SELL. The report noted that the methodology to determine the costs of reducing leakage had some significant limitations, too. Specifically, companies used their own costs of reducing leakages to set SELL, which in practice meant that inefficient companies in reducing leakage would have higher costs, which would result in a higher SELL and, consequently, a softer leakage target. 111 Notice of Ofwat’s imposition of a financial penalty on Thames Water Utilities Limited.

PR14 Review: Discussion paper on findings
94
Figure 6.1: Sector leakage performance from 1992-93 to 2019-20
Source: Ofwat analysis Note: (*) corresponds to the cumulative change starting with the first year available.
This trend does mask some large reductions in leakage achieved over the 2015-20 period, which show that considerable leakage reductions are possible. Portsmouth Water and Bristol Water reduced leakage by 18% over the 2015-20 period and within 2019-20 alone, Affinity Water, Bristol Water, Hafren Dyfrdwy and Portsmouth Water all reduced leakage by more than 10%. Nearly all of the companies that achieved substantial leakage reductions in 2019-20 reported significant programmes to enhance network monitoring.112 Indeed, since 2018-19, several thousand acoustic loggers have been installed across networks to enable more efficient and accurate leakage detection. Companies reported that the increase in investment in leakage was in part a driver in the 2019-20 sector overspend. However, companies have also commented that the milder winter in 2019-20 contributed to the lower leakage levels reported.
These trends suggest that the performance commitment levels set at PR14, partly on the basis of SELL, could have been more stretching for the sector as a whole, and the incentives offered through ODIs to go further during the 2015-20 period were not strong enough for some companies.
112 Ofwat, Service delivery report 2019-20, p 16.

PR14 Review: Discussion paper on findings
95
Per capita consumption
Water efficiency was identified as a key priority for customers at the beginning of PR14. Lowering per capita consumption means less water is taken from the environment and fewer resources are required to extract, treat and distribute it.
Although companies ran water efficiency campaigns and increased their metering programmes during the 2015-20 period, this did not result in demand side reductions overall at the sector level. As Figure 6.2 shows across the sector, per capita consumption increased by 2% from 139 litres per head per day in 2014-15 to 142 litres per head per day in 2019-20. In the PR14 call for input, companies commented that weather events such as the hot dry summer in 2018 and the start of the Covid-19 pandemic (albeit only in the final quarter of the final year of the period) resulted in customer demand increases.
Figure 6.2: Sector per capita consumption between 2012-13 and 2019-20
Source: Ofwat analysis Note: (*) corresponds to the cumulative change starting with the first year available.
All companies reported annual per capita consumption during the 2015-20 period. However, only 13 out of 17 companies had per capita consumption performance commitments. Of these, eight companies had ODIs with reputational incentives and only five had financial incentives. This is shown in Figure 6.3 below.

PR14 Review: Discussion paper on findings
96
Figure 6.3: Percentage change in per capita consumption over PR14, by PC type
Only five companies improved their per capita consumption performance over the 2015-20 period. This included SES Water and Southern Water which had financial ODIs, although only Southern Water received an outperformance payment as SES Water’s was underperformance-only. The other three companies with financial ODIs incurred underperformance payments over the period. Dŵr Cymru, which had no PC, reported the second worst change in performance with an increase greater than 10%, behind South West Water (which had a reputational PC and reported an increase of over 13%). On the other hand Thames Water and South East Water, which also did not have a per capita consumption PC in PR14, were among the five companies that improved performance. Therefore, the connection between the incentives which applied at PR14 and resulting changes in performance is unclear.
Overall, however, at the sector level, the bespoke performance commitments set at PR14 and the associated mix of reputational and financial incentives were not effective in driving performance improvements in per capita consumption over the 2015-20 period.

PR14 Review: Discussion paper on findings
97
Water efficiency performance commitment key findings
• The sector could have made more progress on leakage. Leakage increased by 1% on average across the sector by 2018-19, with a 7% reduction in the final year of the 2015-20 period, after the more stretching PR19 15% leakage reduction challenge was announced. The performance commitment levels set at PR14, partly on the basis of SELL, could have been more stretching for the sector as a whole, and the incentives offered through ODIs to go further during the 2015-20 period were not strong enough for some companies.
• Companies also needed to do more to reduce customer side demand. Per capita consumption increased by 2% from 139 litres per head per day in 2014-15 to 142 litres per head per day in 2019-20. At the sector level the bespoke performance commitments set at PR14 and the associated mix of reputational and financial incentives were not effective in driving performance improvements in per capita consumption over the 2015-20 period.

PR14 Review: Discussion paper on findings
98
7. Targeting controls
Key findings
Based on our assessment of the impact of the separation of controls at PR14 we have found that:
• The creation of the wholesale and retail controls were effective at improving transparency and understanding of costs allocated between the water, wastewater, residential retail and business retail services delivered across the sector;
• The separation of the residential retail control led to a focus on residential retail costs and significant efficiency improvements in some companies as well as service improvements
Introduction
PR14 marked the first separation of price controls into two distinctly different activities within the water and sewerage business – wholesale and retail. The wholesale control was further separated into water and wastewater services. The retail control was further separated into residential and business services. We introduced separate cost and delivery incentives between wholesale water, wholesale wastewater and retail services. This contrasted with previous price reviews where a cost allowance and outputs were set for the whole business as one control.
In this section we consider whether PR14 was effective in achieving the following aims:
• Increasing transparency and understanding of costs across the sector as a result of separating controls by service.
• Creating efficiency benefits from the separation of controls by service.
The separation of controls also supported the opening of the business market. We have not considered the development of the business retail market in this review. We reviewed the business retail control in 2016113 prior to market opening, and in 2018 we also reviewed the protections available to business customer after the market had
113 Ofwat, Business-retail-price-review-2016-final-determinations-Final.pdf (ofwat.gov.uk), December 2016.

PR14 Review: Discussion paper on findings
99
opened, with revised price protections taking effect from April 2020.114 Our review was informed by our ongoing market monitoring, including the annual publication of a State of the Market Report.115
Transparency and understanding of costs
The separation of controls built on the accounting separation changes made between 2011 and 2013. The accounting changes required companies to report at a more granular level on both wholesale and retail costs, thereby increasing our, and the sector’s, understanding of the costs of these activities. Progress on accounting separation enabled us to go one step further in PR14 and separate price controls for wholesale and retail with targeted incentives and cost allowances.
We now have five additional years of data on the costs of wholesale and retail activities for each company, along with data on service delivery in each area and companies’ responses to targeted cost allowances and incentives. Our understanding of cost and performance drivers and sensitivities in each part of the value chain, and the differences across companies, has been substantially improved. Our ability to target the full suite of regulatory tools to companies’ wholesale or retail activities has been transformed, for example in assessing wholesale charges to new appointments and variations (NAVs) or retailers.
Companies told us that the separation of controls encouraged a thorough review of the allocation of costs and activities across their businesses. A majority of companies in their responses to the PR14 call for input commented that this led to improvements in the transparency and understanding of their costs in different parts of the value chain.
Companies focused in particular on the increased understanding of retail business. Historically, retail costs were masked by the much larger costs of the wholesale business, which accounts for over 90% of costs. Several companies stated that the PR14 approach stimulated helpful internal discussions about the most effective allocation of costs and activities between wholesale and retail, with a number of natural divisions identified and potential areas for cost savings identified. However, two companies highlighted that there were challenges with shared and indirect costs which were more difficult to clearly allocate between controls.
114 Ofwat, REC-consultation-decision-document.pdf (ofwat.gov.uk), January 2018. 115 Ofwat, State of the market 2019-20: Review of the third year of the business retail water market - Ofwat, August 2020.

PR14 Review: Discussion paper on findings
100
We received fewer comments from stakeholders on the benefits of separating wholesale water and wastewater services. Many companies that deliver both water and wastewater services stated that they largely operated and reported on both businesses separately before PR14. Therefore the separation of wholesale controls between water and wastewater had less of an impact as companies were already effectively separate but in a non-legally binding way before PR14.
Within the separate wholesale control, we gradually phased into use more granular water and wastewater cost and revenue reporting requirements over the 2015-20 period. This approach was designed to encourage companies to reveal more information about costs and revenues associated with company activities such as water treatment through their annual reporting. Revealing this information helped to facilitate the separation of the bioresources and water resources controls as part of the PR19, allowing upstream markets to be developed in these areas.
Transparency and understanding of costs key findings
• The creation of the wholesale and retail controls were effective at improving transparency and understanding of costs allocated between services delivered across the sector.
• The more granular water and wastewater reporting requirements phased in during the 2015-20 period helped to facilitate the separation of the bioresources and water resources controls as part of PR19.
Delivering efficiency benefits
In addition to improving transparency and better understanding of costs, another benefit of the separation of controls was to allow distinct cost allowances and outcome delivery incentives between retail and wholesale services. This better targeting of cost assessment and performance incentives meant that the potential scope for efficiency improvements in both residential retail and wholesale could be more easily identified by us and delivered by companies. We have assessed the extent to which the separation of controls helped to deliver efficiencies at two levels: residential retail and wholesale. We address each of these in turn.
Residential retail
By creating a separate control for residential retail at PR14, notable differences in costs between companies for delivering the same service were highlighted. This ability to benchmark against others in the sector was expected to encourage those companies

PR14 Review: Discussion paper on findings
101
with higher costs at the beginning of the period to focus on identifying efficiency benefits to lower their costs during the period. For those companies with the highest costs we set a three year glidepath with a reducing allowed cost to serve on the expectation that these companies would meet the average sector cost to serve by 2018-19.
We have compared the average cost to serve across the sector, normalised by number of services provided to each customer and found some convergence between 2015-16 and 2018-19 although this was reversed in 2019-20 (more on this below). As Figure 7.1 shows, the four companies with the highest cost to serve in 2015-16 (green lines) reduced their average cost to serve between 2015-16 and 2018-19 and thereby reduced the gap to the more cost-efficient companies (blue lines) in this period. What is more, they did so without evidence that they compromised on service quality. All four companies with the highest cost to serve improved both their absolute scores in the Service Incentive Mechanism (SIM) and their relative ranking between 2015-16 and 2018-19.
Figure 7.1: Comparison of cost to serve (including metering) per residential retail customer across a selection of companies during the 2015-20 period (2012-13 prices)
Source: Ofwat analysis
In 2019-20, the average cost to serve increased substantially for the sector overall and for 15 (out of 17) companies. In the 2019-20 annual performance reports, companies stated that an increase in bad debt provisions in response to the Covid-19 pandemic in

PR14 Review: Discussion paper on findings
102
the final two months of the financial year were a factor in the increase in their residential retail costs. For example, Southern Water increased its bad debt charge by £16 million as it suspended debt collection activities in response to the Covid-19 lockdown and reassessed outstanding debt in light of the pandemic. Furthermore, Severn Trent Water highlighted that it had revised its bad debt risk from 2.7% to 3.2% as a result of provisions for Covid-19. A number of companies put in place additional customer service measures such as payment holidays targeted at vulnerable customers and Covid-19 information campaigns for which they had not planned.
During the 2015-20 period, as can be seen in Figure 7.2, a majority of companies (10 out of 17) overspent against allowances and the sector overspent its residential retail allowance by 4.3% on average. In their annual performance reports, companies stated that they invested in new systems and teams to improve customer service and a number restructured to deliver long-term efficiencies. As mentioned above, Covid-19 had an impact in the final two months of the 2019-20 financial year. South West Water underspent its residential retail allowance and managed to reduce its average cost to serve over the period so that it was closely aligned to the industry average by 2018-19. This suggests that South West Water was able to identify efficiency savings to reduce the cost to serve its customers without compromising on customer service.116 Southern Water, on the other hand, overspent its allowance by 36% but its average cost to serve fell to close to the industry average by 2018-19.
Figure 7.2: Residential retail allowance performance by company during the 2015-20 period
Source: Ofwat analysis
116 Between 2015-2019, customer satisfaction was measured by the service incentive mechanism (SIM). South West Water was one of the best performing companies for customer satisfaction during this period.

PR14 Review: Discussion paper on findings
103
Note: (+) denotes overspend while (-) denotes underspend.
Delivering efficiency benefits key findings
• Retail services and costs had historically received less focus by companies as they formed a small part of the overall business. Creating a separate retail control highlighted differences in costs between companies for delivering the same service. This encouraged companies to reflect on their cost allocations and the level of service provided. For residential retail we saw that this resulted in efficiency benefits being realised and service level improvements being delivered for customers.

PR14 Review: Discussion paper on findings
104
8. Next steps
We welcome any comments or feedback you may have on the findings we present in this paper. We will consider any feedback we receive in our final report which will be published towards the end of 2021 and will be considered as we develop the draft PR24 methodology. Feedback must be received by Ofwat no later than 5 pm on 22 September 2021.
If you wish to provide feedback, please submit this by email to [email protected] or post it to:
PR14 review findings response Ofwat Centre City Tower 7 Hill Street Birmingham B5 4UA
We will publish responses to this consultation on our website at www.ofwat.gov.uk, unless you indicate that you would like your response to remain unpublished. Information provided in response to this document, including personal information, may be published or disclosed in accordance with access to information legislation – primarily the Freedom of Information Act 2000 (FoIA), the General Data Protection Regulation 2016, the Data Protection Act 2018, and the Environmental Information Regulations 2004. For further information on how we process personal data please see our privacy policy.
If you would like the information that you provide to be treated as confidential, please be aware that under the FoIA there is a statutory ‘Code of Practice’ which deals, among other things, with obligations of confidence. In view of this, it would be helpful if you could explain to us why you regard the information you have provided as confidential. If we receive a request for disclosure of the information, we will take full account of your explanation, but we cannot give an assurance that we can maintain confidentiality in all circumstances. An automatic confidentiality disclaimer generated by your IT system will not, of itself, be regarded as binding on Ofwat.

Ofwat (The Water Services Regulation Authority) is a non-ministerial government department. We regulate the water sector in England and Wales.
OfwatCentre City Tower7 Hill StreetBirmingham B5 4UAPhone: 0121 644 7500
© Crown copyright 2021
This publication is licensed under the terms of the Open Government Licence v3.0 except where otherwise stated. To view this licence, visit nationalarchives.gov.uk/doc/ open-government-licence/version/3.
Where we have identified any third party copyright information, you will need to obtain permission from the copyright holders concerned.
This document is also available from our website at www.ofwat.gov.uk.
Any enquiries regarding this publication should be sent to [email protected].