practical assignment optimization: waste collection roel wijgers, msc 23 november 2010
Post on 19-Dec-2015
214 views
TRANSCRIPT

Practical Assignment Optimization: Waste Collection
Roel Wijgers, MSc23 November 2010

Profile CQM
Focus on
Our basis
Our company
Planning
Logistics
Process improvement
Six sigma
Optimization
Logistic models
30 consultants, 30 years experience
Company completely owned by management and employees
Located in Eindhoven
Specialists in fact-based design and improvement of industrial, administrative and logisic processes
23 November 2010
© 2010 CQM b.v.2
Practical assignment: AVR - Van Gansewinkel
Offers integral waste services and reliable environmental solutions for 8
European countries
Specialized in collecting, transferring, recycling and processing waste
23 November 2010
3 © 2010 CQM b.v.

Practical assignment in a nutshell
Given the following inputs:
A list of orders of waste collection points
A distance matrix between waste collection points
A number of waste collection vehicles
A waste disposal location
Create the following plan:
Create a weekly schedule for each vehicle such that as much orders as possible
are fulfilled and the total use time of the waste collection vehicles is minimized
23 November 2010
4 © 2010 CQM b.v.
Orders AVR – Van Gansewinkel
AVR – Van Gansewinkel has various subscription types for sale for the
collection of waste:
Fixed schedule for customers
- Frequency varies from five times per week to once every 12 weeks. For this
assignment the frequency varies from one to five times per week.
One ore more containers with a volume of 140 to 5000 liters
23 November 2010
© 2010 CQM b.v.5

Valid frequencies for waste collection
When a customer subscribes for example for garbage collection twice per week, the two collection times should be more or less evenly spread over the weekTable below shows valid waste collection patterns
Indication Frequency Valid patterns
1PWK Once per week mo, tu, we, th, fr
2PWK Twice per week mo_th, tu_fr
3PWK Three times per week mo_we_fr
4PWK Four times per week mo_tu_we_th, mo_tu_we_fr, mo_tu_th_fr, mo_we_th_fr, tu_we_th_fr
5PWK Five times per week mo_tu_we_th_fr
23 November 2010
© 2010 CQM b.v.6

Fleet AVR – Van Gansewinkel
2 vehiclesBoth vehicles available on Monday to Friday from 6:00h until 18:00hOutside the times above the vehicles have to be empty and be present at the waste disposal locationThe capacity per vehicle is 20.000 liters
The volume of waste is reduced by a factor five when it is collected (a container of 1000 liters corresponds with a volume of 200 liter in the garbage collection vehicle)- Containers usually are not completely filled- Waste is thickened by compressing it
23 November 2010
© 2010 CQM b.v.7
Disposal of waste
Collected waste has to be taken to the waste processor which is located
at the waste disposal location
Disposal of waste always takes 30 minutes
It is allowed to dispose waste more than once per day
The two vehicles may dispose waste at the same time
When waste is disposed at the end of the day, the waste disposal has to
be finished before 18:00h
23 November 2010
© 2010 CQM b.v.8

Main goal of assignment
Make routes whereby for each customer the waste is collected
with the agreed frequency
The total use time of the vehicles has to be minimized. The total
use time is the sum of:
- Time of emptying containers
- Total travel time
- Time of disposing waste
Orders have to be planned completely or not be planned:
- Not planning an order yields a penalty of 3 times the total emptying
time. The total emptying time is defined as the single emptying time
multiplied by the number of times an order has to be collected.
9

Datasets
Orderbestand.txt
AfstandenMatrix.txt
23 November 2010
© 2010 CQM b.v.
Order Unique number for the order
Plaats Location
Frequentie Collection frequency of the order
AantContainers Number of containers that have to be collected each time. All containers have the same type (volume)
VolumePerContainer Volume per container at the customer
LedigingsDuurMinuten Emptying time of this order (all containers together)
MatrixID Reference to the distance matrix
Xcoordinaat X coordinate of this order
Ycoordinaat Y coordinate of this order
MatrixID1 Reference of the from location
MatrixID2 Reference of the to location
Afstand Distance from the “from location” to the “to location” in meters
Rijtijd Travel time from the “from location” to the “to location” in seconds
10

Format solution
A route is a per vehicle (1 and 2) per day (1 through 5) ordered list
of orders that are collected after each other. The route also
contains one or more waste disposal moments.
Format file:
Vehicle; Day; Sequence number; Order
23 November 2010
© 2010 CQM b.v.
Vehicle {1, 2}
Day {1, …, 5} (1=mo, 2=tu, 3=we, 4=th, 5=fr)
Sequence number {1, 2, … } Sequence number from which the sequence of the route per vehicle per day can be deduced. The sequence may start per vehicle each day at 1.
Order Order from Orderbestand.txt. When the vehicle goes to dispose waste, this should be indicated with order number 0.
11

Waste disposal location
AVR – Van Gansewinkel Oost Brabant
Den Engelsman 4
Maarheeze
MatrixID = 287
23 November 2010
© 2010 CQM b.v.12

Omitted conditions
In the project CQM executed for AVR – Van Gansewinkel the following
conditions also had to be taken into account:
Continuity for the customer (collect garbage at the approximately the
same time each day)
Continuity for the driver (each day more or less the same addresses,
whereby some addresses are deleted or added)
Additional frequencies for orders
Different waste disposal locations with various disposal time and costs
Fuel costs
Vehicles are not homogeneous
23 November 2010
© 2010 CQM b.v.13

Results project
Saving in costs
Saving in kilometres
Saving in planning time
- At first a full time planner was required for about 3 to 4 months, this has been reduced
to approximately one month
More insight in the effects of new customers
23 November 2010
© 2010 CQM b.v.14

Questions
23 November 2010
© 2010 CQM b.v.15

Information about CQM
16© 2010 CQM b.v.23 November 2010
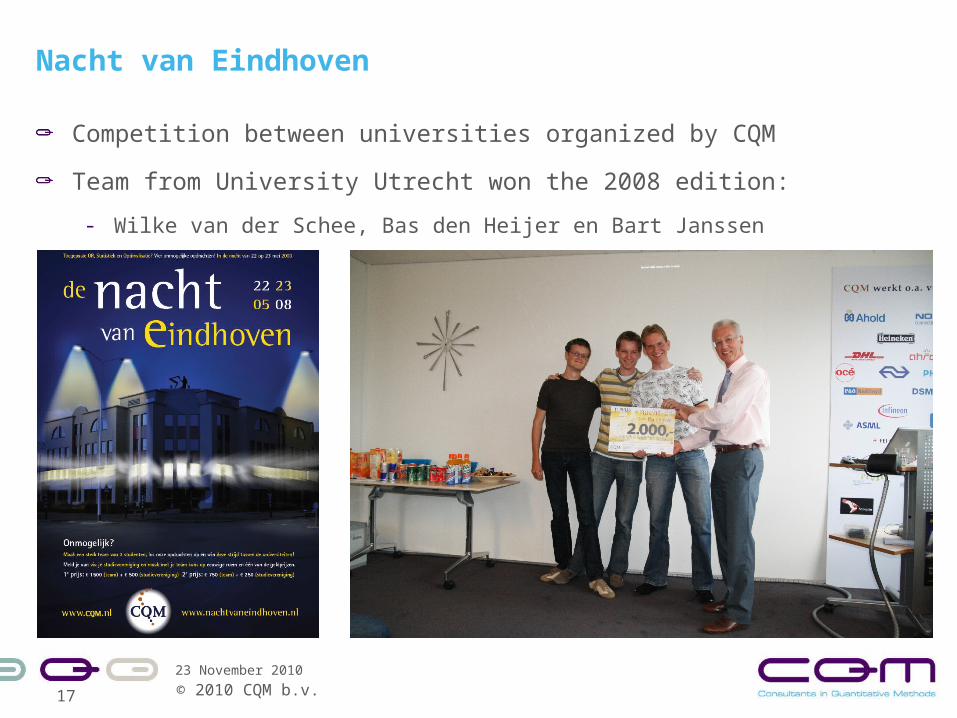
Nacht van Eindhoven
Competition between universities organized by CQM
Team from University Utrecht won the 2008 edition:
- Wilke van der Schee, Bas den Heijer en Bart Janssen
23 November 2010
17 © 2010 CQM b.v.

Profile CQM
Focus on
Our basis
Our company
Planning
Logistics
Process improvement
Six sigma
Optimization
Logistic models
30 consultants, 30 years experience
Company completely owned by management and employees
Located in Eindhoven
Specialists in fact-based design and improvement of industrial, administrative and logisic processes
23 November 2010
© 2010 CQM b.v.18

Employees and partners
Mathematicians, econometricians, and computer scientists:
15 PhDs
15 MA/MSc’s
19
23 November 2010
© 2010 CQM b.v.
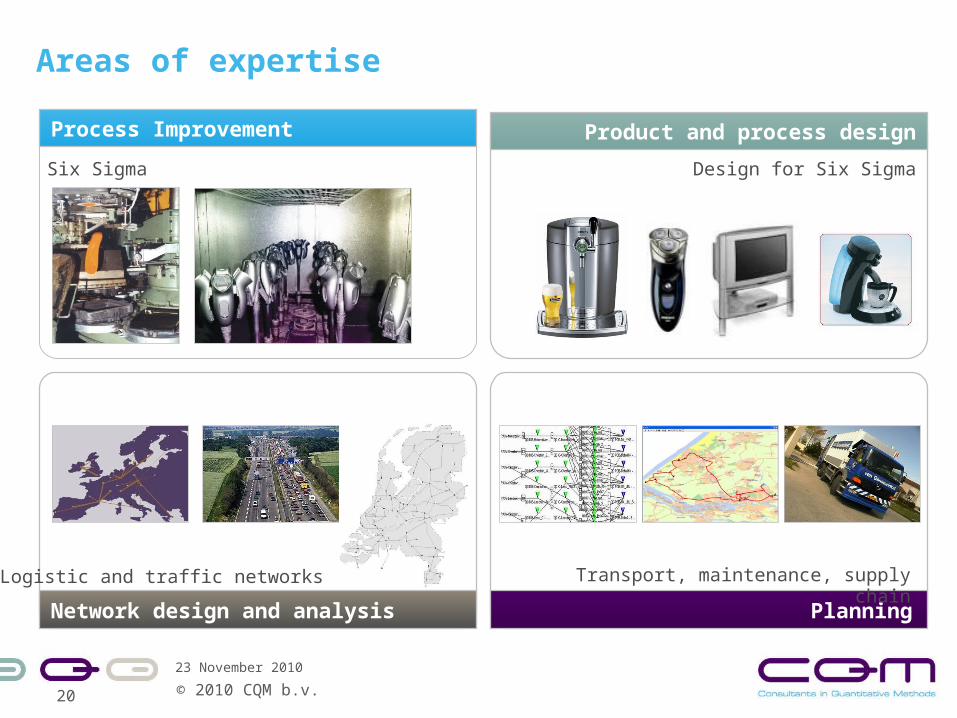
Areas of expertise
Product and process design
PlanningNetwork design and analysis
Process Improvement
Design for Six Sigma
Transport, maintenance, supply chainLogistic and traffic networks
Six Sigma
23 November 2010
© 2010 CQM b.v.20

References
23 November 2010
© 2010 CQM b.v.21


Process improvement - 6sigma
Improved efficiency of processes
Insight into critical mechanisms and parameters
Better controlled processes
Trained green & black belts
Throughput times too large
Quality is insufficient
Yields are too low
Logistic costs are too high
…..
Focus on result
Awareness
Training
Coaching in projects
Problem
ApproachResult
Processimprovement
23
23 November 2010
© 2010 CQM b.v.

Product design Philishave - Philips DAP
Optimal design:
Fact-based for tolerances of critical design parameters
Collection of designs that pass the CTQ demands
Design robust for process variance
Optimize the design of the Philishave
CTQs closeness and irritation within confidence limits
Variance of the process under control
Qualitative model te determine critical design parameters
Quantitative model for relation between CTQs and design parameters
Model-based tolerancing
Problem
ApproachResult
DFSS
24
23 November 2010
© 2010 CQM b.v.

LOT - DHLTransport planning
Quantification of synergy advantage
Automated planning
200.000 orders a week
Develop Linehaul optimization tool (Lot)
Schedule for packet streams in Europa
Huge network
Multimodal transport
Dock allocation, transfer
Analysis and specification phase
Software implementation
Training and implementation in organisation
Problem
ApproachResult
Transportplanning
25
23 November 2010
© 2010 CQM b.v.
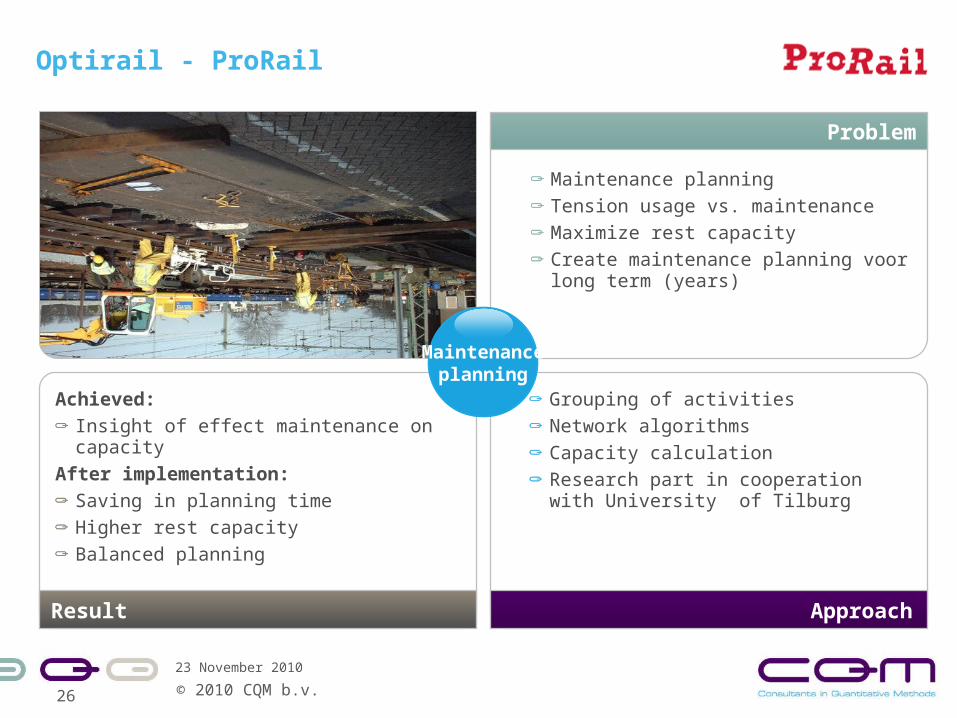
Optirail - ProRail
Achieved:
Insight of effect maintenance on capacity
After implementation:
Saving in planning time
Higher rest capacity
Balanced planning
Maintenance planning
Tension usage vs. maintenance
Maximize rest capacity
Create maintenance planning voor long term (years)
Grouping of activities
Network algorithms
Capacity calculation
Research part in cooperation with University of Tilburg
Problem
ApproachResult
Maintenanceplanning
26
23 November 2010
© 2010 CQM b.v.

Design of logistic network
For a lot of customers the ideal organization
of the logistic network has been established.
Design and improvement of the
logistic network w.r.t.
Warehouse locations, Production options
Supply concepts
Take into account:
Transport, warehouse and stocking costs
Requirements delivery
Development of innovative planning logic in cooperation with TU/e
Implement interactive planning software
Development of new planning process
Problem
ApproachResult
Supply Chain
planning
23 November 2010
© 2010 CQM b.v.27