practical use of asset management and structured decision making case study: seattle public...
TRANSCRIPT

Practical Use of Asset Management and Structured
Decision Making
Case Study: Seattle Public Utilities
Solid Waste Facilities Master Plan
Presented by: Jenny Bagby
Principal Economist
Seattle Public UtilitiesMay 2, 2006

Outline of Presentation
• Overview of Seattle’s waste management system• Description of problem of planning for new
facilities• Use of three types of analysis to help choose
among options– Benefit cost analysis– Value modeling– Decision analysis for modeling risk and uncertainty
• Conclusion
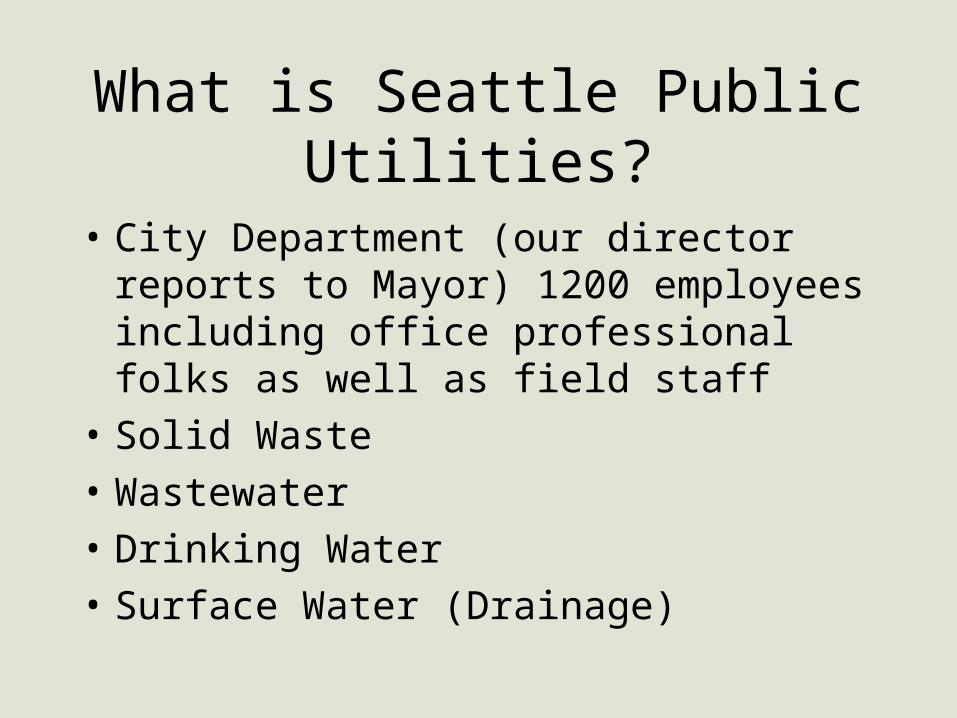
What is Seattle Public Utilities?
• City Department (our director reports to Mayor) 1200 employees including office professional folks as well as field staff
• Solid Waste
• Wastewater
• Drinking Water
• Surface Water (Drainage)

Project Background
• Long-range planning (30 + years)
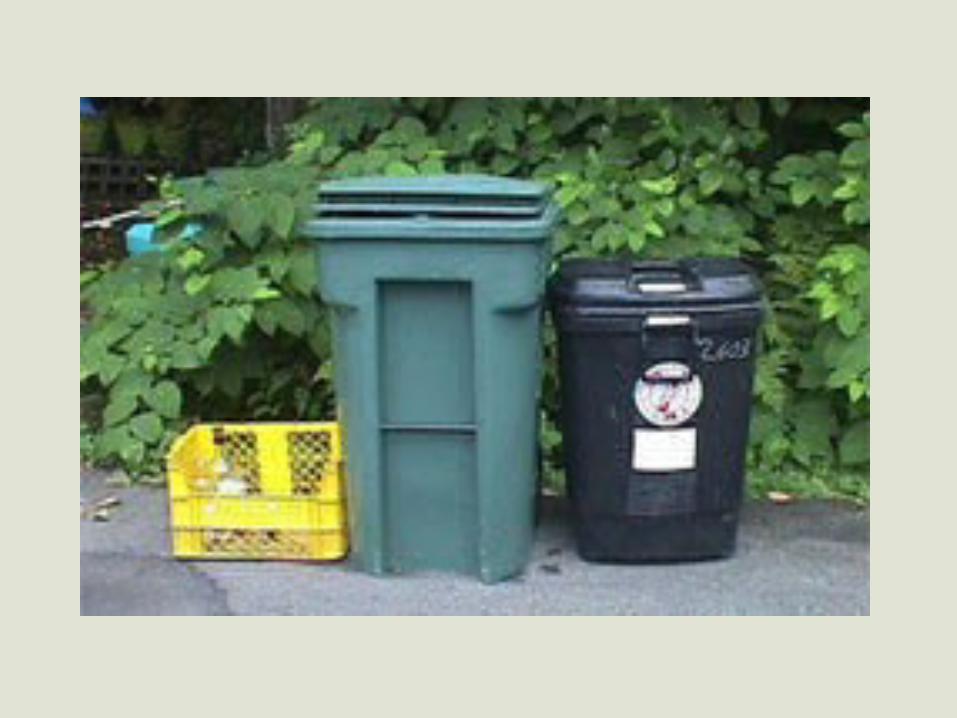
• Involves collection, transfer, and disposal of municipal solid waste - Garbage, Yardwaste and Recyclables
• Primary customers affected are the self-haul customers at the recycling and disposal stations (RDS) and adjacent neighbors

The Problem
• The City’s two transfer stations are old and outdated
• Transfer station reliability decreasing
• Transfer system inefficiencies
• Quality of customer service is decreasing
• Existing facilities lack flexibility

Many Existing Problems
• Safety concerns• Old wiring• Seismic retrofit needed• High Maintenance
(floors, compactor)• Too many “band-aid”
fixes

System Overview Facilities
• Two city-owned transfer stations
• Two privately-owned transfer stations
• Two intermodal rail yards
• Two private processing facilities for recyclables
• Private processing facility for organics composting
• Private landfills
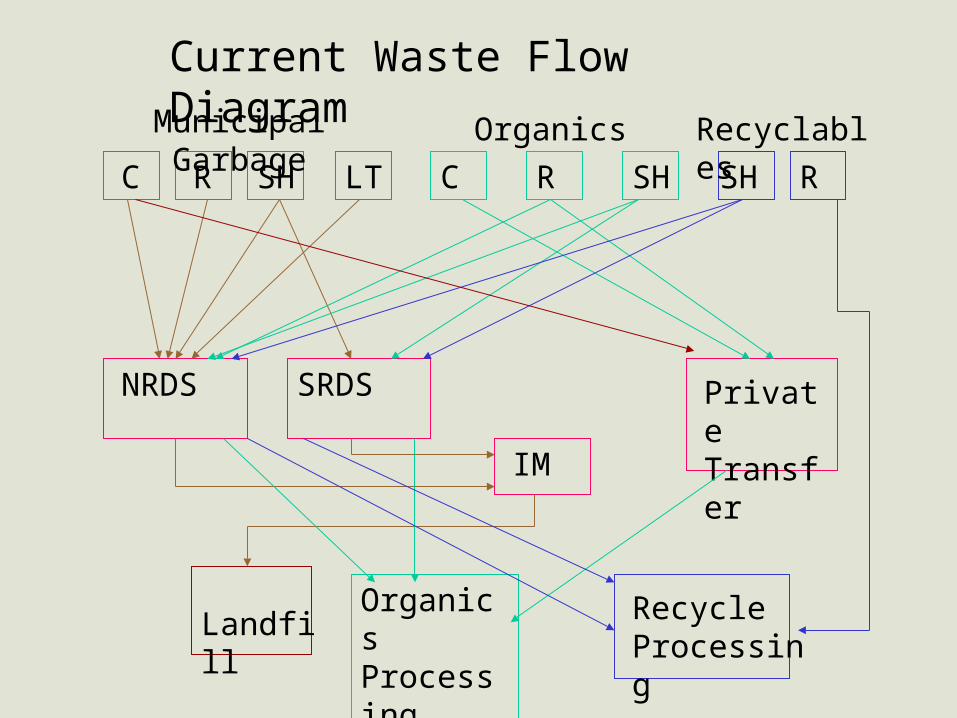
C R SH LT
Municipal Garbage Organics Recyclables
NRDS SRDS
IM
Private Transfer
C R SH SH
LandfillOrganics Processing
Recycle Processing
Current Waste Flow Diagram
R
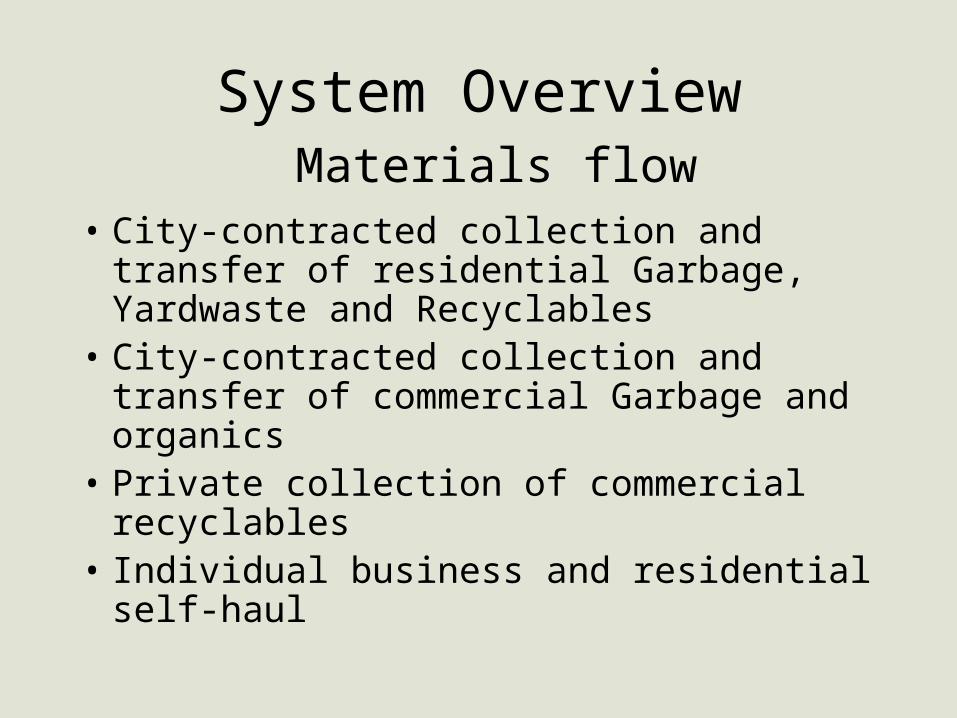
System Overview Materials flow
• City-contracted collection and transfer of residential Garbage, Yardwaste and Recyclables
• City-contracted collection and transfer of commercial Garbage and organics
• Private collection of commercial recyclables
• Individual business and residential self-haul

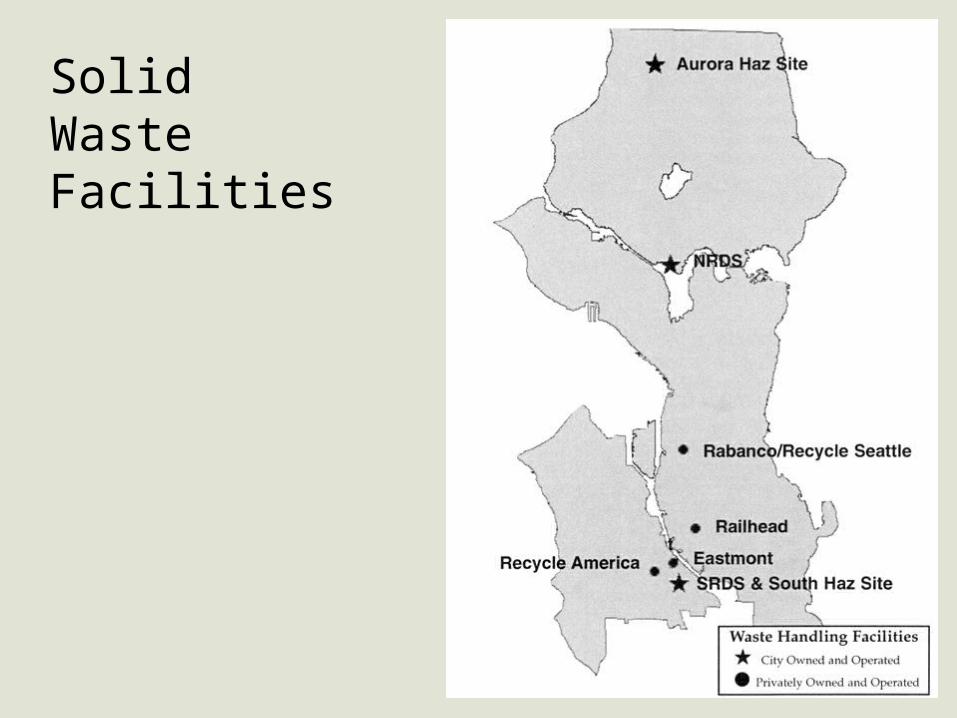
Solid Waste Facilities


Rail Landfill Connection
• Two Railroad Companies Serve Seattle
• Most Large Regional Landfills are Linked by Rail
• Access to more than one rail line opens access to different landfills creating more competition

Rabanco - Burlington Northern/Santa Fe - Roosevelt Landfill

Waste Management Inc. - Union Pacific - Columbia Ridge Landfill


Understanding the System
• Public & private facilities work in conjunction with each other
• Waste flows to different facilities can change over time
• A flow change to one facility affects the others

Vertical Integration of Solid Waste Business
• Industry consolidation (fewer solid waste service companies than before)
• Companies strive to control all aspects of the market (collection, transfer, long-haul, and disposal)
• An integrated company can reduce operation costs, but may also reduce competition

Project Objectives
• Improve transfer efficiency of solid waste and recyclables
• Improve self-haul customer service
• Minimize neighborhood impacts from transfer stations
• Increase reuse and recycling opportunities
• Provide long-term system flexibility

Primary Questions
• What is the appropriate mix of public and private facilities?
• Remodel or rebuild city stations?
• Do we need additional property at the city stations?
• Does a city-owned intermodal transfer station make economic sense?

Initial Assessment
• A city-owned facility is needed in north and south Seattle
• Siting options are limited; no substantially better sites were found for the City stations
• A third City-owned intermodal transfer facility needs to be evaluated

Enter Asset Management
• AKA Full Employment for Economists• C/B Analysis on all decisions (especially
ones this large)• Emphasis on quantifying in $ terms
everything we possibly can• Challenging!• CH2MHill to the rescue - Value Model and
Decision Framework

Required Elements of an Effective Decision Framework
Develop Value Modeland FormulateAlternatives
DevelopImplementation
Plan
Organizational
Analytical
• Solve the right problem • Put interests & values first • Avoid advocacy & positions• Avoid useless data• Find lowest cost solution• Manage risk and liability• Track progress
CollectMeaningful,Reliable Data
EvaluateAlternativesand MakeDecision
Frame the Problem
Ensure Leadership andCommitment
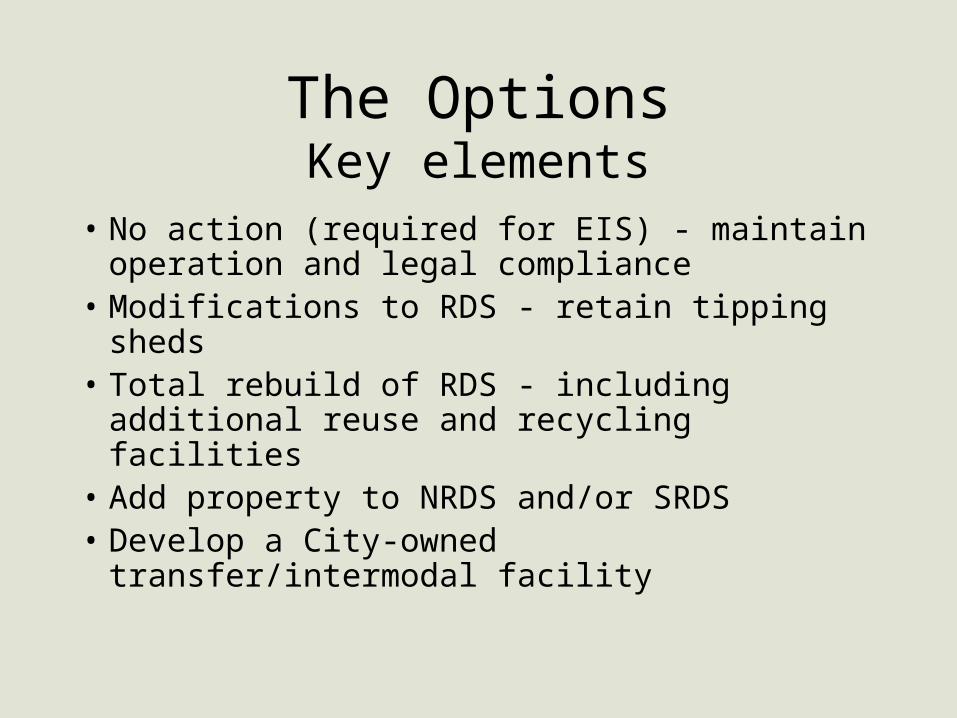
The OptionsKey elements
• No action (required for EIS) - maintain operation and legal compliance
• Modifications to RDS - retain tipping sheds• Total rebuild of RDS - including additional
reuse and recycling facilities• Add property to NRDS and/or SRDS• Develop a City-owned transfer/intermodal
facility

Options Assessment Steps
• Develop options
• Identify Quality of Service goals & criteria
• Prepare conceptual layout designs for preferred options
• Model Costs, Risk and Quality of Service performance for preferred options
• Revise options based on results

Intermodal Site

South Recycling and Disposal Station Option 11
Asset Management
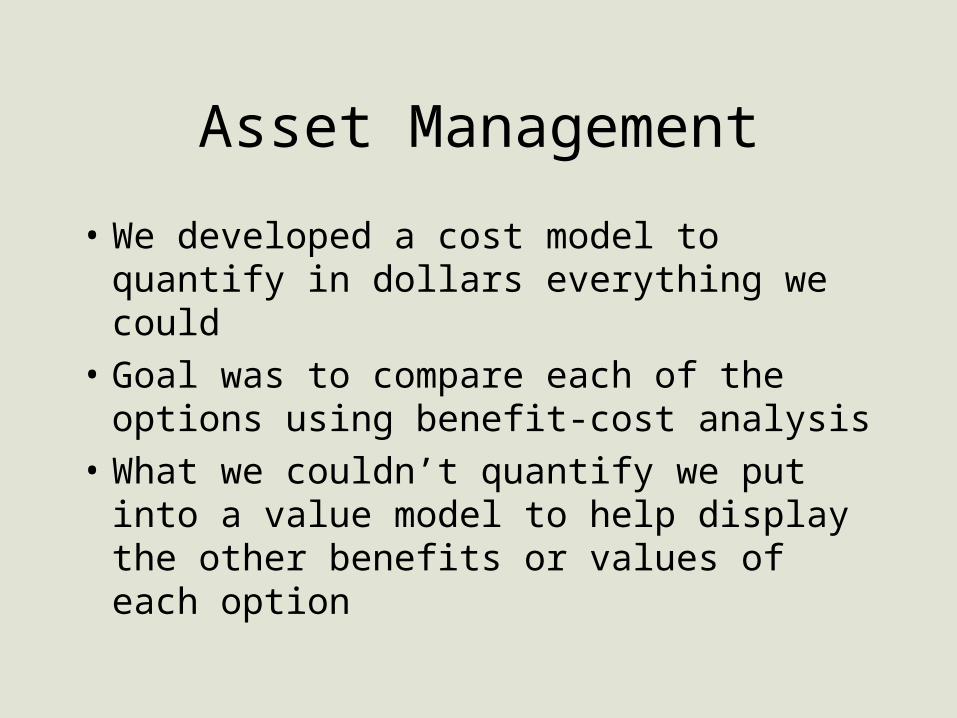
• We developed a cost model to quantify in dollars everything we could
• Goal was to compare each of the options using benefit-cost analysis
• What we couldn’t quantify we put into a value model to help display the other benefits or values of each option

System Cost ModelCost model calculates total system NET cost
over 30 years of:
• Transfer
• Rail loading and hauling
• Processing
• Disposal
• Collection (IF option results in changes to collection costs)

System Cost Model• Costs include:
– Property Purchase/Lease– Construction Costs – Equipment Capital– Labor and Other O&M – Contractor payments such as Disposal, Private
Transfer, Processing– Long term competitive benefits of partnering– Revenues from partner tons

Example Labor and Equipment CostModel Inputs
Capital EquipmentCalculatedunit price
Tons(Trips) per
hourOperator req't
Useful lifein years
based on2080 hr/yr
Maint peroperating
hour
Scale 1In Scale-70 ft w/Labor $72,240 90 1 63.0 $2.75In Scale-70 ft NO Labor $72,240 90 1 63.0 $2.75Waste CompactionTrack Loader (pit) $340,200 100 1 5.0 $25.00Wheel Loader (push) w/Labor $251,400 100 1 5.0 $22.00Compactor 1 Bale $1,076,160 100 1 14.0 $13.35Compactor 2 Bale $750,000 75 0.5 14.0 $13.35Yard Goat $99,240 200 1 6.0 $12.00Broom Floor Labor Existing $0 15 1 15.0 $0.00HaulingG Tractor N to Argo 25t $117,240 19 1 4.0 $20.00G Tractor S to Argo 25t $117,240 28 1 4.0 $20.00Rail LoadingReach Stacker $576,000 660 2 14.0 $16.00Gantry Crane 75 ft $1,800,000 990 2 29.0 $16.00

Cost Results
Option 4: Cost by Function
$-
$10,000,000
$20,000,000
$30,000,000
$40,000,000
$50,000,000
$60,000,000
$70,000,000
$80,000,000
20
04
20
06
20
08
20
10
20
12
20
14
20
16
20
18
20
20
20
22
20
24
20
26
20
28
20
30
20
32
20
34
20
36
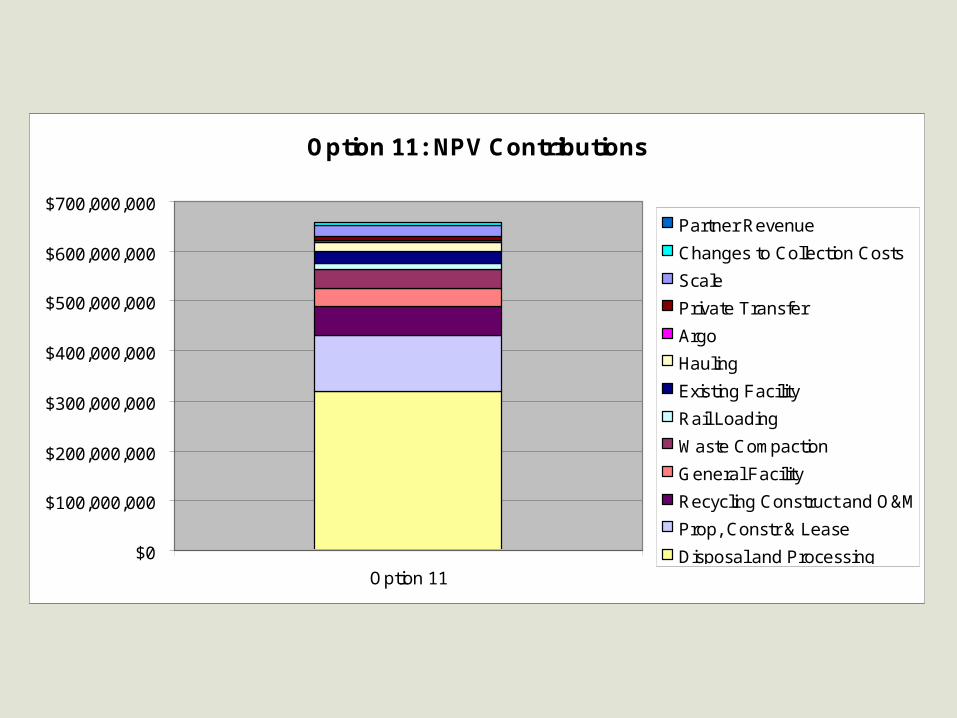
Option 11: NPV Contributions
$0
$100,000,000
$200,000,000
$300,000,000
$400,000,000
$500,000,000
$600,000,000
$700,000,000
Option 11
Partner Revenue
Changes to Collection Costs
Scale
Private Transfer
Argo
Hauling
Existing Facility
Rail Loading
Waste Compaction
General Facility
Recycling Construct and O&M
Prop, Constr & Lease
Disposal and Processing

Cost ResultsComparison of NPV for Options 1-7
-$100,000,000
$0
$100,000,000
$200,000,000
$300,000,000
$400,000,000
$500,000,000
$600,000,000
$700,000,000
Option 0 Option 1 Option2A
Option2B
Option 3 Option4A
Option4B
Option 5 Option 6 Option 7

Quality of ServiceAssessment
Primary Services Provided
• Waste reduction & recycling
• Customer service
• Work environment
• Built environment (community) impacts
• Natural environment impacts
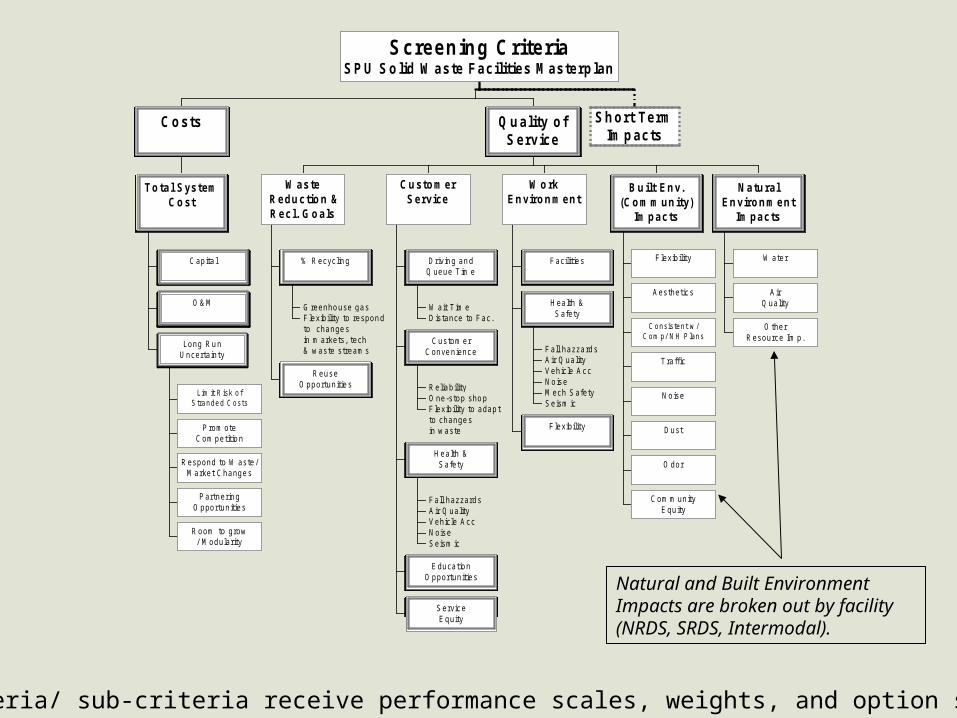
Shaded criteria/ sub-criteria receive performance scales, weights, and option scores.
Natural and Built Environment Impacts are broken out by facility (NRDS, SRDS, Intermodal).
Capita l
O &M
Lim it R isk o fS trande d C osts
Prom oteCom petitio n
Respond to W aste /M arket Change s
Partnerin gO pportunitie s
Room to grow/ M odularity
Long Ru nUncertainty
T o ta l S ys temC o st
Costs
G reenho use ga sF lexibility to respon dto change sin m arkets, tech& waste stream s
% Recyclin g
Reus eO pportunitie s
W aste R edu ctio n &R ec l. G o a ls
W ait T im eDistance to Fac.
Driv in g an dQ ueue T im e
Relia bilit yO ne-stop sho pF lexibility to adap tto change sin waste
Custom erConve nienc e
Fall hazzard sA ir Q ualityVehicle Ac cNois eSeism ic
Health &Safety
Educatio nO pportunitie s
Servic eEquity
C u sto m erS ervice
Facilitie s
Fall hazzard sA ir Q ualityVehicle Ac cNois eM ech SafetySeism ic
Health &Safety
F lexibilit y
W o rkE n viro n m ent
F lexibilit y
Aesthetic s
C onsis tent w /C om p/ N H P lans
Traffic
Nois e
Dust
O dor
Com m unityEquity
B u ilt E n v.(C o m m un ity)
Im pacts
W ater
A irQ uality
O therResource Im p.
N atu ralE n viro n m ent
Im pacts
Quality ofService
Short TermIm pacts
Screening CriteriaSPU Solid W aste Facilities Masterp lan

Importance of Value Model• Facilitated process• Way to get all issues and concerns
identified• Moved discussion from a high level where
things are hard to evaluate• Began discussing what everyone really
meant/valued when they held a certain position

Performance ValueCriterion Measure Rate x Weight = Score
A 3 20 60
B 4 45 180
C 1 10 10
D 2 25 50
Total Score 300
Quantified Evaluation Approach:
Multi-Attribute Utility Theory
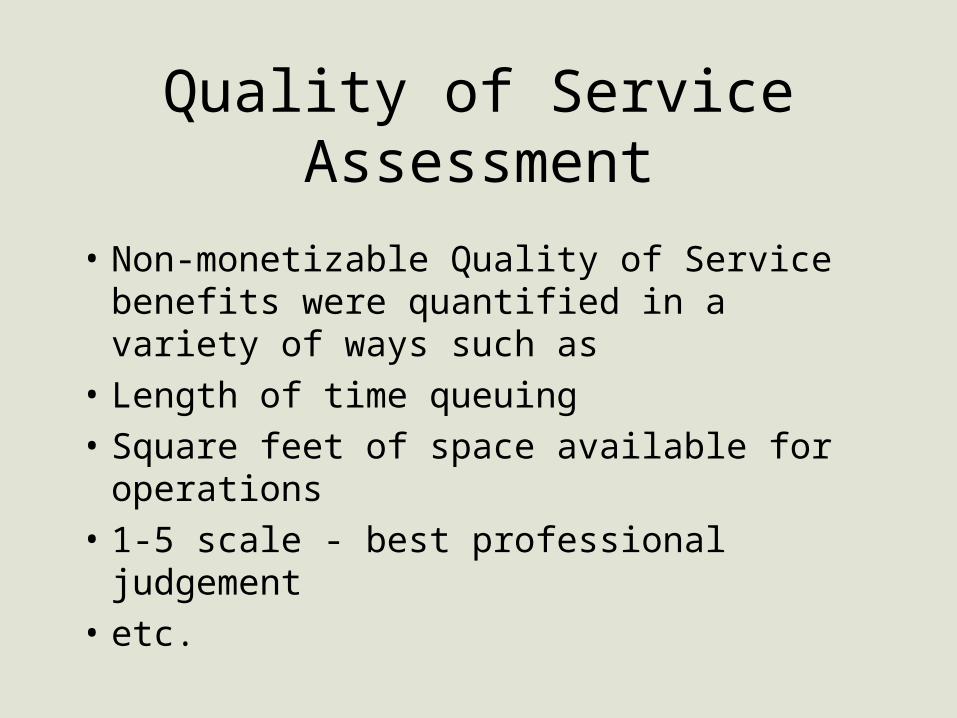
Quality of ServiceAssessment
• Non-monetizable Quality of Service benefits were quantified in a variety of ways such as
• Length of time queuing• Square feet of space available for operations• 1-5 scale - best professional judgement• etc.

SPU Solid Waste Facility MasterplanContributions by Criteria - Total Quality of Service Score
Note: Option 5 and 11 score highest on waste reduction. This is the differentiating for its leading score.
0.0
0.1
0.2
0.3
0.4
0.5
0.6
0.7
0.8
0.9
0.0
0.1
0.2
0.3
0.4
0.5
0.6
0.7
0.8
0.9
Option 5 Option 11 Option 8 Option 0
Customer Service
Work Environment
Waste Reduction
Built Environment
Natural Environment
Contributions to Quality of Service fromLevel:
Used Criterium Decision Plus Software

Insert Cost Risk Profile Graph and Tornado diagram
Cost ($M)
Op
tion
Sco
reOverall Results
Quality of Service vs. Cost
0
0.2
0.4
0.6
0.8
1
480 516 552 588 624 660
Option 5
Option 1
Option 4A
Option 2A Option 3
Option 0
Option 2B
Option 4B
Option 6
Option 7

SPU SW Facilities SPU SW Facilities MasterplanMasterplan
Approach to Capture Cost Risk

Cost Drivers and Uncertainties Affecting NPV of OptionsThe Influence Diagram below illustrates conditional relationships between decisions (yellow rectangles), uncertainties (green ovals), & outcomes (blue boxes).
ResidentialRec. Rate
CommRate
Res.
Com.
Self HaulNet YW
TotalOptionCost
NRDSConst.Costs SRDS
Const.Costs
IMConst.Costs
Growth inCity Waste
Stream
Res/ ComRecycling
Rate
RailPrice
RecyclingRevenues
LaborEfficiency
Factor
ConstructionCosts
KC RailParticipation
DisposalSavings
KC DisposalParticipation
OptionSelected
Intermodal

Step 2: Potential Cost Outcomes and Step 2: Potential Cost Outcomes and Probabilities Tool: Decision TreeProbabilities Tool: Decision Tree
For each possible outcome of a decision,
Decision Trees show:• The Pathway - How did
this happen?
• The Probability - How likely is this?
• The Cost - How much will this outcome cost?
No Additional Facilities
Prob = 100% C = $0 M
Forecast
Prob = 70%
Prob = 20% C = $10M
New Facilities Needed
Prob = 80% C = $30M
AboveForecast
Prob = 30%
Growth in Waste Stream Future Capital Costs
Tools Used– DPL software
Interaction– Workshop and/or
questionnaires to define branch outcomes and estimate probabilities and costs
The influence diagram is actually the top layer of a mathematical model. The underlying model is a series of interconnected decision trees. In our simplified example only possible one tree is shown (above).
Example
Facility Expansion

Calculating the Decision Tree [Example Tree]Calculating the Decision Tree [Example Tree]
Prob of Outcome = 0.7 * 1.0 = 0.7Cost of Outcome = $0
Prob of Outcome = 0.3 * 0.2 = 0.06Cost of Outcome = $10M
Prob of Outcome = 0.3 * 0.8 = 0.24Cost of Outcome = $30M
Costs (NVP):No Additional Facilities = $0MFacility Expansion = $10M New Facilities Needed = $30M
No Additional Facilities
Prob = 100% C = $0 M
Forecast
Prob = 70%
Prob = 20% C = $10M
New Facilities Needed
Prob = 80% C = $30M
AboveForecast
Prob = 30%
Growth in Waste Stream Future Capital Costs
Facility Expansion
The influence diagram is actually the top layer of a mathematical model. The underlying model is a series of interconnected decision trees. In our simplified example only possible one tree is shown (see below).

Decision Trees: Probabilities and Cost OutcomesExample: Rail Savings
Scenario/Probability
Outcome($/ton.)
S1 Merchandise Train
P = 20% 16.80
14.70
Without King County (Rail)
13.40
12.90
P = 60%
With King County (Rail)
P = 40%
S2 - SPU waste w/ others
P = 80%
S3 - SPU Waste w/KC
P = 70%
S4 SPU/KC + shared loading
P = 30%
Intermodal Yes
0.00
Intermodal No

Uncertainty Branch - Disposal Savings with Intermodal
Scenario/Probability
Outcome($savings/ton.)
0
-1
0
-2
Without King County
P = 50%
With King County
P = 50%
No: P = 60%
Yes: P = 40%
No: P = 60%
Yes: P = 40%
Intermodal - Yes

Interface Sheet for Decision AnalysisInputs Value UnitsWaste Stream Generation Rate
Residential 0.03 %Commercial 0.07 %Self-Haul Net of YW 0.07 %Partner Rail Load Only 0.07 %
Percent RecycledResidential 0.70 %Commercial 0.70 %Self-Haul net of YW DO NOT USE THIS ONE SEE EMAIL %
Recycling Revenues 1 %Rail Price 13.70 $/tonDisposal Price Change (for both IM and non-IM options) 0.00 $/ton
Construction Costs (includes recycling construction)NRDS 1 %SRDS 1 %Intermodal 1 %
Equipment Cost 1.2Labor Downtime Factor 1.21 No.Discount Rate 6% %Rail Load Partner Tons 0 tons
OutputTotal NPV 656,983,487 $

COST RISK PROFILE
Probabilistic Range of Option 0 CostC
umul
ativ
e P
roba
bilit
y (%
)
NPV - $M
0
0.1
0.2
0.3
0.4
0.5
0.6
0.7
0.8
0.9
1
475 500 5250 550 575 600 625 650 675 700 725 750 775 800 825
Base Case = $626M
90th Percentile = $742M
Expected Value = $640M
10th Percentile = $553M

“Tornado” Diagram Relative Impact of Uncertainties: Option 11
NPV - $M
A Tornado Diagram evaluates the impact of each uncertainty by varying it from its best to worst state, while fixing all other uncertainties to their base (most likely) state. The width of the bar shows the impact on total option cost.
Growth in City Waste Stream
Construction Costs
Res/ Com Recycling Rate
Rail Price
KC Rail Participation
Disposal Savings
Recycling Revenues
Labor Efficiency Factor
KC Disposal Participation
620 640 660 680 700 720 740

BASE CASE TORNADO DIAGRAM
Relative Impact of Uncertainties Option 1
NPV - $M
Growth in City Waste Stream
Res/ Com Recycling Rate
Construction Costs
Labor Efficiency Factor
Recycling Revenues
440 460 480 500 520 540 560 580 600
Risk Assessment Results
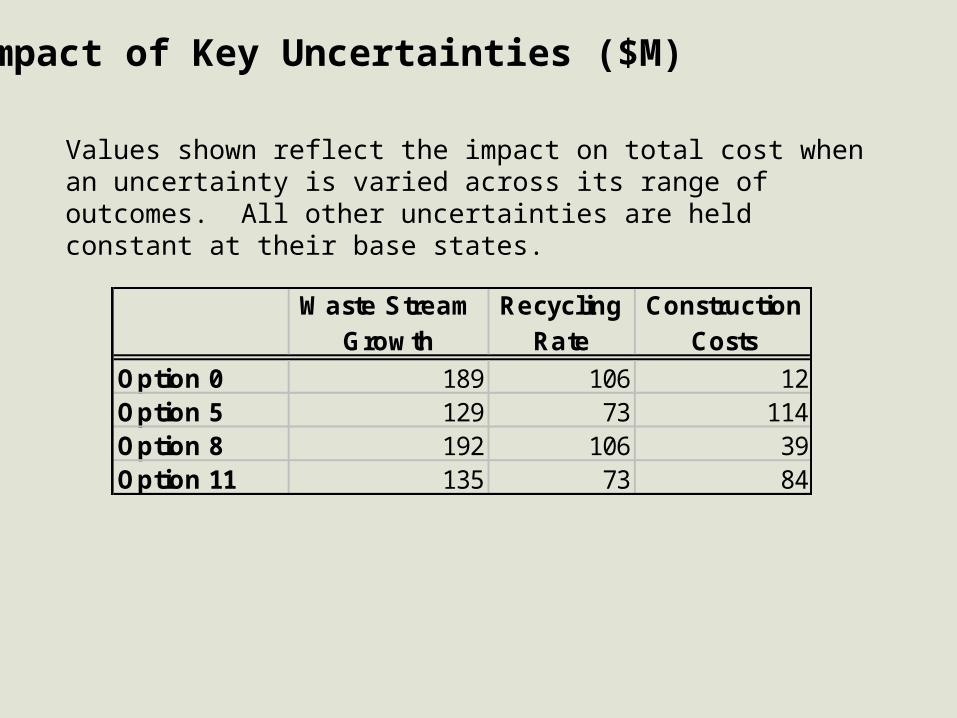
Impact of Key Uncertainties ($M)
Values shown reflect the impact on total cost when an uncertainty is varied across its range of outcomes. All other uncertainties are held constant at their base states.
Waste StreamGrowth
RecyclingRate
ConstructionCosts
Option 0 189 106 12Option 5 129 73 114Option 8 192 106 39Option 11 135 73 84
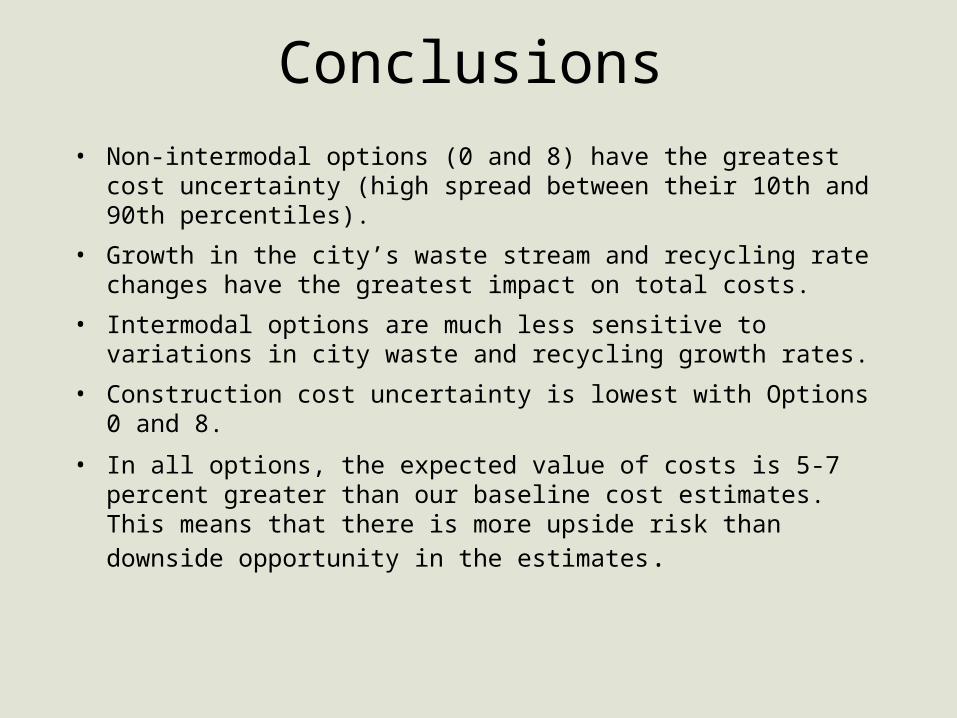
Conclusions
• Non-intermodal options (0 and 8) have the greatest cost uncertainty (high spread between their 10th and 90th percentiles).
• Growth in the city’s waste stream and recycling rate changes have the greatest impact on total costs.
• Intermodal options are much less sensitive to variations in city waste and recycling growth rates.
• Construction cost uncertainty is lowest with Options 0 and 8.
• In all options, the expected value of costs is 5-7 percent greater than our baseline cost estimates. This means that there is more upside risk than
downside opportunity in the estimates.

What We LearnedRound 1
• The cost of reuse/recycling facilities is relatively high compared to percent diverted
• Building costs are high at SRDS and intermodal due to soils
• Queue reduction goal was too aggressive; resulted in too large a facility
• Don’t need to purchase property to take advantage of partner tons
Round 2Revised Options
• Modifications to Recycling facilities to increase cost effectiveness
• Less aggressive queue reduction goal
• Alternative construction that does not require pilings at SRDS

Project Status
• Approach and results accepted by SPU Asset Management Committee
• AMC asked us to quantify in $’s some of the benefits from value model
• Plan supported by SPU Director and Mayor• Site for IM announced, property purchases
beginning or underway for all 3 site• Decision to do a DBO for IM

Concluding Remarks• Decisions are likely to be supported if:
– They are rational and compelling– The underlying trade-offs have been clearly
communicated– Discussions and decisions have been
documented for later reference and defensibility– Conflicts have been anticipated, and thus
prevented or well-managed– Participants feel they have been listened to and
that they have had some impact or effect on the final outcome
• No tool replaces human judgment

Brief Advertisement
• It’s Not Garbage Anymore!
• New 60% City Programs include:– ban on recyclables – commercial collection of food waste– residential collection of food waste with yard
waste