practice education metrics - phsa.ca
TRANSCRIPT

PRACTICE EDUCATION
METRICS
FISCAL YEAR 2017–18
Prepared for: PHSA Research Committee
Prepared by:Ellen Chesney, Chief Administrative Officer - Research
Beth Palacios, Consultant
SUPPLEMENTARY REPORT

TABLE OF CONTENTSPHSA Practice Education Metrics Summary 4
Build Practice Education Capacity 6
Placement Activity 6
Figure 1 Total Student Hours by Agency, Placement Type & Fiscal Year - Nursing 6
Figure 2 Total Student Hours by Agency, Placement Type & Fiscal Year – Non-nursing 7
Figure 3 Total Student Hours by Discipline & Fiscal Year - Disciplines with < 10,000 Student hours 8
Figure 4 Total Student Hours by Discipline & Fiscal Year - Disciplines with > 10,000 Student hours 9
Table 1 MDUG – Total # of distinct students, placements and requested days by agency and specialty 10
Table 2 PGME – Total # of distinct students, placements and requested days by agency and specialty 11
Figure 5 Total Number of Confirmed Placement Requests by Discipline by Fiscal Year 13
Figure 6 Number of Confirmed Placement Requests by Month and Fiscal Year 14
Figure 7 Number of Medical Student Placement Requests by Month – FY 17-18 15
Figure 8 Top Reasons for Placement Decline by PHSA by Fiscal Year 16
Preceptor/Educator Training 17
Table 3 Number of Preceptors/Educators trained by the Educator Pathway Program by Agency 17
Preceptor/Destination Activity 17
Figure 9 Number of HSPnet Preceptors by Student Placement Activity and Fiscal Year - Nursing 18
Figure 10 Number of HSPnet Preceptors by Student Placement Activity and Fiscal Year – Non-nursing 18
Table 4 Number of BCEHS Preceptors & Placement Activity by Program by Fiscal Year 19
Figure 11 Total Number of Destinations by Placement Activity, Site and FY 19
Table 5 Estimated Cost of PHSA Preceptor Time by Discipline and Encounter Type in FY 2017-18 20

Build Effective Partnerships and Collaborations that Support Innovation 21
Figure 12 Number of Affiliation Agreements by Region and Sector by FY 21
Figure 13 Number of Affiliation Agreements Utilizing Standard Template by FY 22
Figure 14 Number of Student Hours by Top 10 Educational Institutions by FY – All Disciplines 22
Figure 15 Number of Student Hours by Top 8 Educational Institutions by FY – Nursing Placements 23
Figure 16 Number of Student Hours by Top 8 Educational Institutions by FY – Non-nursing Placements 23
Figure 17 Distribution of Student Hours by Placement Setting by FY 24
Figure 18 Percent of Student Hours by Practice Setting by Agency by FY 25
Monitor the Quality of Clinical Learning Environment and Results 26
Table 6 Number of New Hires by PHSA Placements Program for top 85% 26
Table 7 Number of PHSA Placements by Educational Institution for New Hires 27
Appendix A - Glossary 28
Appendix B - Total Student Hours by Discipline and Sub-discipline by Agency 32
Appendix C - Number of Declines, Students and Hours by Discipline, Agency and Reason 36
Appendix D - Education Institutions with Affiliation Agreements in Place FY 2017-18 39
Appendix E - Total Student Hours by Education Institution by Sub-Discipline 40
Appendix F - New Hire Orientation Course – Practice Education Questions 47
TABLE OF CONTENTS cont inued
4 | S U P P L E M E N TA R Y R E P O R T 2 017– 2 018
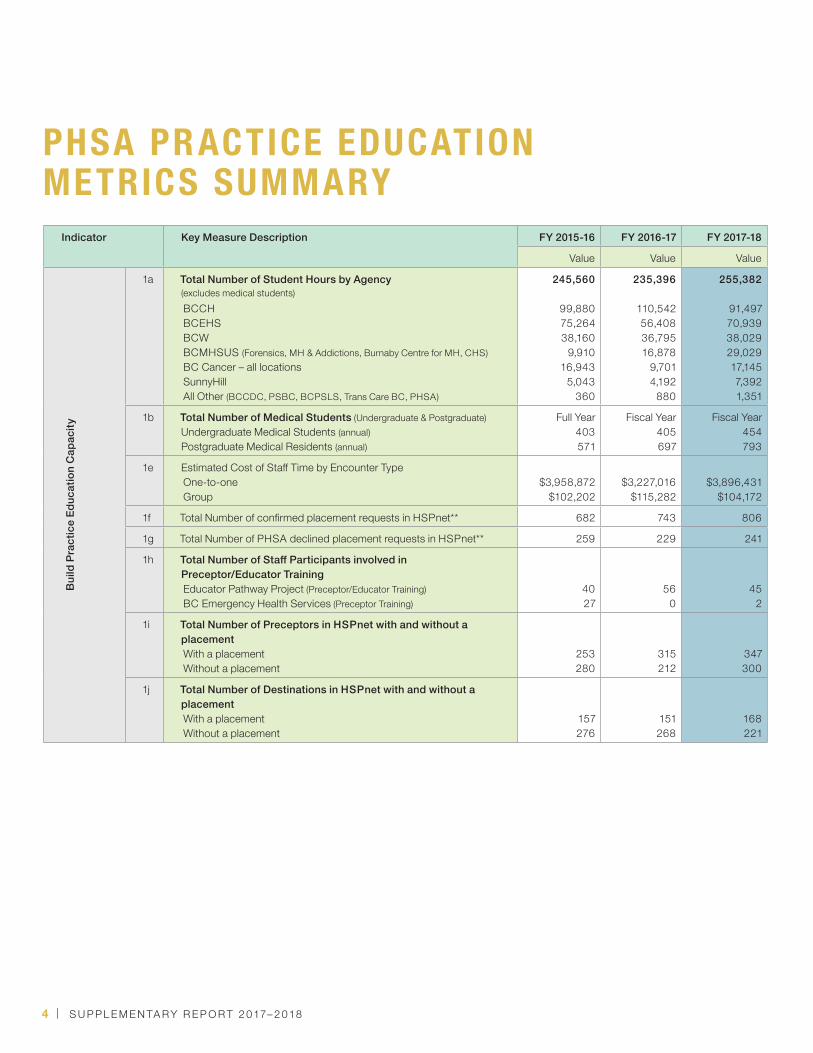
PHSA PR ACTICE EDUCATION METRICS SUMMARY
Indicator Key Measure Description FY 2015-16 FY 2016-17 FY 2017-18
Value Value Value
Bui
ld P
ract
ice
Educ
atio
n C
apac
ity
1a Total Number of Student Hours by Agency(excludes medical students) BCCH BCEHS BCW BCMHSUS (Forensics, MH & Addictions, Burnaby Centre for MH, CHS) BC Cancer – all locations SunnyHill All Other (BCCDC, PSBC, BCPSLS, Trans Care BC, PHSA)
245,560
99,88075,26438,160
9,91016,943
5,043 360
235,396
110,54256,40836,79516,878
9,7014,192
880
255,382
91,49770,93938,02929,02917,1457,3921,351
1b Total Number of Medical Students (Undergraduate & Postgraduate)Undergraduate Medical Students (annual)Postgraduate Medical Residents (annual)
Full Year403571
Fiscal Year405697
Fiscal Year454793
1e Estimated Cost of Staff Time by Encounter Type One-to-one Group
$3,958,872$102,202
$3,227,016$115,282
$3,896,431$104,172
1f Total Number of confirmed placement requests in HSPnet** 682 743 806
1g Total Number of PHSA declined placement requests in HSPnet** 259 229 241
1h Total Number of Staff Participants involved in Preceptor/Educator Training Educator Pathway Project (Preceptor/Educator Training) BC Emergency Health Services (Preceptor Training)
4027
560
452
1i Total Number of Preceptors in HSPnet with and without a placement With a placement Without a placement
253280
315212
347300
1j Total Number of Destinations in HSPnet with and without a placement With a placement Without a placement
157276
151268
168221

P R AC T I C E E D U C AT I O N M E T R I C S | 5
Indicator Key Measure Description FY 2015-16 FY 2016-17 FY 2017-18
Value Value Value
Bui
ld E
ffect
ive
Part
ners
hips
and
C
olla
bora
tions
to S
uppo
rt In
nova
tion
2a Total # of Affiliation Agreements (% based on standard template) 77(75%) 73(81%) 68(88%)
2b Top 5 Education Institutions by placement hours-all disciplinesJustice Institute of BCUniversity of BC** BCITLangaraThompson Rivers University
75,44841,88134,77830,89518,968
49,17244,89733,84825,85518,848
66,23545,191
40,69623,79318,218
2c Total Number of student hours in an ambulatory/outpatient care setting** 33,521 28,307 37,268
2d Distribution of Student Hours by practice education settingInpatientOn Car (Paramedic)Ambulatory/OutpatientMixed (OP/Amb & Inpatient)Admin/Support Services & Public/Population Health
106,06175,26433,52122,920
7,794
113,65356,40828,30730,478
6,540
103,68470,93937,26834,962
8,529
Qua
lity
of C
linic
al
Lear
ning
Env
ironm
ent
an
d R
esul
ts
3a # of hires at PHSA with previous Practice Education Placement TBD 146 (30%) 559 (20%)
3b Quality of the Clinical Learning Environment survey results TBD TBD TBD
3c Readiness for Student Practice Education survey results TBD See Analysis
NA
** Excludes undergraduate and postgraduate medical students and paramedics

6 | S U P P L E M E N TA R Y R E P O R T 2 017– 2 018
Placement Activity In FY 17-18, PHSA and its agencies provided 255,382 student hours (not including medical students) of which 80% were one-to-one preceptorships (supervised by a PHSA preceptor/employee) and 20% were group placements (supervised by an instructor provided by the educational institution). Nursing placements represent 42% of total student hours which is a 4% decrease over FY 16-17. This decrease is due to the move to the new Tech Acute Care Centre and to nursing program curriculum changes that are shifting Pediatrics and Perinatal group placements to a
BUILD PR ACTICE EDUCATION CAPACIT YSocial pediatrics and community-based learning experience. A breakdown of student hours by PHSA agency, placement type and fiscal year can be found in Figure 1 for nursing and Figure 2 for non-nursing disciplines.
Of the 106,337 nursing student hours provided, 48.5% (down from 52%) of those are in a group setting while 51.5% are one-to-one preceptorships.
F IGURE 1 To t a l S tudent Hour s by Agency, P lacement Type & F isca l Year - Nur s ing
3,007 | 3,744
3,396 | 9,408
9,747 | 8,180
1,320 | 1,320
1,410 | 72
1,680 | 3,386
16,425 | 13,416
16,078 | 12,213
15,061 | 14,321
26,143 | 34,015
22,193 | 25,647
21,800 | 31,941
360
340
1,316
4,371
4,353
4,806
Oth
er*
Sunn
yHill
BC
MH
SUS
BC
Can
cer
BC
WB
CC
H
One-to-one Group
*Other agencies for FY 17-18 include BCCDC and PHSA Corporate.
FY 15-16
FY 16-17
FY 15-16
FY 16-17
FY 15-16
FY 16-17
FY 15-16
FY 16-17
FY 17-18
FY 17-18
FY 17-18
FY 17-18
FY 17-18
FY 15-16
FY 16-17
FY 17-18
FY 15-16
FY 16-17

P R AC T I C E E D U C AT I O N M E T R I C S | 7
Non-nursing disciplines include Administration, Food & Nutrition, Non-Health (Masters of Public Health and Health Information Management), Other Health (Midwifery and Therapeutic Touch
F IGURE 2 To t a l S tudent Hour s by Agency, P lacement Type & F isca l Year – Non-nur s ing
Practitioner), Paramedic, Pharmacy, Psychology, Rehab, Social work, Technologists/Technician, and Therapists.
12,572
5,348
12,339
BC
Can
cer
FY 15-16
FY 16-17
FY 17-18
7,999 | 320
6,646 | 1,858
8,095 | 552
BC
W
FY 15-16
FY 16-17
FY 17-18
3,159
4,074
11,102
BC
MH
SUS
FY 15-16
FY 16-17
FY 17-18
One-to-one Group
540
35
2,403
2,326
45,779 | 360
56,408
70,939
50,384
43,657
75,264
Sunn
yHill
BC
CH
BC
EHS
Oth
er*
FY 15-16
FY 16-17
FY 15-16
FY 16-17
FY 17-18
FY 17-18
FY 15-16
FY 16-17
FY 17-18
FY 17-18
FY 16-17
*Other agencies for FY 17-18 include BCCDC.2,635 | 75

8 | S U P P L E M E N TA R Y R E P O R T 2 017– 2 018
F IGURE 3 To t a l S tudent Hour s by D isc ip l ine & F isca l Year - D isc ip l ines wi th < 10 ,0 0 0 S tudent hour s
A breakdown of hours by discipline and fiscal year can be found in Figures 3 and 4. Figure 3 includes disciplines with less than 10,000 student hours and Figure 4 shows disciplines with greater than 10,000 student hours.
A detailed table of student hours by PHSA agency, discipline and sub-discipline is shown in Appendix B.
FY 15-16
FY 16-17
FY 17-18
Soci
al
Wor
k
FY 15-16
FY 16-17
FY 17-18
Food
&N
utrit
on
FY 15-16
FY 16-17
FY 17-18
Reh
ab
FY 15-16
FY 16-17
FY 17-18
Psyc
h
FY 15-16
FY 16-17
FY 17-18
Phar
mac
y
FY 15-16
FY 16-17
FY 17-18
Adm
in
FY 15-16
FY 16-17
FY 17-18
FY 15-16
FY 16-17
FY 17-18
Oth
er
Hea
lth*
Non
-H
ealth
*
*Non-health disciplines include Masters of Public Health, Leadership Studies, and Health Information Management.
Other Health disciplines include Therapeutic Touch Practitioner, Midwifery, and Community Health Worker.
8,718
1,756
5,450
7,831
7,387
5,112
6,140
4,300
4,139
5,519
3,470
5,157
2,336
2,384
2,704
6,050
5,280
2,451
3,120
1,292
1,030
110
132
550

P R AC T I C E E D U C AT I O N M E T R I C S | 9
F IGURE 4 To t a l S tudent Hour s by D isc ip l ine & F isca l Year - D isc ip l ines wi th > 10 ,0 0 0 S tudent hour s
Through the use of UBC’s one45 placement system all clinical placement data for medical students in both the MD Undergraduate (MDUG) and Postgraduate Medical Education (PGME) programs are uploaded to HSPnet for tracking and reporting. For both the MDUG and PGME programs, the HSPnet data are being utilized for auto-provisioning of computer network access and email accounts. The number of students (1,239), placements (5,215) and days (123,441) for all clinical placements by program can be found in Tables 1 and 2. Total number of days are not representative of actual days worked.
The MD Undergraduate Program (MDUG) had a total of 454 distinct students, representing 1,717 placements and 24,728 days, arriving at PHSA facilities from April 1, 2017 – March 31, 2018. See Table 1 for a breakdown by agency and specialty. Please note that the grand total for the number of distinct students does not represent the sum of the data by agency and specialty due to the same student having placements in multiple specialties and locations.
FY 16-17
FY 15-16
FY 15-16
FY 16-17
FY 17-18
FY 17-18
FY 15-16
FY 16-17
FY 17-18
FY 15-16
FY 16-17
FY 17-18
Tech
Therap
ist
Paramed
icNursing
106,337
107,428
97,704
71,131
57,912
75,448
27,420
23,362
31,271
15,919
18,116
11,872

10 | S U P P L E M E N TA R Y R E P O R T 2 017– 2 018
TA BLE 1 MDUG - To t a l # o f d is t inc t s tudent s , p lacement s and reques ted days by agency and spec ia l t y
Site Specialty # of Distinct Students # of Placements Total # of Days
BCCH Psychiatry 119 245 5,221
Pediatrics 178 309 4,665
Ophthalmology 189 226 1,711
Emergency 72 97 1,104
Cardiology 36 65 957
Cardiac Surgery 27 32 447
Urology 23 31 364
Plastic Surgery 18 28 308
Orthopedic Surgery 16 23 266
Dermatology 12 15 252
Otolaryngology 11 15 210
Neurology - Pediatric 15 19 209
Infectious Disease 6 10 175
Medical Biochemistry 6 11 140
Endocrinology 4 8 133
Pathology 3 5 105
Medical Genetics 2 4 63
Rheumatology 2 4 56
ObGyn 1 1 7
BCW ObGyn 60 106 2,282
Family Medicine 25 34 679
Psychiatry 4 4 63
Medical Genetics 1 1 28
BC Cancer-Van Oncology 82 124 1,512
Internal Medicine 65 93 1,043
Radiation Oncology 17 23 308
Orthopedics 4 5 70
Pathology 1 1 28
BC Cancer-Fras Radiation Oncology 44 55 697
Medical Oncology 25 35 422
BC Cancer-VICC Radiation Oncology 22 27 322
Medical Oncology 3 5 77
BC Cancer-PG Radiation Oncology 23 28 377
BCCDC Public Health 6 10 161
BC Cancer-Kel Radiation Oncology 6 6 98
Forensic Forensic Psychiatry 4 7 91
BC Cancer-Abbot Radiation Oncology 4 5 77
GRAND TOTAL 454 1,717 24,728
The Postgraduate Medical Education program (PGME) had a total of 793 distinct students, representing 3,498 placements and 98,713 days, arriving at PHSA facilities from April 1, 2017 – March 31, 2018. See Table 2 for a breakdown by agency and specialty.
Please note that the grand total for the number of distinct students does not represent the sum of the data by agency and specialty due to the same student having placements in multiple specialties and locations.

P R AC T I C E E D U C AT I O N M E T R I C S | 11
TA BLE 2 PGME – To t a l # o f d is t inc t s tudent s , p lacement s and reques ted days by agency and spec ia l t y
Site Specialty # of Distinct Students # of Placements Total # of Days
BCCH Pediatrics 211 769 19,907
Emergency 152 221 6,908
Psychiatry 45 173 5,351
Critical Care 67 107 3,581
Endocrinology 36 84 2,940
ObGyn 54 102 2,763
Anesthesiology 48 91 2,532
Ophthalmology 25 40 1,680
Orthopedic Surgery 24 58 1,579
Rheumatology 13 46 1,289
Neurology - Pediatric 24 53 1,260
Medical Biochemistry 24 44 1,189
Infectious Disease 19 35 979
Gastroenterology 22 32 895
Cardiology 21 28 782
Medical Genetics 14 30 605
Otolaryngology 11 21 561
Dermatology 15 22 544
Family Medicine 7 19 523
Urology 9 16 449
Plastic Surgery 8 15 422
Diagnostic Radiology 13 16 347
Neurosurgery 5 10 276
Cardiac Surgery 3 7 198
Geriatric Medicine 6 7 194
Physical Medicine & Rehabilitation 2 6 168
Pathology 4 4 151
Nuclear Medicine 2 2 62
Neuroradiology 2 2 56
Gynecological Reproductive Endocrinology & Infertility
1 1 14
BCW ObGyn 110 385 10,587
Anesthesiology 32 60 1,678
Endocrinology 11 37 1,616
Medical Genetics 12 41 900
Urology 15 31 870
Psychiatry 8 22 776
General Internal Medicine 12 21 722
Diagnostic Radiology 19 25 701
Family Medicine 12 21 567
Infectious Disease 12 17 471
Emergency Medicine - Pediatrics 15 18 468

12 | S U P P L E M E N TA R Y R E P O R T 2 017– 2 018
Site Specialty # of Distinct Students # of Placements Total # of Days
BCW Geriatric Medicine 7 8 210
Pediatrics 4 4 128
Hematology 3 4 110
Neonatal Perinatal Medicine 1 1 28
Child & Adolescent Psychiatry 1 1 28
Gynecological Reproductive Endocrinology & Infertility
1 1 14
BC Cancer-Van Oncology 69 204 5,666
Radiation Oncology 34 91 2,435
Psychiatry 22 74 2,253
Pathology 25 64 1,777
ObGyn 17 42 1,178
Orthopedics 15 40 1,115
General Survey 14 31 865
Neurology 11 19 528
Palliative 11 16 420
Dermatology 11 15 420
Gastroenterology 1 2 57
SunnyHill Developmental Pediatrics 20 35 980
Physical Medicine & Rehabilitation 4 8 224
BCCDC Pathology 14 20 556
Public Health 4 9 250
Respirology 5 5 129
Infectious Disease 4 4 95
BC Cancer-VICC Radiation Oncology 9 10 266
Medical Oncology 6 6 167
Hematology 5 5 142
Gynecological Oncology 2 2 56
Forensic Forensic Psychiatry 4 17 515
Psychiatry 1 1 28
BC Cancer-Fras Medical Oncology 8 8 223
Radiation Oncology 3 5 125
BC Cancer-Abbot Geriatric Psychiatry 1 2 59
Radiation Oncology 2 2 42
BC Cancer-Kel Medical Oncology 1 2 56
Dermatology 1 1 7
GRAND TOTAL 793 3,498 98,713

P R AC T I C E E D U C AT I O N M E T R I C S | 13
F IGURE 5 To t a l Number o f Conf i rmed P lacement Reques t s by D isc ip l ine by F isca l Year
Total number of placement requests (806) are up 25% since FY 14-15. FY 17-18 nursing placement requests total 450 and represent 56% of total requests. Non-nursing requests total 356 and represent 44% of total requests (see Figure 5). The increase in the number of confirmed placement requests is a combination of the increase in the use of HSPnet for placement management
from academic institutions and PHSA departments as well as an increase in the number of placements requests. Continued increase in the number of placement requests is a measure of demand on PHSA resources for the provision of student practice education opportunities.
FY 17-18FY 16-17FY 14-15 FY 15-16
200
250
300
350
400
450
Nursing Non-Nursing

14 | S U P P L E M E N TA R Y R E P O R T 2 017– 2 018
F IGURE 6 Number o f Conf i rmed P lacement Reques t s by Month and F isca l Year
The number of nursing placement requests processed by month (see Figure 6 below) illustrates continued high demand in September, January and May and represents 62% of all nursing placement requests. Non-nursing requests continue to be evenly distributed throughout the year with 42% requested in September,
January, and May. Excluded from these graphs are medical students (see Figure 7), and paramedic placements whose current policies result in an equal distribution of placements throughout the year.
020406080100120140
April
May
June
July
August
September
October
November
December
January
February
March
Nursing Placements Non-nursing Placements
0 10 20 30 40 50 60 70
FY 16-17 FY 15-16FY 17-18

P R AC T I C E E D U C AT I O N M E T R I C S | 15
F IGURE 7 Number o f Medica l S tudent P lacement Reques t s by Month – FY 17-18
Medical Student placement requests are presented in Figure 7.
July
August
September
October
November
December
January
February
March
April
May
June
MDUG PGME
0 50 100 150 200 250 300 400350 500450050100150200250300350

16 | S U P P L E M E N TA R Y R E P O R T 2 017– 2 018
F IGURE 8 Top Reasons fo r P lacement Dec l ine by PHSA by F isca l Year
Declines in the All Other category had less than 3 declines each and include the following: Destination is closed during placement period; No reply from the RA; No Affiliation Agreement in place; Service has changed; Too many hours/shifts requested; No reason given; Blank
In FY 2017-18, PHSA agencies declined a total of 241 placement requests representing 243 students and 30,761 hours. Requests are for individual and group placements which is why the number of students exceeds the number of requests. Top reasons for these
declines for all agencies combined are shown in Figure 8. The top discipline declined is nursing placements. See Appendix C for declines by discipline, agency and reason for FY 17-18.
0 10 20 30 40 50 60 70 80 90
2016-172015-16
2017-18
Conflicts with other requests
No supervisor/preceptoris available
Too many studentson unit/program
Unit workload
Request not suitablefor area requested
Student not suitablefor area requested
No reply from destination(RC users)
All Other
Other/special reason

P R AC T I C E E D U C AT I O N M E T R I C S | 17
TA BLE 3 Number o f Preceptor s / Educator s t ra ined by the Educator Pathway Program by Agency
Agency Number of ParticipantsL1
BCCH/BCW 40
BCCDC 0
BC Cancer 0
BCMHSUS 0
BC Lab 0
BC Transplant 3
BCEHS 2
TOTAL 45
Preceptor/Educator TrainingPHSA staff participation in preceptor development is a key measure of practice education readiness and an indication of available capacity. Currently, PHSA utilizes the Educator Pathway (EP) program in conjunction with agency specific preceptor development courses to educate and support staff who work with students to deliver the practice education component of health care provider education programs. The EP program consists of 4 levels (see glossary) with level 1 being specific to each health authority. During FY 17-18, Levels 2 and 3 of the ED program had no cohort due to staff availability but will resume in the Fall of 2018. See Table 3 below for a breakdown of preceptor training by agency.
Preceptor/Destination ActivityPHSA has a total of 647 active preceptors in FY 17-18, that represent preceptors across all PHSA disciplines who have had an active placement within the past two years and utilize HSPnet. Excluded from these data are the BCEHS preceptors, as they do not utilize HSPnet for paramedic program placements. In addition, although the PGME and the MDUG programs utilize HSPnet for placement access into particular clinical departments, they do not utilize HSPnet to assign physician preceptors as this is managed by UBC outside of HSPnet.
The number of preceptors with and without an active placement by fiscal year for nursing is shown in Figure 9 and for non-nursing in Figure 10. While there is a notable increase in the number of active preceptors accepting students, the number of nursing preceptors with a placement declined due to the move into the new Tech Acute Care Centre and changes in the nursing curriculum requirements. Of note in the non-nursing disciplines is the large increase in the number of active preceptors. This is due to more disciplines actively using HSPnet for placements. These data reflect educating students and does not include educating new employees. Preceptors also educate new staff members and thus, may be unavailable to take a student placement. Whether these data are solely an indication of unused capacity requires further study.
In addition to the EP level 1 training, BCEHS’s agency specific program trains Primary Care Paramedic and Advanced Care Paramedic preceptors but had no cohort for either program in FY 17-18. The interviews for the Spring 2017 preceptor Expression of Interest (EOI) competition were not completed and tabulated until the end of January 2018 by Human Resources Talent Acquisition Department so preceptor training did not resume until April 2018. No preceptor training was offered in FY 2017-18. See Table 5 for the number of trained preceptors for these programs.

18 | S U P P L E M E N TA R Y R E P O R T 2 017– 2 018
F IGURE 10 Number o f HSPnet Preceptor s by S tudent P lacement Ac t iv i t y and F isca l Year – Non-nur s ing
F IGURE 9 Number o f HSPnet Preceptor s by S tudent P lacement Ac t iv i t y and F isca l Year - Nur s ing
12 | 31
12 | 19
6
4
13 | 14
16 | 7
15 | 9
9 | 6
7 | 7
12 | 2
22 | 29
29 | 22
25 | 2
27 | 12
16
44 | 27
42 | 39
29 | 41
FY 15-16
FY 16-17
FY 17-18
FY 17-18
FY 15-16
FY 16-17
FY 17-18
FY 15-16
FY 16-17
FY 17-18
FY 15-16
FY 16-17
FY 17-18
FY 15-16
FY 16-17
FY 17-18
FY 15-16
FY 16-17
All O
ther
*(<
5 plcmt/yr)
C&W
Nut
irtio
nSe
rvic
es
C&W
Adm
in
(U/C
, MO
A,
HSS
)
C&W
Soci
alW
ork
Bur
naby
Cen
ter f
orM
H &
AD
C&W
Reh
ab
With a placement Without a placement
*All other non-nursing discliplines include: BC Cancer Nutrition, BCCDC, BCMHSUS, C&W Audiology, Child Life, Diagnostic Imaging, Labs, Library Services, Nutrition Servcies, Ophthalmology, Pharmacy, Quality, Risk & Safety, Respiratory Therapy, Forensics Rehab. All had less than 5 preceptors
7 | 5
12 | 4
0 | 4
6 | 12
11 | 14
19 | 14
180 | 114
147 | 175
FY 17-18
FY 15-16
FY 16-17
FY 16-17
FY 14-15
FY 15-16
FY 16-17
FY 16-17
FY 16-17
FY 14-15
FY 15-16
Fore
nsic
Nur
sing
All
Oth
er*
BC
Can
cer
Nur
sing
C&W
Nur
sing
With a placement Without a placement
165 | 149
21 | 21
11 | 9
*All Other includes BCMHSUS, CHS, BCCDC with placements < 5.

P R AC T I C E E D U C AT I O N M E T R I C S | 19
In HSPnet, PHSA has a total of 389 unique combinations of Site, Destination and Service locations across all agencies and services, an 8% reduction due to a review of these, in the Fall of 2018, to validate their continued availability for placements. This reduction in the total number of available destinations has lowered
The number of trained and active preceptors in BC Emergency Health Services (BCEHS) are detailed below in Table 4. This includes all preceptor and student training for the Primary Care Paramedic and Advanced Care Paramedic programs. The reduction in available preceptors for the PCP program in FY 17-18
is due to the lack of any preceptor training in FY 17-18. Training for preceptors for BCEHS other programs (Critical Care Paramedic, Infant Transfer Team, and Dispatch) are excluded. Tracking of preceptors with an active placement resumed this fiscal year and is reported for the first time in 2 years.
TA BLE 4 Number o f BCEHS Preceptor s & P lacement Ac t iv i t y by Program by F isca l Year
FY 2015-16 FY 2016-17 FY 2017-18
BCEHS Training Program # of Available Preceptors
# of Preceptors with an Active
Placement
# of Available Preceptors
# of Preceptors with an Active
Placement
# of Available Preceptors
# of Preceptors with an Active
Placement
PCP 176 N/A 156 N/A 137 99
ACP 113 N/A 113 N/A 97 55
the percentage of destinations that don’t take placements to 57%, a 5-year low. In FY 17-18 there were 168 or 43% receiving an active placement and 221 or 57% that did not. Figure 11 details the number of destinations with and without placements by PHSA Agency (Site) by fiscal year.
F IGURE 11 To t a l Number o f Des t inat ions by P lacement Ac t iv i t y, S i t e and FY
FY 15-16
FY 16-17
FY 17-18
FY 15-16
FY 16-17
FY 17-18
FY 15-16
FY 16-17
FY 17-18
FY 15-16
FY 16-17
FY 17-18
FY 15-16
FY 16-17
FY 17-18
FY 15-16
FY 16-17
FY 17-18
All O
ther
Men
tal
Hea
lthB
C C
ance
rB
CW
BC
CH
1 | 12
5 | 10
6 | 15
23 | 13
18 | 26
35 | 37
8 | 26
9 | 26
5 | 6
23 | 49
22 | 55
31 | 46
34 | 71
35 | 63
30 | 49
68 | 104
63 | 93
61 | 68
With a placement Without a placement
Sunn
yHill

20 | S U P P L E M E N TA R Y R E P O R T 2 017– 2 018
TA BLE 5 E s t imated Cos t o f PHSA Preceptor T ime by D isc ip l ine and Encounter Type in FY 2 017-18
Discipline Group One-to-One Total
Administration $0 $44,152 $44,152
Food & Nutrition $0 $18,688 $18,688
Nursing $103,068 $438,420 $541,488
Paramedic $384 $2,837,579 $2,837,963
Pharmacy $0 $49,120 $49,120
Psychology $0 $4,400 $4,400
Rehabilitation Sciences $0 $62,644 $62,644
Social Work $0 $69,744 $69,744
Technologist/Technician $0 $127,352 $127,352
Therapist $0 $219,363 $219,363
Other Health $720 $5,360 $6,080
Non-Health $0 $19,608 $19,608
GRAND TOTAL $ 104,172 $ 3,896,431 $ 4,000,603
1 (1) Children’s & Women’s Health Centre of BC (2004). Students and Resident Education at Children’s & Women’s Health Centre of BC: Planning for increased numbers.
(2) Education and Research in the Fraser Health Authority. (2005). Report prepared by Janet MacIntosh Newberry for Dr. Peter Hill, Vice President, Academic Development and Clinical Innovation.
(3) Corpus Sanchez International Consultancy Inc. (May 5, 2004). Understanding the costs of academic health sciences centres. Final Report to Vancouver Coastal Health Authority and Provincial Health Services Authority.
One element of the total cost of practice education is staff time related to direct supervision of students. These activities include orientation of the students/faculty to the site, unit and/or program, planning of daily learning activities that meet learning objectives, skill demonstrations, supervision of students while they practice, dealing with student performance issues, and evaluations. Utilizing the ratio of staff hours to student hours, 1:20 for group placements and 1:5 for one-to-one placements, developed from previous reports1, and 1:1 for all paramedic programs. Also assumed is a $40 per hour average staff salary cost.
Table 5 shows the estimated cost of staff time by discipline for FY 17-18. The total amount reflects an increase of 20% over last year attributed to the increase in paramedic and social work hours. Excluded from this table is estimated cost related to medical students.

P R AC T I C E E D U C AT I O N M E T R I C S | 21
BUILD EFFECTIVE PARTNERSHIPS AND COLL ABOR ATIONS THAT SUPPORT INNOVATIONPHSA has affiliation agreements with sixty-eight (68) educational institutions in both the public (76%) and private (24%) sector. See Figure 12 for a breakdown by region and sector. In addition to these, BCEHS has affiliation agreements with BCIT, Heartsafe, AET Paramedic Academy and Holland College. PHSA also has affiliation agreements (Inter-health authority agreements) in place
with other BC Health Authorities and BC Emergency Health Services to support continuing professional development. Of note is that although private institutions represent about 24% of affiliation agreements, they represent less than 3% of total student practicum hours. For a detailed list of education partners see Appendix D.
F IGURE 12 Number o f Af f i l ia t ion Agreement s by Region and Sec tor by FY
BC
Can
ada:
Oth
erPr
ovin
ces
USA
In
ter-
natio
nal
Public Private
7 | 1
8 | 2
7 | 2
3 | 4
1 | 3
1 | 3
23 | 1
20 | 1
17
27 | 11
27 | 11
26 | 12
FY 15-16
FY 16-17
FY 17-18
FY 15-16
FY 16-17
FY 17-18
FY 15-16
FY 16-17
FY 17-18
FY 15-16
FY 16-17
FY 17-18

22 | S U P P L E M E N TA R Y R E P O R T 2 017– 2 018
F IGURE 13 Number o f Af f i l ia t ion Agreement s U t i l i z ing S t andard Template by FY
While PHSA has 68 partnerships in place, 92% of student practice hours for FY 2017-18 were with ten (10) public institutions (see Figure 14). A detailed listing of student hours by institution and discipline can be found in Appendix E. It is important that PHSA
continues to strengthen its relationship with primary academic partners and evaluate relationships with other affiliates to determine whether continued affiliation is warranted. Note that student hours for UBC does not include medical student/resident placements.
F IGURE 14 Number o f S tudent Hour s by Top 10 Educat ional Ins t i tu t ions by FY – A l l D isc ip l ines
As in previous years, PHSA is working to transition all educational institutions to the standard template (see Figure 13) when existing agreements expire. This is a measure of effective risk management, efficiency and building effective partnerships. The number using
standard templates is 58 (85%), an increase of 4% over FY 16-17. The Inter-health authority agreement is mostly identical to the standard template.
0 10 20 30 40 5001020304050
2015-16
2016-17
2017-18
Using Standard Template Not Using Standard Template
Public Private
FY 15-16FY 16-17FY 17-18
0
10,000
20,000
30,000
40,000
50,000
60,000
70,000
80,000
Justice Institute of
BC
University ofBritish
Columbia
BCIT Langara College
Thompson Rivers
University
Douglas College
KwantlenPolytechnicUniversity
Stenberg College
VancouverCommunity
College
University of Victoria

P R AC T I C E E D U C AT I O N M E T R I C S | 23
F IGURE 15 Number o f S tudent Hour s by Top 8 Educat ional Ins t i tu t ions by FY – Nur s ing P lacement s
Five (5) public educational institutions constitute 88% of student practice hours for nursing (see Figure 15) with University of BC, Langara College and BCIT providing 65% of all placements.
The bulk (83%) of student placements for the non-nursing disciplines are provided by four (4) educational institutions (see Figure 16), four public and one private: Justice Institute of BC, BCIT, University of BC, and Thompson Rivers University.
F IGURE 16 Number o f S tudent Hour s by Top 8 Educat ional Ins t i tu t ions by FY – Non-nur s ing P lacement s
0
5,000
10,000
15,000
20,000
25,000
30,000
35,000
University of British
Columbia
BCIT Douglas College
Kwantlen Polytechnic University
Trinity Western
Univeristy
StenbergCollege
University of Victoria
FY 16-17FY 17-18 FY 15-16
Langara College
0
10,000
20,000
30,000
40,000
50,000
60,000
70,000
80,000
JusticeInstituteof BC
AETParamedicAcademy
FY 15-16FY 16-17FY 17-18
StenbergCollege
ThompsonRivers
University
BCIT University ofBritish
Columbia
Simon FraserUniversity
Capilano University

24 | S U P P L E M E N TA R Y R E P O R T 2 017– 2 018
F IGURE 17 Dis t r ibu t ion o f S tudent Hour s by P lacement Se t t ing by FY
The majority of services provided by PHSA agencies are outpatient or ambulatory in nature and delivered by inter-professional teams. Accordingly, a key goal for PHSA Student Practice Education is for
PHSA to foster innovation in ambulatory care and inter-professional practice education placements. See Figure 17 for the distribution of student hours by placement setting.
0 20,000 40,000 60,000 80,000 100,000 120,000
Public/Pop Health
Admin/Support Srvcs
Mixed (OP/Amb & Inpatient)
Outpatient/Ambulatory
On Car
Inpatient
FY 16–17FY 15–16
FY 17–18

P R AC T I C E E D U C AT I O N M E T R I C S | 25
F IGURE 18 Percent o f S tudent Hour s by Prac t ice Se t t ing by Agency by FY
Practice setting is also influenced by the agency mandate as can be seen in Figure 18. Please see glossary for definitions of practice settings.
15% 54% 28%
100%
100%
100%
100%
8%
18%
13%
87%
63%
70%
5%
3% 90% 6%
14% 80% 6%
17% 64% 19%
17%
72%
33% 11% 53% 4%
1% 18%
15% 2%
28%
71% 7% 19% 2%
66% 4% 24% 6%
100%
100%
100%
FY 16-17
FY 17-18
FY 15-16
FY 16-17
FY 17-18
FY 15-16
FY 16-17
FY 17-18
FY 15-16
FY 16-17
FY 17-18
FY 15-16
FY 16-17
FY 17-18
FY 15-16
FY 16-17
FY 17-18
FY 15-16
FY 16-17
FY 17-18
FY 15-16
FY 16-17
FY 17-18BCCDC
PHSA
BCMHSUS
BC Cancer
SunnyHill
BCW
BCEHS
BCCH
Outpatient/Ambulatory Inpatient
Mixed Admin/Support Srvcs Public/Pop Health
On Car
3% 39% 58%
1% 66% 33%
5% 45% 42% 7%
15% 68%
3%
10% 17% 69% 4%

26 | S U P P L E M E N TA R Y R E P O R T 2 017– 2 018
MONITOR THE QUALIT Y OF CLINICAL LE ARNING ENVIRONMENT AND RESULTS
Out of the 2,648 respondents from April 1, 2017 – March 31, 2018, 21% or 559 had a placement at a PHSA site. See Table 6 for a breakdown of new hires by placement program that represent 85% of the total. The top four programs for new hires with a PSHA placement are Bachelor of Science in Nursing, Primary Care Paramedic, Medical Lab Assistant, and Respiratory Therapy.
TA BLE 6 Number o f New H i res by PHSA P lacement s Program for top 8 5%
Placement Program Name Number of New hires with a PHSA Placement
BSc Nursing 108
Primary Care Paramedic 103
Medical Laboratory Assistant 89
Medical Laboratory Science 22
Respiratory Therapy 21
Nursing - Unspecified 17
Unspecified 16
Unit Clerk 16
Bachelor of Psychiatric Nursing 12
Emergency Medical Responder 8
Medical Office Assistant 8
Clinical Genetics Technology 6
Medical Device Reprocessing Technician 6
Master of Public Health 5
BSc, Dietetics 5
Master of Social Work 5
MA Counselling Psychology 4
Health Care Assistant 4
Medical Transcription 4
Licensed Practical Nurse 4
Social Work 4
Medical Lab - unspecified 4
Results from the New Hire Orientation Online Course on Learning Hub, which includes a survey of previous practice placement activities (see Appendix F) are for a full fiscal year for the first time this year. The survey began in January of 2017 and preliminary results that included data through May 11, 2017 were reported last year. Work to further refine the survey questions to improve the data quality is underway with an anticipated completion date of Fall 2018. This important metric will help inform the link between hosting practice placements and recruitment at PHSA.

P R AC T I C E E D U C AT I O N M E T R I C S | 27
The top four educational institutions for new hires with a PHSA placement are JIBC, BCIT, UBC, and Vancouver Community College. See Table 7 for a breakdown of new hires with a practice
placement by educational intuition and year, however a large percentage (16%) of respondents did not specify an educational institution.
TA BLE 7 Number o f PHSA P lacement s by Educat ional Ins t i tu t ion fo r New H i res
Education Institution Number of New Hires with a PHSA Placement
JIBC 111
Unspecified 88
BCIT 72
UBC 55
Vancouver Community College 40
Stenberg College 40
Langara College 21
Thompson Rivers University 19
Kwantlen Polytechnic University 18
West Coast College of Health Care 17
Douglas College 17
University of Victoria 13
SFU 7
Trinity Western University 7
MTI Community College 5
UBCO 4
Although the RSPE (Readiness for Student Practice Education) survey was piloted in FY 16-17, no further dissemination of the survey took place in FY 17-18. A template for survey data analysis has been developed to help focus on the strengths and weaknesses identified by the results as more PHSA agencies and departments implement the survey tool. Once readiness is assessed throughout all PHSA clinical areas, work will begin to utilize the second tool developed from the PLACES study to evaluate the quality of the clinical learning environment from the student, health authority staff and onsite faculty/instructors’ perspectives.
Data from the above tools, and HR data are intended to inform practice education planning, decision making and assessment of the practice education progress and impact.

28 | S U P P L E M E N TA R Y R E P O R T 2 017– 2 018
APPENDIX A GLOSSARYTERM DESCRIPTION DATA SOURCE
Metric Definitions
Metrics 1a – Total number of Student Hours by Receiving Agency, Discipline, and Encounter Type
Total number of Student Hours (calculated as number of student’s X requested placement hours) for the confirmed placement status beginning within the Fiscal Year. These numbers are calculated by Receiving Agency, HSPnet discipline, sub-discipline and Encounter Type (Group or One-to-One)
BCEHS programs: Clinical placements are captured in the HSPnet data defined below. All other placements (On-Car, On-Plane) are provided by BCEHS program managers who are queried through email for annual numbers. Potential source is JIBC excel worksheets but will not include data from AET, Heartsafe or Holland College.
All other: HSPnet activity report/custom field
Metric 1b – # of Medical Students by Type (Undergraduate and Post graduate) and Specialty
Total number of Students (not hours) with placements at PHSA facilities for both undergraduate and graduate medical student programs from UBC. Excluded are UBC and non-UBC visiting medical student placements.
HSPnet custom report - Security/Access Listing - Students/Instructors - Network Account – Medicine by FY
Metric 1c – # of Medical Students hours by Type and Specialty
TBD Review of this metric is underway to design one that better reflects medical student placements.
Metric 1d – # of Confidentiality /Learning Hub Orientation Courses Completed by Participant Type
A count of those completing the Student Privacy/Confidentiality course on the Learning Hub from a designated student, employee, or unidentified email address.USED AS A PROXY FOR MEDICAL STUDENT VOLUME IN FY 2013-14
Source: LH Course Completed report from Sarah Titcomb, manual
No longer reported, see definition
Metric 1e – Estimated Cost of Staff Time by Discipline and Encounter Type
Total number of student hours * $40 average wage. The ratio of staff hours to student hours of 1:5 for one-to-one, and 1:20 for group placements is utilized.
Hours used for this calculation include data from Metric 1a above. Manually calculated.
Metric 1f - # of confirmed placement requests by month
The sum of the # of Placement Requests by the month in which it starts within the Fiscal Year.
HSPnet Activity report by FY + custom field month
Metric 1g - # of PHSA declined placements by top reason
The number of declines for the Declined by Agency (DecA) status and reasons as provided in HSPnet.
HSPnet custom report: Cancellation/Decline Reasons - Cancellation/Decline Reasons by FY

P R AC T I C E E D U C AT I O N M E T R I C S | 29
TERM DESCRIPTION DATA SOURCE
Metric 1h – Number of staff participants involved in preceptor and educator training (Educator Pathway and BCEHS programs)
Educator Pathway Program participant report, manual. A sum of all levels.Level 1 - Preceptor/Mentor Theory and Practice (EP Level 1 & 1A)The preceptor and mentor competency development and education programs vary across agencies within PHSA. Level 2 - Education Theory and Practice (Staff preparing for Clinical Educator Role)8 Instructional days spread over the course of 4 months. Content moves to supporting group and classroom learning focused on a specific clinical area of practice. Eligibility – PHSA professional clinical staff in an educator role that primarily focuses on program specific education. Endorsement letter from leader required.Level 3 - Education Theory and Practice:Five instructional days over 3 months. Focus is on supporting learning beyond the context of a specific clinical area of practice. Best suited for experienced educators shifting from developing content-based education to concept-based facilitation for learners across programs, disciplines and/or Health Service Delivery Areas. Eligibility – PHSA professional clinical staff in an educator role and who have significant experience as an educator, and whose role typically goes beyond the confines of a specific practice area. Endorsement letter from leader requiredLevel Level 4 – master’s in education from a University.
Educator Pathway participant report (from Sandra Harris, Lead – Educator Pathway Program) and Self-reported numbers by BCEHS Manager, Education Operations
Metric 1i – # of Preceptors in HSPnet with and without a placement within the Fiscal Year
Calculated number of preceptors showing as active in HSPnet – those without a placement from the Unused Supervisors Report.
BCEHS programs: List of active preceptors with and without is provided by BCEHS program managers who are queried through email for annual numbers. For paramedic programs (PCP, ACP, CCP) a report from Peoplesoft showing which employee (using employee number) received instructor pay premium during the FY shows who had an active placement during the FY. All other: HSPnet custom report: Unused Supervisor Report and Listing of all Preceptors run on April 1 from HSPnet report wizard.
Metric 1j – # of Destinations in HSPnet with and without a placement within the Fiscal Year
A listing of destinations within an agency, and a tally of each PR status for each destination. Calculated number for only the confirmed placement status.
Source: Customer HSPnet report listing all destinations with and without a placement
Metric 1k – # of PHSA staff with practice education activities as part of defined job responsibilities.
TBD TBD
Metric 2a – Number of formal affiliation agreements and % based on the Standard Template
A count of the number of educational institutions with an affiliation agreement and their designation as a private or public entity and on the standard or non-standard template
Affiliation Agreement excel worksheet from Practice Education + custom fields

30 | S U P P L E M E N TA R Y R E P O R T 2 017– 2 018
TERM DESCRIPTION DATA SOURCE
Metric 2b – Top % of education institutions by student hours
Sum of student hours by education institution. Calculation of the top 90% or above. All other: HSPnet Activity data
Metric 2c – Number of student hours in ambulatory and/or inter-professional collaborative practice setting by site
Utilizing the destination field in the HSPnet activity report, added another field called practice setting. Decisions on assigning a destination to a particular practice setting made by Practice Education department. Calculates the number of student hours by the ambulatory/ outpatient setting type.
BCEHS programs: Assigned as On-car or On-plane depending on program
All others: HSPnet Activity data + custom fields
Metric 2d – Distribution of student hours by practice education setting
Utilizing the practice setting field, calculates the number of student hours in each category.
All Disciplines: HSPnet Activity data + custom field
Metric 3a - # of hires at PHSA with a previous practice education placement
A survey of previous practice placement activities as part of the New Hire Orientation Online course. It’s mandatory for all regular, temporary and casual PHSA new hires including PHSA employees returning from leave and those returning to PHSA after a two-year period. It excludes employees moving internally (from one PHSA position to another), non-salaried/salaried physicians, students, volunteers and contractors. The process is managed by PHSA Talent Acquisition. The invite for the online New Hire Orientation Course is automatically generated by the new hire e-form. Other data elements included in the course are name, email and course completion date.
New Hire Orientation Online Course on PHSA Learning Hub. Annual Data provided by PHSA Talent Acquisition in excel format.
Metric 3b – QCLE survey results
TBD TBD
Metric 3c – RSPE survey result
The validated survey tools from the PLACES study, Placements for Learners: Assessing Capacity and effectiveness of Clinical Sites. To be disseminated to individual clinical areas for implementation.
Fluidsurveys responses from all disseminated survey for the fiscal year. Data is managed by PHSA Practice Education.
HSPNET DEFINITIONS
Placement Type
One-to-one(supervision provided by PHSA preceptor)
These placements include the following types of encounters:Preceptor: These involve direct care and are supervised by an individual of the same discipline. An individual placement with an experienced practitioner in a collegial learning relationship; students may be assigned to one or more preceptors during the placement. A preceptor is an employee/contractor of the Receiving site; the educational program may also identify an instructor, facilitator or liaison. Observation: A supervised placement involving student observation only, or “shadowing” a service provider.Project: Does not involve direct care, students function independently. An opportunity for one or more students to work on a project involving content, data, and/or materials that are furnished by the Receiving site. Supervision is provided by a Project Supervisor, who is an employee/contractor of the Receiving site; the educational Program may also assign an instructor, facilitator or liaison. Fieldwork: Individual: A placement that is focused on linking what is learned in class with what is seen, collected, and tested in the field. Supervision is provided by a field guide, who is an employee/contractor of the Receiving Site; the educational Program may also identify a facilitator or liaison. Internship: A placement involving supervised practical experience, for a student or recent graduate. Supervision is provided by a preceptor or supervisor, who is an employee or contractor of the Receiving site; the educational Program may also assign an instructor, facilitator, or liaison. Practice Education: A generic description for placements in educational programs that prefer not to use another term like “Fieldwork” or “Preceptor”. Independent Study: A placement that is organized by a learner directly, and not through an educational program. The learner may be a student or graduate. The placement does not normally involve direct patient care. Supervision is provided by an employee/contractor of the Receiving Site. Collaborative Learning Unit: A preceptored placement of students in groups on a unit where a Collaborative Learning Unit (CLU) program has been introduced (e.g. BC). Students are involved in direct patient care and have a high level of independence. All staff on the unit participate in the teaching-learning relationship with all students in the CLU group.

P R AC T I C E E D U C AT I O N M E T R I C S | 31
HSPNET DEFINITIONS
Group (supervision provided by instructor from education institution)
Group: Instructor led, groups of two or more students in a placement location, under the clinical supervision of an instructor or faculty member who is assigned by the educational program. Alternate experiences: involves spending a portion of a placement in an alternate destination within the same receiving agency. An experience offered to students of an Instructor-led Group, whereby some or all students from the “parent” group may rotate to another unit for one or more shifts. Supervision is provided by the instructor who is assigned by the educational Program.
Hours
Student Hours Total number of placement hours for all students (groups and non-groups) for all confirmed placements (calculated as # of students x the number of placement hours requested).
Placement Hours Total number of hours requested, per student/group for all confirmed placements.
Placement Status
Confirmed Represents all accepted requests that are confirmed by the school and agency.
Declined by Agency Represents all requests that were officially declined by the receiving agency. The reasons for decline are also captured for this placement status.
Accepted by Agency Represents all accepted requests that have not been confirmed by the school. Once a school accepts the placement, it becomes a Confirmed Status.
Other Applicable HSPnet terms
Discipline A health sciences field of expertise such a Nursing or Medical Radiography,
Placing Agency Typically, a health sciences educational institution that initiates a student placement but can be any organization that places a student (e.g. BCEHS).
Placement Destination The physical or virtual location in which the student will complete their placement experience (e.g. 6th floor surgical ward, 2B). A destination is considered “active” if a Destination Coordinator is actively managing the Inbox (accepting/declining).
Receiving Agency/Site The agency (typically but not necessarily a health services organization) that receives a student placement request. The Receiving Agency represents the legal entity (health authority, private lab, etc.) as opposed to the placement destination or site.
General Terms
Students Learners who are involved in a practice education experience as part of their studies in an undergraduate, graduate, post-graduate (e.g. post-doctoral fellow) or post-professional (e.g. resident) education program in the health and human services professions. This may include students from non-clinical programs in health services support areas such as information management, human resources, communications and decision support.
Practice education The component of an educational program in which students learn and practice in a community, clinical or simulated setting. It provides the experiential learning that helps students acquire the necessary skills, attitudes and knowledge to practice effectively in their field. It may include direct contact with patients/clients and access to their personal health information.
Affiliation Agreement A legal contract that defines the roles and responsibilities of a health authority and education institution in providing practice education.
Practice Setting Inpatient - a student placement that takes place only in an inpatient care delivery setting. Outpatient/Ambulatory - a student placement that takes place only in an outpatient or ambulatory care delivery setting.Mixed (OP/Amb & Inpatient) - a student placement that takes place partly in an inpatient setting and partly in outpatient/ambulatory care settings. Admin/Support Services - a student placement that takes place in a health authority administrative or support unit versus a clinical care delivery unit. Public/Pop Health - a student placement that takes place in a service unit focused on public or population health (e.g. epidemiology program at BCCDC).On Car/Plane – a student placement that takes place on a BC Ambulance or Air Ambulance.
Fiscal Year April 1, 2015 – March 31, 2016April 1, 2016 – March 31, 2017April 1, 2017 – March 31, 2018

32 | S U P P L E M E N TA R Y R E P O R T 2 017– 2 018
APPENDIX B TOTAL STUDENT HOURS BY DISCIPLINE AND SUB-DISCIPLINE BY AGENCY
Site DISCIPLINE SUB-DISCIPLINE FY 15-16 FY 16-17 FY 17-18
BC Cancer Therapist Radiation Therapist 9,188 320 6,384
Nursing Bacc Nursing - BScN/BSN/BN 3,910 3,096 4,192
Nurse Practitioner 461 1,257 614
Technologist/ Technician
Nuclear Medicine Tech 880 1,200 560
Clinical Genetics Technologist 900 450
Medical Laboratory Assistant 300 300
Radiology Tech 28
Food & Nutrition Dietitian 1,152 1,360 1,760
Administration Health Unit Coordinator/Nursing Unit Clerk 1,475
Unit Clerk 495 120
Medical Office Assistant 218
Pharmacy Pharmacist 640 320 800
Pharmacy Technician 160
Psychology Counselling Psychology 800
Social Work Master of Social Work 450
BC Cancer Total 16,943 9,701 17,145
BCCDC Nursing Bacc Nursing - BScN/BSN/BN 360 240 288
Licensed/Registered Practical Nurse 90
Non-Health Master of Public Health 35
BCCDC Total 360 330 323
BCCH Nursing Bacc Nursing - BScN/BSN/BN 47,807 56,177 42,813
Psychiatric Nursing Bacc - BScN/BN/RPN Psych
2,332 1,620 1,780
Post-RN Specialty 1,308 1,104 1,869
Nurse Practitioner 1,466 997 959
Nursing - Masters 508 104
Post-LPN/RPN Specialty 420
Registered Nurse 320
Bacc Nursing - Post Diploma BSN/BN 156

P R AC T I C E E D U C AT I O N M E T R I C S | 33
Site DISCIPLINE SUB-DISCIPLINE FY 15-16 FY 16-17 FY 17-18
Therapist Respiratory Therapist 18,620 18,620 17,150
Music Therapist 850
Massage Therapist 360
Technologist/ Technician
Medical Laboratory Technologist 4,690 6,860 8,075
Radiology Tech 2,160 2,628 2,732
Nuclear Medicine Tech 720 1,120 480
Medical Laboratory Assistant 510 700 120
Clinical Genetics Technologist 1,180
Magnetic Resonance Imaging (MRI) Technology/Technician
640
Perfusionist 540
Sonography Tech 252
Rehabilitation Sciences
Physiotherapist 1,488 1,864 2,096
Occupational Therapist 1,027 2,238 1,788
Audiologist 216 216
Speech & Language Pathologist/Communications
64 288
Rehabilitation Assistant 144 144
Pharmacy Pharmacist 2,720 3,040 4,240
Pharmacy Technician 610 300 300
Psychology Psychology (PHD) 3,900 3,900
Counselling Psychology 1,200 1,200 100
Psychology (Masters) 450
Psychology (Bachelor) 180
Administration Clerical - General 1,320 1,320 1,080
Unit Clerk 1,156 628
Medical Office Assistant 280 100 640
Health Unit Coordinator/Nursing Unit Clerk 480
Social Work Master of Social Work 1,800 900 1,800
Child and Youth Care Worker 1,052 436
Bachelor of Social Work 450
Food & Nutrition Dietitian 1,472 1,024 576
Non-Health Health Information Management 720
Bachelor of Science 184
Bachelor of Arts 42
BCCH Total 99,880 110,542 91,497

34 | S U P P L E M E N TA R Y R E P O R T 2 017– 2 018
Site DISCIPLINE SUB-DISCIPLINE FY 15-16 FY 16-17 FY 17-18
BCEHS Paramedic Primary Care Paramedic 52,800 32,166 48,286
Advanced Care Paramedic 22,464 24,243 22,653
BCEHS Total 75,264 56,408 70,939
BCMHSUS Nursing Bacc Nursing - BScN/BSN/BN 5,040 10,176 11,292
Psychiatric Nursing Bacc - BScN/BN/RPN Psych
1,353 1,247 2,827
Psychiatric Nursing - Diploma 810 3,420
Nurse Practitioner 358 431 208
Licensed/Registered Practical Nurse 140 180
Therapist Music Therapist 1,119 1,856 2,784
Recreation Therapist Degree 560 560
Massage Therapist 464
Art Therapist 300 140
Social Work Bachelor of Social Work 420 420 2,758
Master of Social Work 450 1,910
Rehabilitation Sciences
Occupational Therapist 150 551 975
Rehabilitation Assistant 225 225
Administration Health Unit Coordinator/Nursing Unit Clerk 636
Unit Clerk 172
Other Administrative 40
Pharmacy Pharmacist 160 640
Other Health Community Health Worker 670
Psychology Psychology (Masters) 150
BCMHSUS Total 9,910 16,878 29,029
BCW Nursing Bacc Nursing - BScN/BSN/BN 22,504 21,145 18,767
Post-RN Specialty 6,240 6,360 9,624
Nurse Practitioner 609 578 913
Nursing - Masters 208 208
Registered Nurse 280
Bacc Nursing - Post Diploma BSN/BN 78
Technologist/ Technician
Sonography Tech 2,912 2,660 2,310
Non-Health Master of Public Health 1,292 1,680 2,190
Health Information Management 180
Administration Unit Clerk 1,448 930
Health Unit Coordinator/Nursing Unit Clerk 1,008
Clerical - General 240 120
Medical Office Assistant 80 160

P R AC T I C E E D U C AT I O N M E T R I C S | 35
Site DISCIPLINE SUB-DISCIPLINE FY 15-16 FY 16-17 FY 17-18
Social Work Master of Social Work 900 1,800
Bachelor of Social Work 378
Paramedic Advanced Care Paramedic 184 1,504 192
Therapist Massage Therapist 280 300
Music Therapist 144 156 78
Recreation Therapist Degree 140
Rehabilitation Sciences
Occupational Therapist 144 369
Physiotherapist 180 180
Pharmacy Pharmacist 9 640
Other Health Various - Multidisciplinary/Interdisciplinary 252
Midwifery 132 56
Other Health 108
Therapeutic Touch Practitioner 54
Food & Nutrition Dietitian 80
BCW Total 38,160 36,795 38,029
SunnyHill Nursing Bacc Nursing - BScN/BSN/BN 2,640 1,482 5,066
Rehabilitation Sciences
Occupational Therapist 825 888 713
Physiotherapist 540 720 540
Speech & Language Pathologist/Communications
478 317 288
Rehabilitation Assistant 225 225
Therapist Recreation Therapist Degree 560 560 560
SunnyHill Total 5,043 4,192 7,392
PHSA Nursing Bacc Nursing - BScN/BSN/BN 1,028
Nursing - Masters 10
PHSA Total 10 1,028
PHSA Corporate Non-Health Health Information Management 360
PHSA Corporate Total
360
BCRCP Non-Health Health Information Management 180
BCRCP Total 180
GRAND TOTAL 245,559 235,395 255,382

36 | S U P P L E M E N TA R Y R E P O R T 2 017– 2 018
APPENDIX C NUMBER OF DECLINES, STUDENTS AND HOURS BY DISCIPLINE, AGENCY AND RE ASON
DISCIPLINE RA SITE REASON COUNT OF REASON
SUM OF # STUDENTS
SUM OF STUDENT
HOURS
Nursing BCCH Too many students on unit/program 26 26 3,700
No supervisor / preceptor is available 27 27 2,509
Destination is closed during placement period
12 12 2,473
Other / special reason (use ONLY if no other reason applies)
13 13 1,370
Unit workload 10 10 1,128
Conflicts with other requests 2 2 850
Request not suitable for area requested 8 8 835
Student not suitable for area requested 4 4 400
Too many hours/shifts requested 1 1 135
Service has changed (see Comments) 1 1 100
BCW Too many students on unit/program 14 15 2,028
Unit workload 7 7 788
Other / special reason (use ONLY if no other reason applies)
7 7 700
No supervisor / preceptor is available 5 5 500
Destination is closed during placement period
2 2 410
Student not suitable for area requested 3 3 300
Request not suitable for area requested 1 1 100
Too many hours/shifts requested 1 1 100
BC Cancer-VICC No supervisor / preceptor is available 7 7 700
Too many students on unit/program 1 1 100
Unit workload 1 1 100
Other / special reason (use ONLY if no other reason applies)
1 1 100
SunnyHill Too many students on unit/program 9 10 1,012
Forensic Request not suitable for area requested 2 2 200
Other / special reason (use ONLY if no other reason applies)
2 2 200
Unit workload 1 1 100
No supervisor / preceptor is available 1 1 100

P R AC T I C E E D U C AT I O N M E T R I C S | 37
DISCIPLINE RA SITE REASON COUNT OF REASON
SUM OF # STUDENTS
SUM OF STUDENT
HOURS
BC Cancer-Van Request not suitable for area requested 3 3 300
Unit workload 1 1 100
Too many students on unit/program 1 1 100
BC Cancer-PG Other / special reason (use ONLY if no other reason applies)
4 4 400
BC Cancer-Fras Other / special reason (use ONLY if no other reason applies)
1 1 135
Unit workload 1 1 100
CHS Too many students on unit/program 1 1 100
BC Cancer-Kel No supervisor / preceptor is available 1 1 450
Nursing Total 182 184 22,723
Administration BCCH Destination is closed during placement period
4 4 1,520
No supervisor / preceptor is available 5 5 756
Other / special reason (use ONLY if no other reason applies)
6 6 600
BCW Conflicts with other requests 1 1 500
No supervisor / preceptor is available 3 3 300
Request not suitable for area requested 2 2 200
Other / special reason (use ONLY if no other reason applies)
1 1 100
BC Cancer-Van Too many students on unit/program 2 2 200
Administration Total 24 24 4,176
Social Work BCCH No supervisor / preceptor is available 4 4 400
Other / special reason (use ONLY if no other reason applies)
3 3 300
Too many students on unit/program 1 1 100
BCW Too many students on unit/program 4 4 696
No supervisor / preceptor is available 2 2 200
Other / special reason (use ONLY if no other reason applies)
1 1 100
BbyCtrMH No supervisor / preceptor is available 2 2 200
Social Work Total 17 17 1,996
Psychology BbyCtrMH Too many students on unit/program 3 3 300
BCCH No supervisor / preceptor is available 2 2 200
BC Cancer-Van No supervisor / preceptor is available 2 2 200
Psychology Total 7 7 700

38 | S U P P L E M E N TA R Y R E P O R T 2 017– 2 018
DISCIPLINE RA SITE REASON COUNT OF REASON
SUM OF # STUDENTS
SUM OF STUDENT
HOURS
Technologist/Technician
BCCH No supervisor / preceptor is available 3 3 346
Unit workload 1 1 120
Other / special reason (use ONLY if no other reason applies)
1 1 100
BC Cancer-Van No Affiliation Agreement in place 1 1 100
Technologist/Technician Total
6 6 666
Rehabilitation Sciences
SunnyHill Too many students on unit/program 1 1 100
Other / special reason (use ONLY if no other reason applies)
1 1 100
BCCH No supervisor / preceptor is available 1 1 100
Rehabilitation Sciences Total
3 3 300
Other Health BCW Request not suitable for area requested 1 1 100
No supervisor / preceptor is available 1 1 100
Other Health Total 2 2 200
GRAND TOTAL 241 243 30,761

P R AC T I C E E D U C AT I O N M E T R I C S | 39
APPENDIX D EDUCATION INSTITUTIONS WITH AFFILIATION AGREEMENTS IN PL ACE F Y 2017-18
STANDARD TEMPLATE
Public
Athabasca University
BC Institute of Technology
Camosun College
Capilano University
Cardiff University
Dalhousie University
Douglas College
Justice Institute of BC
Kwantlen Polytechnic University
Lakehead University
Langara College
McMaster University
Mount Royal University
Nicola Valley Institute of Technology
North Island College
Okanagan College
Queens University
Royal Roads University
Simon Fraser University
Thompson Rivers University - Open Learning
University of Abertay, Scotland
University of Alberta
University of Guelph
University of Northern BC
University of Porto
University of the Fraser Valley
University of Victoria
Vancouver Community College
Vancouver Island University
University Medical Center Groningen
University of Waterloo
Burnaby School District #41
La Trobe University
STANDARD TEMPLATE
Public
University of Washington - School of Pharmacy
University of Ottawa
College of New Caledonia
Yorkville University
Emily Carr University of Art & Design
Grant MacEwan University
HealthCareCAN
Northern Alberta Institute of Technology
Paris Descartes University
University of Manitoba
A.C. Camargo Cancer Center
Private
Bilkent University, Turkey
LaunchLife International
Sarah Lawrence College
Stenberg College
Trinity Western University
West Coast College of Health Care
West Coast College of Massage Therapy
City University of Seattle (Vancouver)
Casa Sollievo Della Sofferenza - Italy
Adler University
Vancouver Art Therapy Institute
Vancouver College of Massage Therapy
CDI
Grand Canyon University
NO STANDARD TEMPLATE
Public
Department of National Defense
Simon Fraser University
UBC - Health Sciences
UBC - School of Nursing
UBC - Social Work
UBC - University of British Columbia
University of Toronto
Private
City University of Seattle (Victoria)
Western Seminary - Seattle

40 | S U P P L E M E N TA R Y R E P O R T 2 017– 2 018
EDUCATION INSTITUTION DISCIPLINE TOTAL STUDENT HOURS
FY 15-16 FY 16-17 FY 17-18
Justice Institute of BC Paramedic 75,448 49,172 66,235
Advanced Care Paramedic 22,648 20,904 21,071
Primary Care Paramedic 52,800 28,268 45,164
Justice Institute of BC Total 75,448 49,172 66,235
University of British Columbia
Nursing 27,720 29,870 26,508
Bacc Nursing - BScN/BSN/BN 26,246 28,358 25,204
Nurse Practitioner 1,174 1,512 1,304
Nursing - Masters 300
Rehabilitation Sciences 4,968 6,937 7,237
Occupational Therapist 2,002 3,821 3,845
Physiotherapist 2,208 2,584 2,816
Audiologist 216 216
Speech & Language Pathologist/Communications
542 317 576
Pharmacy 3,529 4,000 5,680
Pharmacist 3,529 4,000 5,680
Food & Nutrition 2,704 2,384 2,336
Dietitian 2,704 2,384 2,336
Social Work 2,628 900 3,078
Master of Social Work 1,800 900 2,700
Bachelor of Social Work 828 378
Psychology 200 750 100
Counselling Psychology 200 750 100
Other Health 132 56 252
Midwifery 132 56
Various - Multidisciplinary/Interdisciplinary
252
University of British Columbia Total
41,881 44,897 45,191
BCIT Technologist/Technician 11,362 17,116 14,859
Sonography Tech 2,912 2,660 2,562
Nuclear Medicine Tech 1,600 2,320 1,040
Radiology Tech 2,160 2,656 2,732
APPENDIX E TOTAL STUDENT HOURS BY EDUCATION INSTITUTION BY SUB-DISCIPLINE

P R AC T I C E E D U C AT I O N M E T R I C S | 41
EDUCATION INSTITUTION DISCIPLINE TOTAL STUDENT HOURS
FY 15-16 FY 16-17 FY 17-18
Medical Laboratory Technologist 4,690 6,860 8,075
Clinical Genetics Technologist 2,080 450
Perfusionist 540
Nursing 14,148 16,332 19,293
Bacc Nursing - BScN/BSN/BN 6,600 9,300 7,800
Post-RN Specialty 7,548 7,032 11,493
Therapist 9,188 320 6,384
Radiation Therapist 9,188 320 6,384
Administration 80 80 160
Medical Office Assistant 80 80 160
BCIT Total 34,778 33,848 40,696
Langara College Nursing 30,255 25,801 23,685
Bacc Nursing - BScN/BSN/BN 30,255 25,801 23,685
Other Health 54 108
Other Health 108
Therapeutic Touch Practitioner 54
Therapist 640
Massage Therapist 640
Langara College Total 30,895 25,855 23,793
Thompson Rivers University Therapist 18,620 18,620 17,150
Respiratory Therapist 18,620 18,620 17,150
Nursing 348 228 648
Bacc Nursing - BScN/BSN/BN 228 228 648
Registered Nurse 120
Social Work 420
Bachelor of Social Work 420
Thompson Rivers University Total
18,968 18,848 18,218
Kwantlen Polytechnic University
Nursing 6,778 16,078 15,334
Bacc Nursing - BScN/BSN/BN 4,526 14,498 12,374
Psychiatric Nursing Bacc - BScN/BN/RPN Psych
1,772 1,580 2,960
Registered Nurse 480
Administration 504 500 1,044
Unit Clerk 504 500
Health Unit Coordinator/Nursing Unit Clerk
1,044
Psychology 180
Psychology (Bachelor) 180
Kwantlen Polytechnic University Total
7,462 16,578 16,378

42 | S U P P L E M E N TA R Y R E P O R T 2 017– 2 018
EDUCATION INSTITUTION DISCIPLINE TOTAL STUDENT HOURS
FY 15-16 FY 16-17 FY 17-18
Douglas College Nursing 9,787 8,754 9,060
Bacc Nursing - BScN/BSN/BN 7,874 7,467 7,413
Psychiatric Nursing Bacc - BScN/BN/RPN Psych
1,913 1,287 1,647
Non-Health 1,440
Health Information Management 1,440
Therapist 1,260 1,120 560
Recreation Therapist Degree 1,260 1,120 560
Other Health 350
Community Health Worker 350
Douglas College Total 11,047 11,314 9,970
University of Victoria Nursing 3,142 4,047 2,526
Bacc Nursing - BScN/BSN/BN 1,626 1,536 1,478
Bacc Nursing - Post Diploma BSN/BN 156 78
Nurse Practitioner 1,100 1,601 970
Nursing - Masters 416 322
Post-RN Specialty 432
Psychology 1,950 800
Counselling Psychology 800
Psychology (PHD) 1,950
Social Work 1,022 436 350
Master of Social Work 450
Child and Youth Care Worker 572 436
Bachelor of Social Work 350
University of Victoria Total 6,114 5,283 2,876
Stenberg College Administration 2,760 2,280 2,640
Clerical - General 1,560 1,440 1,080
Unit Clerk 1,200 840
Health Unit Coordinator/Nursing Unit Clerk
1,560
Nursing 810 3,420
Psychiatric Nursing - Diploma 810 3,420
Technologist/Technician 240 160
Medical Laboratory Assistant 240 160
Pharmacy 160 160
Pharmacy Technician 160 160
Other Health 320
Community Health Worker 320
Stenberg College Total 3,160 3,250 6,540

P R AC T I C E E D U C AT I O N M E T R I C S | 43
EDUCATION INSTITUTION DISCIPLINE TOTAL STUDENT HOURS
FY 15-16 FY 16-17 FY 17-18
Vancouver Community College
Nursing 1,440 2,034 1,800
Bacc Nursing - BScN/BSN/BN 1,440 1,944 1,800
Licensed/Registered Practical Nurse 90
Technologist/Technician 270 450 300
Medical Laboratory Assistant 270 450 300
Rehabilitation Sciences 450 450
Rehabilitation Assistant 450 450
Administration 638 390 860
Medical Office Assistant 218 240
Unit Clerk 420 390
Health Unit Coordinator/Nursing Unit Clerk
620
Pharmacy 450 300 300
Pharmacy Technician 450 300 300
Vancouver Community College Total
2,798 3,624 3,710
Simon Fraser University Psychology 1,000 2,400 450
Counselling Psychology 1,000 450
Psychology (Masters) 450
Psychology (PHD) 1,950
Non-Health 1,292 1,680 2,060
Masters of Public Health 1,292 1,680 2,060
Simon Fraser University Total
2,292 4,080 2,510
Trinity Western University Nursing 3,096 2,304 2,664
Bacc Nursing - BScN/BSN/BN 3,096 2,304 2,664
Trinity Western University Total
3,096 2,304 2,664
Capilano University Therapist 1,263 2,862 2,862
Music Therapist 1,263 2,862 2,862
Capilano University Total 1,263 2,862 2,862
Holland College Paramedic 4,842 1,774
Advanced Care Paramedic 4,842 1,774
Holland College Total 4,842 1,774
AET Paramedic Academy Paramedic 2,123 2,409
Primary Care Paramedic 2,123 2,409
AET Paramedic Academy Total
2,123 2,409
Heartsafe First Aid Training Paramedic 1,739 713
Primary Care Paramedic 1,739 713
Heartsafe First Aid Training Total
1,739 713

44 | S U P P L E M E N TA R Y R E P O R T 2 017– 2 018
EDUCATION INSTITUTION DISCIPLINE TOTAL STUDENT HOURS
FY 15-16 FY 16-17 FY 17-18
University of Toronto Psychology 1,950
Psychology (PHD) 1,950
Nursing 200 280
Nurse Practitioner 200 280
University of Toronto Total 2,150 280
Dalhousie University Social Work 450 1,800
Master of Social Work 450 1,800
Non-Health 42
Bachelor of Arts 42
Dalhousie University Total 450 1,842
University of Waterloo Psychology 1,950
Psychology (PHD) 1,950
University of Waterloo Total 1,950
University of the Fraser Valley
Social Work 480 1,290
Master of Social Work 450
Child and Youth Care Worker 480
Bachelor of Social Work 840
University of the Fraser Valley Total
480 1,290
Athabasca University Nursing 790 150 520
Bacc Nursing - BScN/BSN/BN 370 380
Nurse Practitioner 420 150 140
Athabasca University Total 790 150 520
Vancouver Island University Nursing 600
Bacc Nursing - BScN/BSN/BN 600
Social Work 350
Bachelor of Social Work 350
Vancouver Island University Total
600 350
University of British Columbia - Okanagan
Social Work 450 450
Master of Social Work 450 450
University of British Columbia - Okanagan Total
450 450
Nicola Valley Institute of Technology
Social Work 420 420
Bachelor of Social Work 420 420
Nicola Valley Institute of Technology Total
420 420
Vancouver College of Massage Therapy
Therapist 300 464
Massage Therapist 300 464
Vancouver College of Massage Therapy Total
300 464

P R AC T I C E E D U C AT I O N M E T R I C S | 45
EDUCATION INSTITUTION DISCIPLINE TOTAL STUDENT HOURS
FY 15-16 FY 16-17 FY 17-18
Camosun College Administration 375 375
Unit Clerk 375
Health Unit Coordinator/Nursing Unit Clerk
375
Camosun College Total 375 375
School District 41 - Burnaby Administration 200 100 400
Medical Office Assistant 200 100 400
School District 41 - Burnaby Total
200 100 400
Northern Alberta Institute of Technology
Technologist/Technician 640
Magnetic Resonance Imaging (MRI) Technology/Technician
640
Northern Alberta Institute of Technology Total
640
Surrey College Administration 480 120
Unit Clerk 480 120
Surrey College Total 480 120
University of Norther British Columbia
Social Work 560
Master of Social Work 560
University of Norther British Columbia Total
560
Vancouver Art Therapy Institute
Therapist 300 140
Art Therapist 300 140
Vancouver Art Therapy Institute Total
300 140
MacEwan University Nursing 420
Post-LPN/RPN Specialty 420
MacEwan University Total 420
University of Manitoba Social Work 420
Bachelor of Social Work 420
University of Manitoba Total 420
CDI College Technologist/Technician 240 120
Medical Laboratory Assistant 240 120
CDI College Total 240 120
Okanagan College Rehabilitation Sciences 144 144
Rehabilitation Assistant 144 144
Okanagan College Total 144 144
North Island College Nursing 280
Bacc Nursing - BScN/BSN/BN 280
North Island College Total 280

46 | S U P P L E M E N TA R Y R E P O R T 2 017– 2 018
EDUCATION INSTITUTION DISCIPLINE TOTAL STUDENT HOURS
FY 15-16 FY 16-17 FY 17-18
McGill University Non-Health 184
Bachelor of Science 184
McGill University Total 184
College of New Caledonia Nursing 180
Licensed/Registered Practical Nurse 180
College of New Caledonia Total
180
West Coast College of Health Care
Technologist/Technician 150
Medical Laboratory Assistant 150
West Coast College of Health Care Total
150
Adler University Psychology 150
Psychology (Masters) 150
Adler University Total 150
Vancouver Career College Nursing 140
Licensed/Registered Practical Nurse 140
Vancouver Career College Total
140
University of Alberta Non-Health 130
Master of Public Health 130
University of Alberta Total 130
Selkirk College Administration 120
Unit Clerk 120
Selkirk College Total 120
Sprott Shaw College Administration 40
Other Administrative 40
Sprott Shaw College Total 40
Department of National Defense
Paramedic 36
Primary Care Paramedic 36
Department of National Defense Total
36
McMaster University Non-Health 35
Master of Public Health 35
McMaster University Total 35
GRAND TOTAL 245,559 235,395 255,382

P R AC T I C E E D U C AT I O N M E T R I C S | 47
APPENDIX F NEW HIRE ORIENTATION COURSE – PR ACTICE EDUCATION QUESTIONS
We would like to learn more about your educational background in order to help continually improve our programs for student and recent graduates. Please help us by completing the following practice education/practium questions:
Please provide the name of the program that you graduated from: (Ex. Respiratory Therapy, BSc Nursing)
__________________________________________________________________________
Please provide the completion date of the program that you graduated from: (year and month)
__________________________________________________________________________
Have you had a practicum or student unpaid practice at a PHSA site? Yes No
If yes, please indicate the unit/area in which you completed your practicum/placement. If no, please skip.
__________________________________________________________________________
Please provide the name of the school that coordinated your practicum or placement at the PHSA site(s). If you did not complete a practicum or placement at PHSA in the past, please skip.
__________________________________________________________________________