practices at newah project sites: the impact of hygiene ... · pdf filenepal water for health...
TRANSCRIPT

Nepal Waterfor HealthNEWAH
Hygiene Practices at NEWAH Project Sites:The Impact of Hygiene Education
~Cibra— ~ ~—
1 eL ~C
203.2 16454
II
I
by Dr. A. B. Shrestha
NEWAH, NepalApril 1998
(supportedby WaterAid)
(

~IYGIENEI’RACI ICE~3Ar NEWAI i’UOJEC
FOREWORD
Nepal Water for Health (NEWAH) is a national level NGO which works with some 50 localpartners each year to implement integrated drinking water, sanitation and hygiene educationprojects.
Of all the various challenges this work presents, it is hygiene education that proves the mostvaried and complex, and yet where the returns for doing it well are the most rewarding andfar-reaching. This is true not only for the obvious benefits of improved responses in hygienerelated actions, but also for the overall project process, Indeed, hygiene education done wellcan serve to galvanise and inspire communities in other project and development relatedactivities.The principal rationale for including hygiene education in drinking water projects is itspotential impact on public health. There is now little doubt that the most significant impactson disease incidence stem less from the construction of water and sanitation facilities andmore from behavioural changes that lead to improvements in hygiene. Taken together withaccess to improved facilities, the pdtential for improvin~community health and overall qualityof life through hygiene education is dramatically improved.
— This report presents a clear synthesis of studies of hygiene attitudes, knowledge andpractices in 46 individual project areas. The study shows how different types of behaviourand areas of knowledge have changed following a structured programme of hygieneeducation. It demonstrates that major impacts can be made if hygiene education work isfocused, properly resourced and fully integrated with other project activities.
It is my hope that this report will be of interest to other agencies working in the sector, andprovide the basis for NEWAH’s own health workers and partners to improve their work yetfurther.
Umesh PandeyDirector
LIBRARY JRC0 Box 93190, 2509 AD THE HAGUE
Tel.: +31 70 30 689 80Fax: +31 70 3589984
L3ARCODE: 5L

HYGIENE PRACTICES AT IEWAH PROJECT S
ACKNOWLEDGEMENTS
I would like to thank all the staff at NEWAH Headquarters in Kathmandu who helped in epreparation of this report, Jn particular Saras’wati Khanal for her careful work, critcomments and, stimulating discussions during data preparation and evaluation andproviding valuable information about the actual methods used in the field, Renuka Rai for ninformation about the hygiene education programme and enthusiastic approach toji&Ldevelopment, John Kelleher for help with the spreadsheet evaluation formats, and allsecretarial and general office staff for their friendly help and support.
Special thanks are due to Greg Whiteside of WaterAid who initiated the study, and provkfriendly support and useful criticism at all stages of report preparation.
I hope that the publication of this report will also help ‘repay the efforts of all the people atNEWAH regional offices and in the field, in particular the NEWAH health educators andsenior and local health motivators appointed by the partner NGOs, who spent many hourscollecting and analysing the clala. .
Finally, we all wish to thank the many hundreds of participants in the study, the projectbeneficiaries, who gave generously of their time and energy to answer questions.
N
isIIIIII

CONTENTSPage
FOflEWOFID.ACKNOWLEDGEMENTSINTRODUCTION 1METHODS 1
The Projects 1The Hygiene Education Programme 2Study Design and Organisation 3
PR1A methodology 3Household survey methodology 4Data evaluation 5
RESULTS 5A) Water Sources 5B) Water Uses 7C) Sanitation 9D) Food Hygiene 12
- E) Environment 13F) Knowledge about Diarrhoea and Rohydration 14
DISCUSSION 16Methods 16Indicators of Change 17General 19
CONCLUSIONS AND RECOMMENDATIONS 20REFERENCES 21APPENDIX 1: LIST OF PROJECTS 23APPENDIX 2: TABLES OF VALUES 25APPENDIX 3: QUESTIONNAIRES 33APPENDIX 4: CHRONOLOGY OF PROJECT IMPLEMENTATION 47
Figures and TablesFigure 1: Water Collection Points 6Figure 2: Round Trip Water Collection Times 6Figure 3: Waler Container Hygicnc 7Figure 4: Materials Used to Clean Water Containers 8Figure 5: Sites Used for Defecation 9Figure 6: Presence and State of Cleanliness of Latrines 10Figure 7: Methods of Disposing of Children’s Stool 11Figure 8: Materials Used to Wash Hands Alter Defecation 12Figure 9: Refuse Disposal Sites 13Figure 10: Presence of Kitchen Gardens and Sheds or Pens for Livestock 14Figure 11: Porceiverl C,ii i~osof Diai, 1 oe;i 1 5Figure 12: Trent~not U of Diati I ioea 1 6
Table 1: Hand Washing at Critical Times 9Table 2: Action When Latrine Pit Full 11Table 3: Food Hygiene 12Table 4: Number Dying of Diarrhoea. in the Previous Year 14
HYGIENE PRACTICES AT NEWAil PROJECT SI I ES
r ~0~
ours
~oIect
I
I
I
I
1,

HYGIENE PRACTICES AT NEWAI I PROJECT SITES
SUMMARY
lIti~~i?l1’il ~ lIt~i~tiIl~ol ~i ~tiiV~y t~~~ijii~elto :l!’,~o~~the iItlleu;l of liyçjieim(‘tlIi(:nlR)il iii NLWAI I piujo~:t;iie;n;. I lu~~iiiVey uuveied ‘lU pruju~Is,3/ in hill rogion.s and 9in the Teuai, implemented in the 199511996 season. Information about hygiene attitudes,knowledge and practices was obtained by a combination of participatory rural appraisal(PRA) and household questionnaire survey techniques before and after implementation ofwater supply and sanitation projects, of which hygiene education was an integral part. Theindicators investigated related both to ‘known practices’, what people were actually observeddoing, and to ‘stated practices’, what people said they did.
The results indicate that overall the hygiene education programme was successful and had amajor impact on people’s knowledge about and attitudes towards a whole range of hygienepractices. After hygiene education the majority of people had understood the need for andknew how to store water hygienically; they had realised the importance of washing theirhands at critical times, of isolating faeces from the environment, of protecting leftover foodrpm contamination, and of disposing of refuse in one place; they had learnt the value of
using waste water to develop a kitchen garden; and they understood much more about thecauses of diarrhoea, how to prevent its transmission and how to treat it. In the year beforeproject implomeiitntion there were 58 deaths from (Jifli rhoca in the project arecjr., which wasi’educed to zero in the following year.
Although the overall results were very encouraging there were considerable differencesbetween different project areas, and overall the effects in projects in the Terai v.’ere lessmarked than those in projects in hill districts. Some areas in which the hygiene educationprogramme could be strengthened or modified wore identified. More detailed analysis of the(ljllcre:1l impact in difleretit project areas rrmigl It help lurllier improvements to be identified.Half of those in the Terai and one sixth of those in the hills who had ~ecognisedthe potentialbenefits of a latrine had not built one either because it was too expensive, they had nomanpower or they had no land. Thus a way still needs to be found to help poor and landlesspeople to gain access to adequate sanitation facilities.
Some problems were encountered in the data set during data analysis, and someimprovements in the survey methodology have been suggested so that these can be avoidedin the future.
I~1
1pII
1I

I,2 HYGIENE PRACTICES AT NEWAH PROJECT SITE’~
whereas Terai projects cover all 9 Wards in a VDC (in 1995/6 the average number o~beneficiary households was 608, ranging from 134 to 859). The average size of th_____households served by the projects was the same in both areas (6 persons), but there ar~important socio-economic differences. Most settlements in Terai areas have developed overthe last 40 years as a result of migration from other areas in the country. There is mucgreater ethnic diversity than in the hills, and greater variability in land tenure. Many mompeople live in rented accommodation and work as hired labourers. Thus the problemsencountered and challenges faced by people living in the two areas differ considerably. Ithis report the results from projects in these two types of area are presented separately.
The Hygiene Education Programme ,
Hygiene education starts before water supply construction and continues beyond icompletion (see Appendix 4). One local health motivator (usually a woman) is appointed ineach small project and’ two local health motivators and a senior health motivator in ea -
large project by the implementing partner NGO using guidelines prepared by NEWANEWAH provides training, education guidelines, teaching materials and support. In additionone female health volunteer is appointed for each water point by the User Group (usually10 households) and also given one week of training. The hygiene education is divided inseparate topics. The local health motivator holds a series of half to one day teachingsessions with each water point user group introducing each topic separately (approximate~6-10 meetings per water point, or more for small projects with a small number of tapsOngoing education is provided by the health volunteer. If the health motivator feels that it t~’°J”necessary, then separate visits will be made to selected households both to supporthealth volunteer and to see whether the householders have actually gained a genui _____understanding of such points as latrine hygiene. Hygiene education sessions are also held ~rschools whenever possible. Usually all schools are visited in the hill areas, but only some i.p.the Terai where the number of schools in a project area can be very high.
u-i,—
The main purpose of the hygiene education programme is to establish a link in people’sminds between unhygienic practices and disease, and to provide information about wh ____constitutes hygienic behaviour. A series of simple pictorial messages portray the moeffective primary and secondary physical and behavioural barriers to the transmission ofpathogens via faeces. Singing and dancing, role plays, puppets, games, storytelling, video~demonstrations and practical exercises are all used to help participants understand ar~——
internalise the information. The main points emphasised in the programme are summarised -
in the box.
The major points covered in the hygiene education programmethe safe disposal of excreta (including from children), preferably throughconstruction of a household latrine which is kept cleanhand washing at critical times - after defecation, after cleaning children’s bottoms,before handling food, before eating and before feeding childrendisposal and use of waste water
• prevention of contamination of water in transit and in the home• food hygiene - protection by covering, and use of a dish rack• attention to domestic and environmental hygiene - proper disposal of household
refuse and housing of domestic animals ‘ Iknowledge of paths of infection and treatment of diarrhoea - oral rehydrationtherapy
• simple domestic medical treatment using clean water, e.g. water cooling of burns,salIne rinse for eye infections
HYGIENE PRACTICES AT NEWAH PROJECT SITES 3
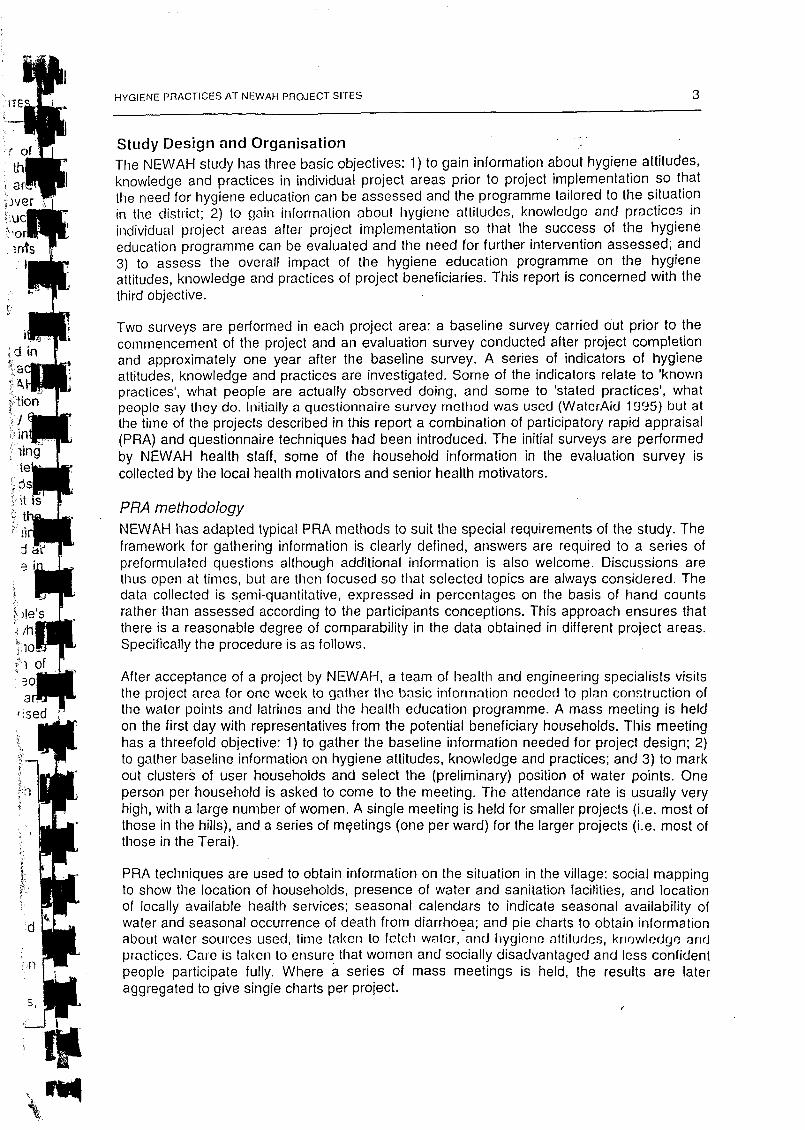
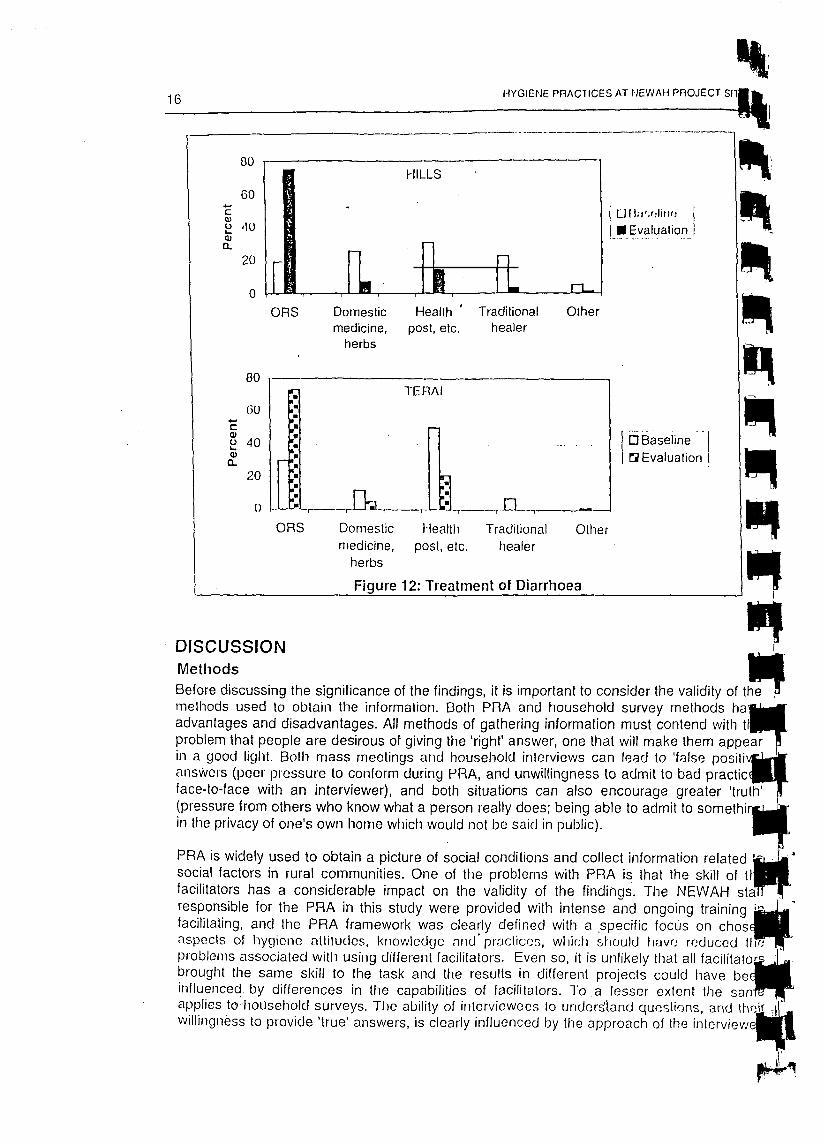
Study Design and OrganisationThe NEWAH study has three basic objectives: 1) to gain information about hygiene attitudes,knowledge and practices in individual project areas prior to project implementation so thatthe need for hygiene education can be assessed and the programme tailored to the situationin the district; 2) to gain information about hygiene attitudes, knowledge and practices inindividual project areas after project implementation so that the success of the hygieneeducation programme can be evaluated and the need for further intervention assessed; and3) to assess the overall impact of the hygiene education programme on the hygieneattitudes, knowledge and practices of project beneficiaries. This report is concerned with thethird objective.
Two surveys are performed in each project area: a baseline survey carried out prior to thecommencement of the project and an evaluation survey conducted after project completionand approximately one year after the baseline survey. A series of indicators of hygieneattitudes, knowledge and practices are investigated. Some of the indicators relate to ‘knownpractices’, what people are actually observed doing, and some to ‘stated practices’, whatpeople say they do. Initially a questionnaire survey method was used (WaterAid 1 995) hut atthe time of the projects described in this report a combination of participatory rapid appraisal(PRA) and questionnaire techniques had been introduced. The initial surveys are performedby NEWAH health staff, some of the household information in the evaluation survey iscollected by the local health motivators and senior health motivators.
PRA methodologyNEWAH has adapted typical PRA methods to suit the special requirements of the study. Theframework for gathering information is clearly defined, answers are required to a series ofpreformulated questions although additional information is also welcome. Discussions arethus open at times, but are then focused so that selected topics are always considered. Thedata collected is semi-quantitative, expressed in percentages on the basis of hand countsrather than assessed according to the participants conceptions. This approach ensures thatthere is a reasonable degree of comparability in the data obtained in different project areas.Specifically the procedure is as follows.
After acceptance of a project by NEWAH, a team of health and engineering specialists visitsthe project area for one week to gather the basic information needed to plan construction ofthe water points and latrines and the health education programme. A mass meeting is heldon the first day with representatives from the potential beneficiary households. This meetinghas a threefold objective: 1) to gather the baseline information needed for project design; 2)to gather baseline information on hygiene attitudes, knowledge and practices; and 3) to markout clusters of user households and select the (preliminary) position of water points. Oneperson per household is asked to come to the meeting. The attendance rate is usually veryhigh, with a large number of women. A single meeting is held for smaller projects (i.e. most ofthose in the hills), and a series of m~etings(one per ward) for the larger projects (i.e. most ofthose in the Terai).
PRA techniques are used to obtain information on the situation in the village: social mappingto show the location of households, presence of water and sanitation facilities, and locationof locally available health services; seasonal calendars to indicate seasonal availability ofwater and seasonal occurrence of death from diarrhoea; and pie charts to obtain informationabout water sources used, time taken to letch water, and hygiene attitucics, kriowledcj~andpractices. Care is takeii to ensure that women and socially disadvantaged and less confidentpeople participate fully. Where a series of mass meetings is held, the results are lateraggregated to give single charts per project.

4 - , HYGIENE PRACTICES AT NEWAH PROJECT SITES
Duiimig the hollowing week a Iiousehioki survey is carried out (see below) and the engineeringsurvey work done. lithe PRA data obtained during the first mass meeting appear doubtfuUtheir validity is checked by random questioning during informal meetings with beneficiarie~through discussions with childLen, and by observation (triangulation). At the end of the weeka second mass meeting (or series of meetings) is held to present the findings of the survey tthe local users. This meeting provides an opportunity, often used, ta modify the informatiogiven in the PRA pie charts.
Water point construction, construction of latrines and the health education programme staPapproximately six to eight months later (in the dr,y season). The health education programmeis spread over a period of six to nine months (Appendix 4). pApproximately one year after the first mass meeting, after completion of the project, a furthermass meeting (or series of meetings) is held. The objective of this meeting is to obtaiinformation on: 1) the acceptance and state of the water supply; 2) preliminary information obreakdowns in the supply and the methods put in place to deal with them (the subject of aseparate detailed survey later); and 3) hygiene attitudes, knowledge and practices afthygiene education. One’ man and one woman, or at least one person, per household iasked to come to the meeting. Attendance at these meetings is sometimes, but by no mean~
always, lower than at the first meetings. The information is obtained by techniques similar to rthose used in the first meeting.
A household survey is again carried out in the week following the mass meeting (see below)and a further presentation and feedback meeting held after the results of the householsurvey have been compiled.
Household sulveymethodologyA random sample of beneficiary households is interviewed in a questionnaire surve(baseline and evaluation). The guideline at the time of the surveys in this report was tointerview 50% of households in projects with less than 100 beneficiary households and 25in those with more than 100 beneficiary households; occasionally there were slight deviatiofrom this (Appendix 1, Table 1). Random cluster sampling was used, households wereselected at random within the cluster to be served by a single water point (generally 6-1households who form a single User Group). Hindu tradition limits the communal use of watby persons of different caste and status (although the extent of restrictions variesconsiderably between areas). Although the main factor influencing hygiene attitudeknowledge and practices is likely to be level of education, this is often indirectly relatedcaste. Equally groups of close neighbours are more likely to interact with each other andshare knowledge (or supposed knowledge) related to hygiene and health. Thus each dustis likely to represent a more homogeneous group than the average in terms of attitudes anhygiene practices. In general, the same households were interviewed for the evaluation .-ilsurvey as for the baseline survey. In a number of cases, however, particularly in the Tera’~the number of water points actually constructed, and thus the number of proje ,,
beneficiaries, was lower than estimated at the time of the baseline survey. In the Terai, thiswas usually because the results of boring were not successful (after 3 failed attempts th_____water point is abandoned), and in the hills because of water source problems or disputerelated to land or other social factors. Equally in some project areas additional householdsmigrated into the area, or were included in the project, after the baseIin~survey w~performed. Where the number of project beneficiaries had changed, the numberhouseholds interviewed was adjusted accordingly (Appendix 1).
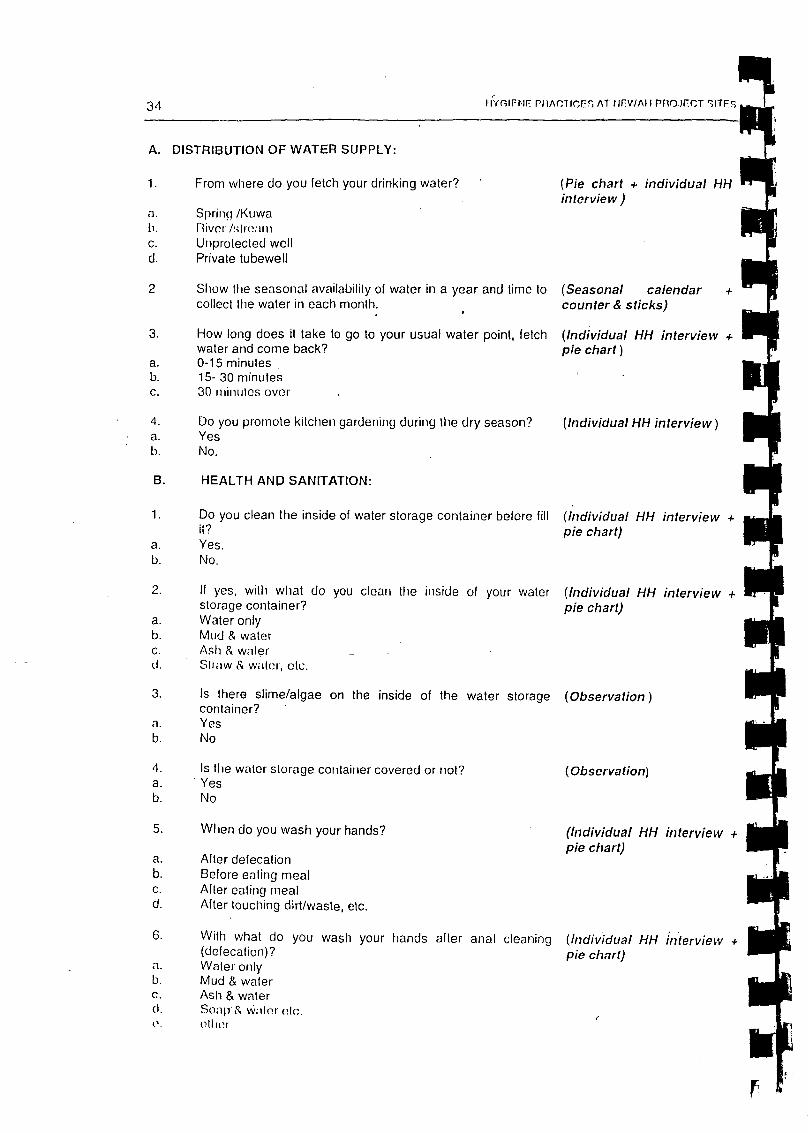
lnterviews~wereheld together with all available household members, but most common janswers were provided by the female head of house. The interviewer also made directobservations of contain things, e.g. the PICSC~lCOof slime in water containers arid of children’~excreta around the house (Appendix 3). Many of the questions were the same as thos
F

HYGIENE PRACTICES AT NEWAH PROJECT SITES 5
asked during the PRA, but some questions were either not repeated or.were only askeddurimig the household interviews. Thus time hodsehohd survey acted: as a method oftriangulation for the PRA as well as providing additional information.
Data evaluationThe questionnaires used during the household survey and as a guideline for the PRA areshown in Appendix 3. Information was gathered for a number of different purposes during thesurveys, but only the data relevant to hygiene education are included in this report.
Data from individual projects was compiled in tables. The average values for Terai and hillprojects were calculated separately. Simple averages were used (i.e. not weighted accordingto the number of beneficiary households in a project) to show the average impact acrossprojects. Simple ‘Before’ and ‘After’ plots were used to show changes in hygiene attitudes,knowledge and practices.
Many questions were duplicated in the PRA and household surveys, even where this was notoriginally planned. The results obtained by the two rrietliods were compiled separately.Occasionally one or the other was clearly less reliable, either because the question was notasked by that method in all projects, or in the household survey because participants in somebut not all projects were allowed to give multiple answers to a question. Where resultsobtained by PRA and household survey methods were directly comparable, they were nearlyalways very similar. In general, when information was obtained by both methods the resultsshown in this report are those obtained by means of PRA. Any significant differencesbetween the results obtained by the two methods are mentioned in the Results section.
Occasionally, differences between the data obtained in the baseline and evaluation surveys,and in the hills and the Terai, made the exact comparison of results difficult. Problemsincluded no answer being provided for some project areas for certain questions, differencesin the interpretation of some questions by the interviewers, and differences in the wording ofquestions in the baseline and evaluation surveys. Occasionally anomalies were suspected inthe data submitted to NEWAH. Where it was not possible to clarify the problems such datawas retained in the data set. As far as possible, these problems were taken into accountduring data analysis, and where errors were suspected and a choice of including ordiscarding values had to be made, the interpretation chosen was always such that theapparent impact of hygiene education would be shown to be less rather than more. Specificproblems are mentioned iii tIme relevant sections of tIme results (below) arid together with thetables of values in Appendix 2. It is clear from the nature of the study, however, that the finalresults must be seen as indicative rather than absolute.
RESULTSIii the following, lIme results obtained in the surveys have been arranged according to lime fiveclusters of hygiene practices (Alrn~domet al. 1997b) with an additional section related toknowledge about and treatment of diarrhoea. Major differences between the baseline andevaluation surveys are shown in the form of column charts. The complete tables of valuesare given in Appendix 2.
A) Water SourcesThe change in the type of collection point used fo~drinking water is shown in Figure 1(Appendix 2, Table 1). After project completion, 98% of people in the hills collected drinkingwater from a protected tap, whereas before drinking water was obtained from unprotectedsources including unprotected wells, springs and waterways. In the Terai the number usingunprotected wells or springs dropped morn 54% to 3%.

itY(;Irmlr r’nAc; ic;r,s Ar I IFWAI I i’imo.mc r sn
UBaseline
• Evalualion
Other
DBaseIiroe~1
NEvaiuaIion~ L.
ii___ Ii
U Baseline
• Evaluation
[~~aseiiroe- I[~vaIuatiof~J
I’.11
6
1-IILLS
--
,
H
100
80
60
~ 40
20
0Tapstand Tubeweli Well/kuwa River etc.
100
80
60
~ 40
20
0Tapstand TubewelI Well/kuwa River etc. Other
Figure. 1: Water Collection Points
100
80
~ 600)C.)a)
20
0
100
8060
C)
4°
20
0
0-15 mins 15-30 mins >30 mins
—•1I’ TERAI.~
U•i
.
U.
. .u,..U.~U.
-
———- ———-—..--- ———-—~.---—..- ~: ~n~-
0-15 mins 15-30 mins
Figure 2: Round Trip Water Collection Tiirces
>30 mins

V
pVpIIIII
LIIIIII
IIII
HYGIENE PRACTICES AT NEWAH PROJECT SITES 7
At the time of evaluation, all potential beneficiaries were Imimicj lho ~~rojectwaler in 2/3 of thehill projects and 1/3 of Terai projects. An average of 3% of hill users (ranging from 0-22% indifferent projects) and 7% of Terai users (ranging from 0-24% in different projects) were notusing the project water.After completion of the projects, 94% of beneficiaries in the hills and 81% in the Teraiconsidered their water supply to be sufficient throughout ft io year. In 2/3 of the projects 100%of users considered their water supply to be sufficient at all times. The most commonreasons given for riot using the water were: in the hills ‘traditional source more convenient’and ‘source unreliable’; and in the Terai ‘poor taste’, ‘unreliable’ and ‘too far away’ (Appendix2, Table 2).
In the hill areas the average times taken for a round trip to collect drinking water changeddramatically (Figure 2; Appendix 2, Table 3). The number taking more than 30 minutes tocollect drinking water~dropped from 46% to 1%. The changes in the Terai were less dramaticsince the great majority already took less than 15 minutes to collect water before the projectswere implemented. A rough calculation indicates that on average households in the hillssaved 15 minutes per round trip, and those in the Terai, 5 minutes; giving a total savings perday of 1 .5-2 hours arid 30-40 minutes, respectively (6-8 trips per day).
B) Water UsesThe cleanliness of water storage cont?iners and extent to which containers were covered areshown in Figure 3 (Appendix 2, Table 4).
a)C.)a)
C
C.)
a)0~
100
80
60
40
20
0
100
80
60
40
20
0
clean belore Slime inside Coveredlillitig
oBaseIine~1
Evaiuation
0Baseline~ Evaluation
— ~j1!.
ii±i~:1~?’
- ‘~rt
.--•• • -
Clean before filling Slime inside Covered
iiI.w
Figure 3: Water Container Hygiene
There was a dramatic reduction in the presence of slime inside water containers, both in thehills and the Terai. Although the same pattern was seen everywhere, these figures hideconsiderable variation in individual projects. In the hills, changes ranged from a dramatic

8 HYGIENE PRACTICES AT NEWAH PROJECT~‘reduction from 83% with slime to none at all in one project, to a less successfulfrom 57% to 29% in another.
The increase in the number covering their water containers was also impressive, althoucthe time of evaluation ha’f of those in the Teral still left containers uncovered. Againwere big differences between projects, LI IC i IuIIII)er covelinig lb Icir containers iii dihlorenmtproject areas at the time of evaluation ranged from 0% to 100%
A large proportion indicated that they cleaned their containers before filling, andipercentage rose to close to 100% after hygiene education (Appendix 2, Table 4). In the hiclearly more people reported that they cleaned their containers when asked durinchousehold interviews. The methods used for cleaning are shown in Figure 4 (ApperTable 5). Again the changes were more marked in the hills,, the number using ash andrather than water only or mud and water, rising froml9 to 84%. The numbers using ashwater increased in the Terai as well, as did the numbers using water with straw or husi
Figure 4: Materials Used to Clean Water Containers
Hand washing practices are summarised in Table 1 (Appendix 2, Table 6). There v’~Improvement in hand washing practices in the hills, with a marked increase in the ni.washing their hands after defecation, before meals, after meals and after touchir~,Practices were already good in the Terai before the project hcIgan, hut an improvementseen in the numbers washing their hands after defecation.
OBaseflne
LI Evaluation 10.)C)I..C)0~
ci~0
0)
100
80
60
40
20
0
100
80
(3()
40
20
0
Water Mud Ash Soap Otheronly and and and
water water water
DBaselirle~Evahua~~J
Water Mud Ash Soap Otheronly and and and
water water water

HYGIENE PnAc’rlcES AT NEWAI i PR0JECr .511 ES
Table 1: Hand Washing at Critical Times
9
I-hAND WASI-IING PRACTICES HILLS TERAIBaseline_[ Evaluation Baseline [Evaluation
After defecationBefore eating (meals)After eating (meals)After touching dirt/wasteBefore cooking --
Before feeding chiild_ -
• 62 •
74866nana
9398
938987
84969792na
- na --
9498~8 - -9089
- 89
C) SanitationThe sites used for defecation are summarised in Figure 5 (Appendix 2, Table 7).
There were some problems in analysing the results of this question. The PRA informationwas gathered on a single pie chart, i.e. the answers totalled 100%. This does not take intoacCount the possibility that one person may use different sites, for example when close tohome or at work in the fields, but the answers from different projects are directly comparable.Equally the information gathered in different project areas during the household survey wasnot properly comparable because multiple answers were allowed by some interviewers butnot others, and in some cases the questioli was not asked during the household survey. Thequestions of latrine presence and use for defecation were only asked separately in thebaseline survey, arid then not by all iIiterviewers. On average, where both figures were
_~ft_,__
100
80
60 0 Baseline
40 I Evaluation_-
20
0LaIm ne Jungle Sirca,lI/ Open Anywhere
• ravine field
100
80
60e 0
40 ~Evajuation
20
0
Latrine Jungle Stream! Open Anywhereravine field
Figur~e5:Sites Used for Defecation

II
10 - HYGIENE PRACTICES AT NEWAH PROJECT SITE~
available, the same percentage reported having a latrine’ as’did using one for defecationalthough higher or lower values were reported in a few projects. When the evaluation resultwere analysed, it was assumed that if a household possessed a latrine, then this was thplace used for defecation.
The change in the placO used for defecation was rllarked. Tire riurrihers using a latrine rosPto 81% in the hills and to 36% in the Terai. In the Terai the numbers using an open fielddropped from 71% to 38%, but the numbers going ‘anywhere’ rose from 0% to 13%. pFigure 6 shows the percentage of households with a latrine and the state of cleanliness(Appendix 2, Table 10). . p
- 100~ - I80
60 FOBaseline
~ ~° Evaluation
20
Latrine Clean -
mu P1
60 [~8aseIine I ~ I~ 40 !DEvaIualion
- 2:
Latrine Clean 0Figure 6: Presence and State of Cleanliness of Latrines -
.Not only had the number of latrines increased markedly, at the time of evaluation, almost alatrines were found to be clean compared with less than h~ilfbefore hygiene education. Atthu hirii~ol Ov;IIIJ;IIiVJ) close ho Iwo Uiitch; of ttscis Iii 1)0111 ;iioas cleaned tile l:llliliO with [ ~hriishi :111(1 walei’, :rhriio~l:iIl IIIO wtrr;riinlni Il!;iluJ w;ilni otily or :i~Ii.~C;I~ Wfl~I)Iily ri;ed • ~.
One project area (Appcriçlix 2, Table 10). llie most common type of latrine constructed -.
differed in the hills and the Terai. In the hills 30% were simple pit type and 60% were paslab pits with a simple cover; in the Terai only 16% were simple pits, and 73% water se .
with single or double pits (Appendix 2, Table 10). These differences reflect differences in theterrain. Latrines were used by men, women and children equally. •The actual percentage of households that had constructed latrines at the time of evaluation -
differed markedly between projects, from 11% to 100% in the hills, and from 0% to 80% ithe Teral. it ‘is not clear to what extent this reflects differences in the impact of hygieneducation in the differer~itareas, or differences in local conditions. Prior to hygiene educationapproximately 50% of people gave ‘not necessary’ as their main reason for not building

IIYGIENE PRAC1 ICES Ar NEWAI I PROJECT 511 [5 11
latrine (Appendix 2, Table 10). At the time of evaluation only 3% in the hills and 17% in theTerai cited ‘not necessary’. The main reasons given were ‘too expensive’, ‘materials notavailable’, and various problems in particular ‘no time or manpower’ in the hills and ‘lack ofland’ in the Terai. In both areas the main reason given for building a latrine was cleanliness,closely followed by health and convenience (Appendix 2, Table 10).
Only 1% of hill users reported any problems with their latrines such as being smelly orattracting flies. 5% of Terai users had problems with the water supply, almost all of them inone project, arid 1% other problems (Appendix 2, Table 10).
The majority of those with latrines intended to continue to use one after the pit was full (Table2, and Appendix 2, Table 10). Only 2% in the hills, and none in the Terai, intended toabandon their latrine when the pit was full. The majority intended to build a new latrine, somewould dig out or clean the pit, and some had permanent latrines with a septic tank.
Table 2: Action When Latrine Pit Full
Hl~
IIPpppII
pp
Ii
ILI
.11III
LATRINES HILLS TERAI
When pit full do what?Abandon latrine 2 0
Dig out (and use as compost) 14 13Build another somewhere else 68 60
Cover pit and plant tree sapling -, - 16 -- 2Other 5 — 34
(Those who intended to coverthe pit and plant a tree,presumably also intended tobuild a new hatnine, hut only afew interviewers allowedmultiple answers to be given.‘Other’ included ‘reuse thelatrine after cleaning’ (twin-pitlatrines) and ‘permanentlatrine’.)
CC)C)I-Ii)0.
Ca)0
a)ci-
[0 BaselinelEvaluation
100
80
60
40
20
0
100
80
60
40
20
0
Latrine Cover Call Throw Nothing Otherwith animalmud
farawayaP
I I 0 Baseline~ Evaluation;
Latrine Cover Callwith animal
Throw Nothing Otherfar
mud away
Figure 7: Methods of Disposing of Children’s Stool

12 I Iv(.JI’FlI; I~IIAC I IC[5 Al I JLV/AI I l’IiOJEC I SI I ES
The methods used to dispose of children’s stool also improved, although not quite asdramatically as latrine use (Figure 7 arid Appendix 2, Table 8). The nunther disposing ofchildren’s stool iii a latrine rose from almost-none to nearly 60% in the hills and 30% in theTerai. Most of the remainder threw the stool as far away as possible. However, at the time ofevaluation as many’ as a quarter of those with latrines did not use them to dispose ofchildren’s stool.
The percentage washing their hands after defecation is shown in Table 1 and the materialsused for hand washiiiig are shown in Figure 8 (Appendix 2, Table 9). There was a big changein hand washing practices. Not only did the actu’aI percentage washing their hands afterdefecation increase, the number using ash and water or soap and water, instead of wateronly or mud anid water, rose to 91% in the hills (from 17%) and 88% in the Terai (from 14%).
FOOD HYGIENE I-fl LLS I TERAIBasehine[ Evaluation Baseline [Evaluation
Cover leftover food
Constructed dIsh rack
50
na
92
84
69
na
88
“ 51
70
6050
4-.
Cci 41)C)~ 30
20100
7060
— 50Cci 40U~i; 30
2010
0
o Baseline
I Evaluation
Water Mud & Ash & Soap Otheronly water water &
waler
ppppppUIIiiiUIUImlMi*1IiIiaa
(~Baseline
-~Evaluation-
rWater Mud & Ash & Soap Otheronly water water &
water
Figure 6: Materials Used to Wash Hands After Defecation
0) Food HygieneThe proportion who covered leftover food is shown in Table 3, together with the percentage
who had constructed a dish rack at the time of evaluation (Appendix 2, Table 11).Table 3: Food Hygiene
r’

III
HYGIENE PRACTICES AT NEWAH PROJECT SITES 1 3
In the hills thiete was a marked increase to nearly 100% in the number of people whocovered food, with a lesser increase in the Terai. Overall the great majority of households inthe hills, but only half of those in the Terai, had constructed a dish rack. There were bigdifferences between project areas, the numbers in the hills in different project areas who hadconstructed a dish rack ranged from 43% to 100%, and those in the Terai from 9% to 92%.
Hand washing practices are shown in Tablel. At the time of evaluation, nearly all people inboth areas washed their hands before and after eating, an improvement on previouspractices in the hills. Close to 90% also washed their hands before cooking and beforefeeding children (Appendix 2, Table 6).
E) EnvironmentFigure 9 shows the sites used for refuse disposal (Appendix 2, Tablemarked improvement in behaviour, with the numbers throwing theirdropping from 74% to 5% in the hills, and from 69% tol7% in the Terai
Figure 10 shows the number of households with kitchen gardens, and the numbers withseparate sheds or pens for cattle and other livestock (Appendix 2, Table 13). There was abig increase in the per-centage of households with kitchen gardens. TI ie eltect was marked,but the figures may have been influenced sligfitly by different wording in the baseline andevaluation surveys. There was a marked variation in different project areas. Changes from0% to 100% before and after project implementation were recorded in some hill areas, andfrom 3% to 95 % in one Terai area, but in other areas less than 40% had a kitchen garden atthe time of evaluation (arid only 3% in one exceptional area in the hills).
II
I
IiIIIIIII
12). There was arefuse ‘anywhere’
80
60
~
0
80
60
Ca)~ 40a)ci-
20
0
Anywhere One place Garbage pit
DOa~r~Iine
• Evaluation
0 Baseline~ Evaluation
I
I
Anywhere One place Garbage pit
I
Figure 9: Refuse Disposal Sites
ii

Ii
UpppIpp
pp
-~:
1 ‘1 I lYr.I[II[ I’IIA(:II(;rS Al IJ[VJAI I lJIO.JIT(;f ClIES
0 Baseline -• EvaluatiOn
Kitchen Cattle shed Livestock pengarden
100
8060
40
20
0
100
80
60
40
20
0
Figure 10: Presence of Kitchen Gardens and Sheds or Pens for Livestock
Ca)0
a)
TERAI
hUll ..U..
U --
•U.
U..• - -
•
E ~:_____
,--
U...•.h..
U..
Ill..r.
I...
~.
—‘-__• -•- - —
hlUulUU.a
l.u.Ur__l.iU.Ul.U•
I UI
~-
Kitchengarden
0 Baseline~EvaIuation
Cattle shed Livestock pen
There was a small increase in the nlrrnherr. with separate sheds or pens for cattle anrJ otherlivestock in I Jill areas, arid a big increase II tI IC Ilurrlbers witl a separate pen ton livestock inthe Terai. These figures are likely to be an underestimate as they refer to all households, notjust those with animals.
F) Knowledge about Diarrhoea and RehydrationThe number of people who had died from diarrhoea dropped dramatically from a total of 58 inthe year prior to the baseline survey to zero in the year prior to the evaluation survey (Table4, and Appendix 2, Table 14). There was a big difference between project areas in theoriginal situation, the deaths prior to project implementation all occurred within 5 areas in thehills and 3 areas in the Terai.
Table 4: Number Dying of Diarrhoea in the Previous Year
DEATHS FROM DIARRHOEA HILLS TERAIBaseline Evaluation Baseline Evaluation
Age 0-15Adult
OldTotal
2651
32
0000
1601026
0000

1*•
Propl~’sl~i1t:1’plHH1 ~f tIu~ ::llI~s nf hi:IIIlnn?:I :il’~r :II:Illqc,d rrl:Irkodry ([iqiiro I I :irvJAppendix 2, I utile P5). Ihie values Irolu dihlelelli projects were not exactly comparable assome interviewers allowed more than one answer to the question; even so the trend is clear.The proportion who recognised that contaminated hands are an important factor roseconsiderably in both the hills and the Terai, as did to a lesser extent the numbers recognisingthe role of contaminated water and food.
HILLS
L1~1i----i.-__
The methods used to treat diarrhoea also improved (Figure 12 and Appendix 2, Table 16). Atthe time of evaluation nearly three quarters of all households used Jeevan Jal (the brandname for oral rehydration solution, ORS), and the same percentage could prepare ORSaccurately (Appendix 2, Table 16).’ Most other households said they would ‘visit a healthpost’. There was considerable variation between project areas, however. In one Terai project,for example, only 20% of households knew how to prepare ORS accurately and in the samearea only 30% intended to use Jeevan Jal for treatment, 50% preferring to visit a health postand 20% opting for domestic or herbal medicine.
HYGIENE POACTICES AT NEWAIl PROJECT SITES 15IIp
~pj
Cci)C)I-C)0~
Ca)C)I..a)a-
O BaselineI Evaluation
100
80
60
40
20
or— , ‘ - - -Contam- Contam- Contam- Traditional Other
mated mated mated beliefswater food hands
100
80
60
40
20
0Contam- Contarn- Contam- Traditional Other
mated mated mated beliefswater food hands
Figure 11: Perceived Causes of Diarrhoea
0I
16 _~E~pRAcTIcE~1EV~A94PRoJECT~~~
80 ______ -----~--~-~-
HILLS60 -
— LII0)~ ‘tO lEvaluation
2: JI~i 1t - -
ORS Domestic Health ‘ Traditional Othermedicine, post, etc. healer
herbs
80
(30
40 0BaselIne
DEvaluation20
0 -ORS Domestic Health Tradihional Other
medicine, post, etc. healerherbs
Figure 12: Treatment of Diarrhoea
DI USSIOMethodsBefore discussing the significance of the findings, it is important to consider the validity of themethods used to obtain the information. Both PRA and household survey methods haadvantages and disadvantages. All methods of gathering information must contend withproblem that people are desirous of giving the ‘right’ answer, one that will make them appearin a good light. Both mass meetings and household interviews can lead to ‘false positianswers (peer pressure to conform during PRA, and unwillingness to admit to bad practicface-to-face with an interviewer), and both situations can also encourage greater ‘truth’(pressure from others who know what a person really does; being able to admit to somethirin the privacy of one’s own home which would not be said in public). LPRA is widely used to obtain a picture of social conditions and collect information relatedsocial factors in rural communities. One of the problems with PRA is that the skill of Ifacilitators has a considerable impact on the validity of the findings. The NEWAH staresponsible for the PRA in this study were provided with intense and ongoing training ~gfacilitating, and the PRA framework was clearly defined with a specific focUs on chos _____aspects of hygiene attitudes, knowledge and pr~chiccs, wI Jir;h should have reduced li~~pioblciiis associated with using different lacilitators. Even so, it is unlikely that all facilitato~.Lbrought the same skill to the task and the results in different projects could have berinfluenced by differences in the capabilities of facilitators. To a lesser extent the sar~~~’~applies to-household surveys. The ability of interviewees to urJdorS~andquestions, and theirwillingness to provide ‘true’ answers, is clearly influenced by the approach of the interviewe

HYGIENE PIIAC1 ICES Al NEWAIl r’RoJECT SUES 17
Again results in different projects may have been influenced by di(fercn~eSin the approachused by interviewers, and results in baseline and evaluation surveys by the InclusIon ofhealth motivators as interviewers for the latter.
As far as hhe overall assessment of the impact of the hygiene education programme wasconcerned, the results obtained by tlìe two methods, PRA and household intervIews, whenboth were used to ask the same questions were very similar. The basic trends rn hygieneattitudes, knowledge and practices were shown clearly by both. The differences between theresults obtained by the two ITletliods wore more marked in individual projects, hut cancelledcacti other out when averaged overall.
There were a nuniber of deficiencies in the data that made it unsuitable for detailed statisticalanalysis. These included the changes in the number of households before and after projectcompletion, the failure to ask all questions by the same methods in all projects, occasionalinconsistency by interviewers in allowing or not allowing multiple answers to certainquestions, occasional problems in the interpretation of questions, and differences in thewording of questions in the baseline and evaluation surveys. Notwithstanding theseproblems, the data was sufficiently consistent to. show major changes clearly, and was thusappropriate for its purpose.
Indicators of Change .11The results indicate that there was a marked improvement in hygiene attitudes, knowledgeand practices in the NEWAH project areas following project implementation. Changes wereobserved in all types of hygiene practice, not only those related directly to the use andstorage of clean water. The indicators related to both ‘known practices’, practices actuallyobserved by an interviewer, and ‘stated practices’, what people said they did.
A) Water SouicesAt the time of evaluation, nearly everyone was collecting drinking water from a protectedsource (Fig. 1). The great majority took less than 15 minutes for a round trip to collect water,and the water supply was sufficient, so there was no reason for people to he especiallycareful in the use of water (Fig. 2).
B) Water UsesWater container hygiene improved dramatically (Fig 3). This was clearly a genuine change,the indicators observed by the interviewers had improved markedly, not just the reportedpractices. Before project implementation, the great majority reported cleaning theircontainers betot-e filling with water, but around half of the containers observed had a layer ofslime or algae inside which could be felt with the fingers. At the time of the evaluation survey,very few containers had slime inside, and the majority of containers were covered as well.The improvement in cleanliness was probably partly because people started using ash andwater, or huisks or straw and water to wash their container r. (Fiq. ‘1). TI rose nrretl 10(15 demnannrithìat the inside is really rubbed, niot.just tirised, arid ash is relatively sterile and straw/husksrelatively clean in comparison with mud. (Mud is only recommended as a cleaning agentwhen ash, straw or husks are not available, and then very thorough rinsing is necessary.)Clearly many people were not as convinced about the iniportance of covering their watercontainers, particularly in the Terai (Fig. 3), and it may be that the education related to thispoint needs to be improved.
1~L ~ There was a clear iniiprovenienit iii the percenltage wi ro reported washing their hands atcritical times, particularly in the hills where practices prior to hygiene education were worse______ than in the Terai. (Table 1). At the time of evaluation, almost 90% of people in both areas
reported washing their hands at all ‘critical times’. VVnsb urirj before eating arid hefore FeorIirJqclrildl CI) IS palhiclrlulhy ilriportarrt as rnioSt pCOpIO in Nepal eat directly with their hands. Just asimportant was the change in the materials reportedly used for hand washing after defecation

p18 I IYCJI~lJIi$‘J1AC I I(;EG AF I JEV~AiI I’IroJE(;i SI I E -
(Fig. 8), from water only or mud and water, to ash and water or soap and water. The hanwashing practices were reported rather than observed, but the changes in response certainlshowed that at the least people’s awareness of the importance of hand washing ani~knowledge of tile best materials to use irad unproved. I-however, there is no way of assessinohow thoroughly people actually washed their hands, how hygienically they dni~dthem, owhether they did in lact washr thlennl US olteni as reported.
C) Sanitation pPractices related to sanitation iIflpIOvCd greally. TIre big increase in the nurriber of latrines, -
and in their state of cleanliness, meant that most,people in the hills and many in the Terai nolonger had to defecate in open places (Figs. 5 arid 6). The change in the sites reportedlused for defecation is a rather unreliable indicator of changes in real practice, but must aleast reflect a change in people’s perception of what is an acceptable place for defecation --
(Fig. 5). The changes in the numbers and cleanliness of latrines were changes actuallobserved by the interviewers (Fig. 6). Clearly, after hygiene education the great majority opeople were convinced of the benefits of having a latrine (compared with only half of thoseinterviewed before), and many had taken advantage of the support provided by the projectbuild a latninie. Those with a latrine had also learnt how to clean it properly. However aroun50% of those in the Terai, and 14% of those in the hills, who had recognised the need for alatrine hind not built 0110 eiU icr because it was leo expenSive, lb icy I ad rio rri;Jrr[riwcr or tl~’had rio land (Appendix 2, Table 10). Clearly ii there is to be any marked improvement in thfuture, a way roust be found to help poor and landless people to gain access to adequatesanitation facilities. -
The methods reportedly used to dispose of children’s stool were better after hygieneeducation, although the change was less satisfactory than for other indicators (Fig. 7)Although these results refer to reported rather than observed practices, interviewers ~‘,erable to determine whether there were any children’s faeces visible near the house, anphrase their questions appropriately. After hygiene education very few people relied onanimals to dispose of children’s stool, atid more people had latrines and thus were abledispose of childleri’s stool in this way. Even so a large number of people, including many witlatrines, simply threw the stool as far away as possible. This may be a point where hygieneeducation could be improved.
0) Food HygieneFood hygiene practices also improved (Table 3). However, although the majority of peoplcovered leftover food there were still as many as 30% in some project areas who did not. Imay be that sonic of these never had leftover food, although those who said so specificallywere not included in the assessment. There were big differences between different projecareas in the number who were observed to have constructed a dish rack at the time oevaluation, with a much lower proportion overall in the Terai than in the hills. The reasons forthis are riot clear, but it may reflect the lack of availability of suitable construction materialsas well as differences in the effectiveness of hygiene education.
E) EnvironmentPractices related to the environment also changed markedly for the better (Figs 9 and 10)The great majority of people said that they had stopped throwing their rubbish just anywhereand started using a ‘single place’, although this was still more likely to be an unprepared sitthan an actual garbage pit. Only one third reported using an actual garbage pit so that theris considerable room for iniprovemerIt. No questions were asked about the treatment ofgarbage after disposal (burning, digging in).
Kitchen qnrchelis were pIOlnJOte(l as fliI effeclive a: 1(1 oriviroi nriç~rtally fi icririly v/a’, ofdisposing ol waste watcl, UI Iii LIE the SUIIIO limb mnnI~JroviIIgnutrition arId providing a possiblc’source of income. A large number of people were observed to have started a kitchen garden.
•1
I
-i

HYGIENE PRACTICES AT NEWA! I pnOiEcr SlIPS 1’)ii
but there was a big variation between project areas. Again the reasons are unclear. Thosewho had no garden may have been limited by lack of any or suitable land, lack of access toseedlings, insufficient expertise, or lack of manpower. Equally, the education on this topicmiiay not always have been sufficiently convincing.
F~Knowledge about Diarrhoea and Rehydra(ion .
One of the major indicators of the positive impact of the project on the lives of beneflcrarreSwas the reduction in the reported number of deaths from diarrhoea from fifty-eight rn the yearpreceding the baseline survey to zero in the year preceding the evaluation survey (Table 4).This is likely to indicate a reduction in total incidence, or at least in severIty, of dmarrhoeacases as well, although this information was not collected. Clearly access to clean water willhave played a major role in the change. But improved knowledge of the causes of diarrhoea,the resultant improvements in hygiene practice, in particular the use of latrines, and theincreased knowledge of treatment using ORS are also likely to have been major contributingfactors (Figs. 11 arid 12). Following hygiene education there was a dramatic improvement inthe overall proportion of peophe observed to prepare ORS accurately, from around 10% tomore tI-ian 70%, and a similar increase in the numbers intending to use ORS to treatdiarrhoea. There was considerable variation between project areas, however, and this maybe one point where hygiene education requires strengthening.
GeneralTaken overall the results are very encouraging. Clearly the hygiene education programmehad a major impact on people’s knowledge about and attitudes towards a whole range ofhygiene practices. Changes were observed in ‘known practices’, practices actually observedby an interviewer, as well as in ‘stated practices’, indicating that at least some of theobserved effects were real. Access to clean water will have played a major role, withoutsufficient water it is not possible to have a clean latrine or wash your hands properly, hutwater itself was only one aspect of the improvement. The majority of people had understoodthe need for and knew how to store water hygienically: they had realised the importance ofcleaning their hands, of isolating faeces from the environment, of protecting leftover foodflolli contalnimiation, anid of disposing of refuse in 0110 place; arid they unrderstoori rrmuch microabout the causes of diarrhoea, how to prevent its transmission and how to treat it. Thereduction in deaths from diarrhoea is an indication of the major impact the projects had onpeople’s lives.
It appears that the approach to hygiene education used by NEWAH is successful, and thatthe desired messages are reaching those they are aimed at. There is still room forimprovement, hiowever, and in some areas the approach may need to be modified. Theimpact in some individual project areas appeared to be less marked than in others. A studyof these, and the reasons for the differences, might help in identifying ways of improving theprogramme. One area which might need to be strengthened is that of the policy towards localhealth motivators. At present, the lopal health motivators are recruited from the project areafor the chlrIahiol 1 oF project imnipleniicr r(atioii (on ic year). L)urir my ti mis tune they receive trairmir myarid then iniplomenit the hygiene educationi programme. The advantage of this approach isthat those carrying out hygiene education are recruited directly from the local community,and are presumably more aware of the specific features of the community and are more‘acceptable’ as educators than someone from outside. The disadvantage is that their skillsare lost to the programme at the end of the year, and~theyare unable to use the experiencethey gain to improve their implememitation of the education programme. Instead of building upa pool of skilled educators, NEWAH allocates considerable resources to training a new groupof people every year. This may be one reason for the variability in the impact of theprogramme in different project areas.
Overall the effects in the Terai areas were not as marked as those in the hills. There arevarious possible explanations. One is that there were a larger number of landless people in
01

20}iYrurIiE PRACTICES AT IIEVIAII PROJECT
the Tcrai. Such people are less able to carry out certain improvements like building a latrinr’ -amid may have a less clear feeling overall of being in control of their own lives, and th!responsible for and able to change their conditions. Equally the Terai projects were muclarger, and this may have affected the ‘intimacy’ of the hygiene education programme and le~to a greater feehimig of being talked to by outsiders. It is possible that the approach to hY~ien~Jeducation needs to be changed slightly for projects in the Terai.
One miiajor hiniilatiomi of the study is that it omily refers to changes in hygiene attitude.knowledge and practices observed inmmmtiediately alter project conripletion, when trygioneducation was still fresh in people’s minds. It i~also important to know the long-term effecton people’s lives, whether there is a gradual return to former behaviour, or a continueimprovement as the benefits become clearer and others convinced of the neon for change. Ithe future, NEWAI-h would like to evaluate hygiene practices after a further four years ormore, and thus assess long-term improvements resulting from hygiene education. The firpilot studies are in progress.
CONCLUSIONS AND RECOMMENDATIONSIn conclusion, the hygiene education programme appears to have been very successful, an~~hind a major impact oni people’s behaviour, at least mi the short-term. Marked improvemenwere observed in all types of hygiene attitudes, knowledge and practices, from water stomato sanitatiomi. Changes were observed in both ‘known practices’ (those actually observed by Ian outside observer) amid ‘stated practices’ (those reported by the interviewees, some _____which miiay reflect changes in attitude rathìer than actual changes in behaviour). Neverthele~there is still room for improvement. The impact in the Terai was consistently poorer than inthe hills, and the impact in sonic project areas was not satisfactory. By studying tt~ —
differences between areas where educatiorm was nnore or less successful, it should L~possible to identify possible improvements to the hygiene education programme. A change inthe policy related to the recruitment of local health niotivators should be considered.
Where they could be compared, tue overall results obtained by PRA and household surveytechniques were very similar. Since NEWAH is interested in identifying major changes -~
hygiene attitudes, knowledge and practices, not small differences, it should be sufficientfuture to obtain most information by PRA alone, at least for the purpose of assessing the roverall impact of the programme. The household survey is very labour intensive and tirr~’--consuming, and should be limited to questions where the interviewer really needs to observ’,,~or very accurate information is required. Before a final decision is taken, the differences in Fthe information obtained for individual projects should be studied, and the need to assess thimpact of the programme in individual areas taken into account. Both the framework for PRand the household survey need to be reviewed to ensure that the most appropriateinformation is being collected, that the information collected is necessary, and that thereconsistency between the baseline and evaluation surveys. (A partial revision has alreataken place.) Finally, interviewers and meeting facilitators need to be given rriore detaileguidelines on question interpretation, the number of answers allowed to particular questionarid interpretation of answers provided under the category ‘other’. This viill improvecomparability of the results obtained in different project areas.
I
I

HYGIENE PRACTICES AT NEWAH PROJECT SITES
APPENDIX 1: List of ProjectsPROJECTS IN HILL DISTRICTS
23
LiSTNO.
PROJECTNO.
VFLLAGE NAME•
EVALUATIONTotal HHsin Total Total HHs in TotalHHs Survey Benefi- HHs Survey Benefi-
ciaries ciaries
I
I
rn~UI1
U
ii
p
245789101112131415161718192021
222324
25
2627282930313233343536373839
1450145114541456t’1581459146114621463146514661467146814691470147114721474 -
1475
147714781479
1’182
14841485148614871490149114931494149514961497149814991550
MULPANIANTITARBAUSEBHANGO13 ID h-lANGCHAPTARCHILAUNEBASDANDAGAUNDANDAKHOLIDHANBANGDHUSHADUMLYATIGARAPANIGAURIKATUNJEKUSHADEVILEKHPHARSAMANDRAMATHILLOJALPAOKHALDHUNGAPALLOTARIPATGAUNBESHIR~AKHADANGDELRATAMATARATMATESATUKASEMJONdSHRIPURSIMPANISOLMA - -
TABAITALLO JALPATAPLUNGTASARPUTEKANPURTHAKRETh-IULITAR
AVERAGE
81678268262121478404433126601054260
30030
157
195861
83
485371
2557060119541001361031122788792
40343634121154‘102544173260262330751343
162529
‘12
24273463353030252534262869‘1434
433371 -
484475138128
13205082402472217012715852643361638188989
130289475
432
na3614621484335417739288580746529822167665 I554
8162758824221687538383475541053959
31528164
155855
65
525469
246633610543
7013410011123713185
40283744121130371919173727262029782845
152529
-,.,
252735623116272135332528604031
433397475517134128
1095531252218216474294620227352na
191998
104267447
342
29236343013943221896652203107435298301488
474
*HHS = Households, na = not asked

24
PROJECTS IN TERAI DISTRICTS
IIYCIENF PRACTICES AT ~IFV1AiIPROJECT SITES
INN
N
ii
I
I
I
J~TPROJECTNO. NO.
\~LLAGENAME - BASELINE EVALUKflON .
Total HHs in Total Total HHs in TotalHHs* Survey Benefi- HHs Survey Benefi-
cianies ciarie12
14521455
ASHANPURBELAWA
730629
185140
41593940
640359
16089
34872416
5 1473 MAGARAGADI 763 • 191 5445 590 147 43937 1480 PIPRA
POKHARIYA642 165 3325 641 162 3277
8 1481 PRATAPUR 426 64 3155 360 81 22859 1483 RATAULI 577 145 2968 578 144 311510 14013 Sh-IANTIPUR 859 215 4384 581 145 na1112
1 ‘1R~)1492
Sh-IIVAPURSITAPURAVERAGE
I 34711608
32179146
122338803609
128543491
39134122
1 208~301J2899
*HHS = Households, na = not asked
I

$1- HYGIENE PRACTICES AT NEWAH PROJECT SI ~E5 25
• APPENDIX 2: Tables of Values .. -
HHS = Household Survey; PRA= Participatory rural appraisal; na = not askedAll figures are percentages of total households except where otherwise stated. The figuresare simple averages of the results obtained in the 39 hill projects and 9 Terai projects[ (Appendix 1). The coriiplete data set can be obtained from NEWAH on request.
A) WATER SOURCESTable 1: Collection Points for Drinking Water
WATER COLLECTION POINT.
HILLSBaseline Evaluation
TERAIBaseline Evaluation
FAA HHS PRA HHS PRA HHS PRA_I HHSTapstandTubewell/deep tw/hand dug well1WeII/kuwa2River/stream/canalOther3
02651914
02
641816
980101
980101
0445420
0455130
097301
096401
PROJECT WATER SUPPLY I-HLLS TERAI
Using project water supply? 93 93If not , why not?
Traditional source more 75 0convenientPoor taste 0 21
Water unhealthy 0 • 0Conditions at water point 0 0
u misamiitaryupplyun ehiable . ?5 20
Other* 0 59
Water supply sufficient?Yes, hot season 94 80
Yes, cold season 94 80Yes, all year 94 81
Other includes: too far, private tw, not completed
1Project hand dug well, partially protected; 2Simple unprotected well; 3Other includes:wooden tap, temporary pipe (I-mills baseline), private, tcrrmporary pipe (bmill oval.), private (TeraievaI.)
Table 2: Usinq Project Waler Supply & IF Not Why Not?(Evaluation HHS only)
I:~~iI
L~1IIml
II
L[
LLI
I
I

26
Table 3: Round trip water collection times
UI
rlS nhiiiutes15-30 minutes~30minutes
line Evaluation IPRA2133.46
Baseline
203241
(3514
87112
PRA711811
I-I HS712010
PRA97
12

I
1I
I IYGIENE PPAG I ICES A F NEWAI PI~OJEC1SI I ES
I
27
B) WATER USES
Table 4: Water Container Hygiene(HHS/PRA not directly comparable as in many projects question clean?’ na in HHS)
HULSCONTAINERHYGIENE Baseline Evaluation
Do you clean before filUng, yes 69 78 95 98
TERP~Baseline
PRALHHS89 89
Evalua~onPRA HHS99 100
Slime/algae inside container~__ na 59 na 8 na 47 na 4Container covered* na 15 na 80 na 15 na 52
*Illterviewer observation.
Table 5: Materials used to clean water container(PRNHHS not directly comparable, in HHS this question na in many projects and in someprojects multiple answers allowed)
CLEANING MATERIALSHillS I TERAI
Baseline EvaluationFAA HHS
Baseline EvaluationPRA HHS FAA HHS PRA l~HHS
Water only 46 42 6 8 54 59 9 17Mud and water 22 25 1 2 21 16 5 7Ash and water 19 28 84 81 13 9 52 64Soap and water (and steel wool) na na 0 1 na na 0 0OtlIcr* 1 5 10 8 13 16 35 12
I I I
*Other includes husks, leaves, or straw and water, and ‘anything’
Table 6: Hand Washing at Critical Times(PRNHI-lS not directly comparable: in I-Il-IS question na iii sonic projects, multiple answersonly aflowed in some
~
projecls. In PI1A sCI)IFIIe r)ie (:II;IIt~(X)IIII)ile(I mr (~lC}I IfI~W(~r.)
HAND WASHING PRACTICESHILLS TERAI
Baseline Evaluation Baseline EvaluationPRA HHS FAA HHS PRA ¶HHS FAA HHS~
After defecation ‘ 62 66 93 90 84 76 94 84Before eating (mea !s) 7~4 78 98 96 96 89 98 78After eating (meals) . 86 80 99 93 97 88 98 64After touching dirt/waste 62 58 93 66 92 82 90 64Before cooking -~ na na 89 87 na na 89 72Before feeding child na na 87 73 na na 89 52
I
3 of 9 Terai projects not asked this question in evaluation survey

28 FIYGIEFIE PIIAC1ICES AT IIEWAII PROJECT SITES
C) SANITATION
Table 7: Sites Used for Defecation(PRAIHHS not directly comparable: question na in some projects.) For evaluation, figures forlatrine use taken to be percentage with latrine in house.
IDEFECATION SITES
HILLSBaseUrre Evaluation
PRA HHS PRA [HHS
TERAIBaseline
PRA HHS PRA {HHSLatrine -
Jungle -
Stream/ravineOpen field (& vegetable garden)Anywhere
1030251816
18’2836146
817353
817445
41015710 •
41016700
36593813
3
6•
•
‘~
Table 8: Means of Disposah of Children’s Stool (HHS only)I
(Only households with children)
CHILDREN’S STOOL DISPOSAL HILLS TERAI~o Evaluation Baso line I Evalijation
LatrineCover with mud
26
597
10
304
Call animal 20 3 13 0Throw tar awayNothingOther
571
13
26
- 05
8600
•
56013
*Otller includes: in manure pit, throw anywhere/field (hilt baseline); in manure pit, river (hillevaluation); bush, field, manure pit (Terai evaluation)
IIII
Table 9: Materials Used to Wash Hands After Defecation
—.
HAND WASHING MATERIALS Baseline EvaluatmoriBaseline EvaluationFAA [HHS PRA HHS PRA ~ HHS PRA ‘~
Water onlyMud and waterAsh and waterSoapandwaterOtller*
39427
101
::.
34449135
• 52
6427
1
526428
1
2957950
2958951
9 I11 1665132 2i
~Otherincludes leaves or husks and water
I
I
a I

(HHS only)
Latrine in houseLatrine clean1
Clean with- Ashes
WateronlyBrush and waterSoapandwater
Other2Type of latrine
Simple pit with coverPan slab with pit cover
~ Water seat single pitWater seal double pit
0th er-sReasons for building4
ConvenienceCleanliness
HealthPressure from others
- Other5Reasons for not building6
Not neededToo expensive
Knowledge inadequateMaterials not available
0th ~or /
Problems with latrine4Flies
SmellyPit full of water (rainy season)
Inconvenient for childrenOther
When pit full do what? -
Abandon latrineDig out (arid use as compost)
Build another somewhere elseCover pit and plant tree sapling8
Other8
22256622
566954~1
17
11000
15275800
167
38350
3046323
20
173824
39
005
0
013602
34
1-tYGIENE PRACTICES AT NEWAI-I PROJECT SITES
Thbje 10: Latrines: Presence, Cleanliness and Reasons for Not Building or Building
29
LATRINES FULLSBaseline Evalua lion
TER/~JBaseline Evahialion
1930
8196
3691
Ill
LI
I;I
IIIIII
3060307
443
5633
147
U
N
N
N
NU
47
261115
3180
2455
LiiiatiOfl
!LI*1it
21468165
1lnterviewer observation. 2Other includes don’t know, still building. 3Other mostly latrinesbuilt by other projects. 4Only households with latrine. 5Other includes for privacy (shame),prestige, ease (!iills); arid to prevent disease and for privacy (Terai). 6Only householdswithout latrine. “Other includes no land, no tradition, no manpower/time, no water (hillsbasel.); no manpower/time, no money (hills eval.); ho land (Terai basel.); no land, nomanpower (Terai eval.). 8Sorne, arid probably all, intenried to build a latrine too, only a fewii item viewers allowed rr II iltiple 31 I~wers‘011 ICr U ncludus perrrlanlor ml, i.e. scr)Iic tank (b mills arrdTerai), clean pit and reuse (twin pit latrines in the Terai).

HYGmEImE PPACTmCES AT NEWAH PROJECT SmTES~
IiTERAI L.
Baseline [Evaluation69
na
88
51
Table 12: Refuse disposal sites(PRNHHS not directly comparable: PRA na in some projects.)
REFUSE DISPOSAL SITES- - -
HILLS I TERAIBaseline Evaluation Baseline Evalua
PRA tIllS PRA IIHS rRA [ HHS PRAIHAmiywliereAt one placelii a garbage pit
66 7’l26 23Q. 3
85637
56035
76168
69292
1243 945
I
mimal sheds/oens (HHS onIv’
*perCenitage of all households, includes those withi no animals; interviewer observation
I
i-I
30
D) FOOD HYGIENEFor hand washing practices see lable (3 above
Table 11: Leftover food covered, dish rack constructed? (HHS only)
FOOD HYGIENE I hILLSBaseline I Evaluation
Cover k~Itoverfood* 50 92
Constructed dish rack* na 84
* Interviewer observation
-. E) ENVIRONMENT
Table 13: Kitchen oarden and ar
I
KITCHEN GARDEN— H~i~
AlBaseline {EvaluationANIMAL SHEDS/PENS Baseline Evaluation
~chepg~__~
Have shed/pen 1or~ .
cattlegoats, chickens, ducks, etc.
76- 40
—n------8950
~~__~i- - -
7027
71
8766
I
I

N
HYGIENE PRACTICES AT NEWAH PROJECT SITES 31
F) KNOWLEDGE ABOUT AND TREATMENT OF DIARRHOEA
Table 14: Number Dyinc~of Diarrhoea in tho Lost Ye r(HHSogjyphsolI~iQ0~fflher~.I(Triangulation ttrrough seasonal calendar, figures rmot shown)
DEATHS FROM DIARRHOEA HILLS TERAIBaseline [Evalualion Baseline [Evaluation
Age - 0-15- adull
265
00
160
00
old 1 0 10 0Total 32 - -- 0 26 0
Table 15: Perceived Causes of Diarrhoea (HHS only)
OIlier imictudes: don’t know, undigested food, ~lnot& cold’
TERAIBaseline ~Evaluation
7 5032 693 5912 546 10
Table 16: Methods Used to Treat Diarrhoea, and Preparation o ORS
(PFIA/I IllS riot directly conirparziblc: nrnuhliplu aIISwCrS Sorimetitnios allowed in lIHS rn some
I projects.)
DIARRHOEA TREATMENTHILLS TERAI
Baseline Evaluation Baseline EvaluationFAA [ HHS PRAJ HHS FAA HHS PRA [ HHS
ORS(JeevanJal)Domestic medicines or herbsHealth post, etc.Traditional healerOther* ,
ORS preparation correct” --
1925
2123
757
8071322
78
30125071
29135451
16
7352100
725
2313
71
30225
31203
9 -
1431
*OtFier includes: do nothing, rice starch with salt, eat certain foods
I “lmiterviewcr observation -
NII
V
ast
.11
pU
I’
N
CAUSES OF DIARRHOEA HILLSBaseline I Evaluation
Conitarininated waterContaminated foodContaminated handsTraditional beliefs01her*
22419
2628
658364216
I
II
N
‘I

32 lIYGIEIE PRACTICES AT m 1EV/All PROJECT SITESp
ppppppppppppI
ppU
I
I

p.HYGIENE
PRACTICES AT NEWAH PROJECT SITES 33
APPENDIX 3: Questionnaires . --
Appendix 3a: Baseline Survey QuestionnaireGuidelines for the use of this format:
1. This hoimmiat is a guideline to collect irmlorimialiomi on tIme basis of PRA/RRA.2. For the evaluation, the information has to be obtained by interviewing and observing 25%
households if the total beneficiary households are 100 or more, 50% households if the totalbeneficiary households are less than 100 but more than 20, 100% households if the totalbeneficiary households are 20 or less. Households are selected on the basis of simple randomsampling. (Note: in practice clustered sampling used. ed.):
3. In oidnr to qen nccnrrate irilomniatiorm. divide lIne lmiiefii;iarin~into dilfomnril qroiip~(Le. , rrnnte/her male grotIl), p1 ivilogod gm oups, etc.) as rreccmsary amid gall or irmformnatiorr by interviewing themindividually or in a group, and also by observation and triangulation method of PR14JRRA,
4. Observe the surroundings of selected households for triangulation (cross-checking) and fill in theinbormatiori in form 1.
5. Include all beneficiaries in a mass qathierinq/rnee(ing as far a~ipossible.6. - Collect the irmlomrnation using PRA/RRA techniques as given on the right hand side of each
question.7. The given possible amiswers are only for the guidance of immformnation collectors.8. Present the findings of the baseline survey to all beneficiaries in a mass gathering and provide a
copy of it to the community.
General Information:Name of ProjectName of Villaqe
I/Varcj fJum niborNameof Information CollectorNament lniboinmintiori PioviderDate of lmilo:mmialioim CollectionNumber of HouseholdsTotal No. of Population
MaleFerrmale
0-5 Year old children6-15 Year old Children
34
A. DISTRIBUTION OF WATER SUPPLY:
1. From where do you fetch your drinking water?
a. Spring /Kuwa -
h. lliver /StI(~nIrc. Unprotected welld. Private tubewell
2 Show lIme seasonal availability of water in a year and time tocollect the water in each month.
3. How long does it take to go to your usual water point, fetchwater and come back?
a. 0-15 minutesb. 15- 30 minutesc. 30 nmiiimntcs over
4. Do you promote kitchen gardermirmg during the dry season?a. Yesb. No.
IIYr,IFNF Pl1ACiIC,E’~AT tIFWAII PnOJFCT SITPç
B. HEALTH AND SANITATION:
1. Do you clean the inside of water storage container before fill (Individual HHit? pie chart)
a. Yes.b. No.
interview ÷
pp
2. lb yes, witlm what do you clean tine immside of your waterstorage container?
a. Water onlyb. Mind & waterc. Ash & waterd. SI:aw & wafer, etc.
(Individual HHpie chart)
interview 4~ pp
3. Is there slime/algae on the inside of the water storage (Observation)container?Yesa.
b.
5. When do you wash your hands?
a. After defecationb. Before eahing mealc. After eat irig meald. After touching dirt/waste, etc.
6. With what do you wash your hands after anal cleaning(defecation)?
a. Water onlyb. Mud & waterc. Ash & waterci. SoapA ~‘aler nlc.
omh e~
U
(Pie chart ÷individual HI-Iinterview)
(Seasonal calendar ÷counter & sticks)
(Individual HH interview ÷pie chart)
(Individual HH interview)
ppp
p
No
4. Is tIme water storage coritairmer covered or riot? (Observation)a. Yesb. No
pUI
II÷1
I
(Individual HI-I interview ~.
pie chart)
(Individual HH interviewpie chart)
I
IL

7. Is lobtovem bood/nimilk kept covered? (Observation)a. Yesb. No
8. Where do you dispose of your household garbage? (Individual HH interview ÷pie chart ÷observation)
a. Anywheneb. At one place / manure pitc. In a garbage pit
9. Do you have separate cattleshed or pen to keep your (Individual HH interview ÷domestic animals! livestock? observation)
Cattleslied pena. Yesb. No
C UTILISATION OF LATRINE:
If yes, is the latrine clean and sanitary? (Observation)YesNo
5. WImy did you build a latrine?
a. Latrine is not neededh. Too expensivec. Inadequate knowledged. Materials not available, etc.I6. If your children defecate around the house what do you do (‘Individual HH interview)
I about it?a. Dispose of stool in toilet and cldan the area with ashb. Cover with mudc. Call dog /pig/chicken to eat itd. Throw it far away and plaster the area with mud & water or
cow dung, etc.
I D. DIARRHOEA AND REHYDRATION: -
1. lii which month does diarrhoea occur commonly in your
I village?
HYGIENE PIIAC[ICES AT NEWAFI PROJECF SI m ES 35III
4.
I
1. Where do you go for debecation? (Individual HH interview ÷pie chart)
a. Jungleb. Stream /ravinec. Open fieldd. - Latrine, etc.
2. How many latrines are there in this village? (Pie chart ÷social map)
3. Do you have latrine in your house? (Individual HH interview ÷observation)
a. Yesb. No
4.a.b.I
(Individual HH interview)
(Seasonal calendar)

36 HYGIENE PnACTICES AT IIEWAH PROJECT ~
2.(i) Has anyone died oh diarrlnoea within this year?
a. Yes -
b. No
2.(ii) If yes, how many persons of which age group died?a. Old personsb. Adultsc. Children (0-15 years)
3. What you think are tIme causes oh diarrhroerm?a. Contamimiated waterb. Contaminated/ rotten foodc. Contaminated handsd. Traditional belief, etc.
4. I low do you hi eat diarrl moca?
a. Jeevan-jal /saht-sugar-water solutionb. Domestic medicines or herbsc. HentIhI post /lmospitah /cliiiicd. Traditional healers
5 How do you prepare jeevan-jal or salt-sugar-water solution? (Individual HHPlease explain & show if possible. observation)
E. LOCAL RESOURCES /OPPORTUNITIES OF HEALTH & SANITATION:
I. f~n’IIn~nt’;mrmy k~ahlie~nllbnwoikem~? (G:oni~ ifnle,vicrv)a. Trained health workersb. Homeopathic healers (Vaidhya)c. Traditional birth attendantsci. Tiaduhional healers
2. What are the locally available health services or health (Social map)agencies?
a. Health post /health centreb. Medical clinicc. Hospital, etc.
3. Are there any literate/educated local women? (Group interview)Married Unmarried
a. 8th grade or more passedb. 8th grade failed but 7th grade passed.
4. Which language do you speak mostly in this village?a. Nepalib. MaithitiC. Tamang /Gurung /Magard. Rai / Limbu
5. Am time I mouses scatlered or crowded together?a. Ciowdedb. Scattered
p(Individual HH interviewseasonal calendarcounter & sticks)
(Individual Ill-I interview)
(Individual I-Illpie chart)
(Group interview)
(Social map ÷
HYGIENE PI1ACTICES AT NEWAI I PROJECT Sn ES 37
I
1!ii
WI
p.
*
F
IF
TABLE OF OBSERVATIONName oh ObserverDate of Observation
5,No.
Subject Matter No. of HHObserved.
HH(Yes)
HH(No)
NotObserved
HH
Remarks
1 . Is there shiniie/algae on theinside of the water container?
2. Is the water storage containercovered?
3. Is leftover food/;rnilk keptcovered?
4. Do you dispose of yourhousehold garbage in oneplace?
5. Do you have separatecattheshed away brom yourhouse?
6. Do you have separate pen forgoats, chicken and ducks, etc.away from the house?
7. Have you built a latrine?
8. If yes, is it clean & sanitary?
9. Is there childreni’s excretaaround the house?
10. Is jeevan-jal/saht-sugar-watersolution preparation methodacc in rate?
SIIUIII
III
I’!

U38 I IYGIIJ1F ‘1lA(~I ICES Am r IEWAI I i’flOJECT SI
• ppppIII
ppppaIaa
IIIr

HYGIENE PRACTICES AT NEWAH PROJECT SITES 39
Appendix 3b: Evaluation Survey Questionnaire - -
Guidelines for the use of this format:
1. This format is a guideline to collect information on IIe basis of PRA/RRA.2. Fom the evahim;mtiomi, tIme imtlormimatiomi 1cm!; to he ObtairI(~dby immlerviewinmg arid ob!’iervinlg 25%
households if tIme total beneficiary households are 100 or more, 50% households if the totalbeneficiary households are hess than 100 but more than 20, 100% households if the totalbeneficiary households are 20 or hess. Households are selected on the basis of simple randomsampling. (Note: in practice clustered sampling used. ed.)
3. In order to get accurate information, divide the beneficiaries into different groups (i.e., mate/fem-miale groups, privileged groups, etc.) as necessary and gather information by interviewing themindividually or in a group, arid also by observation and triangulation method oh PRA/RRA.
4. For the observation, fill in the forms 1 and 2 by observing the surroundings of the givenpercentage of households.
5. Include all beneficiaries in a mass gathering/meeting as tar as possible.6. Collect the imilomrnationi given on tIme right hand side of each question using PRA/RRA techniques.7. The given possible answers are only for the guidance of information collectors,8. ‘Present the findings/results of the evaluation to all beneficiaries at a mass gathering, and formally
hand over the programme.
General Information:
Name of Pnolect
Name of Village
‘~/andNumniber
Name of Information Collector
Name of Information Provider
Date of In mlormm maliorm Collection
Number of Households
Total No of Beneficiaries
11

40 HYGIENE PRACTICES AT NEWAN PROJECT SITE~11
A. DISTRIBUTION OF WA TER SUPPLY.
1. Froni where do you fetch your drinking water?a. Tapsiandb. Tubewell/DTW/HDWc. Umiprotected well/kuwad. River/stream/canal
2. Does lime supply give ernoughm water dunimng tIne hot amid coldseason?
a. Yes in hot seasonb. No in hot seasonc. Yes in cold seasond. No in cold seasone. Yes in both season
3. How frequently do water supply breakdowns occur?a. Never- • b. Dry season
c. Monthlyd. Weeklye. Others (explain)
4. For how long do breakdowns last? (Individual/group interview)a. 0-I (layb. 1-7 daysc. 7 days
5. How do you participate in the repair of tapstand/ tubewell?a. Providing money to the caretakerb. Providing grain to the caretakerc. Providing money for spare partsd. aandce. Othiem (explain) - - - -
6. Howlong did it take to go to your usual water point, fetch water (Individual/group interviand come back? & pie charm
a. 0-15 rimimimntesb. 15-30 minutesc. > 30 minutes
7. How long does it take to go to the project water point, fetchwater and come back now?
a. 0-15 minutesb. 15—30 I mint itesC. >30 minutes
8. What do you do in your spare lime?a.b.C.d.
9. Do you promote kitchen gardening in your spare lime?a. Yes
NoAm:e you usimig water from the project water supply?Ye~ -
L
(Pie chart)
(Individual! group interviev~
II(Individual! group interview)
II
II11I]‘IIII
(Individual/group interviel
I
b.10.
a.b.
(Individual! group intervie& pie chart~J
I(Individual/group interview,)
I(Individual/group intervie~
(Individual/group intervie1
No

1 IYL~IENEI’IiACI ICES Al NCWAI PIIOJEC i SI mcs 41
11 . II to, wl my ate you not using LI no water supplya. Traditiomial source is more convenient.b. Water from the supply does not taste good.c. Considers water from the supply w)I menltt my.(I. Cotiditionms at watcm l)oiItt are ummsantilary.e. TI me supply is unreliable.f. OIlier (explain)
12. I-low do you (lmimmk tlmat the water supply services should beimproved?
a. More information to and involvement of consumers.b. Improvements in maintenance.c. Other (explain)
B. HEALTH AND SANITATION:
1. Do you clean inside the water storage container before filling (Pie chart)- it?a. Yesb. No
2. If yes, with what do you clean the inside of your water storagecontainer?
a. Water only e. Straw & waterI,. Mind & walem I. I Imn!;k!; & waterc. Ash & water y. Leaves & waterd. Soap & water hi. Steelwool & soapy water
3. Is there slirmme/algae omm time inside of lIme waler slorage (Observation)container?
a. Yesb. No
4. Is the water storage container covered or not?a. Yesb. No
5. Have you constructed a dislm drying rack or not?a. Yesb. No
6. Wimeim do you w,mshm your cnn UI!;’?a. After defecationb. Before cookingc. Before eating
7. WitIi what do you wash your h~ndsafter defecation?a. Water onlyb. Mud & waterc. Ash & waterd. Soap & watere. Husks & water
0 I!; h’Ituv~’mloomi/immillc lot ,la. Yes
I b. No
9. Where do you dispose of your household garbage?a. Anywhereb. At one place/mamiure placec. 1mm a clambage pit
(Individual/group interview,)
(Individual/group interview)
I!FIIII
pI
III
11ew)
pp
ow)
ii
ar )
p
p‘w)
•1
(Pie chart)
e. After touching wastef. Before feeding childg. Other (explain)
II
(Observation)
(Observation)
(Pie chart)
(Pie chart)
Obr.eivatlon)
(Pie chart dbserva (ion ÷list

42 HYGIENE PRACTICES AT NEWAH PROJECT SITES
10. Do you have a separate catllesliod or pen? (Observation ÷belongingslist)
Cattleshed , Pena. Yesb. No
C UTILISATION OF LA mINES:
1. Have you built a latrine? (Observation + belongingslist)
a. Yesb. No
2. II yes, whmicim lype of I;mlmir me I ~mveyou got?
a. Simple pit latrine with pit coverb. Pan slab with pit cover (without water seal)c. Water seal single pitd. Water seal double pit
3. Why did you build the latrine?a. For convenienceb. For cleanlinessc. For healthd. By pressure of others
4. Is the hat rine clean amid sanitary? clmeck lollowimmy:stool not seen around the pit holeclean slabwell fitting lid water sealno fliesseparate water vessel for amial cleaning
Yes No
6. When the latrine pit becomes full alter sometime what wouldyou/do you do?
a. Abandon the latrine.b. Dig out the pit and re-use compost.c. Build another latrine somewhere elsed. Cover the pit and plant a fruit sapling.
7. Is there any problem in the utihisation of the latrine?a. Lot of flies.b. Smelly.C. Pit lull of water during rainy season.d. Inconvenient for children to use.
8. In your opinion, what are the ways to improve the latrine?a.b.C.d.
5.- -
a.b.C.d.
What do-you use to k~op~lidlLflniimä clean?AshesWater onlyBrush/broorii amid waterSoap/delergerit arid waler
(Observation + belongings
list)
(Individual/group interview)
(Observation)
(individual/group interview)
(Individual/group interview)
~Individual/group interview)
(Individual/group interview)
(

HYGiENE PRACTICES AT NEWAIl PflOJECT sIrEs 43
9. Wtiiclm meimibers of the household use the latrine?a. Mateb. Feniabe
- c. Childremi (1-15 years)d. Old persons
If you do not have a latrine where do you defecate?JungleRivetField/ vegetable gardenAnywhere.
11. For what reasons did you not build a latrine?
a. Latrine is not neededb. Too expemnsive.c. Inadequate knowledge.d.. Materials not available.e. Impermeable soil or rock.f. Other (explain)
12. U you find childremm’s excreta around the house what do you doabout it?
a. Dispose of stool in toilet and clean the area around with ash.b. Cover with niud.C. Call dog/pig/chicken.d. Throw far away & plaster the area with cow dunge. Do nothingf. Other (explain)
D. DIARRHOEA AND REHYDRA TION:
1. 1mm winichm Inmoulhi does di;mmrimoea occur commimminnmly imm ynmmrvillage?
2. How many persons of which age group died of diarrhoea withinthis year?a. Old persons
b. AdultsC. Children (1-15 years)
What do you think are the causes of diarrhoea?a. Contaumiina ted waterb. Contaminated foodc. Contaminated hamids
~ d. Fhies/insects/domestic animals & poultrye. Traditional belief.
~ How do you treat Ilme diarrhoea?a. Jeevan-jal/saht-sugar-waler solution.
b. Domestic medicines or herbs.c. Health post/ hospital/clinicd. Traditional healers
~How do you prepare jeevan-jal or salt-sugar-water solution?Please explairm amid slmow ii possible.a. Accintate
b. Inaccurate
(Individual/group interview)
(Pie chart)
(Observa (ion ÷individual!group interview)
(Observation +
individual/group interview)
(Seasonal calendar,)
(Seasonal calendar ÷counter & sticks)
(Individual/group interview ÷pie chart)
(Observation + individual!group interview)
10.a.1).C.
d.
IIII
I
p
I
t1
(Individual/group interview)
Li

44 HYGIENE PRACTICES AT NEWAH PROJECT SITES
E. MERITS AND DEMERITS OF THE PROJECT.
1. In your opinion, what are the merits oh this water, health andsammitation pEeled for you? -
a.b.C.d.
2. In your opinion, what are the demerits of this water, health andsanitatiomi project for you?
a.b.C.d.
TABLE OF OBSERVATIONNammie oh Obsem vonDate of Observation
(Individual/group interview)
(Individual/group interview)
S.No.
Subject Matter No. of HHObserved.
HH(Yes)
HH(No)
NotObserved
HH
Remarks
1. Is fhere shimne/algae on theinside of the water container?
2. Is the water storage containercovered?
-
3. Is Ieltovor lood/mmnilk keptcovered? -
4. Ooyou-dispos-e--oI-your- ---
hmousehotd garbage in oneplace?
--~ —-
5. Do you have a separatecattleshed away from yourhouse?
6.
7.
Do you have a separate penn(or goats, chmickemi amid ducks
ayhmormmtlnelme?Have you built a latrine?
8. ii yes, is it clean & sanitary?
Is theme cI mikiremis excretaaround the house?
9.
10. Is jeevan-jal/salt-sugar-water —
solution preparation methodaccurate?
iiIIii
ii
ii
1111Ii

HYGIENE PflACTiCES AT NEWAI I PROJECT SI I ES 45
TABLE OF BELONGINGS
Name of observer:DateNOTE While doing observation mnark ( ./) if it is Yes and ( x ) it it is No and ask br the reason it theanswer is mieqative.
S. N. Name ofHouseholder
Garbage pit Separate cattleshed Separate duck,chicken pen
Yes No Reason Yes No Reasorm Yes No Reason
S.N. Name ofHouseholder
Dish drying rack improved latrine Kitchen garden
Yes No Reason Yes No Reason Yes No Reason

46 HYGIENE PRACTICES AT I IEV/AH PROJECT
I-

HYGIENE PRAC1 ICES AT NEWAIl pnoJEcn SI1ES 47
I
APPENDIX 4: Chronology of Project Implementation
NEWAI I Plan of Ope’ atiom~(1 june Emaune) for FinancIal Year 1995-96Health and Sanitation Programme
II
iiII
MONTH ACTIVITIESChaitra/BaisakhMarch/Apmil
Feasibility/Baseline survey + monitoring of existing projects.
Baisakh/JesthaMay/June
Analysis of survey reports. Monitoring of existing projectareas/evaluation + handing over of small projects
AshadJune/July ~
Monitoring of large project areas + evaluation of previousprojects cont. Refresher course for Health staff, Health
~~~plan fling with Health staff.Slimawami~y/August
Rocruitirment of local Imealtim immotivators, corrcsporndcrmca.Evaluation oh lar9eprojpcts frommi previous year.
BhadraAugust/September
Deposits/money collection for latrines. Health motivatars + NGOco-ordinators training. Evaluation of large projects cont. by H.M.
Bhadra/AshojSept./October
Sub-overseers and materials arrive at sites. Formation of PMCand users committees, selection of health volunteers and start oftraining, selection ceramic tiles. Deposits/money collection forlatrines cont.
KartikOct/November
Sanitation casting yard + demonstration latrine construction.Domestic latrine construction cont. Detailed HH data collectionby Health Motivators. NGOs orientation .scrrminar.Deposits/i nancy collection for latrines cormt.
MangsirNov./December
Training of health volunteers cont. Deposits/money collection forlatrines cont. Health education programme started at each water
Trairminig of Imealllm volminmteers cant. I health educatiorm activitiescant. Domnestic latrine construction cont. Deposits/moneycollection for latrines cant.
PouslmDeceriiber/JamiuaryMaghJanuary/February
Health education activities cant. Domestic latrine constructioncont. -
PhialgunFebruary/March
Health education activities cant. Sanitation cant. Refreshercourse for outsider motivators. Deadline for money collection forlatrine.
ChitraFebruary/March
Health education cant. Sanitation cant. Evaluation and handingaver of small projects. Feasibility (baseline) surveys started forprojects in financial year 1996/97
l3aisakhApril/May
Feasibility (I~asehine)surveys for projects in financial year1996197 cant. Health and sanitation programme cant. Latrineinstallation cant.
JesthaMay/June
Monitoring of large projects, health projects, latrine installation
AshadJune/Juiy
Evaluation handing over of smaller projects
I
UHYGIEIJE PRACTICES AT IIEVIAH PROJECT SITES
ABBREVIATIONS AND ACRONYMS
f\DB—N Aqiictmttmmmnl I)ovelopimient flank of NepalDFID Deparn m mom ml Io~hi dorm maliom ml i)ovoIopn~mormt(UK)HH . households -
HHS household surveyNEWAH Nepal Water for HealthNGO nan-government arganisationORS aral rehydration solutionPRA participatory rural appraisalSFDB Small Farmer’s Development ProgrammeUnicef United Nations Children’s Fund
VDC Village Development Council
IIIp
p
U
I

School Sanitation Project of Kamrup District
Time Schedulefor PhaseI Activities. .1998
f. 1 day orientation of his XXXXX
Octo Octo Octo8—10 13-17 20-26
g. Orientation of SC members(i)—Ileeting of SC, NGO members(ii)-Orientation of SC, NGOs
i. Training of Masons(i) —First training(ii)—Subsequent training
h. 2 day training of Core
X)OOCX
XXX)O(XXx~oo~
teacher
f. 18 Sept19 Sept21 Sept22 Sept23 Sept
(ii) 13 Octo14 Octo15 Octo16 Octo17 Octo
DimoriaRaniRaxnpurChaygaonKamalpur
(Tuesday)(Wednesday)(Thursday)(Friday)(Saturday)
\~L~\&L.’~4~~ ~~sct~ts Sc~A.~c~L.
~ ‘~S(_,~o~,*~‘¼.~\J
h. (1) 6 OctoTo
12 Octo
Rar~,~ (Tuesday)To
(Monday )
(ii) 20 OctoTo
26 Octo
1. 27-28 Octo29—30 Octo30—31 Octo31-1 Oct-Nov2-3 Nov
DimoriaRaM~4arChaygaonKamalpur
DimorjaRaniRampurChaygaonKamalpur
(Tueeday —Wednesday)(Thursday— Fri day)(Friday-. Saturdayday)(Saturday -Sunday)(Monday- Tuesday)
Projal..no
Activity Sept -
18-23Octo-Nov27—3
Dimoria (Friday)Rani (Saturday)kin~.,~V~’r(Nonday)chaygaon (Tuesday))~~pEU~(Wednesday)
P
y~x
g.(1) 6 Octo7 Oc.to8 Octo9 Octo
10 Octo
Dimor iaRaniRampurChaygaonKamalpur
(Tuesday)(Wednesday)(Thursday)(Friday)(Saturday)
(Tuesday)To
(Monday)

D flmr
PERSPECTIVE VIEYtOF
THE SCHOOL SANITARY BLOCK
LI
IllIlllllDlIhIlltIthi1t~~I.~
FRONTVIEW OF THE SANITARY 8t.OCKiscat~j.j~
NOTE:(I) THE MINIMUM DISTANCE BETWEEN THE LEACH PITSAND THE WATER SOURCE SHOULD BE 10 M.
tlI) ALL DIMENSIONS ARE IN MM UNLESS OTHERWISESPECIFIED.
SCHOOL SANITATION PROJECT,ASSAM, (PHASE II)
DESIGNED BY : Dr. B. K. DAS,CONSULTANT, UNICEF
/
~1)
I
PLACEMENT OF UNITS OVER RAISED AND COMPACTED GROUNDP.1
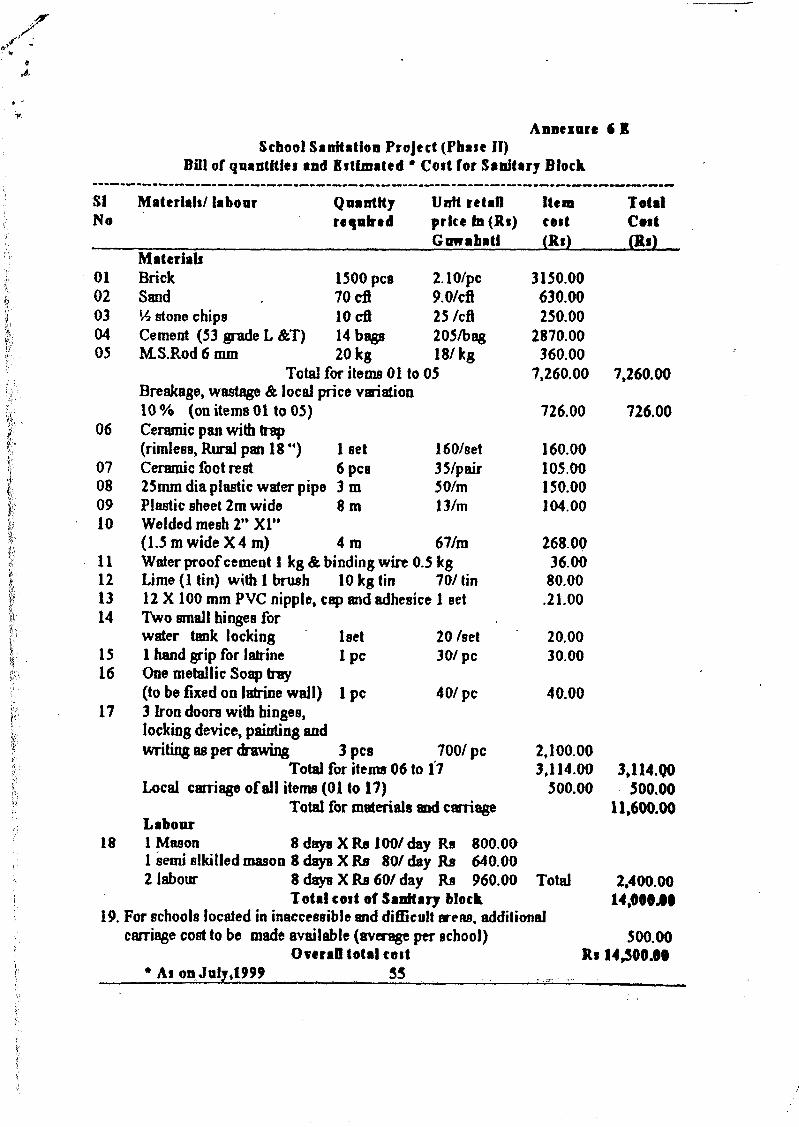
Annezure 6 ISchoolSanitation Project (PhaseIi)
Dill of quantities and Estimated • Cost for Sanitary Block
SI Materlah/ labour Quantity Unit retail Item TotalNo requbed price In (Ri)
Guwabaticod(Ri)
Cut(Ri)
Materials01 Brick l500pca 2.10/pc 3150.0002 Sand . 7Ocfl 9.OIcfl 630.0003 V2 stonechips lOcfl 25/cIt 250.0004 Cement (53 gradeL &T) 14 bags 205/bag 2870.0005 M.S.Rod 6 mm 20 kg 18/kg 360.00
Total for items01 to 05 7,260.00Breakage,wastage& local pricevariation10% (onitems0lto05) 726.00
06 Ceramicpanwithtrap(rimless, Rural pan18”) 1 set 160/set 160.00
07 Ceramic foot rest 6 ~CB 35/pair 105.0008 25mmdiapiasticwaterpipo3m 50/rn 150.0009 Plasticsheet2m wide 8 m 13/rn 104.0010 Welded mesh2” Xl”
(1.5mwideX4m) 4m 67/rn 268.0011 Waterproofcement1 kg & binding wire 0.5 kg 36.0012 Lime (1 tin) with I brush 10 kg tin 70/tin 80.0013 12 X 100 mm PVC nipple, capandadhesice1 set .21.0014 Two smallhingesfor
water tank locking iset 20 feet 20.0015 1 hand grip for latrine I PC 30/Pc 30.0016 Onemetallic Soaptray
(to be fixed on latrinewaIl) 1 Pc 40/PC 40.0017 3 Iron doors with hinges,
locking device,paintingandwriting asperdrawing 3 pcs 700/Pc 2,100.00
Total for items06 to 17 3,114.00Local carriageofall items(01 to 17) 500.00
Total for materialsandcarnageLabour
18 1 Mason 8 daysX Re 100/day Re 800.00-1 semialkilled mason8 daysX Re 80/day Re 640.002 labour 8drysXRs6olday Re 960.00 Total
- Total costof Sanitary block19. For schoolslocated in inaccessibleanddifficult areas,additional
carriage costto be made available(av~ageperschool)Overafl total test
7,260.00
726.00
3,114.Q0500.00
11,600.00
2,400.0014,OOO.I~
500.00Ri 14,500.09
As onJuly1999 55

School Sanitation Project of Kamrup DiatrictPlanning for the numberof
Orientations,’ meetings!training to be completed
Blockø D:iiaor’ia Rani Ra,npur Chaygaon Kamalpw Ilajo
Total P. - Schools 130 98 149 230 - 107 12
Stage I construction 30 30 30 - 30 30
Stage II construction 50 50 50 50 38 12
Stage III construction 50 18 69 150 27 —
Headmanter~a OrientationStage I 65 50 75 75 50 —
Stage II 65 48 74 75 57(+12) <—12St~geiII - —. - 80 -
Total nmber of orientation 11Average schools per orientation 726/11 66School Coninittee meetingsStage I 33+32 25+25 37+38 37+36 25+25 —
Stage II 33+32 24+24 37+37 37+38 30+39 <-12StageIII - — — 40+40 — -
Total nznber of orientation 22Half day meeting 2 meetings per day total 11 daysPersons per school ~3 (HH, 1 SC member, 1 NGOmember)Average schools per meeting 726/22 33Core Teachers TrainingStage I 65 50 75 75 50 —
Stage II 65 48 74 75 57(÷12) <—12Stage III - — - 80 —
Total nmber of orientation 11Average schools per orientation 726/11 66Training of MasonsStage I ~10 10 10 10 10 —
Stagell 7 7 7 7 7 4Stage III — — 6 33Ziasons trained for Stage I will continue constructions for Stage II & IIITotal number of masons to be trained = 128Number of courses 16Average number of masons per course 128/16 = 8

DATA SHEET FOR PRIMARY SCHOOLS IN KAI’IRUP OISIRICT.
_EOUCA r ION BLOCK.
~i~i~to ~rten~_~ ‘.“ I n f o r ma t i o n
Oi.. a) Full Name of the School”:’(in block letters)
b) Year of establishment
Postal Address of the’School Viii :ViaP.OPin Code :
Name of Head Master/HeadMistress(in block letter)
Residential/Contanct Addressof the Head Master/Mistress
Distance ~f the School fromB.E..E..O’s’ Office
Names of 2 teachers (onelady) to be trained for im-parting health education tothe students and for mainte-nance of School Sanitation &water supply facilities..
Yes/No ; if yes, Permanent/Temporary/with gate / without gate..’Yes/No ; if yes, rlngwell/tubewell/ working/not working --
Yes/No ; if yes, working/notworkingYes/No ; If yes, Pucca/KatchaYes/No ; if no,,local community
to raise the area before August3.998
contd 2/
/
02.
03..
04..
05.
06..
07..
08..
09.
Type/Condition of the School
Name/CareViiiP_O-Pin Code
-- I
RCC/Assam Type/Thatched/mixed!Delapidated
Km.
1..2..3.
———— BoysGirls
Number of Students ( ClassI to Class IV )
Is therea) Compound wall in the
School
b) Water source
c) Sanitary Latrine
d) Urinalse) Availability of highland
(above flood level) about6m x 4m for constructionof Toilet Block
Is

—2--
I!
BY://Name : -
- ~I ~
— -
I —~~ —‘
I I I —
II, , - ,,
I’
10.. Is there a School Committeeduly established..a) If yes, names of members
b) Name of Bank & A/C No.If any
c) Account operated by
Yes/No
-~~—
2. ~ ‘
3-4.5. ‘ .•;
6.
1. - as’ -
2. - as
/
Checked By : Name :
Date :
Collected
[secy]
Date:
- H’
I ‘~,- ,. --
- .-~ ~,\ 1
I -
16

‘7
1Z~i~CA~nc
- ,:~.“ ~
SPAKP(T
.
SECTION 1. J
~CTIONE-F
LEGENDa: COVERED WATER TANKb, c,d. : SMALL OPEN WATER TANKINSIDEe : LEACH PIT 900(DIA) X 1200 (DEPTH)f: SOAK PIT 600 (1) X 600 (B) X 600 (B)
~iQ1E:(I) All BRiCK WORK 1:6 MORTAR.(U) ALL PLASTER & FLOOR 1:4 MORTAR.(III) ALL C.C.IR.C.C. 1:2:4 CONCRETE.(IV) ALL DIMENSIONS ARE IN MIUMETERE
UNLESS OTHERWISE SPECIFIED.
SCHOOL SANITATION PROJECT,ASSAM, (PHASE II)DESIGNED BY: Dr. B. K. DAS,
CONSULTANT, UNICEF
DRYt ORRAIUWA7ERPRQIECT1O~I
P5ID~S)
IAOt WG,L~JCTIONC.D
K ‘11~-J’
F41
‘so
‘15
15
PLAN OF SANITARY BLOCK
HONEYCOMB Ui ~BRICK WORK ~ L
~—goo —,~-
LEACH PITSECTION G-H
P.2

NOTE:(I) ALL BRICK WORK1 : 6 MORTAR.(II)AIL PLASTERI FLOOR1:4 MORTAR.(III) ALL C.CJR.C.C. 1: 2 :4 CONCRETE.jIV)ALL DiMENSIONS ARE IN MMUNLESS OTHERWISE SPECIFIED.
SCHOOL SANITATION PROJECT,ASSAM, (PHASE H)
PIT COVERR CC. 1:2 4)
DLWEIER • I OSMETER
A
JUNCTION, CHAMBER...{BRICK,.,W,QRK)
4
6111.101* MSRO(R~OS@ISO
C.~7A
REINFORQEhI,FIJLA~RANGEMENTOF PIT COVER
- ,JMMOLAMS.ROUNOSISOCICBOTHWAYS
1i,~_ .‘. ;..._. II
SECTION A.A
PLAN OFNdUQNJHAMBER
I7UIi USC~~~.EN1 Pt*STE~
)t1)V.flH~f~ATctlArNl 1M94
SLOPEI:?
$~cj1QN~,.A,
SECTIONB-B
REINFORCEMENT OF WATER TANK COVER
6MM DIA M. S. GROUND~ 150GIG. 10 NOS.
6 MM OLA U, S. GROUNDC
~L-.tII...
IF
-.
•IW
IIAUDtE WITHBIAA p1*1.15ROtIHO
SECTION B,~,
) ~ 15O~
QagLQ$JLEA~HUNIT FOR VENTILATION
A!Pi2LMM~(SJMiCIRCULAR)INSIDE URINALS.
DESIGNED BY: Dr. B. K. DAS,

11’
i8” L.DROP(MQZ() OUTSIDE(Yh’ELOEO)
h. 860LT INSIDE (WELDED)b. 25MM. X 25MM. X 4MM. 143
AIIGLE ON THREE SIDESc 4 lIDS 4MM. K 25MM. Mi
FLAT WELDEDINSIDE. -d. 22 GAUGE C.RM. IHEET
• WELDED OUTSIDE.. 40 TIM LONG HINGE MADE
UP OF 20MM. DIA 0). PPEOF 4MMWALL THCKNESS.
I- EXTRA 25 MM. WIDE CPU.SHEET WELDED TO THE 25
X25AN01..E.
11(7 A14n(r tirrir OutY4MM X 25MM MB
FLAT TO BE WELDED OUTSIDE
1576 1576
0In0
580 ‘< 580 580 ••
REINFORCED WITH WELDED MESH 50 X25
560
I b
In
TT0M~1.~IW.,OL~PLE.$D0II
I.e
C
P
JSoMgTR~c~vJ~,wQ~j~S~MBLY,OFJ1!NOE~JAJ(DHOOK
L~EEERAND LOWER)
In— - —d
f
b—
b
‘C
b
e
C
ELEVAUORQE‘OO,O,~
450 $73 ..,e.•.—I
(‘1
“cc.
PErAIkLQF_QQi~Ec!iQNWITH PAN & SYP HON
25MM 01* P.V.C.WATER PiPE
BEAD (CONCRETE)
NEAT~”~”~- ORA2N$CONCREIE WITH SEIII CIRCUJR
ISOMETRIC VIEWQF DOOR WHEN
VIEWED FROM INSIDE
NOTE;
(I) ALL DINENSIDNS ARE IN ~M UNLESS OTHERWiSESPECWIED.
mUPpERAND LOWER HOOKS SHOULD ENTER THE HINGES FROMBOTTOM BUT THE MiDDLE HOOK SHOULD ENTER THE HINGEFROMTHE TOPOF THE HINGE
SCHOOL SANITATION PROJECT,ASSAM,(PHASEII)
DESIGNED BY : Dr. B. K. DAS,CONSULTANT,UNICEF
‘—~
125 BRICK SOLIHG
ELQO&cjJp~lWiTJL25MMSLoPE p.4