practices & perspectives · hr consulting with many large indian and mncs and start-ups in the...
TRANSCRIPT

www.nationalhrd.orgISSN - 0974 - 1739
JOURNAL QUARTERLY
Volume 10 Issue 3| July 2017
Key ContributorsAadil Bandukwala
Fiona Rohinton Wadia
Dr. J.M. Sampath
Juhi Dubey
Jayaram Philkana
Dr. Manoj Varghese
N. Balachandar
Poornima Rajan Thakur
Prabhat Ramesh
Raj Raghavan
S. Ramesh
S.R. Sriram
Santosh Thangavelu
Sai Kumar Shamanna
Shweta Jaiswal Thakur
Srikanth Vachaspati
Dr. Srinath Jagannathan
Subhashini Sriram
Tej MehtaHR ANALYTICS & PRACTICES
PERSPECTIVES

HR Analytics Practices and Perspectives
Volume 10 | Issue 3 | July 2017

NHRD Network JournalHR Analytics: Practices and Perspectives
Volume 10 Issue 3 July 2017| |
NHRD Network Board MembersNational President Mr. Saptarshi Roy
National President, NHRDN and Director - HR, NTPC
Immediate Past President Mr. K Ramkumar
Founder Leadership Centre Pvt Ltd
Director General Mr. Dhananjay Singh
Editorial Team S. Ramesh, Partner, Culstran Consulting LLP.
Dr. Pallab Bandyopadhyay, Managing Editor
Leadership Architect & Career Coach, HR PLUS
Email: [email protected]
Dr. Arvind N Agrawal, Managing Partner, Lead Associates
Publisher, Printer, Owner and Mr. Dhananjay Singh
Place of Publication Director General, NHRDN On behalf of National HRD Network
National HRD Network Secretariat, C 81 C, DLF Super Mart,
DLF City, Phase IV, Gurgaon 122 002. Tel +91 124 404 1560
Email: [email protected]
Designed by Fulki Communications Pvt. Ltd.
710, DLF City Court, MG Road, Gurgaon - 122 002
Email: [email protected] | Web: www.fulki.co.in
Tel. +91 124 4210356/57 | Mob. +91 9811156199
NHRD Network Journal is complimentary for NHRDN Life Members. Please contact, Mr Pranay Ranjan at [email protected] to become a life member of National HRD Network and receive your complimentary copy. For any complaint of non-receipt of Journal, for existing life members please follow-up by sending an email to [email protected] /[email protected]
The views expressed by the authors are of their own and not necessarily of the editors nor of the publisher nor of authors� organisations
Copyright of the NHRD Journal, all rights reserved. Contents may not be copied, emailed or reproduced without copyright holders� express permission in writing.

About the Journal
The National HRD Network publishes a semi-academic quarterly journal where in each issue is dedicated
to a theme.
The Journal publishes primarily three categories of articles:
� Conceptual and research based.
� Contributions from thought leaders including a limited number of reprints with due permission.
� Organisational experiences in HR interventions / mechanisms.
About this issue
The theme of the current Issue is “HR ANALYTICS: PRACTICES & PERSPECTIVES”.
Editorial Board Members
Dr. Pallab Bandyopadhyay, Managing Editor, is a Leadership Architect, Career Coach, Change and
Transition Specialist with thirty years of successful professional experience in managing entire gamut of
Human Resources Management with proven expertise in managing multicultural globally distributed
knowledge professionals. He has rich experience in companies like Citrix, Dell Perot, Cambridge
Solutions, Sasken and ALIT. He is a doctoral fellow in HRD from XLRI, a product of NTL, USA and provides
HR consulting with many large Indian and MNCs and start-ups in the area of Leadership coaching,
Organisation development, Long-term capability building, Strategic change and Organisation alignment.
Dr. Arvind N Agrawal is Managing Partner at Lead Associates. He was the President and Chief Executive of
Corporate Development & Human Resources and Member of Management Board of RPG Enterprises. He
held senior positions in Escorts and Modi Xerox. He was the past National President of National HRD
Network. Dr. Agrawal is an IIM, Ahmedabad and an IIT, Kharagpur alumni, and also holds a Ph.D. from
IIT, Mumbai.
NHRD firmly believes in and respects IPR and we appeal to the contributors
and readers to strictly honour the same.
For any further clarifications, please contact:
The Managing Editor
Dr. Pallab Bandyopadhyay, Leadership Architect and Career Coach, HR PLUSnd thSri Nrusimhadri, Flat No 303, Third Floor, No 12, 2 Main, 7 Block, Jayanagar, Bangalore-560070
Email: [email protected]

Contents
S. No. Title of Article Author Page No.
Editorial Note
About The Guest Editor
1
5
Pallab Bandyopadhyay
S. Ramesh
Articles
1. HR Analytics-Impact on human resources 9Dr. Manoj Varghese function and skillset of HR professionals
2. So you want to learn HR Analytics? 18S. Ramesh
3. Employee as a Nuanced Subject: Statistical 24Dr. Srinath Reconstruction as Typology Building for Jagannathan Managing Attrition
4. HR Playbook - A higher order analytical tool 30Subhashini Sriram
5. Productivity tools:Fitness band for 35Poornima Rajan Thakur workplace engagement?
6. Operationalizing HR Analytics in Infosys 40Juhi Dubey Fiona Rohinton Wadia
7. HR Analytics in IBM: Employee engagement Index 44Srikanth Vachaspati and the digital learning marketplace
8. CHRO 2.0 - From "Support" to "Strategic" 54 Dr. J.M. Sampath using People Analytics Prabhat Ramesh
9. Using Predictive Analytics in HR in eight steps 67Tej Mehta S. Ramesh 10. Outbound Hiring-The future of intelligent recruitng 74Aadil Bandukwala
Guest Editorial 6S. Ramesh

Contents
S. No. Title of Article Author Page No.
Interview with Practitioners
11. Mr S .R. Sriram 79
Director & Head � Human Capital, Arcesium India Private Limited
12. Mr. Santosh Thangavelu 80
Sr. Vice President & Head, IT Talent Supply Chain Solutions, Teamlease
13. Mr. Sai Kumar Shamanna 81
Chief People Officer, Mobileum
14. Mr. N. Balachandar 82
Group Director HR, Café Coffee Day Group
15. Mr. Jayaram Philkana 84
Chief People Officer, UPL
16. Mr. Raj Raghavan 85
Head Human Resources Asia Pacific Region, Amazon
Book Review
17. Winning on HR Analytics r 88Shweta Jaiswal Thaku

Dear Readers
Let me begin my editorial by quoting Dave Ulrich who once said “No one
can predict the future course of the HR profession. No one can predict
how HR practices will change in the future. Thinking about the future,
however, helps us to prepare for it. Thinking about the future may lead
to innovative insights. Thinking about the future may help to change
today´s HR practices in positive ways.”
Aptly so, Indian corporates are not an exception to this trend and that is the
reason we decided to focus on HR Analytics for our July, 2017 issue.
HR Analytics, to begin with attempts at applying analytic processes to the
human resource(HR) function of an organization, in order to continuously
improve performance across the employee life-cycle management processes that are run by them.
Not only does HR analytics aims gathering data and then using it to make relevant decision about how
to improve these processes, it also provide valuable insights for improving the quality of managerial
decision making related to employee performance and productivity. Let me give some examples.
Cognizant, a 13.49 billion USD IT Services firm, which has most of its employees based at India,
analyzed social media contributions, particularly blogs and found that these employee bloggers were
more engaged and satisfied than others and performed about 10% better, on average.
Jet Blue, a 6.6 billion USD American low-cost carrier, and the sixth largest airline in the United States,
created an employee-satisfaction metric around its people�s willingness to recommend the company
as a place to work. This “Crew member Net Promoter Score” (taken from the widely used customer-
satisfaction metric) has been used to study the impact of compensation changes and to help
determine executive bonuses. As a regular practice employees at Jet Blue are asked annually on their
hiring date if they would recommend the company. This data is tracked by its HR analytics team to
effectively monitor employee engagement on a monthly basis.
The HR analytics team at Sysco, the $36.8 billion USD, global food-service companybegan its
workforce analysis with three gross measures namely, work climate and employee satisfaction,
productivity, and retention. It then used these data to analyse them to better understand, measure, and
manage seven other dimensions of the work environment, including frontline supervisor effectiveness,
diversity, and quality of life. Through these analyses they figured out that operating units with highly
satisfied employees have higher revenues, lower costs, greater employee retention, and superior
customer loyalty.
Dow Chemical, a 48 billion USD, American multinational chemical corporation has built a state of art
workforce planning process by using HR Analytics. Dow Chemical today uses a custom modelling tool
to segment the workforce into five age groups and ten job levels and calculates future head count by
segment and level for each business unit. These detailed predictions are then aggregated to yield a
workforce projection for the entire company. There system is so robust that they can engage into in
�What if� scenario planning, altering assumptions on internal variables such as staff promotions or
external variables such as political and legal considerations.
Google, a 89.46 billion USD internet world leader used HR Analytics to mine employee performance
data to determine the most appropriate intervention to help low-performing employees improve their
performance. Google believed that many of these low performing individuals might be misplaced or
poorly managed. Accordingly by using HR Analytics they were able to understand these individuals�
needs and values and that in turn allowed their HR team to successfully resolve a number of difficult
situations related to employee performance.
Editorial Note
01NHRD Network Journal July 2017 |
NHRD Network Journal July 2017 |
AC Milan, a professional soccer team, with a team value of 802 million USD today has been a leading
user of analytics. To protect its high investments, AC Milan created its own biomedical research unit.
Drawing on some 60,000 data points for each player, the unit currently helps the team gauge players�
health and fitness and make high value contract decisions for their celebrated soccer stars.
Lockheed Martin, a 46.13 billion USD American global aerospace, defence, security and advanced
technologies company used HR analytics to build a performance management system to link each
employee�s performance to organizational objectives. This automated system collected timely
performance-review data for all employees. These data were analysed together with knowledge
management information, such as who has undergone formal training in specific areas. With this
analysis the HR Analytics team at Lockheed Martin identified its high potentials for special programs
and monitored employees who need improvement in certain areas.
The list is endless and every passing day, organizations are developing newer insights into people
related decision process more objectively by using HR Analytics. As aptly described by Jose
Bersin��
� High tech companies now know why top engineers quit and how to build compensation and work
environments to get people to stay.
� Financial services companies are now analyzing why certain people commit fraud and what
environmental or hiring issues might contribute to such violations.
� Product companies are now analyzing the demographic, educational, and experiential
factors that correlate with high performing sales people and why top sales people quit.
� Health care companies are looking at why certain hospitals or departments have higher
infection rates and what people issues are behind these problems.
� Manufacturers and product companies are looking at the patterns of email traffic and
communications to understand how high performing managers behave and what work
styles result in the highest levels of performance.
So how do you want to move? According to Davenport, Harris and Shapiro there exists six kinds of
analytics for managing workforce from simplest to most sophisticated, and are described as follows
� Human-capital Facts
� Analytical HR
� Human-capital Investment Analysis
� Workforce Forecasts,
� The talent Value model
� The talent Supply chain
Similarly Besrin talks about four levels of Talent Analytics Maturity model where organizations need to
move from level 1 to level 4 to get maximum benefits from use of HR Analytics which are described as
follows.
� Level 1 - Operational Reporting
� Level 2 - Advanced Reporting
� Level 3 - Advanced Analytics
� Level 4 - Predictive Analytics
I am sure as a professional learner many of our readers are curious to know what arethe facilitating
factors that are required in an organization to develop an expertise in this domain?
So what do you need to begin with to make your organization ready for HR Analytics?
02

NHRD Network Journal July 2017 |
Davenport, Harris and Shapiro proposed a simple model with an acronym DELTA which can be
described as
� Access to High-quality data (D),
� Enterprise Orientation (E),
� Analytical Leadership (L),
� Strategic Targets (T)
� Analysts (A)
Lastly, one of the most frequently asked questions that we hear when talking about HR analytics is:
“What kind of capabilities does my team need to successfully start with HR analytics
interventions?”
Patrick Coolen, a practicing HR analytics and strategic workforce planning Manager at ABN AMRO
aptly described a need for a balanced and blended approach where organizations should have experts
having the following perspectives
� The Business perspective
� The Consultant perspective
� The Data scientist perspective
� The IT architect perspective
� The Software perspective
Coolen aptly summarized his experience when he said “Only those organizations that manage to
create and maintain a balanced blend of the different relevant capabilities will be successful in
HR analytics.”
Following the global trend many organizations in India today have started using HR analytics. The
deluge of HR data is the sources of information that are helping managers with an unprecedented
ability to understand their workforce and businesses better and making them, better prepared to deal
with future challenges, and proactively identify opportunities.
On behalf of the editorial board, I would like to thank Ramesh Soundararajan for readily accepting my
request to guest-edit this important issue on HR Analytics: Practices and Perspectives. He has
worked earnestly to find most of the contributors, persuaded many of them to document their
experiences and perspectives and regularly followed up with them to make sure that their
contributions are received in time so that we can release our issue without much delay. In his effort he
has crafted the journal based to answer the following questions that are there in many of our readers
a) What is HR Analytics?
b) How does HR Analytics work in organizations?
c) Why does HR Analytics work (cause-effect relationships, antecedents, and consequences)?
d) What are the outcomes of HR Analytics?
e) What is required for HR Analytics to succeed
f) What competencies HR professionals need to develop to build expertise in HR Analytics domain?
Before ending my editorial I would like to quote Josh Bersin, probably one of the most respected
researchers in the area of learning and talent management today.This quote rightfully describes why
HR Analytics is the most future-focused area among the leading corporates in the world today.
03

“After years of talking about the opportunity to apply data to people decisions, companies are
now stepping up and making the investment. And more exciting than that, the serious math and
data people are flocking to HR”.
I am sure that our readers will enjoy reading this issue and would like to preserve it as a reference for
their future use.
As always, in line with our continuous endeavour of touching upon important HR issues, I am happy to
inform you that the last issue for this year (October, 2017) will be dedicated to the theme of
“Leadership Development : Issues and Challenges” which will be guest edited by
Dr. Asha Bhandarker, Distinguished Prof of Org Behaviour, IMI Delhi
Keep reading and send us your feedback at [email protected]
Happy Reading !
Dr. Pallab Bandyopadhyay
Managing Editor
NHRD Network Journal July 2017 | 04

About the Guest Editor
05
S.Ramesh is a HR professional with 25 plus years of experience as a practitioner
and as a consultant. An electrical engineer from National Institute of Technology
(NIT), Kozhikode, Ramesh completed his master�s in personnel management and
industrial relations from Xavier School of Management (XLRI), Jamshedpur.
Presently he is the founding partner of Culstran LLP, a firm focused on consulting
corporates in the areas of culture, strategy and analytics. He is a trained assessor
in using the PCMM and CII HR models.
Ramesh�s experience spans manufacturing, FMCG and IT sectors. Crompton
Greaves, TVS Whirlpool, Infosys Technologies (more than a decade) and Sasken
Communications are the prominent companies he has worked with. . He has
worked as a location head of HR, head of a section, as well as the head of the
function.
Ramesh has recently co-authored a book called � Winning with HR analytics�.
Published by Sage, this book is one of the best-sellers in the HR space. His blog
on analytics, �HR3by2�, is widely referred to.
S. Ramesh
About the Author
NHRD Network Journal July 2017 |

Guest Editorial
06
�In God We Trust� goes the US motto. Then in the last century, Edward Deming said �In God we trust, all others
bring data�.
So, people started getting a lot of data to discussions. Microsoft Excel and Power point took analysis to a fine
art. So much so, that a wise man said �If you torture data long enough, it will confess to anything!�
People did not know what to do with all that data that was thrown at them. For a while, charts helped to make
some sense. Then the scorecard movement started, wherein it was not sufficient to just throw data, but actually
connect it to corporate strategy. The simplification helped.
Analytics was still a niche� field till the last decade. Widely used in financial services and retail, but a novelty
elsewhere. However, like it happens in technology several trends came together at the same time to bring R and
SPSS into the mainstream. Along with their pet �Python�.
From HR Metrics to HR scorecard we moved into the age of HR Analytics. The business has become more
demanding after being influenced by insights from elsewhere. They were not happy with well-produced reports
or well-structured spreadsheets. They demand an infographic. They demand a prediction based on existing
data. They want to know what will be the impact on retention by increasing pay.
In this edition, we may not have answers to all these challenges! But what we do have is a set of contributions
and opinions from academics, practitioners and providers. Collectively, we expect them to be collectively
exhaustive.
Dr. Manoj Varghese focuses on the here and now of HR analytics and its impact on the function as well as the
professionals. There is technology to manage data at very attractive price points. But does it mean that all that
data should replace the � Heart� from HR decision making? It is more about the �head� guiding the heart in the
right direction.
� Contextualization is important. A call center may have 35% attrition and manage, but a product company
cannot handle even at half of that
� He also brings out the reason due to which HR heads are able to make lot more from data, than the CoE
heads. The sheer multiplicity of processes, functions and accompanying systems help us make
incremental improvements but come in the way of leveraging analytics effectively. This results in
�analytics myopia�.
� Integrated view would help with multiple HR domains like talent acquisition, employee retention,
performance management etc.
The next article starts where this ends. While HR functions may realize the need, how do HR professionals
develop their capabilities? The next article by me has the following takeaways
� Competencies required adapting analytics.
� Influencers on social media who will help navigate the journey
� Books and videos that support the same.
Analytics can be enjoyed with a healthy appreciation of how statistics and logic comes together to solve
problems. Dr. Srinath Jagannathan creates a great illustration on the simple question from an employee �Do
you really know me?� We can do simple classifications that may not be adequate. We can use factor analysis
and text analysis to nuance the employee into
NHRD Network Journal July 2017 |

� Organization champion or not?
� Resonant or dissonant?
� Embedded or disembedded?
This approach helps us take the dialogue forward from our basic concepts of �satisfaction�, �engagement� to
their outcomes; How far the employee feels part of the company and aligned to its culture and values.
These are the perspectives. The perspectives are then followed by practices. It has been a challenge to get
case studies from organizations. Some may be doing a great job but rating themselves low. Others may
actually be concerned about confidentiality. However, we have perspectives from best in class companies.
IBM is one of the pioneers in analytics. Srikanth shares two terrific illustrations from IBM�s adaption of analytics
as well as their own experiences with Watson in the learning domain.
� Developing an Employee Engagement Index
� How the Index is a powerful predictor of business performance, leading onto a high performance-
engagement model
� How a unique learning experience is created for each employee on the basis of analytics, much like how
Amazon leads us on in our buying.
Infosys has been known for their operational excellence. Here, they take us through the journey with the
following key observations
� The unique operational challenges of a multi-locational company, where analytics helps deal with the
complexity of managing work permit utilization across scores of organizations.
� Creating a multi-layered engagement portal with proactive tracking and self-service capabilities.
� How the talent criticality model was envisaged.
There is a data overload which helps us measure whatever is available. But what is essential? Subhashini
Sriramfrom Unisys shares the concept of �HR Playbook�. The playbook is based on
� Identifying the critical few measures for different HR processes.
� Instead of just stopping there, carry forward with their impact on business outcomes like productivity,
revenue etc.
� Use this for doing scenario planning and creating a line of sight from HR to business on a continuous basis.
We have done with the perspectives and practices. But life is about possibilities! Analytics has an impact
across the HR spectrum. We have illustrations from companies on Predictive analytics in HR, anchoring
analytics in employee assessment and development, reorienting talent acquisition and managing productivity.
Predictive analytics is an area of interest in HR. Tej Mehta from i-cube analytics converts his experiences into an
8 step method to predictive analytics also leveraging Organization Network Analysis.
Dr. J.M.Sampath and Prabhat Ramesh take us through their fascinating journey using validated psychometric
tool made in India to align the entire assessment to development cycle.
Poornima Rajan Thakur of Prohance details out how workplace productivity tools can be the fitness bands of
the professional and shares their perspectives.
Aadil Bandukwala from Belong talks about turning around the hiring process from one where candidates apply
to a position to one where using technology and analytics, companies identify talent they want and bring them
on board.
We are also thankful to Shweta Jaiswal, emerging scholar from MDI Gurgaon for her expert review of the book �
Winning with HR Analytics�.
Finally we have the experience of CHROs from companies across the business spectrum; Technology
obviously but also QSR, manufacturing and staffing. So, what is one thing that is shared by the CHROs of
NHRD Network Journal July 2017 | 07

Amazon, Café Coffee Day, UPL, Mobileum, Arcesium and Teamlease?
� The HR function will be required to be able to present a cogent picture of their contribution as functions like
finance and marketing.
� It is not about the frameworks or software, though they help. It is critical to align the analytics to a deep
understanding of business and what business levers does HR impact and build a positive narrative.
� Analytics could be a buzzword but analytical problem solving is an important competency for all HR
professionals.
� Productivity, engagement, retention, compensation and talent acquisition are all areas where analytics is
used. The game has just started!
Hope this issue would help address some queries you have and help take your understanding forward.
NHRD Network Journal July 2017 | 08

09
HR Analtyics � Impact on Human Resource Function and Skillset of HR Pofessionals
Dr. Manoj Varghese, currently Director, Xavier Institute of Management and
Entrepreneurship Kochi, has about two decadesof professional experience in
Human Resources domain across Maruti Suzuki, Infosys, Dell, Google and
Facebook. At Facebook where he served as a Director, he successfully set up the
Facebook India Operations Team. Dr. Varghese joined Facebook from Google,
where he served as the Director (Human Resources - Japan and Asia Pacific),
based in Singapore. Prior to his role at Google, he spearheaded the HR function for
Dell International Services Hyderabad site and led the staffing function for Dell
India.
Dr. Varghese did his B.Tech in Electronics and Communication Engineering from
Regional Engineering College (NIT) Calicut in 1994, Post-graduate Diploma in
Personnel Management from XLRI Jamshedpur in 1997, and Ph.D. in Business
Administration from Aligarh Muslim University in 2016.Dr. Varghese is the Chief
Mentor at Eastern Group of Companies and is a consultant/trainer in areas of
Strategic Management, Human Resources, People Analytics, Leadership and
General Management
Dr. Manoj Varghese
About the Author
NHRD Network Journal July 2017 |

10
Introduction
uman Resources Professionals have traditionally been accused of being �soft� and taking people Hdecisions (or advising the business leaders they support) from the �heart�. While there was some merit to
these accusations, in the new era, with the connectivity we have, processing power, storage of large amounts
of data at low cost and the possibilities of data analytics, the human resources professional of today needs to
have very definite and substantive skills to navigate the new world of analytics. Any decision that you make if
relied on human judgmental one is prone to errors and hence including the right data can make the decision
that much better and defensible. Data from traditional reporting and summary data may be important but the
need of the hour is to go beyond to predictive and prescriptive decision models to make the best people
decisions. Looking at how the Human Resources functions are run, while the businesses are embracing and
analyzing "big data" to transform business and accelerate innovation, Human Resources professionals are just
scratching the surface in using data to provide insights critical to strategic people decisions. In short, when it
comes to using analytics and building models that predict and prescribe the people decisions, human
resources professionals have not moved either fast or far enough to the application of data science to make
better people decisions.
With more and more enterprise-wide systems getting integrated with human resource processes, the HR
profession is able to leverage data to inform strategic people decisions in a deliberate way that has not been
possible earlier. HR Analytics capabilities are still under-developed in many companies and there is a long way
to go before we are able to fully realize the potential of HR analytics. There are a number of reasons for this. In
this article, we will explore some of them and try to build a set of steps to �engineer� the human resource
professional of today to more confidently rely on the �head� as well using the advances in computing and data
science. The need to move to an analytics-driven Human Resources approach is becoming critical for
organizations to take people decisions with more conviction than in the past. In this article, we will first look at
how HR analytics is pushing the traditional models of HR and then the increased skills we need our HR
professionals to have to make best use power of analysis and modeling techniques. Even before we talk about
the skills gap that exists with respect to HR analytics, HR professionals struggle with linking the HR variables
with the overall business strategy of the organization. Getting that right should be the starting point as the
analytics become useful and useful only if at the baseline the HR strategy flows from the business strategy.
HR Analytics in Perspective
The view that some HR professionals and business managers have that HR analytics is the answer to all
�people problems� they have is erroneous. Analytics is something that gives an additional perspective and
more information before we take a decision to make that decision based on solid facts. The approach to use
data to justify the decisions is like putting the cart ahead of the horse. Now HR professionals have the luxury of
using HR analytics as an additional dimension to be more certain of the people decisions they make and
understand the implications of the same. These decisions may have components of the �heart� that cannot be
ignored. Hence, people analytics at best should be seen as an aid to take the right decisions rather than a way
to make decisions based on algorithms or models alone. The �heart� aspect of the modeling is also important as
otherwise � the context of the person who gets affected by the decisions is completely lost. Hence my
argument that we should look at HR analytics as a process in which the �head� adjusts the decision of the �heart�
rather than completely shifting the decision to be based on �head� ignoring the �heart�.
At the basic level, HR analytics is an opportunity to get insights from data (which is now available in plenty and
at a negligible cost) to either take better-informed decisions and/or to understand the impact of the decisions
on people. Hence any discussion of HR analytics should start at understanding the various levels of HR
HR Analtyics � Impact on Human Resource Function and Skillset of HR Pofessionals
NHRD Network Journal July 2017 |

11
Level of
Analytics
Level 1
Descriptive
Level 2
Diagnostic
Level 3
Predicative
analytics. Traditionally we have looked at Analytics being descriptive, diagnostics, predictive and prescriptive.
The aspect that is well understood, but sadly not enough attention is given, is that to predict and to prescribe
the analysis of the descriptive data (and the context) needs to be understood very well. In HR analytics, the
context has a much larger meaning, as insights you get from descriptive data need to be contextualized very
carefully to make sure the predictions and prescriptions you need to drive is based on accurate insights.
At the first level, having the right tools to aggregate data from various internal systems becomes important.
This brings in an important question to the forte � how integrated the HR systems are between the various HR
processes at one level and with the larger business at another level? Here we traditionally find two aspects that
can be a challenge in terms of using HR analytics opportunity fully.
a) Integration of the various HR processes and tools at an HR division level
b) Integration of HR processes/tools with businesses at an Enterprise level
This lack of integration will be challenging when we have to move to a Predictive and Prescriptive level of HR
Analytics, as the results may not be consistent. Hence for organizations, the first and most important thing is to
make sure that the HR processes are integrated and then the same is integrated with the business.Unless the
level of integration is at the highest level, the benefits that one can get from analytics will be at a lower level. See
Table 1 that shows the levels of analytics and levels of integration.
Level 4
Prescriptive
Intra HR Intra Company
Level of Integration
Source: Author
Table 1: Integration and levels of Analytics
NHRD Network Journal July 2017 |
12
The level of integration can result in Analytics Myopia (Analytics short-sightedness). Analytics Myopia is a
result of having HR metrics (vision) when it comes to independent processes � like performance management
system or compensation but as the level of integration between the two HR processes is low we are unable to
predict a future event or prescribe the best scenario across these processes. For example, the HR
professional�s ability to motivate higher levels of performance using compensation levers will appear blurred to
all stakeholders. The analytics myopia can be removed only by having integrated processes and measures that
move together and are interdependent on one another or mediate/moderate the relationships with one another.
Is HR Analytics Redefining Traditional Models of HR?
Analytics gives us increased capability into understanding the processes and the impact it has on people.
Once we understand the same, it provides us an opportunity to design and implement better systems. Also, it
provides an opportunity to build learning systems that have intelligence to adapt to changing situation. This is
central to how we think of the HR processes in the brave new intelligent world. Here we have the capability
through machines to analyse the huge amount of data in a short period of time. We have options to build
simulators and test models into the future rather than waiting for real experiments. All of these require the HR
professional of today and tomorrow to relook at how HR processes were run and see whether we need to create
better and more efficient processes which are effective as well as efficient. Also, here we have the opportunity
to speak the same language like our business partners and also convince them that HR decisions are made
scientifically and are not based on how we feel or what we believe in. Our feelings and beliefs are tested
thoroughly and calibrated to make sure that we have better control and predictability to the people results we
want as a business. Hence a complete, comprehensive redefinition of traditional HR practices is called for. We
will look at how the new world of analytics aided by connectivity, technology and data science is reshaping the
HR processes. Through effective HR analytics, we can understand what makes people join a company,
perform, stay and contribute.
Talent Acquisition
Talent Acquisition is becoming more and more scientific. While earlier efforts were on to make the recruitment
and selection process more scientific and objective HR Analytics is providing the inputs required to do just in
time hiring, the right competency based hiring and even predicting the performance and the length of stay of
prospective candidates. The insights obtained through analytics from workforce analytics, training,
performance management, compensation and rewards and retention processes is used to model the hiring
process in a way that the impact the person is going to have in the organization can be predicted and drives the
final hiring decision. Google famously did this through the hiring algorithm they developed � which looked at
the Applicant Tracking System of Google with enormous data over millions of applicants and the Google HR
systems with tens of thousands of employee performance, compensation and performance data. The
traditional resourcing and hiring of candidates are impacted for the better so that both false positive and false
negative hiring decisions are reduced significantly. When I was at Google between 2004 and 2010, we
significantly reduced the hiring efforts by using the algorithm along with better education of hiring managers.
Equally significant is the ability of businesses to better predict and manage the need for resources. This made
the effective use of a virtual workforce an effective mechanism to manage a set of resources that are non-core
to the business as contingent (non-traditional) workforce. While the management of the same in terms of
setting expectations and measuring their impact have been revolutionised by analytics, what is more important
is that analytics is helping to manage the dynamics of the shift to having a core set of key employees at the
central of HR strategy resulting in better rewards and recognition for their contribution. See Table 2 for
examples of some questions in this section that HR analytics can answer.
Performance ManagementRight from the first step of setting goals, analytics is the key to leveraging performance Management to ensure
better alignment of employee�s effort to organizational goals, recognizing and rewarding employees.
Performance management, which can get corrupted by components of subjectivity, now has an opportunity to
NHRD Network Journal July 2017 |

13
drive more and more objectivity into the process by providing the right tools and analysis to both the appraisers
and appraisee. Analytics helps in identifying the key talent much more objectively and hence and help
decisions of placement of talent in key projects providing an opportunity to look at the development of
employees as well.
When using analytics in Performance Management, identifying factors that predict great performance
becomes easy. This can be integrated back into the hiring, promotion and training decisions and better
integrate the HR processes like never before. Also, established traditional assumptions with respect to what
education background and what experience results in great performance can be challenged with the help of
hard data. See Table 2 for examples of some questions in this section that HR analytics can answer.
Talent Acquisition � Higher education degree as a good predictor of
performance in Job.
� Being able to predict which new hires, based on their
profile, are likely to be high fliers and then moving them
into your high potential programs.
Performance Management � Do successful team managers have certain common
competencies and attributes (success profiling)?
� What are some of the design aspects of jobs that make
the biggest impact on business outcomes?
Training and Development � Which trainer or training programme has had the biggest
impact in terms of improving productivity?
� Which trainer/trainees who had training was effective at a
level 4 (impacted business outcomes)?
Rewards and Recognition � How do you give someone a pay rise or a promotion in a
way that maximizes happiness?
� What is the optimal mix of compensation for certain role
types � cash? Shares? Bonuses or more flexible working
arrangements?
Retention � What statistical models can be used to understand and
predict turnover, allowing managers to more quickly
change work conditions to prevent top performer
turnover?
� Which variables were strong predictors of retention and
turnover from Employee data from the previous three
years?
Analytics Questions at the Highest
Level/ Highest IntegrationFunction
Source: Author
Table 2: HR Analytics Questions
NHRD Network Journal July 2017 |

14
Training and Development
The entire identification of training needs to the effectiveness and impact of training at the highest level can be
done much more scientifically in the analytics world. This results in better use of the training budget that
traditionally was allocated with �good intentions� rather than based on focussed learning outcomes. GE Digital
has used the analytics from the learning platforms for their talent planning exercise. The repository of skill sets
and predictive models are used to support organizational design, reskilling needs and develop training
interventions. The business leaders are involved in defining key capabilities for employees that are used to
identify the training/learning needs. This is giving employees transparency with respect to the gaps and
strengths they have resulting in better engagement with career building opportunities. At Google we were able
to use analytics to connect the Employee Satisfaction Survey results, the upward Manager Feedback survey
and Performance Management ratings in a way to identify the training needs for managerial development. See
Table 2 for examples of some questions in this section that HR analytics can answer.
Rewards and Recognition
Increasingly, the relationship between pay and performance is getting closer scrutiny from all quarters. While it
is important for businesses to create that clear distinction between employees who make an impact versus
others, from an employee point of view, things like internal parity issues are important. Also, the business
leadership and in many cases the board as well is asking HR for evidence of building a pay for performance
culture through compensation cycles. This can be measured, analysed and even evaluated through HR
analytics. While the impact the employee had is demonstrated through the performance management tool,
evaluating the impact and comparing the same across various groups is possible through the right use of
analytics. Annual compensation review cycles and the most efficient use of the limited budget in the most
efficient way can be tracked, reviewed and managed after prescribing the right amount of rewards for different
categories of performance. Also, understanding total compensation at the descriptive level or using conjoint
analysis to prescribe the right components of compensation at a higher level of analytics are being increasingly
used by organizations to make their compensation programs more effective and efficient. See Table 2 for
examples of some questions in this section that HR analytics can answer.
Employee Retention
Why employees leave an organization is better understood through analytics. The standard practice is to look
at metrics once the event has occurred � and analyse things like tenure, demographics etc. for voluntary and
involuntary termination. How one understands trends over a period of time, trends in a particular department,
or among a particular set of employees is the added advantage that analytics provides. Stand-alone metrics,
when analysed along with other aspects will provide insights that will help an organization to �anticipate� and
�manage� employee attrition better. Data mining techniques, in particular, clustering analytics can help one
understand the common themes of employees who have a higher or lower probability to attrite. Also, there
could be certain organizational triggers � increment cycles, rewards that could accelerate or decelerate
attrition rates. Voluntary attrition before it occurs if known can be prevented through the right interventions
through the use of analytics. Based on historical data if the probability of a good performer is known �
appropriate actions can be taken to prevent the same. Google has been successful in building algorithms and
managing the same through HR analytics. See Table 2 for examples of some questions in this section that HR
analytics can answer.
In addition, we can look at employee diversity, mobility, succession planning or any other HR processes and
identify questions that HR analytics can answer more objectively and conclusively for you and the business
leaders you support.
Competencies for HR Professionals in an Analytics World
To leverage analytics one could build an HR analytics team to start as the first step. This will help in integrating
the analytics efforts across all areas of HR to start with as the specialized analytics team will want to get data
integration across all HR processes. As analytics becomes more and more common across organizations, it
will be key to build an analytics mind-set across all HR professionals. At the core of it and analytical thinking
NHRD Network Journal July 2017 |

15
approach is what the HR professional of tomorrow needs to be to be open to the possibilities of HR analytics.
The employee life cycle and how it is all connected with clear implications for the organization should be
understood. The big picture thinking that was earlier associated with the CXO suite is now required at all levels
to benefit from HR analytics. Core insights delivered through HR analytics need to be actioned /modeled in the
context of the organization.
In addition to be number focused and be evidence based the HR professionals need to be able to understand
the relationships between variables. The following competencies become key to be looking for if we have to
build an HR team which will be successful in the analytics world.
1. Business Acumen and Big Picture Outlook: It is no longer important to understand the HR world; you
are required to understand all the levers of a business. The need is to have a multidisciplinary approach
and even know how the different parts work together and impact one another. The need is not only to
understand and have knowledge of the domain specific to the particular organization, but to know the
industry they are part of. So the industry the model, strategy and objectives of the organization you are
part of, its key issues and its competitors. Strong business acumen helps the HR professional to
effectively translate the businesses strategy into Key Performance Indicators (KPIs), measures and
metrics for supporting strategic or tactical decision-making.
2. Business Statistics: As HR professionals need to work with data and many times summary of data and
testing of hypothesis the ability to understand data is an important skillset to have. Even if one does not
understand everything about statistics, the basis terminology becomes key. Most of the HR analytics,
tools available also makes inferences and predictions based on simple business statistics
3. Data Modeling and Data Interpretation: HR professionals need to have the ability to understand data
and information and be able to get insights from carefully exploring the data. Conceptual thinking ability to
understand higher-level data models with clear causal relationships that can be tested is a key skill for the
HR professional. The capture of information and the flow of the same through various internal systems
need to be understood to make meaning of the same. Basic statistical concepts that include how to
formulate a hypothesis and test them is also important skill set.
4. Analytics Tools and Technology Focus: Using a spreadsheet for analyzing and pivoting data,
visualization of the same ability to read data summary is key to see the underlying pattern in data. Once the
data patterns are understood � knowing tools and software programs, that determine the same and use
that to predict or prescribe future events is important. Additionally, the various software tools available in
the market at a high level and what they do �even if one does not understand the underlying algorithms �
will give an edge to the HR professional.
5. HR Domain Expertise: The HR Professional should have a very deep domain expertise in all HR
processes. This becomes key as the appropriate measures for each of the processes should be taken and
should be looked at it in the context of dependent and independent variables. The domain expertise
becomes important for deriving the right models that need to be used.
What can Organizations do to Drive an Analytics Culture?
Organizations need to look at an enterprise or business in its totality. For business leaders, analytics will come
naturally when it comes to finance or sales but will need effort to understand the same in the context of HR.
Here in addition to the analytics, the story around the same need to be understood and told. One of the early HR
teams to build an HR analytics team within the HR organization was Google. In an engineering culture, to make
the engineers understand HR the language of analytics that they understood was used. Similarly, the analytics
story needs to be told in the context of the organization. The following three things need to be taken care of to
ensure that Analytics culture is there across the organization.
1. Building systems, which are integrated � If needed enterprise data flow need to be integrated and systems
that are standalone should be junked for enterprise level systems.
2. Analytic skill sets should not be concentrated in one department or function (say Finance or Marketing) bit
NHRD Network Journal July 2017 |

16
should be distributed. This means that each of the functions should have an analytics oriented approach
and each of the functions should be looking at analytics in relations to other functions. All employees
should be taught to think multidisciplinary to realize the potential of HR analytics.
3. Move from descriptive analytics to predictive - often companies are happy to be in the descriptive sphere
of analytics and hesitate to move to predictive. Unless you move there you are not using analytics for
impact and decision-making at an enterprise level. Understand the options for various courses of action
and comparing them and taking the most data based/evidence based decision are the value that analytics
can provide with.
Conclusion
The impact of analytics on human resources function as discussed in the article can be summarized as the
following.
a) HR Analytics capabilities are still under-developed in many companies and there is a long way to go before
we are able to fully realize the potential of HR analytics
b) Integration of HR systems with one another is as important as the integration with business objectives to
leverage HR analytics. Integration at the highest level provides the highest benefits from HR analytics.
c) HR Analytics cannot be the solution to all �people problems�. Analytics at best helps us to make decision
based on solid facts. It brings in logic to the feeling part of decisions and hence will be easier to sell to
business partners.
d) Comprehensive redefinition of traditional HR practices by advances in HR analytics due to the impact due
to better connectivity, technology and data science.
e) The HR Professional in an analytics context need to build new skillsets � business acumen, business
statistics, data modelling, data interpretation, analytics tools and deeper HR domain expertise to clearly
understand the interconnections.
f) HR Analytics insights need to be seen in the context of the organization to move to a higher level of HR
analytics (predictive/prescriptive). Else organizations will be at a descriptive level of HR analytics which
results in missed opportunities to drive impact through analytics.
As we have seen, if you know the past very well, you can make better predictions for the future. When you have
understood the past and the various trends you need a good analytics engine. Organizations investing in HR
analytics are thus using their own data to model things so that future scenarios are better predicted and
prepared for. Increasingly HR professionals are recruited for their data management, analysis and
interpretation of data skills too. The number of engineers with HR professional training has increased and the
growth in the service sector has also accelerated the need for better HR analytics. Ability to track and analyse
the impact of various HR programs and HR interventions is made easy with better HR systems. For example
and employee downloading the payslip or taking more casual leaves than he has traditionally done could be
signs of an exit or being nor engaged at work. Once you know that your ability to take appropriate actions to get
the employee to stay and be more engaged at work is no longer something we see in a utopian world. This is
being done by organizations with progressive HR systems already. Also, gone are the days that the HR
business partner is driving transactional aspects when an event occur, but is busy predicting the future events
and taking actions to make that compliment to business goals and outcomes. Unless the analytics orientation
is across the HR function where all the HR processes are constantly evaluated and measured for impact HR will
cease to leverage the analytics advantage.
As analytics moves into the corporate mainstream, organizations that are still in the early stages of adopting
technology and building teams with data skills risk being left behind. In the not-too-distant future, it will
become impossible to make any HR decisions without analytics. Indeed, analytics capabilities will be a
fundamental requirement for HR to effectively support the business. Hence organizations need to quickly
acknowledge the benefit HR analytics brings to make better precise decisions and encourage all people
managers to base their people decisions supported with data and based on data trends.
NHRD Network Journal July 2017 |

17
References
Bassi, L. 2011. Raging debate in HR analytics. People & Strategy, 34(2), 14-18.
Bersin, J., Houston, J., & Kester B. 2014. Talent Analytics in practice: Go from talking to delivering on big data.
Deloitte University Press. Date Accessed: 03/06/2017 URL: http://dupress.com/articles/hc-trends-2014-
talent-analytics/
Boudreau J. & Ramstad, P. 2007. Beyond HR: The New Science of Human Capital, Boston, MA: Harvard
Business School Press.
Davenport, T., Harris, J., & Shapiro, J. 2010. Competing on talent analytics. Harvard Business Review, 52-58.
C. Waxer.2013. HR Executives: Analytics Role Needs Higher Profile,Data Informed, 13 March 2013
Falletta, Salvatore.2013. In Search of HR Intelligence: Evidence-Based HR Analytics Practices in High
Performing Companies. People and Strategy; New York 36.4 : 28-37.
Hansell, S.2007. Google's answer to filling jobs is an algorithm. The New York Times Online.
James C. Sesil.2014.Applying Advanced Analytics to HR Management Decisions,� Pearson Publication, New
Jersey, March, pp. 13-25
Janet H. Marler and John W. Boudreau.2017. An evidence-based review of HR Analytics. The International
Journal of Human Resource Management Vol. 28 , Iss. 1,201
Levenson, A. 2011. Using targeted analytics to improve talent decisions, People & Strategy, 34(2), 34-43.
Sesil. J. C. 2014. Applying advanced analytics to HR management decisions: Methods for selection,
developing incentives, and improving collaboration. Saddle River, NJ: Pearson.
NHRD Network Journal July 2017 |

18
S.Ramesh is a HR professional with 25 plus years of experience as a practitioner
and as a consultant. An electrical engineer from National Institute of Technology
(NIT), Kozhikode, Ramesh completed his master�s in personnel management and
industrial relations from Xavier School of Management (XLRI), Jamshedpur.
Presently he is the founding partner of Culstran LLP, a firm focused on consulting
corporates in the areas of culture, strategy and analytics. He is a trained assessor
in using the PCMM and CII HR models.
Ramesh�s experience spans manufacturing, FMCG and IT sectors. Crompton
Greaves, TVS Whirlpool, Infosys Technologies (more than a decade) and Sasken
Communications are the prominent companies he has worked with. . He has
worked as a location head of HR, head of a section, as well as the head of the
function.
Ramesh has recently co-authored a book called � Winning with HR analytics�.
Published by Sage, this book is one of the best-sellers in the HR space. His blog
on analytics, �HR3by2�, is widely referred to.
S. Ramesh
So you Want to Learn HR Analytics?
About the Author
NHRD Network Journal July 2017 |

19
ften I come across enquiries from younger HR professionals. They have read my stuff and would like to Olearn about HR analytics from me. Some of them even seem to think it is the shiny new tool to transform
their careers. Just as analytics seem to be taking over the business world, so will HR analytics.
This is slightly surprising. Most HR professionals these days have a MBA in HR. Even those who don�t, often
have a background in engineering or science. Most HR professionals also work on Microsoft excel, which gives
one a good orientation to organizing and analyzing data. All MBA programs include an exposure to not only
statistics but also research methods by which a student formulates a hypothesis and analyzes it for results.
Unlike the big data domain which calls for usage of more complex statistics and tools, HR analytics can be kick
started with basics that one would have learnt. Often the challenge facing analytics professionals is not tools,
but reliable data. In HR, there is data available. So what would help HR to start leveraging it?
Let us go through what helps a HR professional to use analytics effectively.
1. Analytical Ability
Often, analytical ability is used as a competency. It is one of the 34 strengths listed under Clifton Strengths
finder, who goes on to define this as � People strong in the analytical theme search for reasons and causes.
They have the ability to think about all the factors that might affect a situation�
Let us look at a tennis match, say between Roger Federer and Rafael Nadal. Assume that Federer has won
in 5 sets. Let us oversimplify for a moment. There are two kinds of analyses possible. One could be
technical �Federer served very well today. He was able to return Nadal�s backhand shots well. And his
strategy of approaching the net worked out well�.
The other could simply say �Wow! Federer!! What a great player. Today he just showed how great he is.
Even though Nadal worked hard as always, it was the flair and passion of Federer that won out�
The first statement can be substantiated with statistics like first serve percentage, winners off backhand
and net points won. It also provides for a baseline for comparison between the players.
The second statement? It ticks all the right boxes. Flair, effort, passion and greatness. But all it serves is to
validate the feelings of the commentator on the players. Other than that there is no insight.
Many well-meaning HR professionals get into this trap. It is not unusual for newcomers to the function to
say when asked �Why do you want to work in HR?� with a response of �I like being with people�.
It is not a straight line from liking people to HR! Unfortunately, the HR professional takes the view that since
everyone else talks hard numbers, she/he should balance it out by focusing on the soft and intangible. In
this process, they adapt the soft and intangible more readily.
What accentuates this is �established wisdom�. Established wisdom consists of research reports and
popular articles. How often have we heard
�He is IIT-IIM.�
�Employees don�t leave companies, they leave managers�.
No doubt, a person going to IIT and then IIM has gone through a ferociously competitive selection
process. Also, he has also been exposed to a couple of excellent institutions. There is no harm in
assuming that you will get a competent person. However, when there are 3 people doing the same job just
the credentials of the person are not sufficient to bestow mythical powers of performance on him. What
matters more are the competencies required from the job and what results the person has delivered.
Everything else may support the outcome, but not the outcome itself.
Employees leaving managers has been around for a while. But CEOs when faced with high attrition, say
people leave managers and so that is where we should focus on. What is the research on this?
So you Want to Learn HR Analytics?
NHRD Network Journal July 2017 |

20
Gallup had published a research report. In 2015, they surveyed a group of people. Around half of the
surveyed sample said that they have quit at least once due to a manager. So, employees do quit because
of managers. But what it also indicates is that employees may leave for any reason; these could not only
be intrinsic reasons like growth prospects, type of work but also extrinsic reasons. Someone may actually
be offering a better job in a better location with a higher compensation. Just by using truisms like �people
leave managers� HR is caught as a function that would rather utter truisms than look at its own data.
Developing and using innate analytical ability is the first step towards leveraging HR Analytics.
2. Examining HR Operating Model
Cascio and Boudreau wrote about the LAMP model that is as below
LIGHTING THE "LAMP”
"The Right Process"
Effective Knowledge Management
(Values, Culture, Influence)
HR Metrics and
Analytics That Are
A Force For
Strategic Change
"The Right Measures"
Sufficient Data
(Timely, Reliable, Available)
"The Right Analytics"
Valid Questions and Results
(Information, Design, Statistics)
Let us take a finance professional. In general, they are able to articulate the cost drivers of their model,
profitability they are looking for and plans they have to achieve the same. They also are clear about what
levers they have, in case the costs need to be cut.
HR functions also have a similar model. However, over time the focus shifts to the process. We review the
process, measure the process and improve it. In all this, we lose track of the logic.
It is held that attrition is bad. HR professionals in service organizations spend hours every month poring
over attrition data for patterns. However, the CEO is not as concerned. She is concerned only when the
attrition is beginning to impact and bring unpredictability to business. A more mature view of HR would
ask the following
� What is an acceptable attrition range in my industry?
� Is my performance unusual for my industry?
� What if I am doing too well on my retention?
All these are legitimate questions. Finally attrition is about the talent supply chain. There is bound to be a
proportion of people leaving the company. However, the bigger challenge for the business is ensuring
continuity and making sure the business is attrition proof.
"The Right Logic"
Rational Talent Strategy
(Competitive Advantage,
Talent Pivot Points)
NHRD Network Journal July 2017 |

21
When the call center industry scaled up in India in the last decade, it was not unusual to have a 100%
attrition rate. Basically one ended the year without a single person who you started the year with. Yet,
these businesses survived and even managed to grow. They could do so, because the replace ability of
skills was high. You can train a person with a script for a week and they would start delivering.
On the other hand, product development companies are very dependent on individual skills. In such an
environment, it hurts even when 10% of people leave.
When measuring attrition, it becomes important to see whether the business goals can be met even with
that churn. For that, understanding the business model is crucial. Another commonly used word is
�High performance culture�. It would be a good exercise for the readers to think what is it that they are
doing to create a high performance culture and whether what they have done (incentives, variable pay,
performance goals etc.) have been adequate to create a high performance culture that differentiates from
competition.
3. Statistics is Interesting
Q1 Q2 Q3 Q4
Beginning headcount 1000 1200 1400 1500
End headcount 1200 1400 1500 1550
Attrition 100 120 100 75
Attrition percent 9.5% 9.3% 6.9% 4.9%
Let us do a simple exercise.
What do you think is the attrition rate for the year?
a. Is it 25.9% or b. 7.65?
Often, people average out the attrition rates to come out with a cumulative figure for the year. So, when
you average the number for 4 quarters, it is just the average attrition rate for a quarter. The rate for the
year is actually a far more worrying 25.9%.
That is as far as averages are concerned. However, the formulae get more complicated as the
criticality of outputs is needed. For example, you are doing the analysis of the employee survey. You
want to identify what attributes contribute most to employee satisfaction. You are required to a
regression to get the outcome. What is the formula for regression?
All those sigmas, used to put us off. Now let us take an even more relevant outcome. We need to
predict the possible attrition risk of a set of employees, given demographic data and past attrition
information. You come across a technique called logistic regression. When you look up, you see this!
NHRD Network Journal July 2017 |

22
In general, this would be head-spinning for anyone. How does one get past this?
It is essential for us to understand the different statistical tools that help us to analyse data. A conceptual
understanding is essential. However, the day when someone was required to manually calculate these is
long gone. Any outcome can be derived as there are technology tools available that can actually provide
us the outputs with the click of a button.
4. Being Hands On; Preferably with Data
HR operating models have created the HR Service center. A place where people work with technology and
at the click of a ticket, send across information. HR generalists prefer face time with managers. If
computer time is required, it is spent on making presentations and responding to emails. With time, it is
just chat tools, social media and presentations.
I may be exaggerating it here. There are solid HR professionals who are not fazed by data. But the majority
still looks at data as an evil that has to be tolerated. Whatever hands-on work a person does gets handed
over to juniors and analysts when they start managing people. There are meetings to be attended to!
What happens in this process is that the professionals lose the skills they had in reviewing and analyzing
data. The older model of asking an analyst for outcomes on some clearly defined queries holds good.
However, increasingly the world is about competitive advantage provided by access to data. Starting
from simple MS Excel, the possibilities of analysis are available at finger tips. Packages like Tableau help
with quick visualizations. It is very easy today to use a few commands and get trends and other important
insights without having to rely on another person. The future HR professional should be savvy with hands
on data analysis.
Somewhere one comes across the coding challenge. Should the HR analytics person be able to code? Or
write some scripts for R to get outcomes? There is no doubt that it helps to learn coding, whatever one�s
specialization may be. However, some love it and some don�t. It helps to understand writing scripts and
there are many useful resources too. But the choice lies in the hands of the busy HR professional.
Useful Resources
As is wont these days, the most relevant tools are available on social media. This is a great place to get started with.
Twitter:
While HR analytics is a niche� field there are many influencers in this domain. If you are on twitter, you can follow
Dr.Kuldeep Singh (@ksingh99)
John Boudreau (@johnwboudreau)
Patrick Coolen (@patrickcoolen)
David Green (@david_green_UK)
Science for work (@scienceforwork)
Alec Levenson(@alec_levenson)
Richard Rosenow( @Richardrosenow)
Jeremy Shapiro(@hrmetricsguy)
Talent Analytics(@talentanalytics)
Obviously, you start following one, the nature of twitter will ensure you will start tracking other domain experts.
The people mentioned above are all active on Linkedin also. Of course, the real big influencer in HR analytics
and technology is Josh Bersin. You can join some of the groups dedicated to HR analytics. The most important
one is HR metrics and analytics forum, where many relevant posts are made. Arun Krishnan makes a lot of
basics clear too.
NHRD Network Journal July 2017 |
23
If you have to follow one person, it should be the prolific David Green mentioned above. He not only shares the
latest research, but also curates some very popular lists, including the best HR analytics articles and blog posts
published every six months.
Manoj Kumar, the HR analytics expert from Bangalore has an informative blog called � Talking HR Analytics�.
But these days, one may be just looking at videos for gaining knowledge. If you are so inclined, there are a few
videos on youtube that would help you get started.
� HR Meets Science at Google with Prasad Setty
� Strata Jumpstart, � Using People analytics to drive HR strategy and action�. Kathryn Dekas
In addition to this, there are many other videos put up by product companies offering solutions. Each of these
offers an interesting perspective.
There are a few chosen on-line programs as well. Jigsaw Academy offers an on-line program covering different
facets of HR analytics. ( The author contributed to it). Wharton offers a concise program on HR Analytics
through Coursera that talk about possibilities.
There are several programs on Coursera/ EdX etc. that talk about using tools like XL, SPSS etc. These can be
chosen on the basis of the users comfort level.
Then we come to books. Again, I would recommend you to do a scan on Amazon and buy on the basis of review
ratings. Books offer one or more of the three.
� A conceptual model. A book like � The New HR Analytics� by Jac Fitz Enz is based on the HCM model he
has developed.
� Perspective on usage of analytics across different domains of HR. A book like � Winning with HR
Analytics� is based on this theme.
Experiences and case-studies on implementation. A book like �The Power of People: Learn How Successful
Organizations Use Workforce Analytics To Improve Business Performance � by Nigel Guenole, Jonathan Ferrar
and Sheri Feinzig promises this. The most popular of this genre of course is �Work Rules: Insights from Inside
Google That Will Transform How You Live and lead� by Laszlo Bock.
But finally, there is only so much one can learn from HR. A truly open perspective on analytics and more
importantly analyzing human behavior can be had from the following � Must Read� books.
� �Predictably Irrational; The hidden forces that shape our decisions� by Dan Ariely.
� � Thinking fast and slow� by Daniel Kahneman
� �Rise of the robots; Technology and the threat of mass unemployment� by Martin Ford.
So, one video a week, one article a month and a book a quarter, aided by a few tweets should get you started on
this journey.
NHRD Network Journal July 2017 |

24
Employee as a Nuanced Subject: Statistical Reconstruction as Typology Building for Managing AttritionAbout the Author
Srinath Jagannathan completed his Fellow Program in Management from Indian
Institute of Management Ahmedabad and has worked in Tata Institute of Social
Sciences, Mumbai before joining IIM Indore. His teaching interests are in the areas
of Organisational Behaviour, HR Analytics and Qualitative Methods. His research
interests are in the areas of organisational wrongdoing, violence and workers'
experiences of insecurity and injustice. His work has been published in leading
journals such as Journal of Business Ethics, Organization, Culture and
Organization, and Critical Perspectives on International Business. He wishes to
advance the domain of critical management studies by problematising the tenets
of management theory and practice which lead to experiences of injustice and
violence.
Dr. Srinath Jagannathan
NHRD Network Journal July 2017 |

hen an employee leaves an organisation, a narrow imagination tells us that a resource has left the Worganisation. What is a resource? A resource is the grammar of structuring different inputs into an
analytical or a material output. But in a broader imagination, an employee is much more than a resource. Even
when an employee with only minor implications leaves an organisation, and if there has been unpleasantness
while such an employee left the organisation, it is difficult to forget the employee immediately. The employee
lingers on in terms of conversations, possible reflections, prohibitions and silences.
But an employee is also something more than a memory. I argue that in terms of being a nuanced subject, an
employee is a puzzle. She is constantly asking her manager or the Human Resource (HR) professional in her
organisation a simple but deep question � do you know me? In an analytic sense, an employee can perhaps not
be known as an individual. However, it may be possible to know the employee as a typology.
Again, in terms of typology, I am not referring to aggregations of personality or values. Typologies are layers of
difference brought together to embody an interpretation. This is the interpretation of the intersection of
individual employees with larger organisational atmospheres. Typologies provide a mirror to organisations to
enable them to witness the kind of employees they are structuring. In the context of an employee leaving,
typologies should enable organisations to interpret what has occurred in behavioural terms.
The leaving of an employee is an emotional-cultural-cognitive complex being affected. Something in this
complex has not worked out as desired. Organisations need to assess what has been affected to understand
the leaving of an employee. Such behavioural analysis is likely to strengthen the resilience of organisational
communities. Community implies the ability to integrate differences on the basis of knowing where
convergences lie.
Statistical imaginations are usually imaginations of correlations. They imply that the presence or absence of
some factors are associated with the occurrence of some other events. In an analytic sense, it may be useful to
go beyond such an imagination and look upon statistics as an act of reconstruction. Using data that is
available, it is useful to reconstruct indicators as symbols of the construction of subjects. Subjects are stitched
together using a network of symbols, and it is necessary to understand these networks in order to make sense
of why subjects leave.
The leaving of a subject is neither an individual random act nor is it a cemented linkage between a specific
factor and an employee�s cognition. Often, the act of leaving is assumed to be linked to a trigger in the
employee�s life or career or an organisational event. But the trigger is only an excuse, a symptom for the
breakdown of some element of the emotional-cultural-cognitive complex of the organisation. The act of
leaving unmakes the potential of organisational community. On the other hand, the remaking of the
organisational community implies the ability to make narrative sense of what has broken down and nurturing its
repair. In this article, I discuss an analytic strategy involving factors, texts and clusters that can interpret the act
of an employee leaving to repair, nurture and remake the relations of organisational community.
Factors as Cognition-FragmentsIt is useful for organisations to generate behavioural and performance indicators about employees at a regular
frequency. When these indicators are collected in a quantitative format, it becomes necessary to aggregate
these indicators. For instances, if the performance of a middle manager were to be assessed, it is useful to rate
the middle manager around at least four indicators. One indicator can be whether the middle manager is a good
interface between top and operational management. Another can be whether the manager is able to assess the
applicability of new ideas well.
Employee as a Nuanced Subject: Statistical Reconstruction as Typology Building for Managing Attrition
25NHRD Network Journal July 2017 |

26
A third indicator can be whether the manager is able to energise people around him/her. A final indicator can be
whether the manager is able to demonstrate clarity and commitment in moving forward quickly with respect to
tasks that need to be completed. The organisation can collect data from senior managers to whom middle
managers report. The data can be in a numerical format, on a scale of one to ten or any other scale preferred by
the organisation. Even if the data is not used as a part of formal performance appraisals, it is useful to have a
quantitative track of the performance of managers.
While there might be several performance indicators, it is useful to see whether these indicators can be
aggregated. The data of all middle level managers pertaining to all the indicators can be subjected to a basic
statistical technique known as factor analysis using principal component method. The factor analysis yields
three pieces of information. In the first instance, it tells us whether the different indicators can be aggregated as
a single construct. In the second instance, we can get to know what proportion of the construct is measured by
the given indicators. In the third instance, we can understand the relative weights of the different indicators.
Thus, factor analysis can help us in creating aggregate performance indices for each employee in the
organisation. In addition to performance indices, in the context of attrition, it is also useful to collect data from
peers and team members. For a middle level manager, it may be useful to collect data on at least three
indicators. The first indicator can be whether the manager has been talking about the positive aspects of the
culture in other organisations of late. The second indicator can be whether the manager has become more
formal in her/his interactions with others. The third indicator can be whether the manager has been describing
how well her/his MBA batch mates are doing in their career of late.
In the context of middle level managers, these indicators represent the degree of resonance of a manager with
her organisation. Managers tend to nostalgically reflect on the success of others and valourise entities outside
the organisation when they feel that their connect with their organisation is weakening. On the other hand,
when managers deeply resonate with their own organisations, they cherish their embeddedness in their
organisations. Their talk then reflects challenges and opportunities that the organisation is facing. They want to
find mechanisms about entrepreneurially contributing to the evolution of the organisation.
Again, the indicators pertaining to resonance or dissonance can be subjected to factor analysis to find out
whether they can be aggregated. Organisations serious about engaging with attrition in a reflective manner
must thus collect numerical data about the performance of employees and the extent to which they resonate
with their organisation. Then, using factor analysis, these data can be aggregated to construct two indices for
each employee in the organisation. One index will indicate the performance of an employee while another will
indicate the extent to which the employee resonates with the organisation. The reason for constructing both
these indices is to create a profile of employees rather than attributing causes to their performance or
resonance.
Both these indices embody cognition fragments of employees. Performance draws to a great extent from
cognitive effort. While dissonance may appear to be an emotional response of employees, it actually embodies
an employee�s perception about the utility of exerting effort within the organisation. When employees
cognitively sense how their efforts lead to organisational outcomes, their sense of dissonance decreases. In
bureaucratic organisations, employees are often disenchanted because they are unable to see their cognitive
efforts translate into organisational outcomes.
Text as Cultural FragmentsIt is useful to integrate insights about employees from qualitative comments that are made about them. These
qualitative comments may be a part of appraisals or other organisational processes. A textual analysis of these
comments can be useful in understanding how employees relate to the social field of an organisation. One of
the insights that we need to draw from the qualitative comments is the potential of an employee to contribute in
creative terms. Creative employees embody a sense of romantic energy and action inside organisations.
In textual terms, the software DICTION (http://www.dictionsoftware.com/) provides an understanding of the
creative potential of employees based on qualitative descriptions about them. Activity is a master variable in
NHRD Network Journal July 2017 |
27
DICTION that embodies the extent of creativity and action that a person or an entity is engaged in. The
statistical score of Activity is computed using narrative extracts and provides the magnitude of creativity and
action involved. Creativity is an index of the contextual change that employees can produce in terms of their
organisational work. Even more than trust and empathy, creativity keeps the humanity of an organisation alive.
Another master variable of DICTION that is useful for understanding employees is Commonality. Commonality
helps in constructing a statistical index from narrative extracts that provide information about solidarity,
togetherness, cohesiveness and cooperation. Employees with high commonality scores are deeply
embedded in their organisations. When they leave, they create narrative voids that are difficult to fill inside
organisations. Organisations are as much about being story telling artefacts as they are agencies for the
performance of technical outputs.
The technical outputs of organisations are a part of stories being told by organisations. These stories rely on the
creativity that employees bring into their jobs. They also rely on the ability of employees to connect with each
other inside organisations. Our ability to relate to each other inside organisations leads to unexpected
discoveries. It is our relations with each other that lead us to being co-opted into organisational projects that
are not planned in advance.
Accessing the Activity and Commonality scores of employees is thus a way of understanding how creativity is
being processed inside the organisation. Attrition and creativity can have deep linkages with each other. When
the space for creativity diminishes inside organisations, already a deeper form of attrition has commenced.
Employees may only be mechanically present in an organisation. They may not mobilise a deeper form of
engagement which transforms the actions and outputs of the organisation in significant ways.
Constructing the Nuanced EmployeeAs I have argued that an employee leaving the organisation embodies a breakdown of the emotion-cognition-
cultural complex of the organisation. In order to statistically reconstruct the nuanced employee, it is useful to
adopt a cluster analysis approach where key employees, such as middle level managers are clustered around
some themes. In this note, I have discussed four key attributes of key employees such as middle level
managers. These indicators relate to their performance, resonance, creativity and embeddedness in
organisations. It is useful to understand how employees relate to these indicators within organisations by
employing an analytic strategy known as cluster analysis, which groups employees in terms of the indicators.
It is possible that a group of employees may show high performance and creativity, may be highly resonant and
deeply embedded in organisational realities. These employees are resonant embedded champions. When a
resonant embedded champion leaves the organisation, unless the organisation has created processes where
new pools of employees are constantly becoming resonant embedded champions, it indicates the
organisational breakdown of cultural evolution. The organisation has stopped evolving as a culture. Instead,
the organisation has become an anti-cultural space where individuals fend for themselves.
Another group of employees may show high performance and creativity, be deeply embedded, but may be
dissonant with respect to their organisations. These employees are dissonant embedded champions. The act
of a dissonant, embedded champion leaving the organisation indicates the inability of the organisation to
enchant its employees. Only those organisations can be enchanting where employees face meaningful
professional challenges. When the sense of professional challenge disappears, it becomes very difficult to
transform dissonant employees into resonant subjects.
Another group of employees may show high performance and creativity, be resonant but disembedded in their
organisations. These employees are resonant, disembedded champions. When a resonant, disembedded
champion leaves the organisation, the organisation faces the crisis of failing to create a sense of community
among employees. If employees engage with each other with a sense of community, soon disembedded
employees can be brought into cultural pockets of the organisation. In the context of these cultural glues, it
may become easier to transfer tacit knowledge among employees and initiate organisational transformations.
NHRD Network Journal July 2017 |

28
Another group of employees may show high performance and creativity, but may neither be embedded nor be
resonant with respect to their organisations. These employees are dissonant, disembedded champions. When
a dissonant, disembedded champion leaves the organisation, it reflects the organisation�s inability to engage
with employees who may bring their own eccentricities into their work. The space for eccentricities in an
organisation reflects its ability to accommodate difference. Human beings are seldom perfect, and
organisations need to remember that the quest for behavioural perfection may merely be a romantic
imagination.
Another group of employees may show low performance and poor creativity, but may be resonant and
embedded in their organisations. These employees are resonant, inerts. When a resonant, inert leaves the
organisation, it reflects the organisation�s failure to cognitively transform the performance of organisations.
Employees may go through phases where their contributions to organisations are not optimal. If the
organisation is unable to energise employees to perform better, there is a cognitive breakdown of the
organisation in failing to provide employees with resources and capacities to excel.
Another group of employees may show low performance and poor creativity, and may neither be resonant nor
embedded in their organisations. These employees are dissonant, inerts. When a dissonant, inert leaves the
organisation, it reflects an organisational atmosphere where cultures of peer support are no longer active. In
organisations driven by strong peer cultures, employees are immediately mentored to ensure that they do not
slip into the mode of becoming dissonant inerts. When employees are caught up in performing for the
organisation in highly individualised ways, they may not be able to reach out to their colleagues to help them.
ConclusionI hope to have shown that an employee leaving an organisation may not embody a simple narrative, but in fact
may reflect a nuanced subject. In several ways, they embody a cognitive-cultural breakdown of the
organisation. Unless organisations repair these breakdowns, they may not be able to address the cause of
future attrition. These future attritions will only lead to further breakdown of the organisation. This then leads to
the question of whether all separations embody breakdowns.
Indeed, all separations which are unplanned and not contingent on personal factors, reflect organisational
breakdowns. Unless organisations pay attention to statistically reconstructing employees as nuanced
subjects, they will be chasing simple explanations for employees leaving them. This is unlikely to regenerate
the organisation in significant ways. Organisations need to be aware that their cultural-cognitive spaces
produce employees in complex ways. They need to analytically intervene to constantly remake their cultural-
cognitive frameworks in energetic and evolutionary ways.
NHRD Network Journal July 2017 |

29
Performance (Aggregate Index from Factor Analysis)
Creativity (Text Analysis Index Generated from Narrative Extracts)
Employee as Champion or Inert Employee
Themes Emerging from Cluster Analysis Organisational Implications of Attrition
Resonant Embedded Champions Organisation has stopped evolving as a culture
Dissonant Embedded Champions Organisation�s failure to enchant employees
Resonant Disembedded Champions Organisation�s failure to create a sense of
community
Dissonant Disembedded Champions Organisation�s inability to engage with
eccentricities of employees
Resonant Inerts Organisation�s failure to cognitively
transform performance of employees
Dissonant Inerts Organisation�s atmosphere of lack of peer support
Degree of Resonance
(Aggregate Index from
Factor Analysis)
Resonant or Dissonant
Employee
Degree of Embeddedness
(Text Analysis Index Generated
from Narrative Extracts)
Embedded or
DisEmbedded Employee
NHRD Network Journal July 2017 |

30
Subhashini Sriram leads the HR function for Unisys India,
GDC China & Philippines. In Unisys, she has led the team on a transformational
journey of adding strategic value to business through an indigenous Integrated
Talent Management framework and HR analytics playbook, connecting HR
metrics to business performance.
Subhashini Sriram has about 20 years of experience in varied industry segments,
cultures, and organizational set ups. She has played key leadership roles in driving
organizational change, merger & acquisition, diversity & inclusion, corporate
social responsibility and employer branding. Prior to Unisys, Subhashini worked
for majors such as Northern Trust, Perot Systems and Royal Philips.
She is a recipient of a few Industry awards on innovative HR practices.
She is an active member of the NASSCOM HR leadership of Bangalore Chapter
and a guest faculty at NMIMS, Bangalore Management School.
She holds a Post Graduation in HR from Delhi University and a General
Management Program from IIM, Bangalore
Subhashini Sriram
HR Playbook � A Higher Order Analytical Tool
About the Author
NHRD Network Journal July 2017 |

31
uman Resources (HR) has always been perceived as a �people� function whose value, though integral to Hthe functioning of the organization, is largely intangible. For business leaders with vision, this intangibility
hardly ever presented a problem since they were intuitively cognizant of the fact that any business is only as
good as the people behind it. And that the responsibility of managing them in an ethical and humane manner
while furthering business ends was ultimately borne out by HR. However, as businesses grow increasingly
global with complex hierarchies, automation creeping in and competition getting fiercer than ever, there is a
palpable need for the function to showcase its results in concrete terms.
Fortunately for us, the days when the impact of a function like Human Resources was deemed a largely
intangible value addition to the business seem to be long past. With reporting and analytics tools in hand, HR
leaders now have the wherewithal to show exact metrics to track the tangible contribution of HR to business.
An HR leader who is looking to demonstrate the immense impact of HR must delineate performance in
concrete ways to focus on three core aspects:
� Set metrics to measure the performance of each HR sub-function
� Link the HR metrics to business performance through a HR play book
� Use analytics effectively to study trends and be able to predict the future of the business in a
particular niche
Leveraging HR metrics and analytics, then, goes even beyond a showcase of tangible value addition to
business results. Leaders who adopt these tools are able to better articulate the strategic value of this function
and rightfully earn a seat in the boardroom.
HR Vitals – Human at Core, Tangible in Impact
It is critical for HR leaders to introspect and validate the existence of every function. Once we start measuring
and reviewing each HR function, we can clearly call out the functions that contribute to business and those that
are redundant. Let�s take talent acquisition as an example. The key measure of value in a talent acquisition
function is cost per hire, quality of hire and timeliness of the hire. Additionally, many other elements contribute
to these �vitals,� that also need to be tracked. For example, cost per hire is a function of cost of resources, cost
of processes and cost of technology associated with every single hire. Quality of hire is a function of
performance, productivity and longevity of the resource joining the organization.
Intalent management, the critical measures of value are performance, productivity, pyramid management and
attrition. In talent development, on the other hand, the key metrics will include percentage of promotion, cost
advantage of internal promotion, percentage of talent ready for deployment and percentage of talent that is
future-ready.
Traditionally, HR leaders have been capable of exceptional people management and strategy, but have mostly
failed to call out their �measures of success� in the form of concrete metrics. Many leaders are now waking up
to the significance of having �HR metrics� in the same vein as business metrics to show tangible outcomes.
Though highly undeserved, failing to show tangible �measures of success� puts HR function under scrutiny
and often labelled as a �non-valueadding� function. Identifying and measuring a set of �HR vitals� metrics not
only proves the worth of the function, but also ascertains the impact of the function on business beyond the
scope of doubt.
HR Playbook � A Higher Order Analytical Tool
NHRD Network Journal July 2017 |

32
A sample format of the “HR Vitals”is given below:
Contrary to the traditional perception, most HR processes or programs can actually accommodate analysis
through metrics for tangible results. Of course, being a �human� function, at the end of the day, there will always
be intangibles in HR. However, with the tangible and the intangible put together, most of the value can be
ascertained in fairly concrete terms and provide a holistic view. One without the other can sometimes fail to
narrow down the issue or challenge or benefit we are trying to showcase. To cite a crude example, attrition
analysis can show that 65% of employees who wore pink shirt on Tuesday and 40% who wore blue shirt on
Thursday left the organization within 6 months. But to know �why� the pink shirt and blue shirt left, we need
human interpretation.
There are endless examples of effective use of analytics in deeper areas of HR. Let�s say that we want to
measure the success of our sourcing channels which forms the critical part of the overall sourcing strategy.
One way to measure the efficiency of the sourcing channels would be to take the data of all hires in a period and
measure the individuals� performance, productivity, salary and longevity by the respective sourcing channel.
Outcome of this analysis will help identify the most effective sourcing channel. Same can be done to analyze
the effectiveness of the sourcing mix of hires.
A sample format is depicted below:
Q4'17
Actuals
Q3'17
Actuals
Q2'17
Actuals
Q1'17
ActualsMetric Category
Plan / Target /
Benchmark
Acquisition
Cost per hire $
Time to fill Days
Quality of hire %
Talent Management
Performance %
Productivity %
Chargeability %
Promotions %
Positions filled internally %
Attrition %
Sourcing Channels
Job portals
College hiring
- -
Sourcing Mix
Indian companies
Captive units
Small and medium enterprise
Salary Hired Productivity Performance Attrition
NHRD Network Journal July 2017 |

33
HR Playbook � The Pulse of HR Vitals in Business PerformanceMetrics and reports, no matter how exhaustive, become meaningless if they are not linked to business
outcomes. It is imperative that the tool has the scope to show the impact in business performance due to
variations in HR vital metrics. Developing a playbook that connects the vital metrics to the P&L of the company
gives the function the final boost. An effective HR Playbook should bring all volatilities together and be able to
link it directly to financial performance.
It should also be an effective tool to model �what if�scenarios, such as:
� If there are new statutory regulations that has expense implications, the tool should be able to ascertain
the dollar impact to the business
� If internal promotions are below the target percentage,what is the estimated dollar impact for external
hiring?
� If we do not hire a sales person on time, what will be the dollar impact on top line?
� If employees� leaves are higher or lower than the plan what impact does it have on the financial
performance?
� If bench size increases/decreases what could be the tangible and intangible impact to the business?
� At what percentage will attrition yield optimum result to business in terms of dollar value etc.?
�Vital few� dashboard is a reactive tool that measures performance posthumously. A well-developed play book
can become a proactive predictive tool. It can enhance business leaders� capability to predict financial impacts
and take proactive measures. Let me explain through a few illustrations on how the play book is used in an IT
services industry.
Illustration A: Attrition has a direct link to the �cost of resource per hour� metric. The play book can help
leaders understand the intensity of the impact and get prepared with proactive actions. Given below is the
impact on �cost of resource per hour� due to a 12 % or 5% attrition ( represented in $ )
NHRD Network Journal July 2017 |

34
Readers can observe in the above example that at 5% attrition the cost per hour is at $8.12 and increases to
$8.22 when attrition increases to 12%.
Illustration B: Unplanned absenteeism by employees has a negative impact on the cost per hour measure.
This impact of �Unplanned leaves�, availed by employees, on the productivity of employees is clearly thrown
up by the play book. Higher productivity yields reduction in cost. At 75% productivity the cost per hour is at
$10.04 and when productivity increase to 90% the cost per hour decreases to $8.05. Adoption of the play book
approach can significantly help managers to track their team�s productivity.
A mature HR playbook should have all measurable people elements connected to the financial performance of
the company. Promotion %, cost per hire, training cost , leaves taken , benefits changes, salary increases etc.,.
any/every HR metric should be connected to the financial performance, helping leaders understand the impact
of any change. The play book enables leaders with differing analytical capabilities, to predict business
performance more accurately thus offering a �managerial performance level� assurance.
Predicting the Future -Crystal-Gaze to Stay in the Game!In a bullish, highly volatile, competitive market, the bigger challenge for current business leaders is their ability
to predict their future business performance. HR analytics tools can play a huge role in helping HR leaders
predict the people strategy to support the business in the future. Most organizations currently use statistical
tools to churn internal employee data to predict their behavior, motivation, attrition etc., With increasing
presence of employees on social media, HR leaders are expected to understand their �social�personalities,
over and above the �physical� personalities at office to predict behaviors. Organizational behavior, too, has
gone beyond organizations and well into the virtual space where most organizations are now consciously
trying to maintain a distinct personality and interact digitally with both their employees as well as other
businesses and the world at large. Future HR leaders will be expected to have a good understanding of the
impact of global social, economic and political changes on their internal metrics and business performance.
The writing on the wall is now distinct that HR leaders who are still in reactive reporting mode could soon find
themselves outmoded and those who want to stay in the game must have a broader and deeper futuristic
outlook based on tangible data. The time is ripe for HR leaders to start stocking their shelves with predictive
tools to serve the business needs of now and future.
NHRD Network Journal July 2017 |

35
Poornima is a sales and marketing professional with hands-on experience in
working with niche software product companies. She is a B.E with an MBA and a
certified Digital Marketer. In her short career, she has worked in multiple facets of
Sales and Marketing ranging from business development and sales, to marketing
strategy and brand building; and played an instrumental role in building sales and
marketing teams and processes from scratch. Currently she is associated with
JaMocha Tech and manages the marketing and business development initiatives
for ProHance � An enterprise workforce analytics platform for improving employee
productivity and efficiency.Poornima RajanThakur
Productivity Tools: Fitness Band for Workplace Engagement?
About the Author
NHRD Network Journal July 2017 |

36
Overview
or organizations to be successful, it is important for them to build a culture of highly engaged and Fproductive employees. Employee productivity is an assessment of the efficiency of an employee w.r.t. their
work output. Highly productive and engaged employees are driven by 6 guiding principles - connect, shape,
learn, stretch, achieve and contribute.
As per the latest Gallup Employee engagement statistics, only 13% employees worldwide are engaged. When
organizations today are devising strategies on keeping their employees engaged, as per Gallup it is surprising
that these numbers haven�t improved over the last few years. This is an eye opening scenario that organizations
should take seriously because there appears to be a huge gap between the engagement strategies that
organizations are deploying versus the expectations of the employees. Low Workforce engagement levels are
a serious concern for organizations and leads to attrition, absenteeism and loss in productivity � all these being
expensive costs to the organization.
Reasons for Employee DisengagementThere are many reasons why employees today are disengaged from work
1. Job Satisfaction and Growth � This is the primary reason for disengagement at work. Employees may
not be happy with their work profile and find it boring and stagnant. With the growing millennial workforce,
creating a culture of creativeness and innovation also becomes important. Employees want their work to
matter and see growth in their opportunities at work. When organizations do not pay attention to this need,
it results in employee disengagement at work.
2. Lack of Communication � The leadership team is responsible for defining goals and expectations for the
organization and this should be communicated clearly to all the employees. It is important that employees
understand how their work impacts the business. Additionally, companies should encourage a culture of 2
way communication and provides employees a platform to express their ideas and concerns. Lack of
such communication methodology may lead to employees underperforming and cause disengagement.
3. Rewards and Recognition � One of the most important factors that contribute to employee engagement
is work recognition. Appreciating good work motivates employees to do better and these employees look
for long term growth and commitment within the organization. Lack of appreciation and reward from the
top management are one of the top reasons for employee disengagement.
4. Limited Learning opportunities � Engaged employees look for opportunities to upgrade their existing
skills or learn new skills. Organizations that do not have a concrete learning programme year on year
would result in losing some of their most engaged employees.
What should Organizations do?Effective engagement strategies should be devised to counter all these factors. The first step to tackle
employee engagement and productivity issues is to understand the gaps in the organization, resulting in low
productivity and engagement levels. Current processes in most organizations rely on manual collection of data
or do not have mechanisms present to understand engagement levels. What organizations need is an
automated tool that can provide factual objective data that helps measure engagement levels and help
understand current productivity.
Workforce productivity platforms can play a key role in providing visibility and improving productivity and
engagement levels. Most of the productivity platforms work on a SaaS based model that do not require
Productivity Tools: Fitness Band for Workplace Engagement?
NHRD Network Journal July 2017 |

37
significant initial investment and have a high ROI. Productivity tools are like Fit Bits to an organization that
measures all aspects of time and output, for instance productive and non productive hours, time utilization,
overtime, time leakages, efficiency levels, skill and competency levels, and effort v/s results. Visibility on these
parameters equips organizations to bring in required changes in their processes that lead to improvement in
overall organizational efficiency.
Productivity tool scan help organizations in various ways. Some of these are:
1. Improve Time Utilization
All organizations have their own set of expectations on productivity depending upon their work culture.
Most of the times, this expectation is not met. One of the biggest reasons why they would not be achieving
this is because of time leakages and employee distractions during work. As per the Career Builder Survey
following distractions at work act as productivity killers � mobile phones/texting, internet, gossip, social
media, emails, coworkers dropping by, meetings, snack/tea breaks, and noisy coworkers. Unfortunately,
it takes about 4 minutes for employees to recover from any of these distractions that leads to a substantial
loss of time when accumulated across employees. Productivity tools provide an efficient way in
understanding time leakages on various activities and its impact on the overall time spent. It also gives an
idea to the top management if these leakages are justified. Hence, productivity tools provide great insights
to help organizations take course corrections to improve productivity.
2. Enable Telecommuting
With travel taking away most of the work time, organizations are open to provide flexi working hours and
telecommuting to their employees, without impacting business. Even though some organizations have
taken a step towards providing employees with telecommuting and flexible hours, the others haven�t been
able to implement it because it comes with its own set of challenges. The main challenge is to manage
remote workers and ensure the quality of their deliverable is not affected by not being in office. Hence,
companies end up micro- managing work from home employees that also sometimes proves counter
�productive. With productivity tools, organizations can get a real time view of their work activities and can
refrain from spending significant time on ensuring that work is happening. This provides a win-win
situation for employees and organizations alike as it improves employee engagement and enhances
productivity.
3. Drive Lean Transformation
Many organizations today are driving lean initiatives to create a high performance culture and position
themselves as a competitive player in the market. This can be done by minimizing inefficiencies and
creating baselines for work processes. Productivity tools can play an important role in discovering and
providing great insights into performance analysis, churn analysis, work pattern analysis and competency
analysis. Organizations can use this powerful data to optimize their processes and remove inefficiencies.
4. Predict Absenteeism and Attrition
Any organization would like to retain their top talent. Productivity tools can give visibility on productivity
patterns and trends that will help organizations understand if an employee has started showing signs of
disengagement. Such employees may show high levels of distraction and absenteeism. With productivity
tools, organizations can discover such behavior early on and devise their retention plan accordingly.
5. Improve Work Life Balance
More hours at work does not always mean high productivity. A 2015 report by OECD shows data on the 35
most productive countries. It is surprising to note that Luxembourg that has only 29 average work hours in
a week is the most productive contributing $93.4 to the country�s GDP on a per hour worked basis while
Mexico that had the longest workweek of 41.2 hours contributed to only $20.3 to the country�s GDP on a
per hour worked basis. With visibility on time and productivity parameters, organizations can work
towards improving these KPIs instead of encouraging a culture of working late. This helps in establishing a
culture of accountability and engagement; and improves work life balance.
NHRD Network Journal July 2017 |

38
Prior to implementation, organizations should take required measures to ensure that employees are aware of
the business objective for deploying such a tool and address their initial biases and concerns. Some of the
things to be kept in mind are:
� Be Transparent with your employees � if you are monitoring them, let them know. Ensuring transparent
communication on the objective of implementing the tool will go a long way in contributing to the
acceptance of the tool within the organization
� All employees don�t work alike � hence expecting a common work pattern across will be unrealistic.
Instead of looking at data points individually and highlighting gaps, look at the time spent w.r.t. work
output. This will give a more meaningful analysis on the performance of the employee
� Set clear objectives and goals and what is to be achieved in the stipulated period of time.
While it is key for organizations to realize the benefits of deploying a productivity tool, it is equally important to
choose the right one as well. There are many time tracking tools available in the market that allows only manual
time capture, data from which cannot be measured and analyzed to understand trends. A productivity tool
should encompass aspects of both time and productivity measurement. Having a system that is automated
helps capturing meaningful data that helps managers and top management understand current lags and take
business course corrections. Productivity tools cannot work in silos and should be closely integrated with
other enterprise solutions like HRIS and Work flow management systems to ensure holistic data presentation.
Most importantly organizations should look at tools that are non intrusive and keeps employee data privacy in
mind. The productivity space is an evolving ground and tools that keep pace will continue to maintain relevancy
and add value to organizations. Some of the trends that we are seeing are � Gamification (individual goal setting
and designing reward programs around it), Predictive Analytics and Forecasting (predict work patterns to
empower managers to understand what to do next), and Automation (identify processes that can become
efficient by automating).
How ProHance has Helped OrganizationsProHance is one such productivity tool that provides rich insights to managers and top management on
employee work style and work patterns. It helps organizations understand and improve employee productivity
and performance. Spread across more than 50 customers in 9 countries, ProHance customers have
experienced an improvement of about 15 � 30% in their overall productivity in less than 6 months. Most of our
customers lacked visibility to understand how productive and engaged their employees are and did not have
any factual data to set such bench marking standards.
At the time of ProHance implementation, it was observed that most of our customers were getting only about 4-
5 hours of productive work as against the norm of 7 � 7.5 productive hours. This gap was because of time
leakages, non conformance and lack of schedule adherence. Through ProHance, organizations were able to
drastically cut down on all the gaps and gain time to improve productivity and efficiency. After ProHance
deployment, our customers experienced the following improvements:
� 30 � 35% increase in work time.
� 15 � 20% reduction on time leakages and distractions like unplanned meetings/sessions, work reviews
and breaks
� 25 � 30% time utilization improvement which meant that employees were able to manage their time and
prioritize their work better and
� 50 � 75% reduction in overtime
We have seen that these improvements over a period of time have positively impacted organization profitability
by 5-10%. ProHance�s user friendly dashboards provided our customers global visibility on employee work
pattern and output, helped improve time efficiency, allowed better capacity and utilization planning, provided
real time insights to enable decision making and helped gain financial and competitive edge in the market.
NHRD Network Journal July 2017 |

39
ConclusionThere is no doubt that productivity and engagement go hand in hand � achieving one will lead to the other. A
highly engaged employee would be � someone who understands the business objectives and aligns their work
to that, contributes back by putting in the stipulated hours of productive work, knows how to prioritize their
work that matters to the business most, shows high levels of time utilization, low levels of distraction, and high
quality of work. Even though organizations may find it easy to spot their high productive and engaged
employees, what will be tough would be to maintain these engagement levels, retain such employees and spot
disengaged ones.
It is important to note that engaged employees are not born overnight. It is a continuous process and a
successful amalgamation of a good business and a good talent strategy. So to summarize, organizations
should as a first step understand current levels of workforce engagement, select a productivity tool that meets
their business objective and can play a part in their journey to improve productivity and engagement, and use
this as a basis to strengthen their future employee engagement strategies.
References:Worldwide Employee Engagement Crisis � Gallup
http://www.gallup.com/businessjournal/188033/worldwide-employee-engagement-crisis.aspx
Aon Hewitt Report http://www.aon.com/attachments/human-capital-consulting/2015-Trends-in-Global-
Employee-Engagement-Report.pdf
Career builder Survey �
http://www.careerbuilder.com/share/aboutus/pressreleasesdetail.aspx?sd=6%2F9%2F2016&id=pr954&ed
=12%2F31%2F2016
http://www.cnbc.com/2016/06/09/top-distractions-at-work-and-how-to-increase-productivity.html
NHRD Network Journal July 2017 |

40
Juhi has an MBA from IMT-Ghaziabad with a majors in HR and minors in Marketing.
She has a little over 6 years of experience in various HR functions like- BPHR, C&B
specialist, OD lead .She is currently the Geo-HR for key states in US east coast.
Juhi is based out New York& in her spare time she enjoys playing the keyboard and
exploring new things
Juhi Dubey
Operationalizing HR Analytics in Infosys
About the Author
Fiona has a Master�s degree in Organizational Development from University of
Delaware, USA and a Post Graduate Diploma in Human Resource Management
from St Francis College, India. Over the last 9 years, she has handled roles in
various aspects of the HR function. She is currently playing the role of a Senior
Lead � BPHR Infosys, Hyderabad. She is passionate about research and enjoys
dabbling in stand-up comedy
Fiona Rohinton
Wadia
NHRD Network Journal July 2017 |

41
There is safety in numbers. These words hold a lot of significance today�s business arena because each
business function depends heavily on numbers to give themselves deep insights about their people,
products, services and even external macro environment of the industry.
In the era of big data and transformation, no one can deny significance of data or its role in workforce trends.
Factors like globalization, changing business priorities, increased mobility and cultural integration are playing
a key role in the transformation of workforce and analyzing these trends is underlying to org success.
Furthermore, role of analytics is undeniable in defining any organization�s growth and gaining competitive
advantage. Infosys as an organization has evolved at an escalating pace & is no different.
An organization with about 200,000 employees worldwide, has various systems and processes to manage
talent in a seamless manner. The systems and processes that underpin the employee life cycle at Infosys and
as with all other corporate assets, analytics requires a strategic, proactive and integrated approach.
As is evident from the above illustration, our HR interventions clearly mirror the business cycle that we go through. Our business cycle at Infosys begins with understanding the client requirements, and how Infosys could partner with clients to provide better value, be it in servicing their end customers, helping clients with unique solutions to various business cycle problems, improving competitiveness by enhancing efficiencies of various processes & systems etc. This results in a demand which gets created for certain skills which talents supporting the client ecosystems should possess.
The Resource Management Systems run complex algorithms to provide talents to meet the demand,
through various levers of training, hiring, immigration, rotation of talents, etc. Analytics drives the decision
making in each of these facets whether it be regarding what profiles to hire, whom to train on what kind of skill sets to meet client demand, when to hire at what salary in which geography or which individual can be move to what project based on meeting the various client requirements and skills. This is the heart of the business cycle where value gets created and delivered to the customer and we as a company earn revenue.
Operationalizing HR Analytics in Infosys
NHRD Network Journal July 2017 |
42
Employees are evaluated for their individual and team effort through a robust performance management
system, which takes into account various facets of performance like utilization, task related performance and
additional initiatives taken. This subsequently drives the compensation and rewards framework thereby
completing the cycle of effort and performance leading to recognition and engagement. The various robust and
seamless systems make all of the above possible through capturing relevant data points and churning those to
arrive at an intelligent decision making process for all stakeholders involved.
Infosys started its analytics journey with baby steps and then moved at an accelerating pace to invest in
workforce analytics as a tool to shape its way forward. With growing headcount, its spread across geographies
and challenges of understanding the workforce trends the need for analytics was bigger than ever before.
While Infosys always churned out reports and dashboards on key metrics in business and people practices, the
external environment and internal changes demanded moving to the next level of predictive and prescriptive
analysis. The focus was on transforming HR metrics into meaningful data in a consumable format that could
draw leader�s attention to warning signals and potential areas of growth to enable decision making.
With changing times business leaders started to demand more than dashboards and scorecards which meant
looking at correlation, root cause analysis and allied areas. In the journey we were able to enhance credibility of
HR by providing powerful data insights from a vast pool of underutilized / unstructured data.
Analytics at Infosys now focuses on discovery and communication of meaningful patterns from data that
enable better decision making and we understand that dissociating organization�s directive and people data is
no longer an option. Perhaps, this journey has not been a one day bet. We have evolved and now know that the
data and insights around people require deeper understanding to derive meaning to non-liner data and inturn
can directly impact the margins.
Over years the analytics journey at Infosys has transformed through many phases from just reporting data,
metrics and dashboards to a deeper & personalized employee insights aka value added analytics. Progressing
from the stage of data reporting and dashboards, we moved to a more mature stage of using the historic data
for more meaningful translation of metrics like skill gaps, attrition and workforce trends etc. The current stage
of analytics journey at Infosys transmuted to using these meaningful metrics for key strategic decisions for the
organization. We have used this data to categorize key levers of engagement, identify and retain critical talent
and the nature of investments to me made in their development and so on.
Operational ChallengesAs Infosys evolved over the years, a lot has changed from a leadership standpoint as well which led to quick
reorganization of our business units. With every re-org, there was need to enable seamless transition and
integration in terms of the variety of systems to derive meaningful numbers for analytics.
We are a company which remains on the path of constant innovation and change. This means that it is
challenging to maintain the systems and also preserve the data from legacy systems. The way data is
represented also depends on the leadership requirement and the goal the company is trying to achieve, we had
to evolve quite a bit to catch up to the quickly growing and evolving business needs. While change has been
constant, we strongly focus on business continuity and ensure the change doesn�t cause any disruption. We
also have moved to dynamic systems like Power BI, Tableau etc. which give our managers a quick view of
where their teams stand in terms of engagement. The advantage of such systems is that the data is maintained
over cloud, accessible from any part of the world and allows various levels of customization. Our analytics
division is heavily inspired by the �New� & �Renew� methodology the company focuses on. The journey so far
has been a challenging one but has made us learn and grow a lot.
Decision Making using Data We realize that in a world which is so subjective and intangible, numbers are the only simple and tangible
objects you can count on. While our leaders always have a hunch to do the right thing, we try and provide them
with meaningful analytics to finally take the plunge. Our analytics is dynamic and depends on the business
NHRD Network Journal July 2017 |
43
strategy. At Infosys we break the Analytics part in to two -
� Predictive Analysis
� Past Analysis
While we leverage the past data as an indicator of trends which aids in future decision making, we also offer
predictive analysis based on current trends and industry dynamics. We share variety of reports on people
numbers and demographics, attrition analysis, utilization reports on bench and visas, salary reports and
analysis of market competition with our key stake holders in order to help them make informed, intelligent
decisions. Akey data point that is relevant for value added analytics is the data that impacts the goals of our
business leaders or the metrics they are accountable for, that in turn focuses on business problems.
Our specialized Engagement Portal has a layer of analytics created which allows HR leaders to drill down
multiple levels to understand coverage of various connects done and the employee pulse. The Efficiency Index
for Engagement coverage and closure of action items are centrally reported to the leadership so as to give them
a feel of what is happening on the ground. This is real time data and hence takes away dependency and
pointless post mortems done.
Basis this we prioritize the employees we need to move to another role � be it a promotion or a lateral move
which has different/complex/higher responsibilities. We also are strengthening our rewards practice further
and driving more differentiation in rewards for high performance
Basis this we decide how the on-boarding plan needs to be customized, project mapping for the new hires can
be done more effectively, ways to arrest attrition in the first year of joining.
Basis this we decide changes in the policies, benefits to be introduced, enablement / sensitization of
managers.
What is the Impact on Engagement?Engagement is measured and analyzed on overall indicators of satisfaction, advocacy, and pride. Managers
are given real-time automated engagement dashboards that helps them take actions immediately without
having to wait for reports or action items. The data helps them understand aspirations to manage career paths,
unfold triggers of attrition to work on proactive retention, decide training investments that need to be made etc.
Basis these data points we analyze and create an algorithm to create a priority list for movement to another role
� be it a promotion or a lateral move which has different/complex/higher responsibilities. We also are
strengthening our rewards practice further and driving more differentiation in rewards for high performance
based on outcomes of analyzed data.
Next StepsThe next generation talent management model - Talent Grid helps repurposing competencies and skills,
accelerating the journey of building expertise, working on aspirations of critical talent through performance
and utilization, and focuses on proactive retentions of the key talent identified. It has helped in arresting
attrition and contributing to better engagement.
Being an IT company, people are the core assets of the company. The entire focus of the company is towards
ensuring employees are engaged and motivated to perform at optimal levels. Various studies have led to the
conclusion that better engaged employees, lead to more satisfied customers, thereby directly linking ESAT and
CSAT.
Better engaged customers, implies better business prospects for the company.
With the advent of big data analytics, Artificial intelligence, and machine learning, complex algorithms which
were earlier difficult to analyze have become more seemingly possible, and predictive analytics will drive key
decisions for companies and employees in future. The future of companies will be defined by reskilling of talent
into newer areas and skills which are more relevant to the client needs. Employees who embrace change and
demonstrate agility to learn new skills , and methodologies will continue to outperform their peers. Analytics
will be on the fore front to guide leaders in making key decisions which will make or break companies in future.
NHRD Network Journal July 2017 |

44
Srikanth
Vachaspati
HR Analytics in IBM: Employee Engagement Index and the Digital Learning Marketplace
About the Author
NHRD Network Journal July 2017 |
Srikanth Vachaspati is currently working with IBM India as Associate Director HR
and is the Lead HR Partner for IBM's Software and Systems Research Labs in
India. He is a seasoned HR Professional with over 27 years of experience in various
aspects of HR. He has held a wide range of HR portfolios like HR Partnering, M & A,
Mobility and Strategic roles. in India, APJ and Europe. He has worked in a range of
Organizations from small Start- ups to Large Corporations -predominantly in the
Information technology sector. He has a keen interest in Teaching, Learning and
Mentoring, and believes in using stories as a teaching aid.
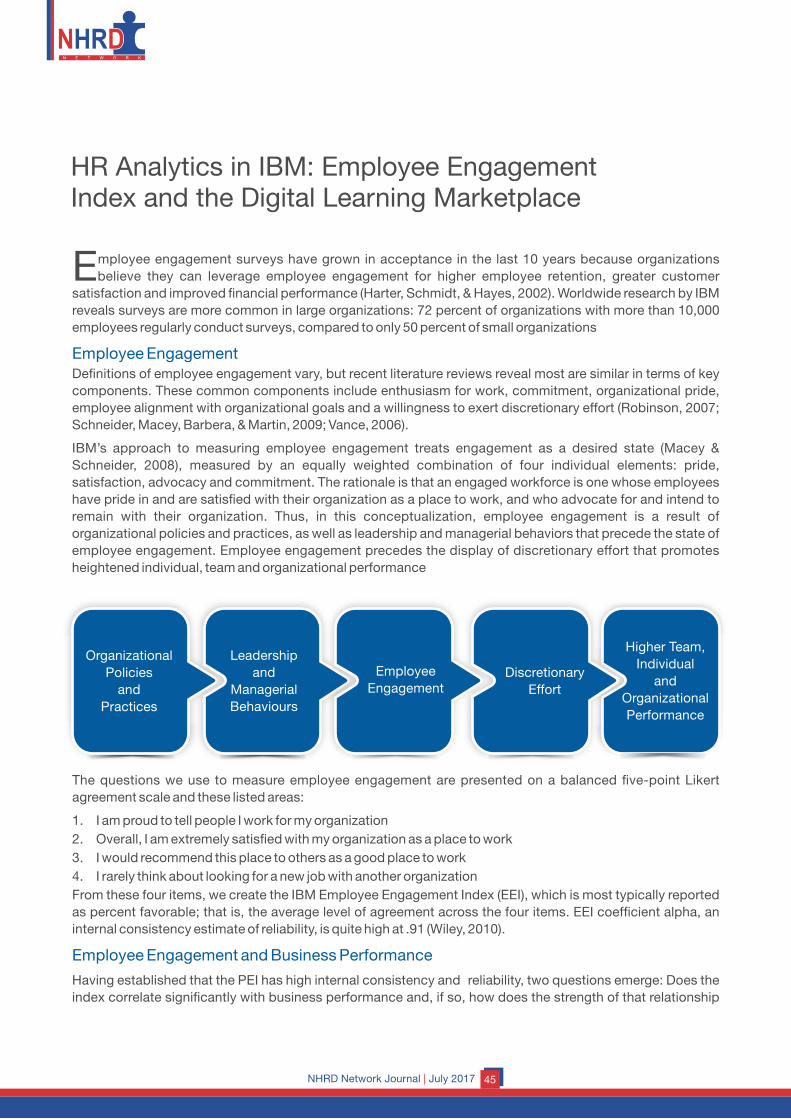
45
mployee engagement surveys have grown in acceptance in the last 10 years because organizations Ebelieve they can leverage employee engagement for higher employee retention, greater customer
satisfaction and improved financial performance (Harter, Schmidt, & Hayes, 2002). Worldwide research by IBM
reveals surveys are more common in large organizations: 72 percent of organizations with more than 10,000
employees regularly conduct surveys, compared to only 50 percent of small organizations
Employee EngagementDefinitions of employee engagement vary, but recent literature reviews reveal most are similar in terms of key
components. These common components include enthusiasm for work, commitment, organizational pride,
employee alignment with organizational goals and a willingness to exert discretionary effort (Robinson, 2007;
Schneider, Macey, Barbera, & Martin, 2009; Vance, 2006).
IBM�s approach to measuring employee engagement treats engagement as a desired state (Macey &
Schneider, 2008), measured by an equally weighted combination of four individual elements: pride,
satisfaction, advocacy and commitment. The rationale is that an engaged workforce is one whose employees
have pride in and are satisfied with their organization as a place to work, and who advocate for and intend to
remain with their organization. Thus, in this conceptualization, employee engagement is a result of
organizational policies and practices, as well as leadership and managerial behaviors that precede the state of
employee engagement. Employee engagement precedes the display of discretionary effort that promotes
heightened individual, team and organizational performance
HR Analytics in IBM: Employee Engagement Index and the Digital Learning Marketplace
Organizational
Policies
and
Practices
Leadership
and
Managerial
Behaviours
Employee
EngagementDiscretionary
Effort
Higher Team,
Individual
and
Organizational
Performance
The questions we use to measure employee engagement are presented on a balanced five-point Likert
agreement scale and these listed areas:
1. I am proud to tell people I work for my organization
2. Overall, I am extremely satisfied with my organization as a place to work
3. I would recommend this place to others as a good place to work
4. I rarely think about looking for a new job with another organization
From these four items, we create the IBM Employee Engagement Index (EEI), which is most typically reported
as percent favorable; that is, the average level of agreement across the four items. EEI coefficient alpha, an
internal consistency estimate of reliability, is quite high at .91 (Wiley, 2010).
Employee Engagement and Business Performance
Having established that the PEI has high internal consistency and reliability, two questions emerge: Does the
index correlate significantly with business performance and, if so, how does the strength of that relationship
NHRD Network Journal July 2017 |

46
compare to the strength of the relationship between the EEI and business performance? To answer these
questions, IBM adopted a research methodology used to validate the EEI as a predictor of business
performance. To validate that the performance excellence construct significantly relates to measures of
business success, we correlated PEI scores with:
� American ACSI
� Diluted Earnings Per Share (DEPS) for 168 companies
� Return on Assets (ROA) for 203 companies
� Three-year Total Shareholder Return (TSR) for 187 companies
By definition, the American Customer Satisfaction Index (ACSI) is an economic indicator based on customer
evaluations of US and foreign-owned entities selling products in the United States. Companies use ACSI
evaluations to improve and help maximize their customer relationships, and this, in turn, drives customer
loyalty and profitability. Diluted earnings per share takes into account standard earnings per share (income
divided by outstanding shares), but also accounts for what earnings would be if all outstanding stock options
and warrants were exercised. It is seen by analysts as an accurate assessment of the health and profitability of
an organization. Total shareholder return is a measure of the change in a company�s stock price plus dividends
paid. Return on assets is net income divided by assets, and provides an indication of how efficiently
management uses the organization�s assets to generate earnings.
AM
ER
ICA
N C
US
TO
ME
R S
AT
ISFA
CA
TIO
N IN
DE
X
Top 25% of
Organizations
on Performance
Excellence
Bottom 25% of
Organizations
on Performance
Excellence
Figure 1 : Performance excellence and customer satisfaction
4
3
2
1
0
-1
-2
-3
-4
TH
RE
E-Y
EA
R S
HA
RE
HO
LD
ER
RE
TU
RN
Top 25% of
Organizations
on Performance
Excellence
Bottom 25% of
Organizations
on Performance
Excellence
Figure 2 : Performance excellence and customer satisfaction
4
3
2
1
0
-1
-2
-3
-4
-5
DL
UT
ED
EA
RN
ING
S P
ER
SH
AR
E
Top 25% of
Organizations
on Performance
Excellence
Bottom 25% of
Organizations
on Performance
Excellence
Figure 3 : Performance excellence and customer satisfaction
2
1
0
-1
-2
RE
TU
RN
ON
AS
SE
TS
Top 25% of
Organizations
on Performance
Excellence
Bottom 25% of
Organizations
on Performance
Excellence
Figure 4 : Performance excellence and customer satisfaction
2
1
0
-1
-2
NHRD Network Journal July 2017 |

47
Figures 1-4 graphically depict the relationship between the PEI and various measures of business
performance. All statistical relationships are as expected: positive and significant. Clearly, those
organizations in the top quartile of PEI scores outperform bottom quartile PEI organizations by substantial
margins. As noted before, while these results are correlational, and conclusions about causality cannot be
asserted, they demonstrate that organizations with leadership practices that stress customer orientation,
quality emphasis, employee training and employee involvement in decision making are the organizations that
enjoy significantly higher levels of success as measured by the satisfaction of their customers, the earnings
they deliver to shareholders (in both immediate and mid-term time frames) and return on assets. Additionally,
we conclude from comparing the size of the respective correlation coefficients that the PEI is a stronger
correlate of customer satisfaction than the EEI, but the EEI and PEI are comparable in strength as correlates of
the other performance measures. No performance excellence linkage research study involving a sample of
organizations this size has previously been published.
The High Performance-Engagement ModelEmployee engagement and performance excellence are two different constructs, but both are obviously
amenable to measurement through a well-designed employee survey instrument. Employee engagement
assesses employee commitment and willingness to apply discretionary effort; it derives from having
trustworthy leaders who inspire confidence in the future, managers who recognize the contributions of
employees and treat them respectfully, employees being well-matched to jobs they believe will provide further
growth and development, and organizational values that demonstrate a genuine concern for employees.
Performance excellence provides an insider�s view of the effectiveness of the organization, particularly in
creating satisfied and loyal customers; it derives from a strong customer orientation, an emphasis on product
and service quality, and trained employees who are prepared to do what is expected of them and are actively
involved in decision-making.
High Performance-Engagement Model. One construct is performance-centric while the other is employee-
centric. One construct positions the employee as an ally in diagnosing the organization�s value chain; the other
construct positions the employee as a system participant whose commitment and willingness to display
discretionary effort are affected by leadership and managerial behaviors and organizational values and
policies. Both show substantial relationships to outcomes that are of tremendous importance to a firm�s
executives and financial stakeholders. Together, in the balanced scorecard framework, they provide very
potent leading indicators of organizational success (Wang, Tsui, & Xin, 2011).
Complementary GoalsL e a d e r s h i p Requirements
Key Indicators Organizational Impact
Measurable by Employee Survey SystemMeasurable by Performance
Systems
Team Performance
Service Quality
Customers Satisfaction
and Loyalty
Business Growth
Market Share
Profit Total Shareholder
Return
Figure 5 : The high performance-engagement model
Practices Supporting:
� Customer Orientation
� Quality Emphasis
� Training
� Involvement
Behaviors Reinforcing:
� Confidence and Trust
� Recognition and Respect
� Growth and Development
� Work and Balance
Employee Engagement
Index
Performance Excellence
Index
High Performance Organization
Loyal customers likely yo
recommend/re-purchase
Engaged Workforce
Employees willing to apply
discretionary effort
NHRD Network Journal July 2017 |

48
Is the High Performance-Engagement Model a Valid Model of Organization Effectiveness?To validate the model, we use the same database as described above and subject the model�s main hypothesis
(namely, that the combination of the PEI and the EEI better predict business performance than either index
alone) to a new analysis. This analysis quantifies the impact of three conditions: improving the PEI score by a
margin of .25 (on a five-point Likert rating scale), improving the EEI by the same margin and, finally, improving
both indexes concomitantly by a margin of .25. The results are presented in Figure 6.
Impact on Business Metric for a .25 increase for.
12010 Global PEI average score across 21 countries = 3.57; a 25 increase = 3.8222010 Global EEI average score across 21 countries = 3.47; a increase = 3.72
Figure 6 : PEI and EEI improvements and business performance
The conclusions are obvious and should be interpreted as the following: for the companies studied, the impact
of improving both their PEI and the EEI scores by .25 corresponds to: 1) a 2.76�point improvement in their
American Customer Satisfaction Index score; 2) an increase of $1.05 in diluted earnings per share; 3) a 2.82
percentage-point improvement in three-year total shareholder return; and 4) a 1.18 percentage-point
improvement in Return on Assets.
Independent of the business performance outcome under consideration, it is clear performance excellence
accounts for more of the �variance� in business performance than does employee engagement. This is
especially true with regard to customer satisfaction. Even so, these results inform us that leaders and
managers should work to improve both indexes in tandem as a path to stronger business performance. In fact,
organizations focusing solely on either of these individual constructs alone run the risk of sub-optimizing;
failing to grasp opportunities for positive impacts on their effectiveness, both in serving their customers and in
delivering exceptional financial results to their financial stakeholders.
One of the early-adopters is a privately-held supermarket chain headquartered in the United States, operating
more than 300 stores and listed as one of the nation�s top 25 retailers. The test of the new survey instrument for
this client had been completed, PEI and EEI scores were correlated to measures of same-store income growth
as a way of testing the model�s assertions. The results are presented below
STORES WITH HIGH
INDEX SCORE
STORE WITH LOW INDEX
SCORES
$328,627 $317,510 $346,389
$270,298 $214,543
$484,889
.20%
.10%
0%
-.10%
-.20%
-.30%
-.40%
-.50%
-.60% PEI EEI PEI + EEIQU
AR
TE
RLY
ST
OR
E N
ET
IN
CO
ME
VA
RIA
NC
E
Figure 1 - Performance excellence index + employee engagement index and
store net income
Top 25% EEI + PEI Stores Bottom 25% EEI + PEI Stores
Figure 2 - Performance excellence + employee engagement and
store net income
US
DO
LL
AR
S IN
MIL
LIO
NS
8
7
6
5
4
3
2
1
0
NHRD Network Journal July 2017 |
Business Metric
ACSI
DEPS
3-YEAR TSR
ROA
Average % of Impact
1PEI
204pts/74%
S071/68%
1.63%/58%
.64%/54%
64%
2EEI
0.72pts / 26%
$0.34 / 32%
1.19% / 42%
.54% / 46%
36%
PEI+EEI
276pts / 100%
$1.05 / 100%
282% / 100%
1.18% / 100%
100%

49
The results support the main hypotheses of the model, namely, that both the PEI and EEI are related to
organizational performance, but the combination of the two more fully explains performance than either
measure alone. Among stores with highest scores on both the PEI and the EEI, net income improved by 14
percent over the previous quarter. More dramatically, among stores with the lowest scores on both the PEI and
EEI, net income declined by 49 percent. In actual value, this equates to a difference in performance between
top and bottom PEI + EEI stores of more than US $800k in quarterly net income. As clearly seen, this gap is
notably wider than the gaps between top- and bottom-scoring PEI stores and top- and bottom-scoring EEI
stores. The implication is simple: store managers can improve their stores by focusing on improving either PEI
or EEI scores, but they can improve their stores even more by focusing on improving both. This allowed for a
testing of the model against another performance outcome: reduced shrinkage. Shrinkage in the retail industry
context refers to inventory damages, theft and loss, and thus is an extremely important measure of store
productivity. Figure 20 shows six-month shrinkage for stores simultaneously high on both the PEI and EEI,
compared with stores simultaneously low on both indexes.
SummaryThe High Performance-Engagement Model summarizes and integrates previously published research on the
constructs of employee engagement and performance excellence, and posits that, as independent
constructs, both are positively and significantly related to business performance. The research summarized in
this article fundamentally supports the assertions of the model with only one exception: the relationship of the
EEI to customer satisfaction, while relatively high in value, was not found to be statistically significant. All other
EEI and PEI relationships, across the array of business performance measures, were statistically significant.
The model also asserts that the combination of the performance excellence and employee engagement
constructs provides a deeper explanation of all business performance metrics than either construct alone.
Reinventing Corporate Learning with a Digital Marketplace Strategy: The IBM ExperienceWhat must your employees learn today?
It�s more challenging than ever to help workers advance their knowledge as markets and technologies swiftly
evolve. And companies are working harder than ever to stay agile, to remain competitive in a rapidly changing
business landscape.
The Market LandscapeThe traditional means of teaching employees � from classrooms to corporate universities � have been
overshadowed by an ever-expanding, ever-changing buffet of learning. At any time and any place, workers can
use their computers and smart phones to sift through online videos and courses, webinars, social media,
published papers, other rich content, and track down in-person opportunities, such as mentorships and
training.
Today, tech-savvy employees treat social networks, mobile and cloud technologies as a given. Among
millennials � those born between 1982 and 2000 � a global survey by Price water house Coopers International
found �that 41% say they prefer to communicate electronically at work than face to face or even over the
telephone. Millennials routinely make use of their own technology at work and three-quarters believe that
access to technology makes them more effective at work.�
stMoving Learning to the 21 Century Platform EconomyThe traditional business model is one in which companies create and sell to consumers � a one-way flow of
producing value upstream that�s consumed downstream. This �pipe� business model can be found
everywhere, from stores, to TV ads to education.
But in our ever-changing world of technology, steeped in analytics and social networks, we are seeing a seismic shift to a �platform� business model. Platforms serve as virtual gathering places where needs, ideas and content are exchanged; everyone can contribute, everyone can benefit. Platforms anchor an ecosystem of producers and consumers, providing tools for everyone to interact with one another, which perfectly suits
NHRD Network Journal July 2017 |

50
today�s demands for professional learning. Shifting to a platform model means surrendering control over how and what employees learn. The best companies personalize the best learning possibilities to each individual to help them grow and succeed.
Technology and ArchitectureTraditional learning-management systems collect, curate, deliver, update, track, report and manage every component of an organization�s learning and development program.
But their shortcomings have grown more pronounced as the choices and channels for learning have blossomed. New technologies allow broader access to more diverse learning opportunities. Employees, in turn, want more autonomy in their learning, better tailored to their individual needs.
Technology shifts too rapidly to be supported by a top-down industrial model. A fluid approach to match the quickly changing needs of employees and their employers is what�s needed now. Companies need learning technology that covers not only the usual offerings, but also ones that are social, informal and external � both in content and platforms � and that allow self-discovery, social interaction and personalization.
Employees should be able to search other systems and venues to find relevant learning offerings, get recommendations, and track their progress � all through a one-stop shop. They should be able to mine social networks for learning opportunities. Fortunately, technologies now allow the design for such an open-learning ecosystem, one that revolves around the user experience rather than corporate demands.
But how should such a site look for the user? There are examples all around us in the consumer world. Netflix, Amazon and other sites offer first-rate usability that fronts highly complex arrays of data.
Your Learning � IBM�s Digital Learning ExperienceIBM has developed Your Learning which is a Digital and Cognitive Learning Platform to engage and enable employees using the latest in technology. Leveraging IBM�s Watson � this is a formidable tool helps in meeting the needs � and burgeoning demands � for digital access to learning, which is critical for businesses and helps retain the best and the brightest.
To mine data and manage a sea of social interactions, IBM Your Learning combines an easy-to-use graphic interface with the under-the-hood power of IBM Watson�s cognitive analytics. Watson�s ability to work both with structured data and unstructured natural language grants IBM�s Your Learning the means to swiftly integrate, assess and curate a vast amount of learning sources � formal, informal and social � and to
customize vetted offerings for each individual learner.
As Watson learns more about each user, it provides more meaningful recommendations. Watson can also process all the feedback and social comments that pour in from thousands upon thousands of users, respond quickly to trim less impactful content and alert.
Individualized Learning � How this WorksIBM�s Your Learning platform creates a personalized learning environment for each employee, providing a 24x7 interface that responds quickly, flexibly and creatively to the changing technical and business landscape. It provides search, browse, career roadmaps, plus customized learning channels, while its learning analytics link consumption patterns with skill improvement and business impact.
Over time, IBM Watson�s cognitive capabilities grow to make even smarter recommendations, improving search results, providing ever better learning suggestions to employees � much like Amazon does with its recommendations for books, movies and other goods.
IBM�s Your Learning also taps into the power of social media, so that friends, colleagues and like-minded strangers contribute to help learners find what they need to progress and succeed.
Through Watson�s cognitive power, IBM�s Your Learning can ask what each individual is interested in, see what those with similar likes and interests are consuming, then offer relevant suggestions. Cognitive analysis can help reveal unexpected career opportunities based on its understanding of each worker�s learning needs and desires.
NHRD Network Journal July 2017 |

51
In this cognitive era, it�s more important than ever to provide industry professionals with an agile, personalized
experience that helps them make better business decisions. IBM�s Your Learning is designed to do just that: To
help transform their businesses and create more personalized, digital learning experiences. The personalized
experience gives learners ownership over building their career, putting their destiny in their hands.
Design, Technology and Architecture of IBM�s Your Learning Platform
IBM�s Your Learning platform was designed to covers three key elements:
1. The core value, which is learning opportunities.
2. The interactions among learners, via social networks, to engage, to share and to rate learning
opportunities.
3. The platform itself, which presents an intuitive and direct interface to the array of available learning
options: internal and external, digital and in-person.
This tool uses an open, cloud-based environment that enables ongoing innovation through its public APIs.
Open services provide clients with a way to connect the digital learning platform to their unique applications
and sources of data � while avoiding the complexity and vendor lock-in issues with proprietary systems. IBM�s
Your Learning is built with IBM Bluemix and Cloudant technology, which are based on industry standards for
cloud applications and hosting. This delivers a powerful, immediate learning solution while also enabling future
innovation.
Just as travelers leave their homes for a variety of destinations, learners begin their journeys for various reasons:
� They may be curious to find an answer, expert or point of view outside of their organization.
� They may have been invited because of their role, a job change, or a compliance effort.
� They may have received a suggestion via word-of-mouth, social networking or targeted marketing.
IBM�s Your Learning�s interoperability with multiple internal and external trusted sources allow its features and
services need to support all of these needs. No matter what journey a learner is on, each shares these steps:
Discovery, or the spark starting the journey, Exploring what�s available, Immersion in a learning process and
Adoption of the learning, resulting in applying the knowledge to improve one�s self and in turn, the business.
Metrics and Management SystemIBM Learning enables every user�s experience to be delightful and productive. It is designed for their needs and
wants � and to be successful in this we need to measure the impact. This, deserves a fresh approach to metrics:
quantifying usage, qualifying improvements with user feedback, and measuring impact through our client
success.
NHRD Network Journal July 2017 |

52
IBM�s Your Learning manages about 400,000 learners per month. Each day, it processes 30,000 to 100,000
user transactions from more than 30 trusted learning sources. Three-quarters of our learning completions
come from outside of the traditional learning-management system. Our informal sources, such as IBM
Connections, which is IBM internal community platform (wikis, communities, blogs), internal video replays and
virtual event system are booming in usage. Tracking who uses what and how frequently tells us about
engagement, learner autonomy and � through feedback � their reaction and input to create an irresistible
experience. These metrics inform us about employee skills development and career acceleration. And they
inform us to what level IBMers feel engaged, empowered, and confident to positively impact and transform our
business.
Web analytics allow us to better understand site traffic and trends, what devices learners use, what times they
engage, what they search for, and far more. IBM uses the Net Promoter Score model to collect feedback and
drive iterative change, as well as real-time Chat Advisor features to assist learners in the moment of need. The
power of Watson analytics is used to analyze the emotional sentiment of users and predict digital learning
preferences.
Adding the power of cognitive and social not only makes the user experience more fulfilling and personalized,
but allows fine-tuning of learning experiences. Courses with poor reviews get dropped. Programs that see a
surge in interest get highlighted.
Currently, we combine big data from over 378,000 IBMers� learning histories and more than 9 million
completions and 56,000 learning activities to assess and create better learning recommendations. Each
recommendation is tailored to each of our 378,000 global employees� roles, skills, business groups and
personal learning histories.
In ConclusionOur students are our consumers; we strive to please them with an awesome opportunity to develop their talent.
Our latest IBM Engagement survey again showed that IBMers who are curious and prioritize professional
development are the most engaged. Their engagement is five points higher than those who do not invest 40 or
more hours a year in their development. Keeping the experience top-notch and delightful isn�t simply about
helping employees stay engaged and excel. More knowledgeable employees connect better with clients,
connect better within their organization, and that creates success for everyone.
In today�s disruptive marketplace, rapid and modern approaches to track success are fundamentally changing
the way we think about learning and development. It�s a win for everyone.
This article was curated by the author from various internal IBM sources including White papers, publications
and presentation materials.
ReferencesHarter, J. K., Schmidt, F. L., & Hayes, T. L. (2002). Business-unit-level relationship between employee
satisfaction, employee engagement, and business outcomes:
A meta-analysis. Journal of Applied Psychology, 87, 268-279. http://
www.apaexcellence.org/resources/research/detail/1048
Macey, W. H., & Schneider, B. (2008). The meaning of employee engagement. Industrial and Organizational
Psychology, 1, 3-30. http://onlinelibrary.wiley.com/doi/10.1111/j.1754-9434. 2007.
0002.x/abstract?deniedAccessCustomisedMessage=&userIsAuthe nticated=false
Schneider, B., Macey, W. H., Barbera, K. M., & Martin, N. (2009). Driving customer satisfaction and financial
success through employee engagement. People & Strategy, 32, 22-27.
http://www.emeraldinsight.com/bibliographic_databases. htm?id=17079444
Robinson, D. (2007, May 3). Staff engagement is marriage of various factors at work. Employee Benefits,
37. http://www. employeebenefits.co.uk/resource-centre/trends-and-issues/ staff-engagement-is-
marriage-of-various-factors-at-work/2304. article
NHRD Network Journal July 2017 |

53
Wang, H., Tsui, A. S., & Xin, K. R. (2011). CEO leadership behaviors, organizational performance, and
employees� attitudes. The Leadership Quarterly, 22, 92-105. http://www.sciencedirect.
com/science/article/pii/S104898431000189X
Likert, R. (1961). New patterns of management. New York: McGraw-Hill.
Likert, R. (1967). The human organization: Its management and value. New York: McGraw-Hill.
The Michigan Studies and the Ohio State Studies are a group of studies in leadership and management
history. A summary can be found at:
http://www.tlu.ee/~sirvir/Leadership/Leadership%20Models/the_university_of_michigan_studies. html
NHRD Network Journal July 2017 |

54
Dr. Sampath: An HR evangelist, innovator, angel investor, and an Ashoka Fellow,
Dr. Sampath as created a wide range of patent-pending assessment frameworks
and developmental methodologies for organizational excellence. Over the last 26
years, he has transformed businesses (startups, SMBs, PSU, and large
enterprises) across 15 countries. Sampath is the pioneer of assessment-based
people analytics in India. His company Nidharshana Technologies is a Startup
India �Platinum� company that won the Best HR Startup award at NHRD 2016.
Dr. Sampath is also the founder of Arpitha Associates and serves on the board of
several other companies. Sampath can be reached at [email protected]. J.M. Sampath
CHRO 2.0 - From "Support" to "Strategic"using People Analytics
About the Author
Prabhat Ramesh: An entrepreneur, writer, and UX professional, Prabhat Ramesh is
the Co-founder & CEO of Nidharshana Technologies. He was instrumental in
designing and developing DiscoverSelf, India�s first assessment-based analytics
solution. Prior to founding Nidarshana, he was setting up and managing offshore
development centers for US enterprises. He also set up and managed his own UX
services company for a few years. Prabhat is an alumni of IIM Bangalore. Prabhat
can be reached at [email protected]
Prabhat Ramesh
DiscoverSelf - India�s first assessment-based People Analytics
Platform
DiscoverSelf provides a mix of diagnostic, predictive, and prescriptive analytics
for top-line and bottom-line growth. It focuses on Assessment > Analysis >
Prediction > Development > Reassessment.
The analytics is powered by Life Orientation Instrument (LOI). DiscoverSelf is a
product of Nidharshana Technologies, a Startup India "Platinum" Company that
was awarded the Best HR Startup at NHRD 2016. Nidharshana's clients include
Sasken, Max Retail, Accel Partners, Lupin Laboratories, Mashreq Bank, TE
Connectivity, Indian School of Business and several more in the works. Leadership
Resource Center (LRC), a collaboration between IIM-B and NASSCOM will use
DiscoverSelf for building leadership capacity across 1000+ SMBs over the next
five years.
NHRD Network Journal July 2017 |

55
CHRO 2.0 - From "Support" to "Strategic" usingPeople Analytics
he last few years have seen an interesting development that is set to disrupt HRM: Management gurus and Tbusiness leaders are beginning to expect their CHRO�s office to move up the value chain, from executing
decisions to making decisions and owning up its impact on topline and bottom-line. During his hard-hitting thaddress at AIMA's 14 National HRM Summit, Vineet Nayar (Ex-CEO HCL Technologies) predicts that the HR
function would be dead by the year 2020 if it fails to move away from mundane �operational� tasks (such as
payroll, appraisal, reporting) that could easily be taken over by artificial intelligence. He goes on to say that only
those HR professionals who understand the importance of analytics and leverage it to offer custom services
that transform the organization will survive. In his Harvard Business review article �People Before Strategy: A
New Role for the CHRO�, Ram Charan (Advisor to global CEOs) says there are three critical things the CHRO
must start doing: predicting outcomes, diagnosing problems, and prescribing actions on the �people� side that
will add value to the business .
How can the CHRO remain relevant in this changing business context? How can the HR function develop a
competitive edge and add value? How can they predict outcomes and diagnose problems? Well, Data
Analytics is the key. Today, when every other management decision (sales, inventory, manufacturing, quality,
logistics, marketing, etc.) is heavily data driven, people decisions are based on a hunch or inadequate data.
While the CEOs, CFOs, CTOs, and CIOs swear by BI tools and decision-support systems, the CHROs are yet to
leverage descriptive, predictive, and prescriptive analytics in their decision-making process. Undoubtedly,
People Analytics is what will help CHROs make the leap from Support to Strategic.
So how does an organization adopt people analytics? If the CHRO�s office comprises (or has access to)
qualified statisticians, they may want to set up their analytics practice from scratch, where they identify the
business need(s) and accordingly decide on what data to analyze and which tools/techniques to use (SPSS, R,
MS-Excel) to transform the data into meaningful insights. If the CHRO opts for an off-the-shelf people-
analytics product, they don�t have the choice of data. Whatever the approach, the �type� and sanctity of the
data makes a huge impact on the accuracy of the outcome. Globally, two types of people data are used for
analytics: big data and feedback data. The following table captures the pros and cons of these two data types:
1 https://www.youtube.com/watch?v=7loEuIEjLzo2 https://hbr.org/2015/07/people-before-strategy-a-new-role-for-the-chro
Assessment-based Analytics (primary data)Big-data based Analytics (secondary data)
Feedback that people provide based on their
interactions with the individual forms the basis
for diagnostic, predictive, and prescriptive
analytics.
An individual�s �actions� in the digital space
(mails, posts, tweets, blogs, browsing patterns,
interests, etc.) or existing data pertaining to
him/her (demographic details) forms the basis
for understanding and predicting individual
behavior.
Predictions are primarily based on the
�intelligence� (pattern recognition and other
algorithms) built into the analytical framework.
Huge infrastructure and setup costs needed to
gather, collate, and analyze data.
Predictions are predominantly based on how an
individual is assessed/rated by others via an
assessment tool/instrument, which is usually
backed by some behavioral-science model or
framework.
Comparatively lower infrastructure and setup
costs.
NHRD Network Journal July 2017 |

56
People Analytics initially took the big-data route primarily because most other fields (from locating potential oil
fields to preventing fraud risks) leveraged loads of secondary data to make pattern-based predictions.
However, when it comes to understanding people, there are a number of parameters that just cannot be
predicted using the secondary data alone. People are dynamic and their actions have to be understood to
make meaningful interpretations. Moreover, the Big Data approach focuses on identifying and addressing a
specific people problem. For example, a lot of effort has gone into predicting attrition by analyzing the interplay
and correlation among several demographic parameters. The ROI and the accuracy of the prediction are still
being validated. This is where an assessment-driven approach becomes more relevant. Globally, there is an
increasing shift towards assessment-based analytics in addressing several people and organizational
challenges.
Discover Self � India�s First Assessment-Based People Analytics PlatformDiscover Self provides a mix of diagnostic, predictive, and prescriptive analytics for top-line and bottom-line
growth. It focuses on Assessment > Analysis > Prediction > Development > Reassessment.
Life Orientation Instrument (LOI)Life Orientation Instrument is a 360/multi-rater tool that assesses and enhances an individual�s ability to
achieve results, build relationships, influence people & events, learn and apply, and to nurture others. LOI is
Assessment-based Analytics (primary data)Big-data based Analytics (secondary data)
Data from HR systems may be unbiased, as
they are vetted facts (age, qualification, etc.).
This is objective.
Data from the digital space inside (Intranet,
forums) or outside the organization (social
media) is also likely to be unadulterated, as
employees may be unaware that their data is
being analyzed. However, this approach
assumes that individuals tend to present their
�true self� on digital media.
When data from an external source (social
media) is used, it turns out to be perennial, as
new data keeps flowing in periodically.
However, factual data from HR systems (age,
sex, etc.) is static.
If employees are not made aware of their data
being used for analysis, that amounts to a clear
breach of trust. If it�s done with their consent,
they are likely to be constantly weary of being
snooped over.
Tends to adopt a one-size-fits all approach, in
the sense that the same algorithm/logic is
applied to all individuals in order to predict their
behavior. In a way, this approach assumes that
people are not different and are not likely to
change over a period of time.
Treats each individual as unique and captures
any changes an individual might have gone
through over time.
Data can be seen as being biased, as employees
tend to rate themselves and others based on their
perceptions.
As feedback forms the only source of data for
analytics, assessments have to be re-
administered at regular intervals to gather a
new set of ratings.
Assessments are an �open affair� where
employees willingly rate themselves and their
colleagues in the organization.
NHRD Network Journal July 2017 |

57
built on the principle �No single value by itself valuable. Values are interdependent and one needs to
understand this interdependence to understand one�s own behavior.� Unlike many other assessment tools,
LOI doesn't focus on a single value or attribute. It looks at the interplay among attributes to help individuals
identify imbalances and understand how those imbalances are affecting them.
LOI Measures Five Critical Orientations that Address an Individual�s Professional and Person Life:
Built on the concept of interdependence, the 30-item tool has the potential to predict over 870 behavioral
dimensions, at individual and team levels. This gives a great degree of flexibility to map any competency, value
or matrices an organization wants to measure. It further gives the tool a unique advantage in lending itself to a
very high quality of diagnostic, predictive and prescriptive analytics. Some salient features of LOI:
Over the last 28 years, the LOI assessment has been put through extensive statistical rigor. Below is the
summary of the recent reliability and validity analysis for LOI:
26 Years 15 Countries 20+ Industries 600,000 people
Orientation Measures the ability to�
Achievement Set goals and achieve them
Relationship Build healthy and sustainable relationships
Leadership Influence people and events to move in a certain direction
Learning Learn and apply the learning in real-life contexts
Nurturing Build individuals and ideas to realize their true potential
Startups, SMBs, PSUs, Enterprises
95% ReliabilityFastest Assessment
(4.5 minutes)India & US
Patent-Pending
Over the last 28 years, the LOI assessment has been put through extensive statistical rigor. Below is the summary
of the recent reliability and validity analysis for LOI:
The sample set used for analysis included 66 participants from two companies (Keminand Tenaga) across 9
countries. Cronbach's alpha is a measure of internal consistency, that is, how closely related a set of items are as a
group. It is considered to be a measure of scale reliability. A "high" value for alpha does not imply that the measure 3is unidimensional. A commonly accepted rule of thumb for describing internal consistency is as follows :
NHRD Network Journal July 2017 |

58
The alpha value for each question is > 0.92 (or 92%) and above. The standardized
Cronbach alpha is also high at 0.946.
3 th George, D., &Mallery, P. (2003). SPSS for Windows step by step: A simple guide and reference. 11.0 update (4 ed.)
Boston: Allyn & Bacon.
The 30-by-30 attribute correlation & p-value maps show that its significant and across all attributes. Only for
the Expression attribute in Relationship orientation, R-value and P-values are lower.
Confirmatory Factor Analysis – Constructs and model with its R Square Values
NHRD Network Journal July 2017 |
Cronbach's alpha Internal consistency
a ≥0.9 Excellent
0.9 > a ≥0.8 Good
0.8 > a ≥ 0.7 Acceptable
0.7 > a ≥ 0.6 Questionable
0.6 > a ≥0.5 Poor
0.5 > a Unacceptable

59
DiscoverSelf People Analytics � What it can do?
When a group has completed LOI, their assessment data forms the basis for various analytics. Some of the key
features of Analytics are:
How it facilitates better people
management and development
SWOT An analysis of a team�s optimally
skilled, over skilled, under skilled
areas.
� Give a new manager insights into
a team even before assuming
charge
� Flex management style based on
the team dynamics for better
engagement and retention
� Understand team�s over-skilled
and under-skilled to enhance
team efficiency & effectiveness
Focus Areas Team�s performance bottlenecks
across three categories and
recommended preventive action:
Execution, Engagement, &
Planning/Timing
Addresses the team�s top-2 problems
in the following areas and provides
ways to deal with them:
� Operations
� Engagement and quality
� Planning, structure, and timing
decisions
Review QuestionsA set of questions designed to
help the leader/manager with
status/operations reviews
� Make status & operations reviews
more meaningful and focused
� Address a team�s weak areas that
could otherwise have affected
project progress
� Make reviews developmental by
encouraging the team to scale up
in their weak areas
Collaboration
Comparison of two
functional/project teams to
strengthen collaboration
� Improve cross-functional
collaboration to improve
efficiency?
� Help project/functional teams
leverage unique strengths and
learn from each other
� Identify and share best practices
across teams
Feature What it is�
NHRD Network Journal July 2017 |

60
How it facilitates better people
management and development
Compatibility Analysis of an individual�s
compatibility with a team (as a
member or leader) and impact on
its performance
� Assess the impact of internal
transfers on team performance
� Move resources from your talent
pool (bench) to a project teams or
in-between teams
� Predict the leadership impact of
an individual on a team, before
hiring/promotion
� Identify the �best fit� from a set of
shortlisted candidates who�re
technically equally competent
� Hire for complementary skills to
compensate for a team�s
weakness
Feature What it is�
Competency� Check the current competency
level of your team
� Identify areas to enhance your
team�s competencies and better
align it with organizational values.
� Identify the team members who
are the best at the improvement
areas identified
A quantitative assessment of how
well a team is at a competency or
at demonstrating organizational
values
Learning &
Development
� Get prioritized employee learning
needs and use it to design
training initiatives
� Empower L&D team to take a
data-driven approach for a more
accurate need analysis
� Enable managers to check if an
employee really needs training
before nominating him/her for a
program
� Develop people in exactly those
areas where they truly need help
� Identify the best learning
mode(Education/Experience/Expl
oration) for each employee
� Help employees learn from each
other, using peer-coaching
recommendations
Accurate individual-wise learning
need analysis and peer coach
recommendations
NHRD Network Journal July 2017 |

61
How it facilitates better people
management and development
Virtual Teams Analysis of a team�s performance
even before it is operational
� Get the �right mix� based on
organizational competencies
when creating a new team
� Create a virtual group (on the fly)
with people across the
organization and get a thorough
analysis of their SWOT,
performance bottlenecks,
learning needs, etc.
� Flex management style to get the
best out of a new team
Feature What it is�
Apart from these out-of-the-box features, the platform can lend itself to analyze any specific need. For
instance, if an organization wants to set up an Innovation team, it just has to define the team profile, and the
platform automatically recommends individuals who fit the team.
DiscoverSelf Resource CenterDiscoverSelf Resource Center is an analytics-based intelligent development platform for Life Orientation
Instrument (LOI) assessment participants. The Resource Center provides:
� Goal-Setting Worksheets: Users get a set of five worksheets to create development plans to improve
their Achievement, Relationship, Leadership, Learning, & Nurturing orientations. The worksheets are
designed to help the user think holistically when working on a development plan. Each worksheet alerts
the user regarding a particular behavioral attribute that they are weak at and prompts them to seek
someone�s help there. After creating a development plan, the user can share it with their managers or
peers for review, view their comments online, and update the plan accordingly. This collaboration upfront
helps the user to tap into the �collective intelligence� and increases the chances of the user achieving
his/her individual goals.
� Story Cards, Quote Cards, & Poem Cards: The Resource Center holds a huge repository of stories,
quotes, and poems that are tagged to every behavioral attribute in the LOI assessment. The Resource
Center automatically mails these cards to users, based on their low attributes, on a predefined frequency
(daily, weekly, etc.).
� Book Summaries: The Resource Center is integrated with online book-summary repositories. Relevant
summaries are identified and mapped to every behavioral attribute in the LOI assessment. The Resource
Center automatically mails these summaries to users, based on their low attributes, on a predefined
frequency (daily, weekly, etc.).
� Videos: The Resource Center has a repository of different types of videos (motion animation, white-
boarding, etc.) for each attribute. The Center automatically mails video links to users based on their low
attributes. The videos use different presentation approaches (such as narratives, monologues, dialogs,
skits, group discussions among attributes) to break the monotony and make learning fun.
NHRD Network Journal July 2017 |
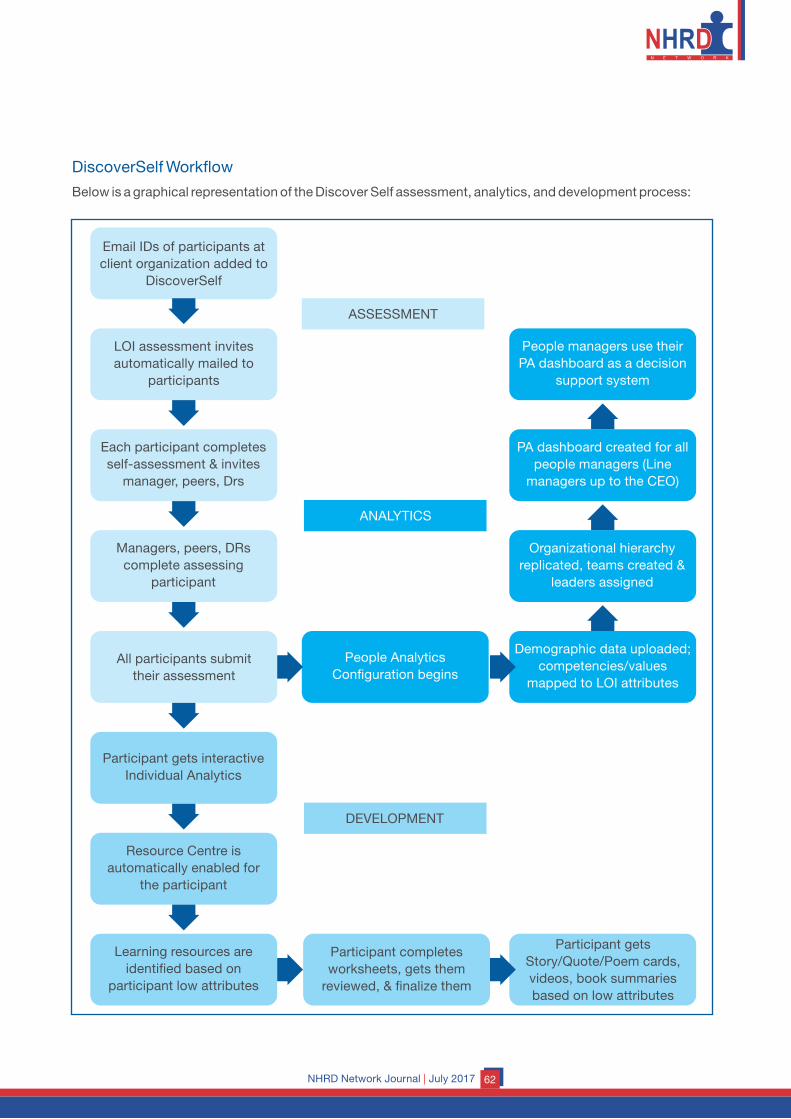
62
DiscoverSelf Workflow
Below is a graphical representation of the Discover Self assessment, analytics, and development process:
Email IDs of participants at
client organization added to
DiscoverSelf
LOI assessment invites
automatically mailed to
participants
Each participant completes
self-assessment & invites
manager, peers, Drs
Managers, peers, DRs
complete assessing
participant
All participants submit
their assessment
Participant gets interactive
Individual Analytics
Resource Centre is
automatically enabled for
the participant
Learning resources are
identified based on
participant low attributes
Participant completes
worksheets, gets them
reviewed, & finalize them
Participant gets
Story/Quote/Poem cards,
videos, book summaries
based on low attributes
ASSESSMENT
ANALYTICS
DEVELOPMENT
People Analytics
Configuration begins
Demographic data uploaded;
competencies/values
mapped to LOI attributes
People managers use their
PA dashboard as a decision
support system
PA dashboard created for all
people managers (Line
managers up to the CEO)
Organizational hierarchy
replicated, teams created &
leaders assigned
NHRD Network Journal July 2017 |

DiscoverSelf Case StudiesCase 1: A leading IT services company with over 3 decades in product engineering, the company has
transformed the businesses of 100+ Fortune-500 companies.
The company wanted to identify the leadership effectiveness and the factors affecting performance in three of
their oldest project teams, which included a mix of developers, testers, technical leads, solution architects,
managers, and delivery heads, with the experience levels ranging from 2 to 25 years.
DiscoverSelf�s Individual Analytics (IA) provided the 300 participants a good understanding of their ability to
achieve results, build relationships, influence people, learn and apply, and share feedback. The analytics also
included concrete short-term and long-term IDPs that helped individuals identify specific improvement areas
and work on them.
At the team level, DiscoverSelf�s People Analytics (PA) brought out the following key insights:
� The SWOT and Pitfall Predictor features singled out Low Empowerment as a common concern across all
the three teams, which was directly attributable to the recent rise in attrition levels. This was a revelation to
the Global Delivery and BU-HR Heads, and they immediately held discussions with the delivery heads to
address the issue. The DiscoverSelf team also proposed workshop-led interventions to help the
company.
� The Compatibility feature indicated a weak top-level leadership across the three teams, with the
leadership index (effectiveness) for the three leaders being less than 30%. The data indicated that the
teams were in an auto-pilot mode and their performance was not really being powered by the leadership.
In one of the teams, the Global Delivery Head and BU-HR Head had identified a replacement for the
delivery head. The Compatibility feature prescribed that the individual was a far more effective leader
(index of 75%) than the current one. This gave them the quantitative substantiation that their choice was
right and they could go ahead with the replacement. The following is a sample illustration with the
The rating shown on the fitment scale is based on the number of attributes where the
individual is better than the team. Make sure you carefully analyze the attributes listed under each of the following
areas to better understand the individual's suitability.
POSITIVE IMPACT (individual is better than team)
NEGATIVE IMPACT (Team is better than individual)
ADVANTAGE (Common Strengths)
CONCERN (Common Weakness/Threats)
Expression
Influence
Concern
Integration
Optimization
Acceptance
Aspiration Empowerment
ExpressiomConviction
Openness
Compatibility of with the teamDelivery Head
Will this individual manage the team?ü
FITMENT INDEX(General fitment)
LEADERSHIP INDEX(Fitment as a Manager)
w
oL
yrotcafsitaS
oodG Very Good
Exce
llen
ce
w
oL
yrotcafsitaS
oodG Very Good
Exce
llen
ce
NHRD Network Journal July 2017 | 63

64
Compatibility feature showing a low leadership index for the delivery head:
� The analytics showed low influence and low empowerment as the cause for delayed decision making in
one of the teams.
The Global Delivery Head was in complete agreement that 95% of DiscoverSelf�s predictive and
prescriptive analytics were in line with their analysis over the last few quarters. The analytics gave them
the exact underlying causes and corresponding data points to revamp their leadership for business
growth and bring in cultural changes to curb attrition.
Case 2: A transnational pharmaceutical company based in Mumbai, seventh-largest company by
market capitalization and the 10th-largest generic pharmaceutical company by revenue globally.
As part of their sales capability enhancement program, the company first used DiscoverSelf�s assessment and
analytics solution with a group of Regional Sales Managers (RSMs) and Sales Managers (SMs) from two
divisions.
DiscoverSelf�s Individual Analytics (IA) provided the RSMs and SMs valuable insights into their ability to
achieve results, build relationships, influence people, learn and apply, and share feedback. The analytics also
included concrete short-term and long-term IDPs that helped individuals identify specific improvement areas
and work on them.
At the team level, DiscoverSelf�s People Analytics (PA) enabled the divisional sales heads:
� Pinpoint specific areas that are boosting and those that are hampering sales
� Know exactly what behavioral dimensions to work on to further build the sales competencies
� Predict the impact of new hires, internal transfers, and promotions on team�s ability to achieve targets
� Predict a new sales team�s performance even before it is operational
� Identify learning needs and implement peer-coaching model to boost sales capability. The following is a
sample illustration showing the list of individuals who need training in a particular behavioral attribute,
their preferred way of learning, and peer-coach recommendations:
Choose Orientation: Leadership
Trainee Preferred Learning Mode Recommended Peer Coach
Trainee 1 Education (Classroom) Peer coach 1
Peer coach 2
Peer coach 3
Trainee 2 Experience (Hands-On) Peer coach 1
Peer coach 2
Peer coach 3
Trainee 3 Education (Classroom) Peer coach 1
Peer coach 2
Peer coach 3
Trainee 4 Education (Classroom) Peer coach 1
Peer coach 2
Peer coach 3
Trainee 5 Experience (Hands-On) Peer coach 1
Peer coach 2
Peer coach 3
Influence Empowerment CredibilityTask
Involvement
People
InvolvementOrganized
Organized
Prioritization
NHRD Network Journal July 2017 |

65
� Understand how to enhance collaboration and synergy between regional teams for faster turnaround
Having seen the impact of DiscoverSelf�s individual and people analytics in boosting their sales team
performance, the company�s Human Resources teams from across Asia Pacific embraced DiscoverSelf�s
analytics as part of their ongoing efforts to enhance their operational efficiency.
“We’re using DiscoverSelf as part of our sales-capability and HR efficiency enhancement programs. It helps us
optimize efforts at individual & group levels.” – Senior VP-HR
Case 3: A leading retail chain that is part of a 5-billion dollar group and operating close to 200 stores
across India.
The company was using assessment centers and multiple assessments, covering only the top two layers of
leadership. The company was growing 30% annually. The HR team wanted to know how they could scale up
and add value to support the rapid growth across India.
The entire HR team across 8 regions in India went through the DiscoverSelf assessment process. DiscoverSelf
threw up some key insights for the HR team to enhance their efficiency and agility:
� A leadership issue was identified in one of the regional HR teams, preventing mass attrition. The analytics
highlighted that the leader was managing customers, vendors well; getting along well with manager &
peers; bad with Drs.
� Over-emphasis on systems and procedures emerged as the key aspect curtailing speed and hampering
creativity.
� Lack of empowerment and the ability to influence emerged as another area that was slowing down
decision-making and creating a Catch-22 like situation.
DiscoverSelf ROIHere are some examples of how DiscoverSelf can boost the bottom-line:
1. DiscoverSelf�s Peer mentoring framework adopted organization-wide can result in huge savings in L&D
budget
� For lowest development cost per hour
� In addition it can create a learning and supporting culture
2. DiscoverSelf�s Fitment check can bring down annual bad-hire costs to a great extent
� More than 50% companies in the Top-10 world economies have been affected by a Bad Hire! - Career
Builder
� Indian employers reported the average bad hire cost of INR 20,00,000 ($31,100) � CareerBuilder
� For annual hiring of 200 people and lowest bad hire rate of 10%
3. No organization has ever computed the cost of conflict between key individuals and its impact on the
bottom line. An exercise carried out in a software company to compute the cost of conflict between two
key people over a month showed a loss of 3000$. DiscoverSelf can predict and reduce such conflicts,
adding to the bottom line.
4. There are many �invisible� losses associated with an organization�s human capital that go unmeasured
due to lack of appropriate criteria. A proactive way to cut these costs is to align people and develop them.
Challenges of Assessment-Based AnalyticsThe accuracy of analytics is dependent on the quality of feedback individuals give each other. Many question
the quality of feedback and also feel it can be manipulated. So how reliable and valid is the data? It�s important
to know that when it comes to understanding human behavior, no one has access to the absolute truth. In the
absence of truth, perception is real. Even an individual�s self-assessment is based on his/her self-perception
rather than the truth. Hence, as long as a tool is able to make sense out of those perceptions, it is a good bet.
Behavioral assessment tools have been in use for over five decades and enough work has been done to
establish the reliability and validity of such tools.
NHRD Network Journal July 2017 |

66
ConclusionIt is a surprise that the world over not many CHROs have moved up the chain to become CEOs. With
automation making inroads into all functions, the CHRO�s office too needs specificity and precise decision-
making without compromising speed. Now is the time for the HR function to evolve as a true business partner,
by enhancing the quality of the people decisions to show a tangible impact on business performance. Based
on our own consulting experience over the last 28 years in 15 countries, we can say that this is exactly what
most CEOs and business heads are expecting from HR. Just to quote a couple of recent experiences we had: A
business unit head said that the kind of insights we provided would enhance the risk-taking ability of delivery
heads. Another C-level leader was thrilled how our leadership index was spot on in calling out ineffective
leaders and identifying successors.
Just as the CFO helps the CEO lead the business by raising and allocating financial resources, the CHRO
should help the CEO by building and assigning talent, especially key people, and working to unleash the
organization�s energy. Managing human capital must be accorded the same priority that managing financial
capital came to have in the 1980s, when the era of the �super CFO� and serious competitive restructuring
began.
“If you and I don’t think beyond what has been thought, HR as a profession will not progress” – JM Sampath
NHRD Network Journal July 2017 |

67
Tej Mehta is an entrepreneur, consultant and student of human sciences.
He has founded OWEN Analytics with the objective of uncovering deep insights
about organizations and their employees using data. Tej and his team utilize latest
concepts in AI, machine learning and ONA (Organization Network Analysis) to
develop predictive as well as prescriptive solutions for people analytics.
Previously, Tej was a Vice President at Seabury Group, the largest aviation advisory
in the world. He worked with C-level clients to assist them with restructuring,
strategy and operations issues. He has lived in India, US and Europe, and worked
in over 20 countries around the world.
Tej has an MBA degree from University of Southern California.
Tej Mehta
Using Predictive Analytics in HR in Eight Steps
About the Author
Article Contributed by S. Ramesh
NHRD Network Journal July 2017 |

68
Analytics typically goes on a 3 stage maturity model.
� Descriptive
� Predictive
� Prescriptive
Descriptive analysis is what we do on an everyday basis. All our measures are descriptive in nature. How many
people do we employ, what is our gender distribution, how many offers we have made in the last quarter all
either describe an action that has happened or the status of an organization or the efficiency of a function.
Within this of course, the measures can indicate either an activity or an outcome.
We have interviewed 250 people is an activity measure. While the fact that 125 people have joined us is an
outcome measure. Within this, we calculate ratios on the basis of historic performance. We create measures
like Join ratios and build a recruitment pyramid to arrive at ratios. This really works on the basis that if on an
average 70% of all offered employees have joined us; the number is likely to be the same going forward. If we
need an additional headcount of 200 people in 3 months� time, we should make 200/ 0.7 = 285 offers.
This type of analysis is typically used for projecting into the future and prescribing what should happen. So, why
is this not predictive analytics?
The big assumption we are making when using the ratios is that past performance is a likely indicator for future
performance. In general, tolerances within HR accept the variations arising from extrapolation. You may not get
it right, but you won�t be too wrong either.
However, Subtly Reframing the Question, Changes our Perspective.1. What if we really have the resources only to hire within a +/- 5% range? If we need 200 people we need to
make sure it happens by making only 220 offers?
2. What if we need to track the number of offers dynamically as the market conditions are changing rapidly?
Our final objective could be a range between 150 to 200 that we do not even know now?
So, a static, extrapolation based prediction works in most cases. However it is not very efficient or dynamic. We
would need a more dynamic way of prediction to manage in such situations.
Based on experiences with predictive retention modeling, the following steps need to be undertaken for a
predictive model in HR with high degree of accuracy. The example relates to the context of retention, but the
principles hold good across the board.
1. Visualize the business case
A proper exercise in predictive analysis needs rigor as well as accurate data. This needs investment of
time from not only the specialists but also business. There is any number of scenarios for predicting
outcomes. However, the following have gained traction because of their business impact.
� Retention modeling
� Offer to join modeling
� Competency to performance modeling.
It is not enough if we just say we want to increase retention. One of the organizations employed 2500 people in
frontline sales. This function had high attrition to the tune of 35%. In terms of lost opportunities, lower
productivity and cost of training this cost the company around Rs 100 crores per annum.
A reduction of attrition from 35% levels to 25% levels would at the least result in savings of Rs 30 crores.
Obviously then the scope of retention modeling selects itself! Prediction exercises should be carefully selected
for business impact.
Using Predictive Analytics in HR in Eight Steps
NHRD Network Journal July 2017 |

69
2. Develop the Hypothesis
Companies have different approaches when employees leave. A few have extensive models for capturing
the information on the exiting employee while it has become a ritual in many places. Having decided to go
forward with modeling retention, it is important for us to select key hypothesis. It is not sufficient to stick to
generalizations like
� Employees are leaving in search of a better package after the increments.
� Employees leave managers not companies
� Employees do not leave for compensation, they leave for growth.
It is not unusual for HR research studies that will offer one or more of the above insights. And these have more
than a whiff of truth. However, unless your company has participated in the study, the extrapolation cannot
happen as a rule. Yes, there would be bad managers and some would leave for growth. However we need to
capture all our assumptions by doing a workshop with business and HR leaders.
A connected step is to see whether we have measures and data to examine the hypothesis. Our summary table
could look like
Hypothesis Key variables/metrics Availability of data
� Specific demography of employees
have higher churn rate
� Market specific factors affect attrition rate
� Executives with low or declining sales
performance are expected to exit faster
� Manager�s attitude and influence is a key
factor contributing to attrition
� Gender
� Age
� Level of education
� Location
� Historic location
performance
� Sales performance
of the executive
� Decline in sales
performance
� Yes
� Yes
� Yes
� No
Now not only know what our hypotheses are but also the practicability of each one of them based on dataset
available.
3. Exploratory Analysis
We need to examine each hypothesis to not only validate them but also see whether any patterns have
been missed out.
For example let us say one of our hypotheses is that the number of pay rate changes an employee has
impacts their engagement.
Then a plot like the following would help us explore the impact of pay rate changes on employee engagement.
This is a scatter plot for a group of employees. For employees in front line the pay levels often change due to
different commissions being paid based on the performance. In this visualization we compare the frequency of
such changes against their employment levels.
The analysis does support our original assumption that changes in pay-rates do have an impact on the
engagement levels. While the engagement stays high as long as the average is around 1.5, with increasing
NHRD Network Journal July 2017 |

70
changes the engagement levels actually drop. Our hypothesis could be that a high variation in pay rates during
a year reduces engagement and leads to attrition.
By such explorations, we create a shorter set of hypothesis that is meaningful.
4. Completing the Data Set with Subjective Analysis where Feasible.
It would be very important for a predictive model to be able to map against the individual engagement
level. On the other hand, our traditional surveys insist on confidentiality. We would know what
demographic of employees have low engagement. However we have no way of knowing who exactly is
unhappy.
Once we have completed the hypothesis short listing, our data sufficiency would look like this. Where
there are gaps, perception data is used to supplement the existing dataset.
NHRD Network Journal July 2017 |
S.No Factors Historic Data Survey Data
1 Tenure Y
2 Education Background Y
3 Source of Hiring Y
4 Gender Y
5 Marital Status Y
6 Location Y
7 Hometown Y
8 Supervisor Y
9 Individual Performance Y
10 Absenteeism N
11 Manager Infulance N Y
12 Motivation Levels N Y
13 Level of Collaboration N Y
14 Access to Resources N Y
15 Industry Factors N
16 Compensation w.r.t Competition N

71
This is where a technique like �Organization Network Analysis� becomes relevant. Organizations are not what
their formal structure denotes. Let us look at a social network metaphor. In social networks, the stories can
emanate from anywhere and gain likes. Influencers in social networks are not necessarily the biggest stars but
ones with a very original point of view. It helps to be a celebrity.
Similarly, work and goals cascade down a formal organization structure. Increasingly, organizations resemble a
network and the successful ones are far more cohesive than those which are not. The informal, uncharted
organization wields as much influence or more, than the formal.
Mapping information flows helps us in recreating the informal organization. Correlating the cohesion of the
informal organization with the percentage of in-house/ lateral talent would establish the case to groom from
within or otherwise.
Mapping the informal organization will need us to actually run simple surveys and build visualizations based on
the response.
The brief survey can have questions across areas like mentorship, innovation, career etc. In the survey, specific
questions to employees to enlist, who in their peer group is
� Someone who they interact with for helping out with their daily issues
� Someone who they look upto as mentors
� Someone who is their role-model and whose inputs they value for career growth.
That someone can be their manager, but also a peer or a manager in a different group. These lead to us not only
data points to supplement the model but also unique insights into the functioning of different teams and their
strong and weak links.
As the illustration shows, there are big differences between the team with high attrition and with low attrition.
5. Building the Predictive Model
Now HR completes the work with business and passes it onto the analytics experts. There are enough
tools and techniques that help with analyzing the data. For instance,
� Logistic regression
� Random forest
� Decision trees
NHRD Network Journal July 2017 |
Low Attrition Team
Highly cohesive team with interactions outside
the core region
Several connections across hierarchyHi
� Attrition rate: 13%
� Collaboration score: 2.7
� Performance: 101%

72
Are all techniques that can be used to build predictive models. A decision tree could look like:
6. Model Validation
The validation of model is done using the truth table. Essentially an algorithm is generated using the
existing variables. Then it is run on existing data to see its predictive abilities.
1. How many cases where the model predicts retention and the employee stays?
2. How many cases does the model predict attrition but the employee quits?
3. Where does the model predict retention but employee quits?
4. Where model predicts attrition but employee stays?
For the ideal model, 1+2 should be 100% and 3+4 should be 0%. While that is the ideal state, even a model that
predicts 80% of the time is a huge improvement on what we currently have.
7. Fine Tuning the Model
The model is a dynamic entity. While one could run a version of the finalized model, continuous learning
can take place by adding more variables and seeing whether the accuracy improves. This lies at the heart
of artificial intelligence.
8. Working with the Outcomes
It is tempting to use the model as a novelty. However, the real benefit comes from actually going back to the
assumptions. We estimated that reducing attrition from 35% to 25% will save us 30 crores at least. So, a
risk profile is created for each employee and the nature of risk is flagged. (Manager relationship,
comparative salary, last relocation etc.) Then necessary actions are taken to minimize attrition.
NHRD Network Journal July 2017 |
No Attrition Attrition Class accuracy
No Attrition 562 57 90%
Attrition 78 117 60%
Overall accuracy: 83%
Predicted Class
Ac
tua
l C
lass

73
For example, if we have been able to create a risk profile for each employee. We need to take this forward
from the risk. The objective is to address the high risk employees and take actions within the framework.
Simplistically, it could look like
EMPLOYEE NO WHAT COULD
TRIGGER ATTRITION
2001
3001
4001
35%
60%
90%
Safe in the near future
Next project allocation in
the same technology
Have a 1-0-1 to identify
what she wants after the
present assignment.
Get her inputs and try
to arrive at a joint plan
Continue communicating
Is disengaged. Work
quality is diminishing
Have a conversation. Start
making back-up plans in
case the person leaves.
RISK
PERCENTAGEACTION
NHRD Network Journal July 2017 |

74
Aadil is Belong�s Outbound Hiring Evangelist with a proven background in helping
companies bringing on-board their most valuable asset: their people. As part of his
role, Aadil consults Enterprise Talent Leaders with building innovative capabilities
that help achieve their strategic talent goals: from talent discovery, engagement
and branding strategies to implementing best in class technology and processes.
In his earlier avatar, Aadil was a Senior Customer Success Consultant with
LinkedIn who consulted with LinkedIn�s Strategic & Enterprise Customers in India
on their Talent Strategy and advised them on their Employer Brand. Prior to
LinkedIn, Aadil was part of Dell�s Global Talent Acquisition Social Media Strategy
Team responsible for crafting and executing their Talent Acquisition Social Media
Strategy in India.
SHRM India has ranked Aadil as one of India�s Top 20 Most Influential People in
Human Resources on Social Media for three consecutive years � 2012, 2013 &
2014-15.
Aadil Bandukwala
Outbound Hiring � The Future of Intelligent Recruiting
About the Author
NHRD Network Journal July 2017 |

75
Acombination of mega trends is reshaping our talent landscape. Disruptive business models and new
technologies are forcing businesses to evolve fast, fuelling high demand for talent. But the rise in demand
has been met with a shifting supply, thanks to fundamental changes in candidate behaviour.
The best candidates today don�t apply. They discover new opportunities through personal and social
networks, respond to companies that value them for more than their skills and expect personalized
experiences, not transactional engagement. With no dearth of choices, the best candidates today are no
different from your best customers.
In the recruiting world, power clearly has shifted from Employers to Candidates. According to research
published in the Harvard Business Review, more than 90% of recruiters today agree that it�s not an employer
driven market any more.
thAccording to the 17 Annual Global CEO Survey by PWC, CEOs feel that HR isn�t ready for the task ahead.
When asked how well prepared the major functions in their business were to capitalise on transformational
trends, only 34% felt that HR was well-prepared.
Per SHRM�s , average cost per hire globally is trending at USD 4129 2016 Human Capital Benchmarking Report
while firms in the 25th percentile are trending at 500 USD. Baffling to note that the difference between the top 25
percentile firms in the market vis a vis the others is 8X when it comes to cost per hire. The survey finds a similar
trend in the Time to Hire metric. While firms in the top 25 percentile tend towards 20 days in terms of Time to Hire
as a metric, others are 2X when it comes to the same and are trending towards 42 days on average.
Interestingly, these numbers tie in to firm�s annual overall turnover rate. While those in the top 25 percentile
witness a 6% annual turnover rate, others are averaging 3X at 19%. Clearly this has not just Talent Leaders but
also CEOs worried.
CEOs have led their organisations through the toughest of years, but the fight isn�t over. The most successful
organisations will be those that learn quickly how to harness the opportunities and minimise the risks brought
by mega trends. Specifically for the above, HR and business leaders will have to fundamentally re-evaluate
their talent acquisition capabilities. The emergence of analytics, social, personalized marketing, and an
increased recognition of talent as a CEO concern -- all enable an intelligent, business-aligned approach to
strategic hiring. We call this Outbound Hiring - the future of recruitment.
Outbound Hiring � The Future of Intelligent Recruiting
If you had to choose one, how would you describe today’s talent market?
A CANDIDATE
DRIVEN MARKET
AN EMPLOYER
DRIVEN MARKET
SOURCE: https://hbr.org/2016/03/a-bad-reputation-costs-company-at-least-10-more-per-hire
2011 2012 2013 2014 2015
54 56 67 68 79 80 83 90
48 44 33 32 21 20 17 10
NHRD Network Journal July 2017 |

76
Outbound Hiring � Flipping the Hiring Funnel!
Outbound Hiring is a targeted, candidate-focused approach that coordinates personalized talent acquisition and business efforts to hire people who succeed in your company.
Outbound hiring fundamentally flips the inbound recruiting funnel. Instead of waiting for the best talent to
wander in, outbound recruiters proactively engage the right people at the very start by using social talent data
and predictive analytics. Businesses save hundreds of recruiting hours that are otherwise wasted on
marketing, filtering and screening unqualified candidates. And because outbound hiring delivers a
personalized candidate experience at every stage, recruiters and hiring managers see far higher engagement
and join rates from candidates.
How Outbound Recruiting Is Different from Inbound Recruiting
1. It's Candidate-Focused
By design, inbound recruiting is a process built for the employer, not the candidate. Think about it, once a
job advertisement goes out and thousands of candidates apply, most candidates never end up hearing
back. Multiple reasons abound: it's impossible for recruiters to get back to so many candidates, or most
applications are irrelevant to the actual requirement, or worse, recruiters can never find the right profiles in
the first place. Outbound recruiting fundamentally flips this approach to target and engage only those
candidates that are highly relevant and potentially ready for new opportunities.
2. It’s Data-Driven
Inbound recruiting is at best an ad-hoc process, whose success is tied to whoever chooses to apply to
you. Outbound recruiting solutions, however, rely on data and analytics to scan the entire talent universe
to point you to candidates who best fit you.
How outbound hiring flips the inbound recruiting funnel
Personalizedengagement
=Great candidate
experience
Transactionalengagement
=Bat candidate
experience
Predictive analyticsMachine learning
Social date
CAREERSSITE
ATS JOBS ADS
Outbound HiringInbound Hiring
Low Effort
+
High Accuracy
High Effort
+
Low Accuracy
Engage
Delight
Interview
Offer
Join
Target
Interview
Screen
Qualify
Applicants
Offer
Join
NHRD Network Journal July 2017 |

77
3. It’s Proactive
As discussed above, Outbound is a proactive hiring strategy in which recruiters don�t wait for the best
talent to apply, but instead directly reach out and engage them through personalized content and
messaging. It is supported by a set of marketing tactics - including targeted advertising, lead nurturing,
and tailored events.
4. It Leverages Personalization
Outbound recruiting is based on the fundamental premise that people respond to content and messages
that are relevant and insightful to them. In fact, nothing is more annoying to passive talent than when
recruiters try to harvest them like sardines using dated blast marketing tactics.
5. It Measures Business Outcomes
Because of these differences, the way outbound recruiting is measured is different from traditional
inbound recruiting. While outbound ties outcomes to strategic business goals, inbound has historically
measured its impact using operational hiring metrics. See our Metrics chapter for a more detailed
discussion.
Why Outbound Hiring is the Future of Intelligent Recruiting
1. Returns on Inbound Hiring are Diminishing
Business and Talent Acquisition teams are realizing that inbound methods today are proving frustratingly
ineffective at attracting top talent. LinkedIn�s Global Talent Trends 2015 Report concluded that while a lot
of people look for jobs, most don�t apply. In fact, the report goes on to state that top talent �tends to be
highly satisfied� with their current jobs, and will need to be proactively engaged. As Business begins to
demand both speed and quality in hiring, waiting for the best talent to wander in simply doesn�t seem like a
smart strategy.
2. Business + Talent Acquisition are Aligning Strongly
Growing emphasis on employer brand, candidate experience and data in decision-making has brought
Business and Talent Acquisition teams closer together than ever before. While an analytical and ROI-
driven approach to hiring has earned Talent Acquisition new respect in the C-Suite, increased
engagement from Business has made Talent Acquisition more aware of the challenges Business faces.
This alignment lends itself powerfully to the success of an outbound hiring strategy.
3. Technology has Come Together
Outbound recruiting has always been a viable strategy. Executive Search firms have leveraged outbound
recruiting for high-value, strategic roles for decades. But today, new technologies and processes are in
place to make outbound hiring much more scalable, including personalization, artificial intelligence,
prediction-enabled targeting, social networks and more.
4. Data is Available and Easy to Access
The explosion of social media, professional networks and job boards has enabled recruiters to access
data that provides invaluable candidate-specific insights. This ranges from proof of a candidate�s past
work to their growth patterns to their circles of influence and networks. All of this can be leveraged
tremendously -- from targeted candidate discovery to personalized engagement to passive talent
nurturing.
5. Analytics is Ready
While candidate-centric data has become easier to access, the analytics required to put that data to work
is also ready. Data-driven hiring solutions today can quickly learn and suggest candidates who match your
hiring needs; recommend engagement tactics that deliver high results, and even highlight potential red
flags in your hiring process.
NHRD Network Journal July 2017 |
78
6. It Just Makes Sense - for Everybody
As we noted above, top talent today doesn�t apply. Poorly-written job descriptions, mass-targeted ads,
broken application platforms all serve to drive them away. And why should recruiters spend precious
hours sifting through irrelevant resumes or engaging unqualified candidates? Think about the prohibitive
cost your business incurs in the process. Which is why a hiring process that helps you quickly spot and
proactively engage top talent makes much more sense.
Proof that Outbound Hiring WorksLet�s talk about Tavant Technologies. An undisputed leader of IT solutions, especially in consumer lending,
warranty management, media and entertainment. They are routinely recognized as one of the best employers
for IT talent in the country. As Tavant expanded, they experienced a dramatic rise in demand for mid to senior
talent for niche and critical tech roles, which needed quick closure. The right candidates for these roles were
largely passive, making it difficult to identify and engage them via job boards. Significant time was spent
interviewing irrelevant candidates who didn�t fit the role, resulting in poor conversions and unfulfilled positions.
Tavant was quick to realize that inbound wasn�t really a channel they could bank upon and chose to experiment
with outbound.
Leveraging a leading outbound hiring platform, Tavant started focussing on engaging top-tier talent for specific
roles by curating the right people across 90+ professional networks and communities. As next steps, Tavant
observed and integrated their hiring preferences based on historical data, including shortlists, interviews,
tenure and growth patterns of employees, and stack ranked candidates in the order of relevance. Further, they
started using artificial intelligence enabled automated reach-outs to candidates that focussed on delivering a
great sales pitch in every single instance.
Bottom Line: Tavant was able to reduce their Time to Hire by 20%, Increase Candidate Engagement by 55%
and see a more than 50% reduction in Interview to Offer ratio.
Increasingly, Talent Leaders have been finding greater relevance in embracing outbound hiring today. As Savita
Hortikar � India Head of Talent Acquisition puts it, �While Outbound recruiting is as old as the hills, the advent of
tech in hiring has proven to be the real game-changer. Platforms driven by data, personalization and machine
learning empower recruiters to find the right talent, kick in efficiency and pull down Cost Per Hire Metrics. I
would say data-driven outbound hiring is the most intelligent and scientific method to find top talent�
Question to you the 21st Century Talent Leader – when are you #GoingOutbound? .
NHRD Network Journal July 2017 |

How far do you think your function has adapted analytics? How would you compare the usage with that
of other functions?
We are about 600 people and hence some of the complexities of a large firm are not applicable to us. Our
constant effort is to simplify and make accurate action recommendations. Attrition prediction, Quality of hires,
Morale indicators are all measures we are attempting to get right and it's been a continuous journey. The
challenge also is to combine data with on ground realities - and suggest actions that are practical so more than
getting everything right from a data perspective we are trying to combine things to drive action on the ground.
Given that the firm deals with big data the other functions are far more evolved on analytics.
How have you organized analytics in your function? What do you use them for? (Reviews, problem
solving, prediction etc.)
Reviews, prediction and getting pointers to take improvement actions. Right now we have a mixed model there
is a central function which looks at the comprehensive aspect - dashboard, benefits analysis, benchmarking
etc. OD does attrition and performance tracking. BP's do Talent Review - so it's a bit central but also
decentralized for specifics.
Any cool experience with analytics that you would like to share?
We do something called Talent Review Tool which uses extensive perspectives - we bring in different cuts of
data - structure, top performer mix, attrition, overseas travel, cost, profitability and many others along with
benchmarks and then combine it with qualitative elements like Culture, Management style, work challenge,
potential etc. to arrive at a one page snapshot with top 5 recommendations- this has been an eye opener for
many leaders - when a big picture can be assimilated into specific actions and those can be attributed with a
clear reasoning- people take action - they understand linkages.
A new insight or a new approach that helped you?
Same as above. We also do Culture audits, diversity audits, Span of control studies apart from regular stuff.
Where do you see the adaption of analytics going in HR? Is it going to be an evolution as it has been so far? Or
the tools available will be able to bring in revolutionary insights?
Really the big picture is to understand human behaviour in your environment- so that you know how to
maximize positive outcomes.
In my view analytics is still an evolution and I am an advocate of using data to drive action rather than over
analyzing to death. Often what is missing is the cycle where data drives action; the action benefits the end user
so much that they want more. We haven't yet been able to sell that proposition to business well enough. At this
point it's still us trying to push data and reports - instead of really focusing on outcomes driven by analysis. I
think the gap is in human skills of HR - positioning the benefits properly to business, influencing, following up
and supporting - rather than just tool abilities.
Interview with S.R. SriramDirector & Head � Human Capital, Arcesium India Private Limited
NHRD Network Journal July 2017 | 79
Disclaimer: The views and opinions expressed in this article are those of the authors and do not necessarily reflect the views of NHRDN.

How far do you think your function has adapted analytics? How would you compare the usage with that
of other functions?
HR function has adopted analytics (analysis?) to some extent and not to the extent that sales, operations,
finance and FP&A have.
How have you organized analytics in your function? What do you use them for? (Reviews, problem
solving, prediction etc.)
HR delivery units do their own contextual analysis. For example, recruitment does analysis on hiring
efficiencies, BPHR on cost to revenue, attrition, Performance Management Team on impact of incentives on
performance and so on. Most analysis is efficiency focused, a bit for problem solving, a bit for reviews. Very
little or none has been done for prediction.
Any cool experience with analytics that you would like to share? A new insight or a new approach that
helped you?
Cool experience (or) learning was on how important it is to be careful about co-relation and causation. We had
high attrition in a particular level in a particular role. So we did some analysis and we were able to arrive at very
good co-relations with percentile ranking in salary levels, performance ratings, time from last promotion,
movement of percentile salary levels over a period of time with more infusion of laterals at higher salary levels
and a few other factors. A select combination of factors threw up stronger co-relations. However, we thought
we will dig into the causation aspect. So, we drafted a questionnaire with the help of a qualified psychologist;
she called every single person who left. We figured that the reason they left was primarily due to some
workplace behavioral issues. Through some masked placebo questions and follow through questions, we
validated the same. The attrition analysis by supervisor cohorts did not throw up this pattern because this was
evenly distributed across supervisors and the behavioral issues were more due to wrong structuring of the
delivery organization that resulted in high work place pressures during specific periods in a month. A simple
redesign of the organization brought down attrition levels drastically over an 8 month period to nearly a fourth of
original levels. If we had gone with the earlier analysis, we would have ended up throwing money at the problem
and not solved it still. Learning: Causation analysis is as important if not more important than co-relation
analysis. However, co-relation analysis is required to rule out obvious hypothesis.
Where do you see the adaption of analytics going in HR? Is it going to be an evolution as it has been so
far? Or the tools available will be able to bring in revolutionary insights?
In my personal opinion, HR folks specialize in externalization and generalization of specific problems and
hence analytics will be perpetually evolving in HR till the end of time, tools or no tools. A curious mind and data
only big enough to be held on an XL or Access database is enough to bring out the best insights and these have
been available long time back. What we have now is tools that visually bring out statistical outputs, but if the
mind is not curious or determined, it is of no use. What is more important to drive in HR is a culture of ownership
(I own the people agenda in my company, period), a curious mind (What, so what, now what), and courage (to
say, this is the right thing to do, I know it because I have the data). If these three basics are there, the available
tools will be big catalysts. To start with, we can focus on determination, curiosity and courage.
NHRD Network Journal July 2017 | 80
Interview with Santosh ThangaveluSr. Vice President & Head, IT Talent Supply Chain Solutions, Teamlease
Disclaimer: The views and opinions expressed in this article are those of the authors and do not necessarily reflect the views of NHRDN.

How far do you think your function has adapted analytics? How would you compare the usage with that
of other functions?
HR function is trailing behind Sales, Marketing in adapting analytics. While the HR team is aware of analytics
and potential use cases - lack of systems currently is limiting higher adaptation.
How have you organized analytics in your function? What do you use them for? (Reviews, problem
solving, prediction etc.)
As of now, usage is limited to reviews, moving towards prediction in a phased manner once we have systems in
place.
Any cool experience with analytics that you would like to share? A new insight or a new approach that
helped you?
Most recently, we rolled out an engagement survey for employees, we used tools for assessing sentiment
analysis from the verbatim comments and looked for correlations from these comments and scores that
employees gave on questions related to advocacy, engagement.
Where do you see the adaption of analytics going in HR? Is it going to be an evolution as it has been so
far? Or the tools available will be able to bring in revolutionary insights?
My view it's going to be an evolution, as opposed to a revolution, however the rate of evolution will rapidly
increase with a suite of HR Systems and tools that are being adopted by enterprises.
NHRD Network Journal July 2017 | 81
Interview with Sai Kumar ShamannaChief People Officer, Mobileum
Disclaimer: The views and opinions expressed in this article are those of the authors and do not necessarily reflect the views of NHRDN.

What is your perspective on HR Analytics?
HR Analytics is projected to be bigger than its actual footprint. Retention analysis is being performed for more
than 20 years now. The intensity of analysis is more, because of tools availability. This has helped companies
move to early warning systems. In India, the flavor is relatively new.
The benefits of HR Analytics are more readily visible when we are looking at global companies with large
headcount like TCS or IBM. They employ in lakhs. Smaller companies need to focus on what impact they have
on business. They should be focused on the business leverage and what role HR plays in improving this
leverage. This would help focus the analytics efforts, instead of what is trending.
What has been the use of analytics in your organization?
We employ people from across the country in our outlets. We had an opinion that during specific times, these
people just drop whatever they are doing and go to their native. Analysis helped identify the timing and
patterns, which confirmed our opinion. With this insight, we built a model for predictive hiring. For instance,
� During Ganpati in August, people move out in the Western Region.
� During harvest season, people from rural areas go back home.
So we increase our hiring in July so that the customer service does not drop even with the disruption with
people leaving. Headcount approval happens proactively.
Worker productivity is a measure of business leverage with HR input. Using industrial engineering and
analytics, we have been able to reduce the headcount/ outlet from 5.5 to 4.5 persons. This across 1700 outlets
is a big saving. We have also been able to model the how the work flows in a CCD outlet and simplify it.
We are able to use MS Excel effectively for many standard HR analysis. Excel macros are very helpful. In
general we ask the following questions before using deeper analytics
� Is this an important problem to business?
� What is my hypothesis?
� Do I have data of some size and scale?
� Do I have the tools and techniques?
� Am I getting an insight? What is the view of experts?
Where do you see the future of analytics in HR?
It is very important to bring in analytical problem solving ability into HR curriculum in colleges. This should be
classified into 3 levels possibly
� Basic statistics and spreadsheet skills ( e-g. median, Vlookup etc.)
� Advanced statistics and spreadsheet skills ( Regression, Macros etc.)
� Statistical package skills. ( Logistic regression, Minitab etc.)
Embedding this in addition to cultivating a mind for presenting with data, appetite for statistics and looking for
causal relationships will help align HR to Business. Also, identifying such skillset will make HR a skill based job
rather than what is wrongly perceived as a common sense job.
NHRD Network Journal July 2017 | 82
Interview with N. BalachandarGroup Director HR, Café Coffee Day Group
Disclaimer: The views and opinions expressed in this article are those of the authors and do not necessarily reflect the views of NHRDN.

Business Appreciation
Hands on expertise on
XL and other toolsStatistical orientation
NHRD Network Journal July 2017 | 83
Even as HR staff develop these competencies, in CCD we are also enhancing the team competency by hiring
analytics specialists into the team to supplement the efforts.
Disclaimer: The views and opinions expressed in this article are those of the authors and do not necessarily reflect the views of NHRDN.

How far do you think your function has adapted analytics? How would you compare the usage with that
of other functions?
3 on a scale of 10
How have you organized analytics in your function? What do you use them for? ( Reviews, problem solving,
prediction etc.)
Current usage is more in compensation administration.
Any experience with analytics that you would like to share? A new insight or a new approach that helped
you?
GPTW survey gives us manager scorecards- predictor of team's performance and predictor of employee
attrition in the team.
Updation of a senior executive's linkedin profile is a predictor of intent to actively seek / be open to external
career opportunities !
Where do you see the adaption of analytics going in HR? Is it going to be an evolution as it has been so
far? Or the tools available will be able to bring in revolutionary insights?
We need to start using metrics by own initiative to assess managers' effectiveness, orgn health, attrition,
effectiveness of target setting, improve predictability of selection interviews / assessment centres by
combining with data from actual performance on the job.
84
Interview with Jayaram PhilkanaChief People Officer, UPL
NHRD Network Journal July 2017 |
Disclaimer: The views and opinions expressed in this article are those of the authors and do not necessarily reflect the views of NHRDN.

What is your perspective on analytics in HR?
It is high time we became a more analytical function than we have traditionally been. I often see HR Leaders
focusing excessively on HR automation while spending far less time on HR Analytics.). To me both automation
and analytics are equally important. Other functions are able to present themselves as analytics savvy. CEO
would expect us to be at least as savvy as the CFO or CMO in using data for presenting viewpoints. Business
has costs and the costs incurred by the HR function should be able to justify itself.
While it is extremely important to keep the �human� element in the function, it is just not enough for us to be
social workers anymore. HR function needs to move forward by getting in step with technology and analytics.
Any fast growth environment brings a certain amount of complexity with it; and several of our businesses are in
fast growth mode. In turn, complexity can slow things down. With wicked-smart Analytics, HR has the ability to
simplify that complexity and help the business keep growing.
Any experiences from your company you would like to share?
We started with the low hanging fruits in recruiting, starting with measures like understanding recruiting costs,
structure, recruiter productivity, number of recruiters needed to fulfil capacity etc.
Amazon is a compulsively analytical company. Our business leaders have high expectations for HR leaders to
be analytical. 4-5 years back our CEO asked a question. � When our customer can give us feedback on our
products and services at any time she likes and at her will, why can�t our employees do exactly the same Pulse
surveys have a role, but they are not sufficiently continuous and give only once a year feedback.
HR worked on it and we now have a program called � Connections�. Every employee is asked one question on a
daily basis. This can be responded to from any device. The data is then collected and churned for insights. For
e-g. � Did you feel respected today� could be a question. With the data collected and analyzed for specific
teams, we are able to show the mirror back to the business on how their employees are feeling on matters that
are crucial to them. Together we then take appropriate action to address the issue.
This is one of the ways by which HR Analytics can influence culture. When you have 30,000 employees, it is
unlikely you will get a 1000 HR business partners. More likely you will get 30. Businesses have moved away
from ERP to smart technology using the cloud and HR should also do that change to present right insights to
leaders and recommendations to influence culture.
We also have dashboards that present multiple aspects of HR with a page zero, carrying the most important
information and metrics that are relevant to the business from an HR standpoint. Amazon is a self-service
company and we are trying to create dashboards that are downloadable and accessible real time. HR folks also
are becoming comfortable using tools.
Where do you see the future for HR analytics?
All facets of HR will be touched by analytics. HR may not be able to develop dashboards better than technical
people, but we can play an effective role of program managers to help develop the right dashboards and other
tools that help the business. In future, information availability is not going to be the challenge. It will be our
ability or lack of it to analyze the information with business understanding and developing insights that will
(delete: is going to) make the difference.
What if you were in the HR leadership of Motorola around 12-15 years back? You would have seen the exit of
people happening and some of them may have been going to Apple. However, applying the right mix of
analytics and business knowledge would have led you onto a deeper insight. People were leaving from very
NHRD Network Journal July 2017 | 85
Interview with Raj RaghavanHead Human Resources Asia Pacific Region, Amazon

specific functions and the cumulative capabilities of those functions would have been sufficient to sense that
Apple is putting together not any simple computing device, but a phone. Given their successes with devices,
HR could arguably have alerted the leadership to an emerging threat. That makes HR data very relevant. Maybe
Motorola HR did, to be fair to them. The larger point is that HR data is very crucial to the CEO especially when
business is at stake!
Often we refer to analytics in HR as a � Tool� and take pride in �HR Analytics Toolkits�. To me however, a tool is
something that is quick and dirty and helps fix a problem. On the other hand, analytics should be treated like a
�Product�. A product is developed, prototyped, tested and implemented. To become business critical, HR
analytics should be treated with the rigor of product. Otherwise, we may publish reports that no one reads.
There are many ways by which we can be busy, but building out analytics with a product approach is a surer
predictor of being successful and relevant.
NHRD Network Journal July 2017 | 86
Disclaimer: The views and opinions expressed in this article are those of the authors and do not necessarily reflect the views of NHRDN.


Shweta Jaiswal Thakur is a Fellow Programme in Management (FPM) scholar at
Management Development Institute (MDI), India. She received Post Graduate
Diploma in Management (PGDM) from BIMHRD and Masters Degree in Labour
Laws & Labour Welfare (MLL & LW) from Pune University. She has close to seven
years of corporate experience and has worked with leading names in the industry
like The India Today Group and Aon Hewitt. Her research interests include HR
analytics, strategic HRM, performance management system, psychological
testing, talent management, business analytics, and research methodologies.
She has published teaching cases, book reviews and research papers in outlets
like Harvard business review case publishing, Richard Ivey Canada, Employee
Relations � The international journal, Vilakshan, Vision and Personnel Psychology.
Contact author: [email protected]
Shweta Jaiswal Thakur
Book ReviewWinning on HR Analytics
Reviewed By
NHRD Network Journal July 2017 | 88

NHRD Network Journal July 2017 | 89
With the advent of digital revolution, big data and Analytics have become a
catchphrase. Latest kid on the block is HR analytics. HR analytics has
been defined in multiple ways (Thakur, 2017c). Lately Marler and Boudreau
(2016) have defined HR analytics as �an HR practice enabled by information
technology that uses descriptive, visual, and statistical analyses of data related
to HR processes, human capital, organizational performance, and external
economic benchmarks to establish business impact and enable data-driven
decision-making�. The book under review is about winning with the use of HR
analytics.
Instead of straightaway jumping on to the review I will spend some time
dithering about it with the help of its application in non organisational context.
Every person interested in analytics should watch the movie �Money ball� to
understand the significance and real time use of analytics in HR for better
business outcomes. The movie is inspired from a 2003 bestselling book. The
character Billy Beane, General manager of Baseball team uses data and analytics (Sabermetrics) for selecting
players for their team. It clearly depicts the difference between gut based and data based decisions. Use of
analytics helped the team identify the hidden gems at lower cost to form the winning team. If we take the same
analogy and analyze situation in an organisational context we would realize that we use experience and
intuition to take most of our people related decisions. For instance, who to hire? Common perception is that
hiring top scorers/grades or students passing out from top tier college are more capable and perform better
however Google recently stopped this practice after the analytics results showed that there was no significant
relationship between Grades and on the job performance. Precisely this is what the book is trying to offer and
build, data driven approach to decision making.
This book will help you understand these nitty gritties and significance of using data to drive any decision in
organisation. The book is for everyone who has interest in understanding the use of data in people related
decisions. Academicians, Practioners and students will find the book useful. Analytics Experts might not
benefit from it a lot as its less about statistical sophistication and more about analytical thinking. The book
intents at developing an analytical view of the function that leads to an effective use of what is available (data).
Even though both the authors are Practioners they have beautifully managed to bring in the flavour of relevant
theories and research wherever appropriate and needed. In fact the first two chapters will provide you a good
gist of research available on the topic in the literature. It starts with highlighting the significance and pain areas
of HR till discussion on business value of HR programs.
Authors have lived the topic throughout the book. It is evident from the number of data points, analysis; excel
tables and graphs in each chapter. These data points� helps in keeping the readers engage and also help them
develop analytical skills.
The best thing about the book is its approach towards analytics. It doesn�t prescribe sophisticated tools,
techniques and huge investments to perform analytics. Much of what is prescribed in the book can be done
without much investment. It is great for the firms which are low on analytics maturity. Reading the examples and
cases will certainly help the readers in building analytical capabilities.
Book ReviewWinning on HR Analytics

Bassi (2011) has classified analytics maturity in four levels (below)
The first three levels of analytics maturity are nicely captured in the book. Use of predictive analytics is few and far between. In the chapter focused on attrition authors have described the various predictive tools that can be applied in that situation. Also there is a case study on the topic in the appendix.
The book has a lot of good ideas on general HR practices. Authors have highlighted many small things which usually are missed in big organisations. Like in one of the examples authors highlight that almost whenever a role becomes vacant we start looking for the replacement at the same level without thinking about the background of the person who has attrited and in many cases we could close the position with a resource which is a level below with the one which has become vacant. Many examples of this kind makes you challenge the status quo and think in diverse directions. Moreover the focus of the book is more on building analytical skills rather than statistical skills which is the focus of many books on the topic (refer to Thakur, 2016, Thakur, 2017(a); Thakur, 2017(b)).
Authors view on analytics and its relevance to real life is sophisticated enough to pass muster with the skeptical, well read and world- weary readers. It has a fair blend of academic literature and practical insights. A must read for the beginners in this realm.
Reference:
Bassi, L. (2011). Raging debates in HR analytics. People and Strategy, 34(2), 14.
Marler, J. H., & Boudreau, J. W. (2017). An evidence-based review of HR Analytics. The International Journal of Human Resource Management, 28(1), 3-26.
Thakur, S. J. (2017a). Martin R. Edwards and Kirsten A. Edwards. Predictive HR analytics: Mastering the HR metric. London: Kogan Page, 2016, 456 pages,£ 29.99, Paperback. Personnel Psychology, 70(2), 507-508.
Thakur, S. J. (2016). Predictive Analytics for Human Resources. Vilakshan: The XIMB Journal of Management, 13(2), 147-148.
Thakur, S. J. (2017b). Gene Pease, Boyce Byerly & Jac Fitz-enz, Human Capital Analytics: How to harness the potential of your organization�s greatest Assets USA: Wiley and SAS business series, 2013, 236 pp., (Hardcover) Vision � The journal of business perspective (forthcoming issue � September)
Thakur, S.J. (2017c). Penetrate the fog: Get to know HR analytics. Indian Journal of Training and Development (Forthcoming Issue)
Operational Reporting
Advance reprting
Advance Analytics
Predictive Analytics
NHRD Network Journal July 2017 | 90

Since your journal has become online since January, 2016, you need to make sure that your email id is updated
with NHRDN national secretariat. Without your correct email ID we will be not in a position to send you the
issues at regular interval. In case you or your fellow professionals and members have any problem in receiving
the journal online do write to Pranay Ranjan ([email protected]) at national secretariat.
As you also have noticed that all our issues are theme based and therefore we do not publish any article in a
particular issue that is not related to the theme. So our request to future contributors will be to plan your
contributions based on the future themes only and send me your contribution only at [email protected].
Please also note that final decision to include your article will be based on the decision of the guest editor for
that particular issue and the editorial team. We would also like to know about the themes/contemporary issues
that you want to focus us in our future issues. Please send your suggestions and feedback to
[email protected] after reading this issue.
Message from Editorial Board
NHRD Network Journal July 2017 | 91

www.nationalhrd.org
Network HRD NetworkThe National HRD Network, established in 1985, is an association of professionals committed to promoting the HRD movement in India and enhancing the capability of human resource professionals, enabling them to make an impact ful contribution in enhancing competitiveness and creating value for society. Towards this end, the National HRD Network is committed to the development of human resources through education, training, research and experience sharing. The network is managed by HR professionals in an honorary capacity, stemming from their interest in contributing to the HR profession. The underlying philosophy of the NHRDN is that every human being has the potential for remarkable achievement. HRD is a process by which employees in organizations are enabled to:
Ÿ acquire capabilities to perform various tasks associated with their present and future roles;
Ÿ develop their inner potential for self and organizational growth;
Ÿ develop an organizational culture where networking relationships, teamwork and collaboration among different units is strong, contributing to organizational growth and individual well-being.