practitioner's guide for planning and analysis with the appalachian
TRANSCRIPT
A Practitioner's Guide for Planning and Analysis with the Appalachian Economic Diversity Web Tool
February 2014
Prepared for the Appalachian Regional Commission

A PRACTITIONER'S GUIDE FOR PLANNING AND ANALYSIS
CONTENTS
About this Guide .................................................................................................................. i
Introduction ........................................................................................................................ 1
About The Appalachian Economic Diversity Web Tool ....................................................... 2
Question 1: How is my economy doing? ............................................................................ 4
Question 2: How diverse is my economy and what risks and opportunities does that diversity present? ............................................................................................................... 8
Question 3: What kind of asset is my local workforce? .................................................... 14
Question 4: How is my county doing relative to similar counties elsewhere? ................. 18
Diversity and Economic Development Planning ............................................................... 22
Value to the Planning Process .......................................................................................... 23
Bibliography ...................................................................................................................... 26
ABOUT THIS GUIDE
This guide is one of four documents prepared as part of an extensive analysis of economic diversity for the Appalachian Regional Commission by the University of Illinois at Urbana-Champaign’s Regional Economics Applications Laboratory and the Center for Regional Economic Competitiveness, with assistance from the RUPRI Center for Rural Entrepreneurship and EntreWorks Consulting. Project leaders were Edward Feser, Ken Poole, Mark White, and Geoffrey Hewings, with Troy Mix serving as Project Manager.
Authors of this guide were Mark White and Ken Poole. Erol Yildirim and William Cook were primarily responsible for building the web tool.
In addition to this guide, the documents include a summary report (Economic Diversity in Appalachia: Statistics, Strategies, and Guides for Action), a detailed synopsis of case studies (Case Studies in Economic Diversification in Appalachia), and a technical report detailing methods, data, and additional findings (A Statistical Portrait of Economic Diversity in Appalachia). All reports associated with the project can be found here: http://economicdiversityinappalachia.creconline.org/Report/.
i


A PRACTITIONER'S GUIDE FOR PLANNING AND ANALYSIS
INTRODUCTION
Appalachian communities have long relied on one or two major industries to support their economies. To paraphrase an old saying: when those industries sneezed, Appalachian communities caught pneumonia. Not surprisingly, economic development practitioners working in Appalachia recognize the importance of promoting greater economic diversity. However, they may not be fully aware of just how dependent their local communities are on a single industry or handful of industries.
As part of a comprehensive analysis of economic diversity conducted for the Appalachian Regional Commission (ARC), the University of Illinois at Urbana-Champaign and Center for Regional Economic Competitiveness research team created a unique website designed to help practitioners better understand the structure of their local economies, both singly and in comparison to other counties and regions of similar scale and type within Appalachia and across the United States. The website taps a compilation of data elements to facilitate user-customized quantitative portraits of Appalachia’s counties and regions. The data, indicators, and visualization facilities together constitute a web tool rather than a simple website.1
The web tool includes data points designed to help practitioners and policy makers understand and explore several key concepts related to economic diversity. Through tables, charts, graphics, and maps, users are able to undertake selected analyses of their economies’ diversity quickly and easily.
While the web tool is not intended to be a single source of information and analytics to support all economic development planning, the tool is best suited to help address four commonly asked applied research questions:
1. How is my economy doing? 2. How diverse is my economy and what risks and opportunities does that
diversity present? 3. What kind of asset is my local workforce? 4. How is my county doing relative to similar counties elsewhere?
This guide is organized around plausible scenarios that economic development practitioners frequently encounter, often as part of a local or regional planning process. After providing a brief orientation to the website, the guide directs users through the mechanics of investigating each question using the data and tools the site offers. The guide also points users to additional resources that supplement the information on the website.
1 http://economicdiversityinappalachia.creconline.org/
1
A PRACTITIONER'S GUIDE FOR PLANNING AND ANALYSIS
ABOUT THE APPALACHIAN ECONOMIC DIVERSITY WEB TOOL
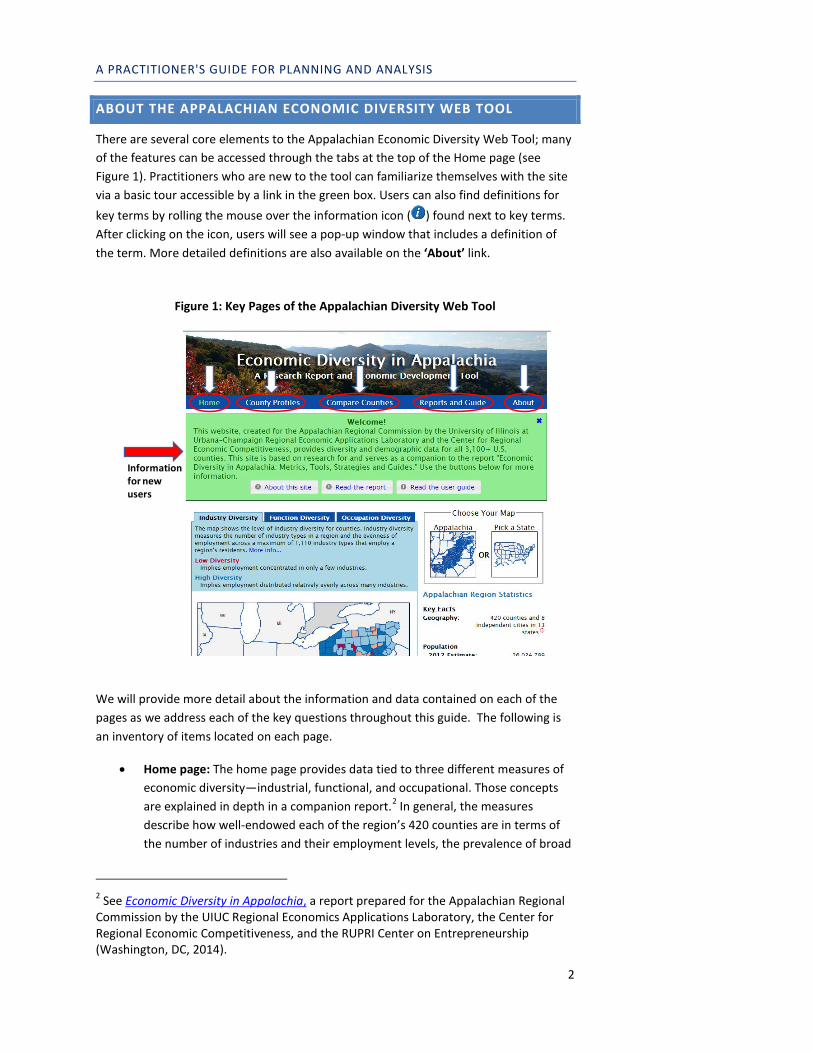
There are several core elements to the Appalachian Economic Diversity Web Tool; many of the features can be accessed through the tabs at the top of the Home page (see Figure 1). Practitioners who are new to the tool can familiarize themselves with the site via a basic tour accessible by a link in the green box. Users can also find definitions for key terms by rolling the mouse over the information icon ( ) found next to key terms. After clicking on the icon, users will see a pop-up window that includes a definition of the term. More detailed definitions are also available on the ‘About’ link.
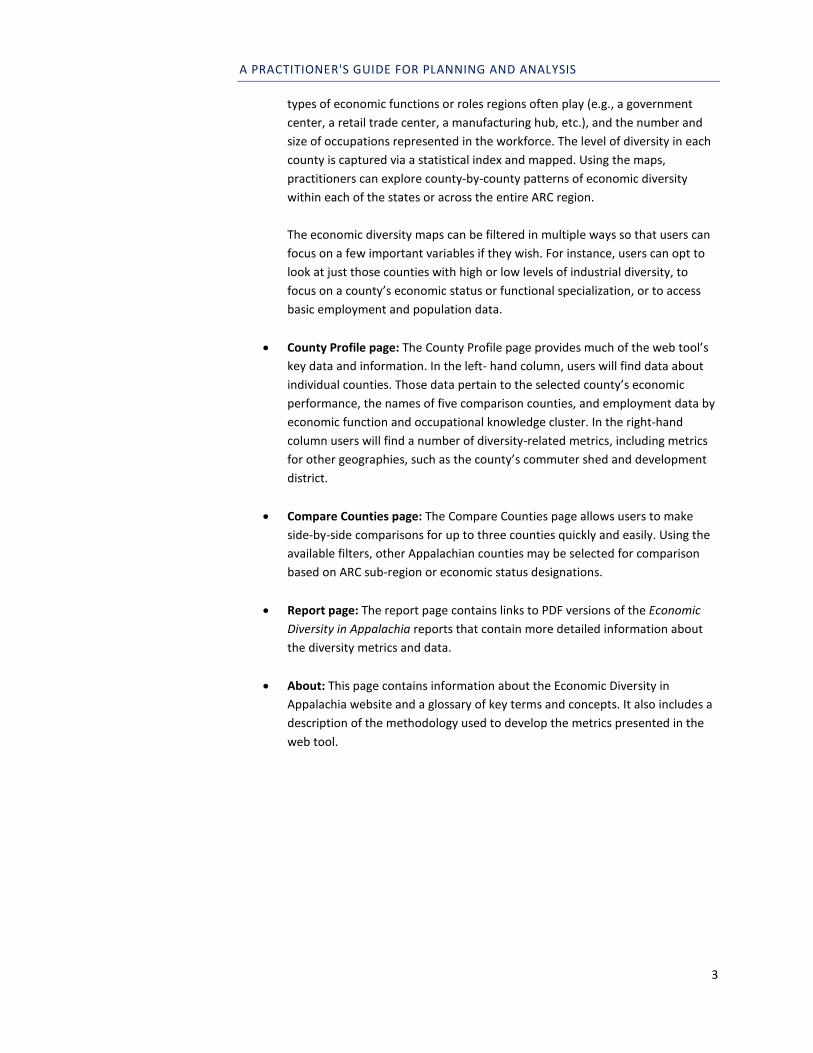
We will provide more detail about the information and data contained on each of the pages as we address each of the key questions throughout this guide. The following is an inventory of items located on each page.
• Home page: The home page provides data tied to three different measures of economic diversity—industrial, functional, and occupational. Those concepts are explained in depth in a companion report.2 In general, the measures describe how well-endowed each of the region’s 420 counties are in terms of the number of industries and their employment levels, the prevalence of broad
2 See Economic Diversity in Appalachia, a report prepared for the Appalachian Regional Commission by the UIUC Regional Economics Applications Laboratory, the Center for Regional Economic Competitiveness, and the RUPRI Center on Entrepreneurship (Washington, DC, 2014).
Figure 1: Key Pages of the Appalachian Diversity Web Tool
Information for new users
2
A PRACTITIONER'S GUIDE FOR PLANNING AND ANALYSIS
types of economic functions or roles regions often play (e.g., a government center, a retail trade center, a manufacturing hub, etc.), and the number and size of occupations represented in the workforce. The level of diversity in each county is captured via a statistical index and mapped. Using the maps, practitioners can explore county-by-county patterns of economic diversity within each of the states or across the entire ARC region. The economic diversity maps can be filtered in multiple ways so that users can focus on a few important variables if they wish. For instance, users can opt to look at just those counties with high or low levels of industrial diversity, to focus on a county’s economic status or functional specialization, or to access basic employment and population data.
• County Profile page: The County Profile page provides much of the web tool’s key data and information. In the left- hand column, users will find data about individual counties. Those data pertain to the selected county’s economic performance, the names of five comparison counties, and employment data by economic function and occupational knowledge cluster. In the right-hand column users will find a number of diversity-related metrics, including metrics for other geographies, such as the county’s commuter shed and development district.
• Compare Counties page: The Compare Counties page allows users to make side-by-side comparisons for up to three counties quickly and easily. Using the available filters, other Appalachian counties may be selected for comparison based on ARC sub-region or economic status designations.
• Report page: The report page contains links to PDF versions of the Economic Diversity in Appalachia reports that contain more detailed information about the diversity metrics and data.
• About: This page contains information about the Economic Diversity in Appalachia website and a glossary of key terms and concepts. It also includes a description of the methodology used to develop the metrics presented in the web tool.
3
A PRACTITIONER'S GUIDE FOR PLANNING AND ANALYSIS
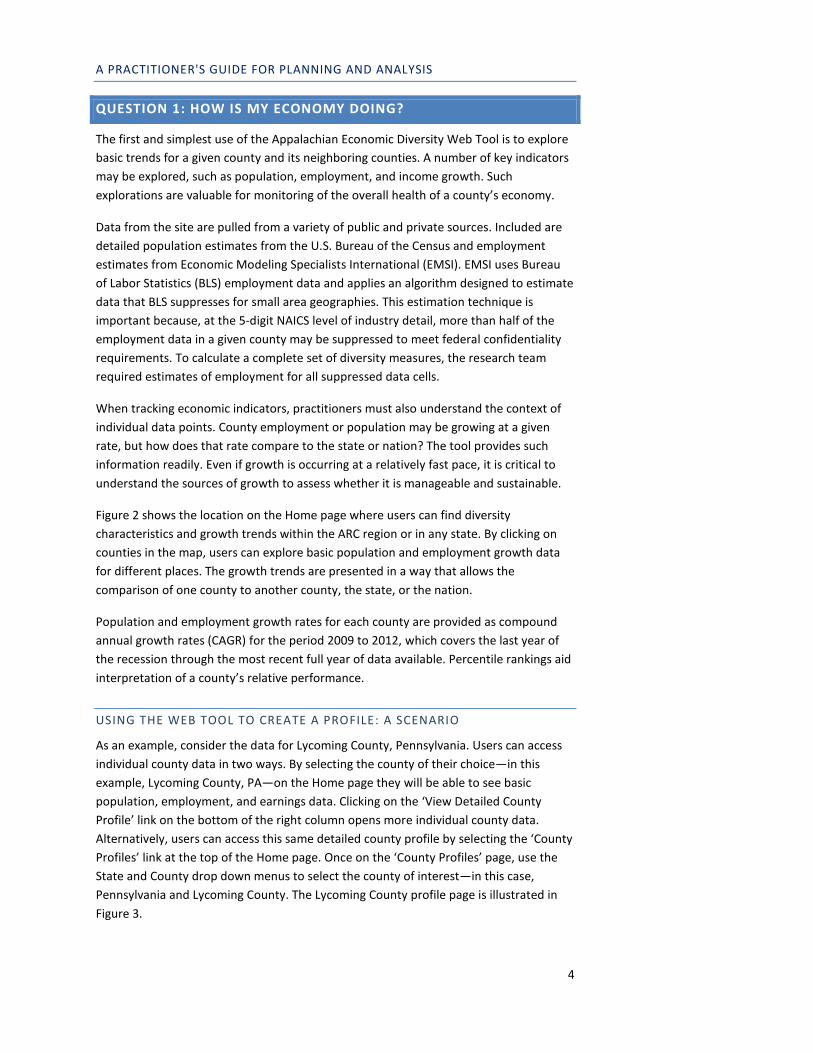
QUESTION 1: HOW IS MY ECONOMY DOING?
The first and simplest use of the Appalachian Economic Diversity Web Tool is to explore basic trends for a given county and its neighboring counties. A number of key indicators may be explored, such as population, employment, and income growth. Such explorations are valuable for monitoring of the overall health of a county’s economy.
Data from the site are pulled from a variety of public and private sources. Included are detailed population estimates from the U.S. Bureau of the Census and employment estimates from Economic Modeling Specialists International (EMSI). EMSI uses Bureau of Labor Statistics (BLS) employment data and applies an algorithm designed to estimate data that BLS suppresses for small area geographies. This estimation technique is important because, at the 5-digit NAICS level of industry detail, more than half of the employment data in a given county may be suppressed to meet federal confidentiality requirements. To calculate a complete set of diversity measures, the research team required estimates of employment for all suppressed data cells.
When tracking economic indicators, practitioners must also understand the context of individual data points. County employment or population may be growing at a given rate, but how does that rate compare to the state or nation? The tool provides such information readily. Even if growth is occurring at a relatively fast pace, it is critical to understand the sources of growth to assess whether it is manageable and sustainable.
Figure 2 shows the location on the Home page where users can find diversity characteristics and growth trends within the ARC region or in any state. By clicking on counties in the map, users can explore basic population and employment growth data for different places. The growth trends are presented in a way that allows the comparison of one county to another county, the state, or the nation.
Population and employment growth rates for each county are provided as compound annual growth rates (CAGR) for the period 2009 to 2012, which covers the last year of the recession through the most recent full year of data available. Percentile rankings aid interpretation of a county’s relative performance.
USING THE WEB TOOL TO CREATE A PROFILE: A SCENARIO
As an example, consider the data for Lycoming County, Pennsylvania. Users can access individual county data in two ways. By selecting the county of their choice—in this example, Lycoming County, PA—on the Home page they will be able to see basic population, employment, and earnings data. Clicking on the ‘View Detailed County Profile’ link on the bottom of the right column opens more individual county data. Alternatively, users can access this same detailed county profile by selecting the ‘County Profiles’ link at the top of the Home page. Once on the ‘County Profiles’ page, use the State and County drop down menus to select the county of interest—in this case, Pennsylvania and Lycoming County. The Lycoming County profile page is illustrated in Figure 3.
4

A PRACTITIONER'S GUIDE FOR PLANNING AND ANALYSIS
Lycoming County is at the center of the Marcellus Shale natural gas boom in Pennsylvania, and trends reveal how its growing employment has far exceeded population growth. Between 2009 and 2012, Lycoming County’s population grew at a rate of only 0.1 percent annually. When compared with the Pennsylvania and national growth rates, Lycoming County’s population has grown relatively slowly within a state that has also seen relatively slow population growth. The percentile rankings for population growth offer further context and show that nearly 67 percent of U.S. counties and 60 percent of ARC counties added population at a faster rate than Lycoming County.
Figure 2: Accessing basic trends through the home page
Map of diversity trends
Map filters
Select counties in any state
Basic county indicators
Link to detailed county profile page
5
A PRACTITIONER'S GUIDE FOR PLANNING AND ANALYSIS
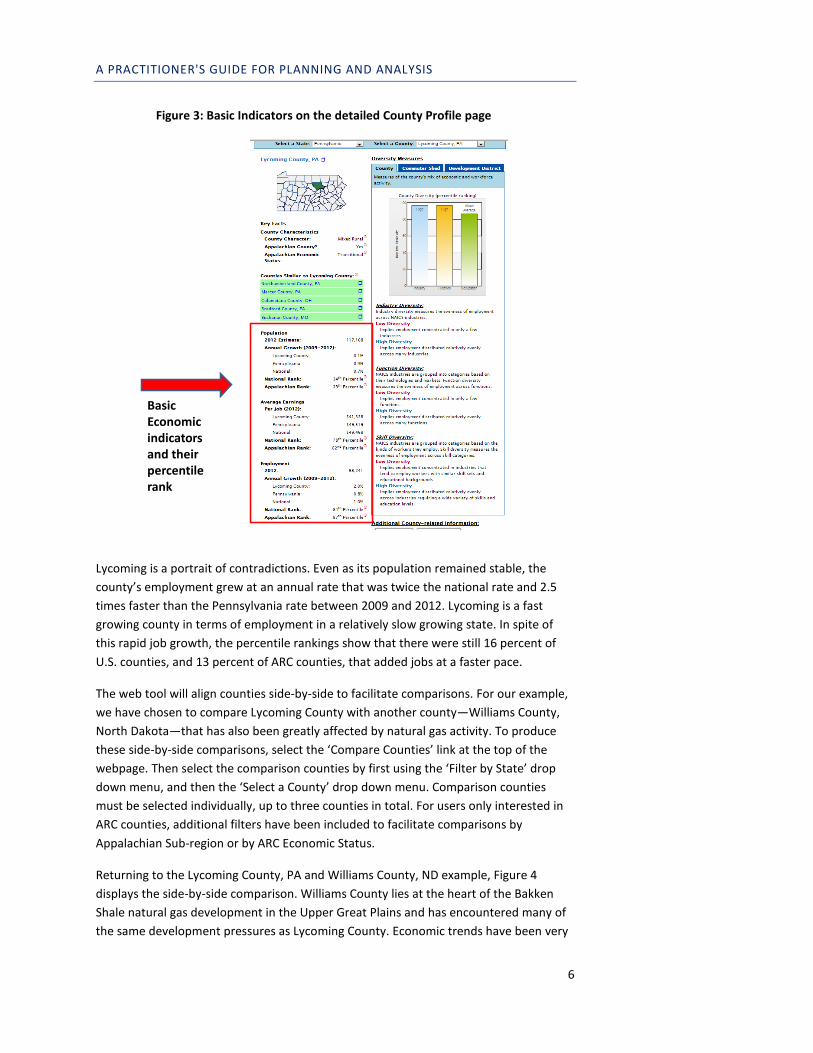
Lycoming is a portrait of contradictions. Even as its population remained stable, the county’s employment grew at an annual rate that was twice the national rate and 2.5 times faster than the Pennsylvania rate between 2009 and 2012. Lycoming is a fast growing county in terms of employment in a relatively slow growing state. In spite of this rapid job growth, the percentile rankings show that there were still 16 percent of U.S. counties, and 13 percent of ARC counties, that added jobs at a faster pace.
The web tool will align counties side-by-side to facilitate comparisons. For our example, we have chosen to compare Lycoming County with another county—Williams County, North Dakota—that has also been greatly affected by natural gas activity. To produce these side-by-side comparisons, select the ‘Compare Counties’ link at the top of the webpage. Then select the comparison counties by first using the ‘Filter by State’ drop down menu, and then the ‘Select a County’ drop down menu. Comparison counties must be selected individually, up to three counties in total. For users only interested in ARC counties, additional filters have been included to facilitate comparisons by Appalachian Sub-region or by ARC Economic Status.
Returning to the Lycoming County, PA and Williams County, ND example, Figure 4 displays the side-by-side comparison. Williams County lies at the heart of the Bakken Shale natural gas development in the Upper Great Plains and has encountered many of the same development pressures as Lycoming County. Economic trends have been very
Figure 3: Basic Indicators on the detailed County Profile page
Basic Economic indicators and their percentile rank
6

A PRACTITIONER'S GUIDE FOR PLANNING AND ANALYSIS
different, however. Williams County’s population and employment annualized growth rates between 2009 and 2012 were in the 100th percentile of U.S. counties, meaning that it had grown faster than almost every other county in the nation. Moreover, average earnings in Williams County were also in the 100th percentile and well above the state and national average earnings. By contrast, Lycoming County’s average earnings were in the 78th percentile of counties and remain below the average earnings of both the U.S. and Pennsylvania.
These simple data points help us interpret the relative magnitudes of basic economic and demographic trends and to ask whether our given study county is unique or following patterns evident in other similar places. More data and research are required to fully understand the similarities and differences underlying the economic and demographic changes occurring in these two locations. While the web tool is designed to highlight differences and similarities, it is not designed to answer every comparative question.
To help users continue their exploration and to conduct more in-depth research, the tool’s County Profile page also includes links to relevant data in the Census Bureau's Quick Facts page and the BEARFACTS page of the Bureau of Economic Analysis. Those resources, along with data from the U.S. Bureau of Labor Statistics, can provide
Figure 4: Side-by-side county comparisons
Side by side comparisons of counties available in the compare counties page
7

A PRACTITIONER'S GUIDE FOR PLANNING AND ANALYSIS
additional information for users who wish to analyze the drivers behind the trends they are observing.
QUESTION 2: HOW DIVERSE IS MY ECONOMY AND WHAT RISKS AND OPPORTUNITIES DOES THAT DIVERSITY PRESENT?
Promoting economic diversity is largely focused on identifying economic risks and capturing opportunities. Practitioners can look at economic diversity to understand those risks better and explore prospects for emerging growth. A diverse economy is not synonymous with a growing economy, but conventional wisdom suggests that diverse economies are much less likely to suffer debilitating losses when an industry falters or a company shuts down. Because alternative employment opportunities exist for workers, the painful impacts of loss are usually more quickly mitigated in places with greater economic diversity.
The Appalachian Economic Diversity Web Tool includes three basic ways of understanding economic diversity.3
• Industrial diversity measures the level and evenness of employment across a maximum of 1,110 industry types that might employ a region’s residents.4 Industry diversity is important to practitioners because the more industries represented in a local economy, the greater the alternatives for area residents in seeking jobs. Furthermore, places that have higher industrial diversity are less likely to be severely impacted by negative trends associated with a particular industry or dominant company.
• Functional diversity measures the evenness of employment across eleven broad industry groups that capture major economic roles that regions often play, such as education centers (e.g., if a university is present), government centers (capital city or prevalence of government agencies or installations), a manufacturing hub, a retail trade center, and so on. Functional diversity is important to practitioners because regions diverse enough to serve multiple “economic functions” might be expected to experience greater moderation in growth or decline that result from cyclical changes.
3 More detailed definitions of the terms and measures used in the tool can be found by selecting the ‘About’ tab on the webtool (http://economicdiversityinappalachia.creconline.org/About/#definitions). For an in-depth description of how these measures were calculated, consult A Statistical Portrait of Economic Diversity in Appalachia 4 These industries types are based on 6-digit NAICS (North American Industry Classification System) definitions. More information about NAICs can be found at: http://www.census.gov/eos/www/naics/
8
A PRACTITIONER'S GUIDE FOR PLANNING AND ANALYSIS
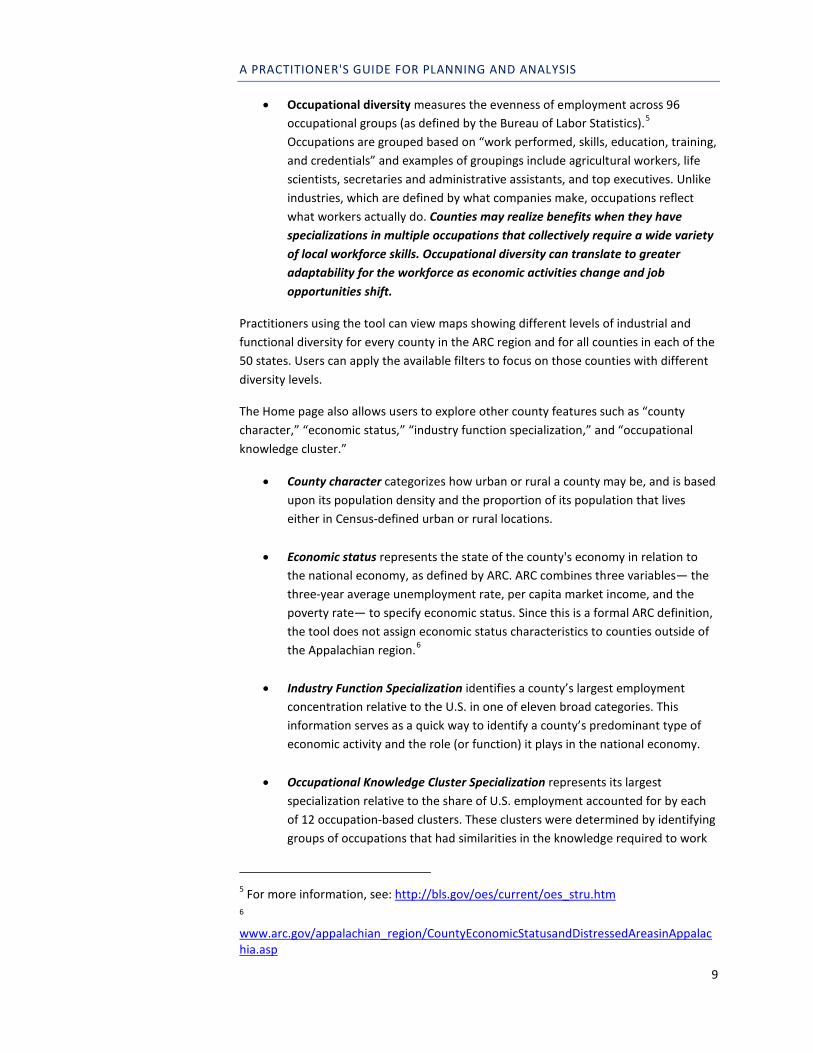
• Occupational diversity measures the evenness of employment across 96 occupational groups (as defined by the Bureau of Labor Statistics).5 Occupations are grouped based on “work performed, skills, education, training, and credentials” and examples of groupings include agricultural workers, life scientists, secretaries and administrative assistants, and top executives. Unlike industries, which are defined by what companies make, occupations reflect what workers actually do. Counties may realize benefits when they have specializations in multiple occupations that collectively require a wide variety of local workforce skills. Occupational diversity can translate to greater adaptability for the workforce as economic activities change and job opportunities shift.
Practitioners using the tool can view maps showing different levels of industrial and functional diversity for every county in the ARC region and for all counties in each of the 50 states. Users can apply the available filters to focus on those counties with different diversity levels.
The Home page also allows users to explore other county features such as “county character,” “economic status,” “industry function specialization,” and “occupational knowledge cluster.”
• County character categorizes how urban or rural a county may be, and is based upon its population density and the proportion of its population that lives either in Census-defined urban or rural locations.
• Economic status represents the state of the county's economy in relation to the national economy, as defined by ARC. ARC combines three variables— the three-year average unemployment rate, per capita market income, and the poverty rate— to specify economic status. Since this is a formal ARC definition, the tool does not assign economic status characteristics to counties outside of the Appalachian region.6
• Industry Function Specialization identifies a county’s largest employment concentration relative to the U.S. in one of eleven broad categories. This information serves as a quick way to identify a county’s predominant type of economic activity and the role (or function) it plays in the national economy.
• Occupational Knowledge Cluster Specialization represents its largest specialization relative to the share of U.S. employment accounted for by each of 12 occupation-based clusters. These clusters were determined by identifying groups of occupations that had similarities in the knowledge required to work
5 For more information, see: http://bls.gov/oes/current/oes_stru.htm 6 www.arc.gov/appalachian_region/CountyEconomicStatusandDistressedAreasinAppalachia.asp
9
A PRACTITIONER'S GUIDE FOR PLANNING AND ANALYSIS
in these professions. This information allows users to quickly identify the predominant skills of the county’s workforce.7
The measures allow users to quickly compare their various characteristics with other counties in the arc region or in their state. Practitioners can also use the measures to identify other counties that may be experiencing similar economic conditions.
INDUSTRIAL AND FUNCTIONAL DIVERSITY: A SCENARIO
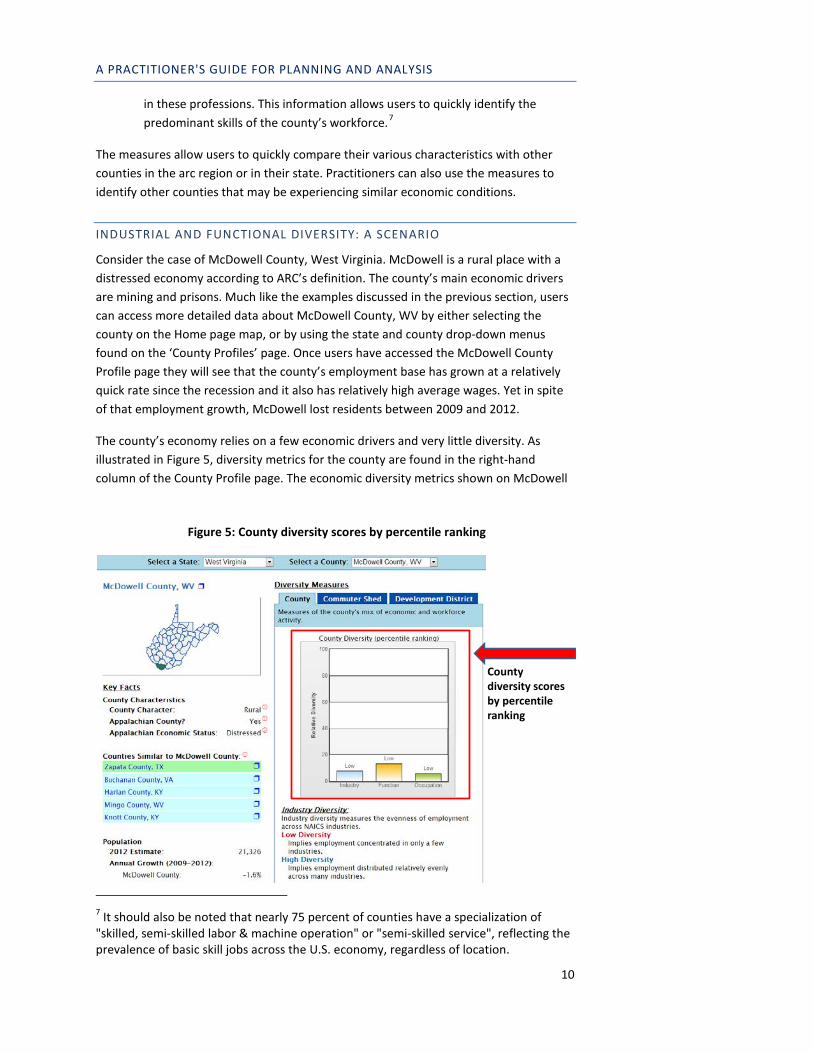
Consider the case of McDowell County, West Virginia. McDowell is a rural place with a distressed economy according to ARC’s definition. The county’s main economic drivers are mining and prisons. Much like the examples discussed in the previous section, users can access more detailed data about McDowell County, WV by either selecting the county on the Home page map, or by using the state and county drop-down menus found on the ‘County Profiles’ page. Once users have accessed the McDowell County Profile page they will see that the county’s employment base has grown at a relatively quick rate since the recession and it also has relatively high average wages. Yet in spite of that employment growth, McDowell lost residents between 2009 and 2012.
The county’s economy relies on a few economic drivers and very little diversity. As illustrated in Figure 5, diversity metrics for the county are found in the right-hand column of the County Profile page. The economic diversity metrics shown on McDowell
7 It should also be noted that nearly 75 percent of counties have a specialization of "skilled, semi-skilled labor & machine operation" or "semi-skilled service", reflecting the prevalence of basic skill jobs across the U.S. economy, regardless of location.
Figure 5: County diversity scores by percentile ranking
County diversity scores by percentile ranking
10
A PRACTITIONER'S GUIDE FOR PLANNING AND ANALYSIS
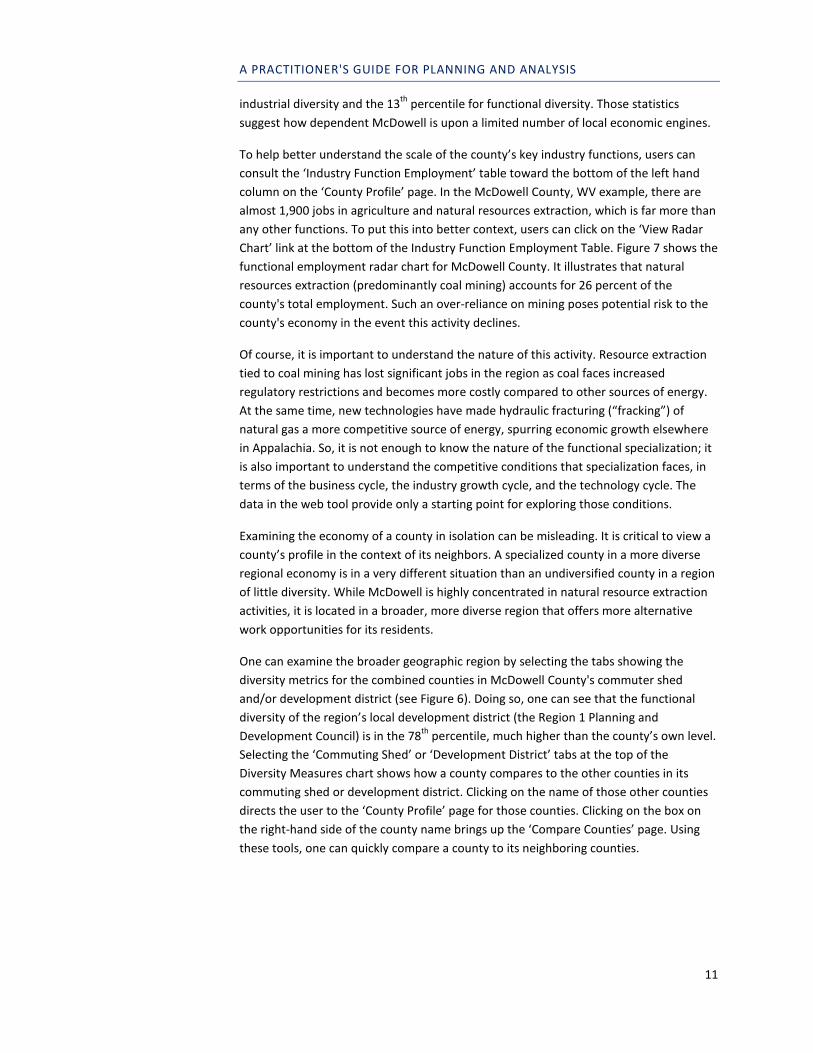
industrial diversity and the 13th percentile for functional diversity. Those statistics suggest how dependent McDowell is upon a limited number of local economic engines.
To help better understand the scale of the county’s key industry functions, users can consult the ‘Industry Function Employment’ table toward the bottom of the left hand column on the ‘County Profile’ page. In the McDowell County, WV example, there are almost 1,900 jobs in agriculture and natural resources extraction, which is far more than any other functions. To put this into better context, users can click on the ‘View Radar Chart’ link at the bottom of the Industry Function Employment Table. Figure 7 shows the functional employment radar chart for McDowell County. It illustrates that natural resources extraction (predominantly coal mining) accounts for 26 percent of the county's total employment. Such an over-reliance on mining poses potential risk to the county's economy in the event this activity declines.
Of course, it is important to understand the nature of this activity. Resource extraction tied to coal mining has lost significant jobs in the region as coal faces increased regulatory restrictions and becomes more costly compared to other sources of energy. At the same time, new technologies have made hydraulic fracturing (“fracking”) of natural gas a more competitive source of energy, spurring economic growth elsewhere in Appalachia. So, it is not enough to know the nature of the functional specialization; it is also important to understand the competitive conditions that specialization faces, in terms of the business cycle, the industry growth cycle, and the technology cycle. The data in the web tool provide only a starting point for exploring those conditions.
Examining the economy of a county in isolation can be misleading. It is critical to view a county’s profile in the context of its neighbors. A specialized county in a more diverse regional economy is in a very different situation than an undiversified county in a region of little diversity. While McDowell is highly concentrated in natural resource extraction activities, it is located in a broader, more diverse region that offers more alternative work opportunities for its residents.
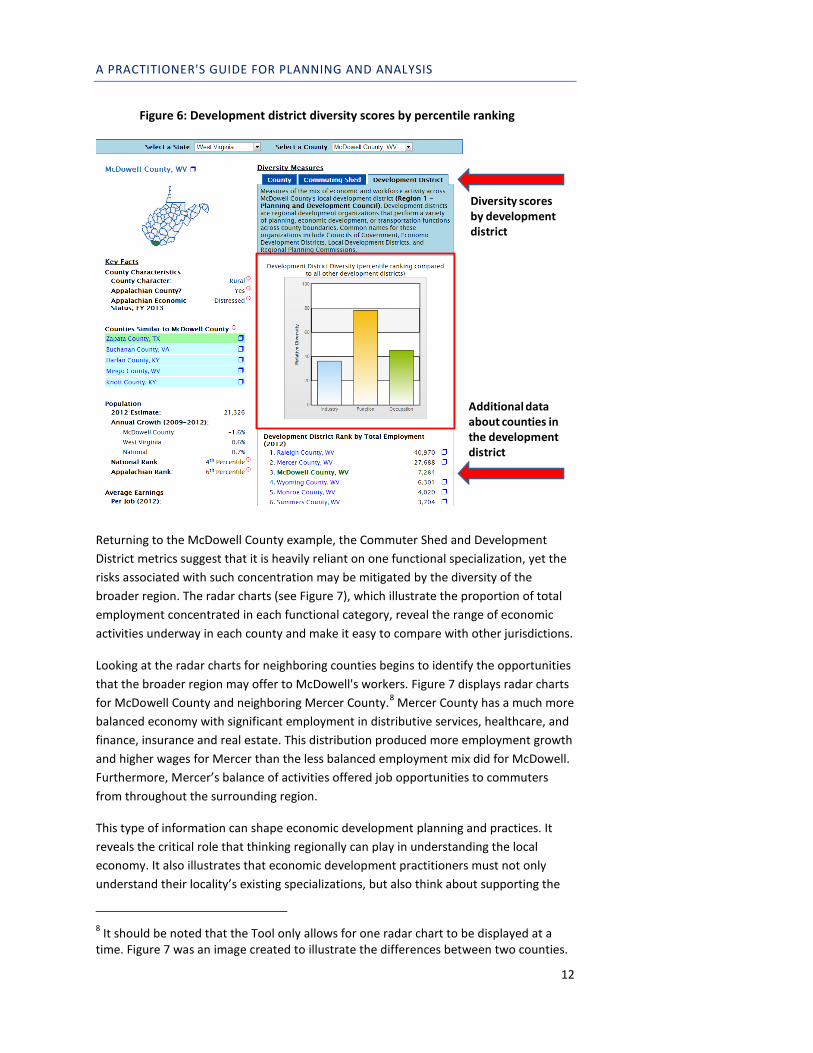
One can examine the broader geographic region by selecting the tabs showing the diversity metrics for the combined counties in McDowell County's commuter shed and/or development district (see Figure 6). Doing so, one can see that the functional diversity of the region’s local development district (the Region 1 Planning and Development Council) is in the 78th percentile, much higher than the county’s own level. Selecting the ‘Commuting Shed’ or ‘Development District’ tabs at the top of the Diversity Measures chart shows how a county compares to the other counties in its commuting shed or development district. Clicking on the name of those other counties directs the user to the ‘County Profile’ page for those counties. Clicking on the box on the right-hand side of the county name brings up the ‘Compare Counties’ page. Using these tools, one can quickly compare a county to its neighboring counties.
11
A PRACTITIONER'S GUIDE FOR PLANNING AND ANALYSIS
Returning to the McDowell County example, the Commuter Shed and Development District metrics suggest that it is heavily reliant on one functional specialization, yet the risks associated with such concentration may be mitigated by the diversity of the broader region. The radar charts (see Figure 7), which illustrate the proportion of total employment concentrated in each functional category, reveal the range of economic activities underway in each county and make it easy to compare with other jurisdictions.
Looking at the radar charts for neighboring counties begins to identify the opportunities that the broader region may offer to McDowell's workers. Figure 7 displays radar charts for McDowell County and neighboring Mercer County.8 Mercer County has a much more balanced economy with significant employment in distributive services, healthcare, and finance, insurance and real estate. This distribution produced more employment growth and higher wages for Mercer than the less balanced employment mix did for McDowell. Furthermore, Mercer’s balance of activities offered job opportunities to commuters from throughout the surrounding region.
This type of information can shape economic development planning and practices. It reveals the critical role that thinking regionally can play in understanding the local economy. It also illustrates that economic development practitioners must not only understand their locality’s existing specializations, but also think about supporting the
8 It should be noted that the Tool only allows for one radar chart to be displayed at a time. Figure 7 was an image created to illustrate the differences between two counties.
Figure 6: Development district diversity scores by percentile ranking
Diversity scores by development district
Additional data about counties in the development district
12

A PRACTITIONER'S GUIDE FOR PLANNING AND ANALYSIS
development of new specializations. This insight should be coupled with additional data about detailed industry trends and projections to truly understand current and future economic prospects. In addition, practitioners can use qualitative case study analysis to better anticipate local, national and global trends that are critical to existing and prospective specialties.
Since diversity is scale-dependent, these data can help guide strategy development. For low diversity counties located in low diversity regions, practitioners may seek to focus economic development efforts on creating new specializations. Practitioners developing strategies for low diversity counties located in high diversity regions might seek to increase linkages with their neighbors to provide increased employment and business development opportunities. To do so requires not only identifying the economic drivers found throughout a region, but also determining how those economic drivers sit within their broader global supply and demand chains.
Figure 7: Radar Charts displaying proportion of employment by functional specialization
McDowell County, WV Mercer County, WV
The radar charts show functional specializations a proportion of total employment
Radar charts appear after clicking the “View Radar Chart” button on the detailed county profile page
Links to additional county data
13
A PRACTITIONER'S GUIDE FOR PLANNING AND ANALYSIS
QUESTION 3: WHAT KIND OF ASSET IS MY LOCAL WORKFORCE?
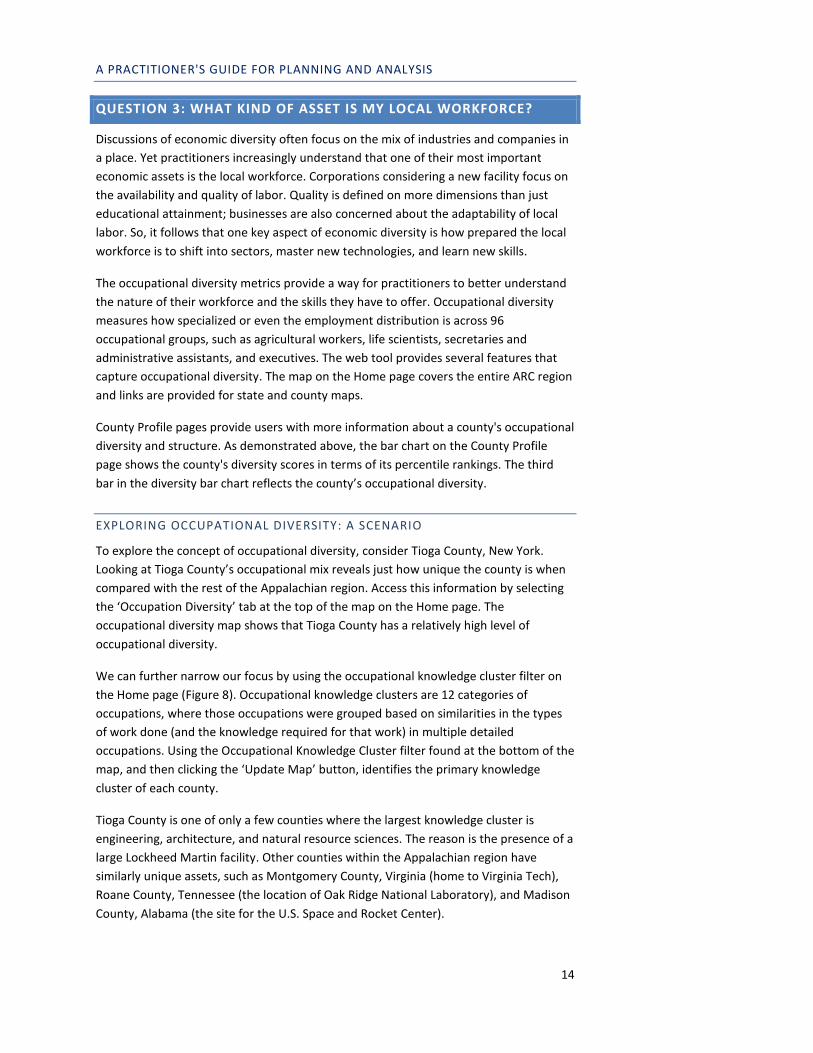
Discussions of economic diversity often focus on the mix of industries and companies in a place. Yet practitioners increasingly understand that one of their most important economic assets is the local workforce. Corporations considering a new facility focus on the availability and quality of labor. Quality is defined on more dimensions than just educational attainment; businesses are also concerned about the adaptability of local labor. So, it follows that one key aspect of economic diversity is how prepared the local workforce is to shift into sectors, master new technologies, and learn new skills.
The occupational diversity metrics provide a way for practitioners to better understand the nature of their workforce and the skills they have to offer. Occupational diversity measures how specialized or even the employment distribution is across 96 occupational groups, such as agricultural workers, life scientists, secretaries and administrative assistants, and executives. The web tool provides several features that capture occupational diversity. The map on the Home page covers the entire ARC region and links are provided for state and county maps.
County Profile pages provide users with more information about a county's occupational diversity and structure. As demonstrated above, the bar chart on the County Profile page shows the county's diversity scores in terms of its percentile rankings. The third bar in the diversity bar chart reflects the county’s occupational diversity.
EXPLORING OCCUPATIONAL DIVERSITY: A SCENARIO
To explore the concept of occupational diversity, consider Tioga County, New York. Looking at Tioga County’s occupational mix reveals just how unique the county is when compared with the rest of the Appalachian region. Access this information by selecting the ‘Occupation Diversity’ tab at the top of the map on the Home page. The occupational diversity map shows that Tioga County has a relatively high level of occupational diversity.
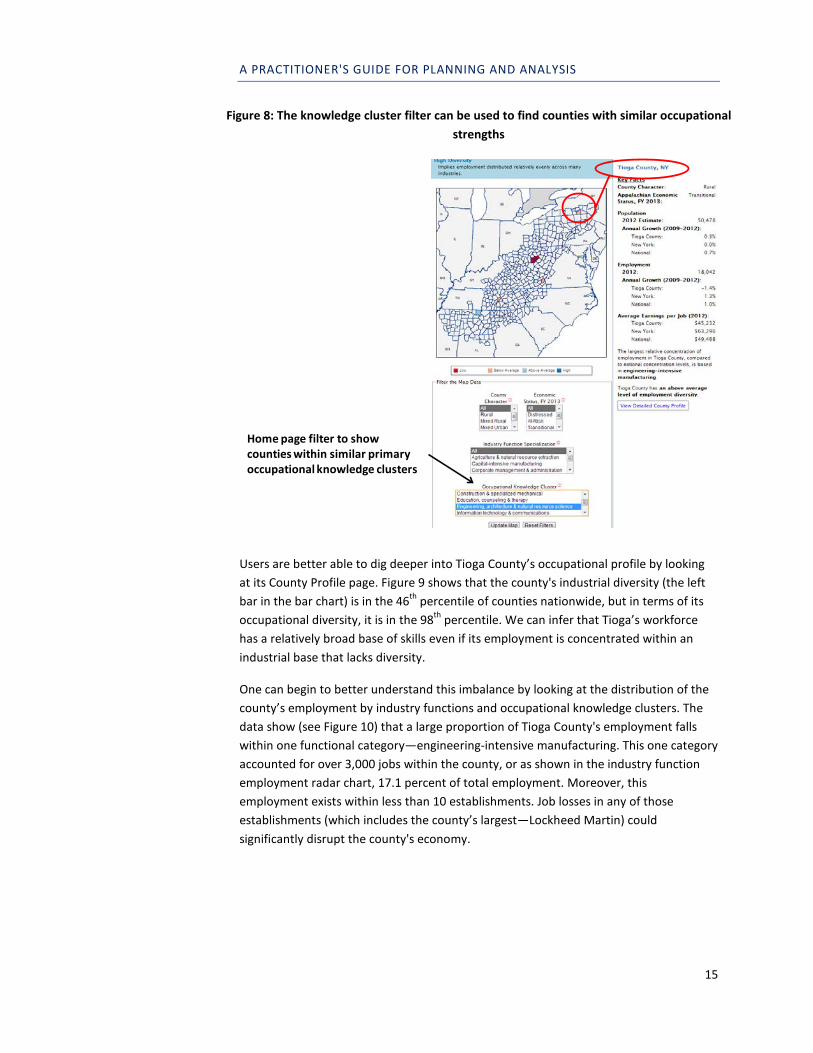
We can further narrow our focus by using the occupational knowledge cluster filter on the Home page (Figure 8). Occupational knowledge clusters are 12 categories of occupations, where those occupations were grouped based on similarities in the types of work done (and the knowledge required for that work) in multiple detailed occupations. Using the Occupational Knowledge Cluster filter found at the bottom of the map, and then clicking the ‘Update Map’ button, identifies the primary knowledge cluster of each county.
Tioga County is one of only a few counties where the largest knowledge cluster is engineering, architecture, and natural resource sciences. The reason is the presence of a large Lockheed Martin facility. Other counties within the Appalachian region have similarly unique assets, such as Montgomery County, Virginia (home to Virginia Tech), Roane County, Tennessee (the location of Oak Ridge National Laboratory), and Madison County, Alabama (the site for the U.S. Space and Rocket Center).
14
A PRACTITIONER'S GUIDE FOR PLANNING AND ANALYSIS
Users are better able to dig deeper into Tioga County’s occupational profile by looking at its County Profile page. Figure 9 shows that the county's industrial diversity (the left bar in the bar chart) is in the 46th percentile of counties nationwide, but in terms of its occupational diversity, it is in the 98th percentile. We can infer that Tioga’s workforce has a relatively broad base of skills even if its employment is concentrated within an industrial base that lacks diversity.
One can begin to better understand this imbalance by looking at the distribution of the county’s employment by industry functions and occupational knowledge clusters. The data show (see Figure 10) that a large proportion of Tioga County's employment falls within one functional category—engineering-intensive manufacturing. This one category accounted for over 3,000 jobs within the county, or as shown in the industry function employment radar chart, 17.1 percent of total employment. Moreover, this employment exists within less than 10 establishments. Job losses in any of those establishments (which includes the county’s largest—Lockheed Martin) could significantly disrupt the county's economy.
Figure 8: The knowledge cluster filter can be used to find counties with similar occupational strengths
Home page filter to show counties within similar primary occupational knowledge clusters
15

A PRACTITIONER'S GUIDE FOR PLANNING AND ANALYSIS
However, these data do not necessarily reflect what Tioga County workers actually do. To better understand that dynamic, users might consider the ‘Occupational Knowledge Cluster Employment’ data found at the bottom of the left-hand column on the ‘County Profile’ page. This table shows county employment in each knowledge cluster. By clicking on the ‘View Radar Chart’ button at the bottom of the table, users can see a visual representation of the distribution of knowledge cluster employment within the county.
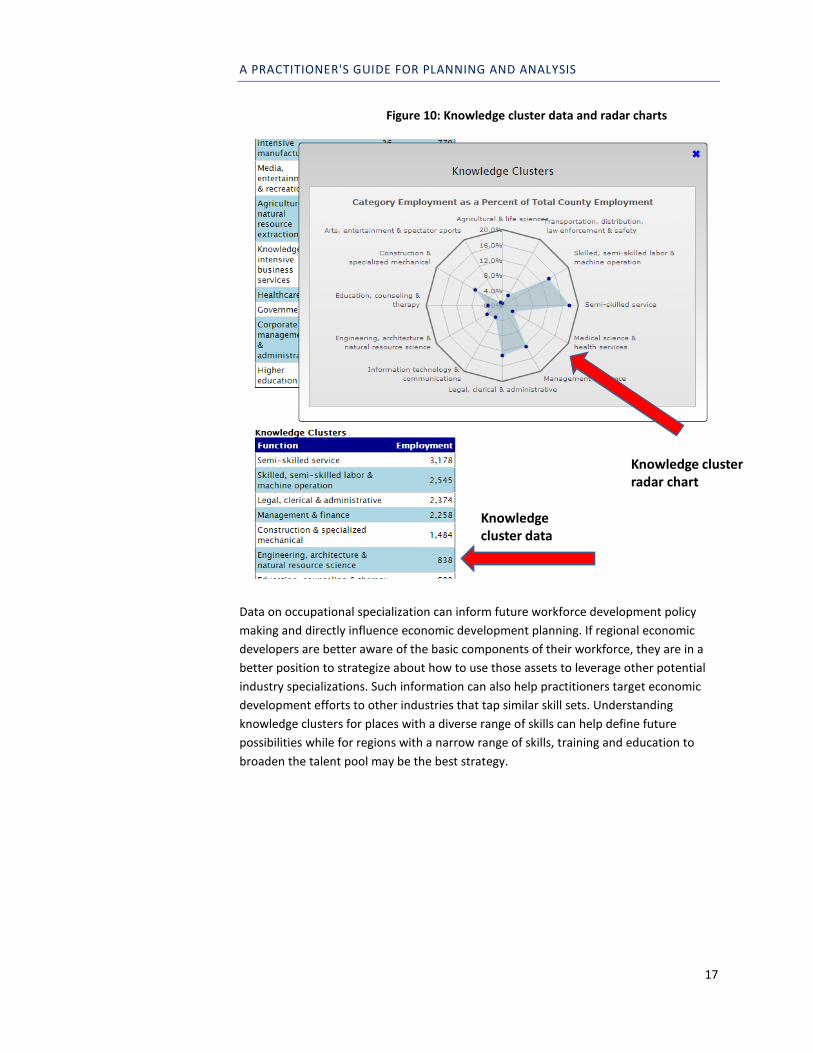
Figure 10 shows the knowledge cluster data and radar chart for Tioga County, NY. It demonstrates that the occupational diversity shown in Tioga County's workforce may represent its secret weapon in offsetting the risks associated with so much employment concentrated in a single specialty. The data show that the county has over 1,000 workers in five different knowledge clusters—semi-skilled service; skilled and semi-skilled labor and machine operation; legal, clerical and administrative; management and finance; and construction and specialized mechanics. This balance indicates that the county’s workforce may possess the capacity to move into a broader array of activities.
Figure 9: Occupational diversity by percentile ranking on the detailed County Profile page
Occupational diversity by percentile ranking
16
A PRACTITIONER'S GUIDE FOR PLANNING AND ANALYSIS
Data on occupational specialization can inform future workforce development policy making and directly influence economic development planning. If regional economic developers are better aware of the basic components of their workforce, they are in a better position to strategize about how to use those assets to leverage other potential industry specializations. Such information can also help practitioners target economic development efforts to other industries that tap similar skill sets. Understanding knowledge clusters for places with a diverse range of skills can help define future possibilities while for regions with a narrow range of skills, training and education to broaden the talent pool may be the best strategy.
Figure 10: Knowledge cluster data and radar charts
Knowledge cluster data
Knowledge cluster radar chart
17
A PRACTITIONER'S GUIDE FOR PLANNING AND ANALYSIS
QUESTION 4: HOW IS MY COUNTY DOING RELATIVE TO SIMILAR COUNTIES ELSEWHERE?
Practitioners may use data in a variety of ways, but they seldom have meaning unless they are compared with something else. Earlier in this guide, we noted that analysts can use the web tool to compare with the nation, the state, and neighboring counties. During the planning process, and in efforts to design programs or monitor programs, practitioners may find value in comparing their place to others as a way of giving some perspective on how well their county is doing.
However, which counties are most appropriate for comparisons? How do we find places that have similar economic structures or face similar challenges that would serve as more appropriate comparators?
One of the most useful features of the Appalachian Economic Diversity Web Tool is that it provides means of identifying useful and appropriate comparison counties. The tool provides two primary methods for identifying potential comparator counties. First, the filters available on the Home page map allow users to identify other counties within the ARC region or within their state that have similar economic conditions, functional specializations, or knowledge clusters. Users can build a list of comparator counties that have similar characteristics and thus potentially similar economic development priorities or challenges.
Second, the County Profile page of the web tool reports other counties in the U.S. that are most similar to a given study county in terms of key economic, social, demographic, and locational characteristics. Similarity was measured through a statistical analysis of 16 different variables measuring population, geographic size, income and earnings, industrial structure, educational attainment, and poverty:
• Per capita Income (source: U.S. Bureau of Economic Analysis, Local Area Personal Income and Employment, 2011)
• Sources of income (source: U.S. Bureau of Economic Analysis, Local Area Personal Income and Employment)
o Percent farm income o Percent income from dividends, interest and rents o Percent proprietors income
• Population characteristics (source: U.S. Census Bureau) o Total population o Percent of the population (age 25+) with at least a high school diploma o Percent of the population in poverty
• Geographic considerations (source: U.S. Census Bureau) o Land area in square miles o Distance from a large (one million plus) urban area
• Percent of earnings by industry (source: Economic Modeling Specialists International)
o Share of mining earnings o Share of capital-intensive manufacturing earnings
18

A PRACTITIONER'S GUIDE FOR PLANNING AND ANALYSIS
o Share of engineering-intensive manufacturing earnings o Share of finance, insurance and real estate earnings o Share of corporate management earnings o Share of government earnings o Share of knowledge-intensive business services earnings
Not every U.S. county can be strongly paired with one or more other U.S. counties; some counties are simply too unique. Moreover, in some cases, data were not sufficient to draw valid comparisons. For the vast majority of U.S. counties, however, it is possible to produce a measure of similarity that not only matches each county with comparators, but also assesses the strength of the match.
The web tool highlights the strength of each match with a color coding system. Strongly similar county pairs are coded as “green” while weak ones are coded in red. This strength of pairing is very important because there are a few counties so unique (such as New York County, or Manhattan) that they have few truly meaningful comparators. In these instances, the team identified comparators, but they are likely to be weaker and much more likely to compare well on only a few of the economic, demographic, and location characteristics like per capita income or population size.
IDENTIFYING BENCHMARK COUNTIES: A SCENARIO
Consider Oktibbeha County in Mississippi. Oktibbeha is the home of Mississippi State University (MSU) and, not surprisingly, has a functional specialization in higher education. The importance of MSU to the county’s economy makes Oktibbeha somewhat unique. As a result, it might make more sense to benchmark Oktibbeha to counties with dominant college towns rather than against neighboring counties or other Mississippi counties. However, finding the right university-driven economies will require additional research. At first blush, one might imagine Oxford, Mississippi (home of the University of Mississippi) or Tuscaloosa, Alabama (location of the University of Alabama), but how similar are those places to Oktibbeha? What if we want to explore how the county compares with other Appalachian counties or other university towns?
Much like the earlier example that used the Home page map filters to identify counties with similar knowledge clusters, practitioners can use a different filter on the Home page map to focus first on filtering counties by their functional specialization (see Figure 11). Among those that the web tool reveals include Pickens County, SC (Clemson University), Watauga County, NC (Appalachian State University), Knox County, TN (University of Tennessee), and Montgomery County, VA (Virginia Tech). These counties are all dominated by a public university, a characteristic each shares with Oktibbeha County. They could serve as a good first cut of potential comparator counties, but how can we find counties that may be a closer fit than these?
19

A PRACTITIONER'S GUIDE FOR PLANNING AND ANALYSIS
What if we are interested in seeking comparison counties with the strongest similarity ratings? These may be located anywhere in the U.S. and additional inputs will be needed. Beginning with the individual county profiles, we have additional information readily at hand to help identify five other counties with the most similar economic and social characteristics. Figure 12 illustrates how those data might be used. Our comparison found that Athens County, OH, another Appalachian county (home to Ohio University), as a potential comparator. Under this scenario, the tool also generates Watauga County, NC (Appalachian State University) again. The tool identified three other moderately similar counties, all home to medium-sized universities, including Isabella County, MI (Central Michigan University), Lincoln Parish Louisiana (Grambling University and Louisiana Tech), and Jackson County, IL (Southern Illinois University).
These five counties represent the most similar in the U.S. to Oktibbeha County in its overall demographic, economic, and location characteristics and therefore represent a first point of exploration in identifying benchmark counties. Of course, to a knowledgeable practitioner, it may be politically unwise to exclude Lafayette County, MS (University of Mississippi) or Tuscaloosa County, AL (University of Alabama), but
Figure 11: The functional specialization filter can help identify similar counties
The functional specialization filter on the home page can help identify counties with similar specializations
20

A PRACTITIONER'S GUIDE FOR PLANNING AND ANALYSIS
these data will help explain why those comparisons may be more aspirational than the comparisons with more empirically similar counties.
The web tool’s findings should not be the only inputs used in selecting comparison counties. Policy makers, practitioners, and researchers selecting similar places to compare should also explore whether the counties being considered are pursuing similar economic development strategies or targeting similar industries. Sometimes, this may be more important than whether the existing economies of other areas are similar. Taking such factors into account will likely require a combination of quantitative and qualitative research.
Figure 12: Comparing Counties with Similar Characteristics
Similar counties can be found on the detailed county profile page
The color indicates the strength of the similarity
21
A PRACTITIONER'S GUIDE FOR PLANNING AND ANALYSIS
DIVERSITY AND ECONOMIC DEVELOPMENT PLANNING
Diversity and economic diversification have several major implications for local economic development planning and policy making:
• Growth occurs through specialization; • Diversification strategies help assess risks and capture opportunities; • Economic diversity reflects the what, how, and why of local economic development; • Diversity is also influenced by where economic activity is located; • Fundamental strategic planning embraces diversification.
GROWTH OCCURS THROUGH SPECIALIZATION
A diverse set of economic activities is often tied to more economic stability. However, growth typically results when a region is leveraging a strength that gives it a means of out-competing other regions. Thus, practitioners should employ the web tool to assess whether the county or its region (1) has a strong mix of multiple competitive specializations or (2) relies too much on one or two major specializations. Furthermore, the web tool may also help to assess whether a diverse economy is the result of multiple specialized strengths or simply the absence of specialty. Lack of all specialization typically implies little activity that offers a distinctive competitive advantage. It is an important reason why some of the most diverse economies are also those in slow decline.
DIVERSIFICATION STRATEGIES HELP ASSESS RISKS AND CAPTURE OPPORTUNITIES
A highly specialized economy may grow rapidly if core driver industries can expect robust demand for their goods and services, but the economy may face known or even unknown threats that could significantly disrupt key industries. In this environment, economic development practitioners have a key role in assessing and understanding potential “risks” associated with the current economic structure, as well as identifying competitive strengths that could offer prospects for future growth. The web tool provides a basis for scanning for both opportunities and risks. The tool may also help to identify ways to focus economic development efforts around attracting new companies, expanding existing firms, forming new enterprises, or investing in related institutions or infrastructure. The web tool also may help in crystalizing local leaders’ understanding of the risks tied to being overly specialized and reveal ways to manage the region’s portfolio better, not necessarily by divesting in driver industries (a political impossibility at best), but by ensuring that investments in retaining those industries do not crowd out the resource needs of emerging sectors.
ECONOMIC DIVERSITY REFLECTS THE WHAT, HOW, AND WHY OF LOCAL ECONOMIC DEVELOPMENT
The research team’s analysis revealed that practitioners should consider economic diversity beyond the traditional terms of the variety of industries or the absence of a
22

A PRACTITIONER'S GUIDE FOR PLANNING AND ANALYSIS
single dominant enterprise. In this respect, economic diversity reflects what the place “makes” (its private sector firms and other employers); what its residents “do” (the skills and capabilities of its workforce); and the county’s role as an element of the broader national or global economy (its economic “function”). The web tool uses a variety of new metrics to describe economic diversity in each of those terms through the concepts of industrial diversity, functional diversity, and occupational diversity. Those distinctions are important because they reflect different ways a county or its surrounding region can develop a competitive advantage or develop a more risk-tolerant economy.
DIVERSITY IS ALSO INFLUENCED BY WHERE ECONOMIC ACTIVITY IS LOCATED
This guide has stressed the context of a county’s situation in assessing its economic diversity. A key aspect of that context is the county’s place in a larger global economy. For most local industries, distant industries, consumers, and markets determine current and future competitive needs. Local industries that serve multiple stable markets are less prone to volatility and risk. Furthermore, a local county that is quite specialized may also be tightly linked to a more diverse regional economy that helps to provide greater stability and alternative options even if there is volatility in the county’s core industry. The web tool can provide only limited understanding of the global consumer markets, but it can be very useful in assessing the linkages between the local county and its surrounding region. For those non-diverse counties in diverse regions, practitioners should heed the call for greater regional thinking in local planning efforts.
FUNDAMENTAL STRATEGIC PLANNING EMBRACES DIVERSIFICATION
Diversification strategies follow the same principles as a well-designed and well-balanced economic development strategy. Such strategies emphasize the use of research and analysis to maximize the use of local and regional resources or assets. Economic diversification also focuses on a broad array of strategic techniques. The web tool can be valuable in identifying counties with highly diverse economies as a first step in identifying those regions that have been intentional in promoting diversity as a core strategic goal. With an understanding of which counties are the best comparators, practitioners may employ the tool to find those counties that are most likely to have replicable experiences.
VALUE TO THE PLANNING PROCESS
Planning involves three major steps focused on developing, translating, and implementing a plan. Within each of those steps, there are a number of planning activities that the web tool may be used to inform. Figure 13 illustrates that planning process, including nine “elements” or sets of activities tied to each of the major steps in the process.9
9 More information about the planning process outlined in Figure 13 can be found in Creating Regional Coopetition: A Data-Driven Approach to Strategic Economic Planning:
23

A PRACTITIONER'S GUIDE FOR PLANNING AND ANALYSIS
Figure 13: The Strategic Economic Development Planning Framework
Source: (Council for Community and Economic Research, 2011)
The first phase of an economic development planning process involves developing the strategy. During this phase, economic development practitioners must identify the challenges and opportunities that face the county or its surrounding region, explore potential competitive advantages, and seek out ways to leverage advantages or ameliorate weaknesses. The web tool, with its basic profile information organized to reveal industrial, functional, and occupational specializations and to draw appropriate comparisons, is a convenient source for creating a basic understanding of a county (and its surrounding region).
The basic economic data in the web tool can be used to understand if the given county and region faces over-specialization in specific industries, functional economic categories, occupations, or knowledge areas. The data—and the insights drawn from them—may be used to target opportunities based on the revealed relative strengths. Furthermore, the tool can help identify other places with similar characteristics to aid benchmarking and comparisons of economic development practices and strategies.
The second phase of the planning process involves translating the strategy into action. In this phase, economic development practitioners must identify a specific series of tactics that can help to move the strategy forward. A critical element of this phase is pinpointing metrics that might ultimately be used in assessing progress. The web tool can be particularly helpful in providing insights about which economic or workforce data may be most useful for assessing the county’s economic performance as well as its development.
The third phase in an economic development planning exercise entails implementing the action plan. Implementation also involves developing new iterations of the plan based on real-life experience during the plan’s execution. This stage involves monitoring county economic performance as well as strategy implementation outcomes. Comparing the county’s performance with that of other counties can be particularly
Develop (or Create) the
Strategy
Translate the Strategy to
ActionImplement the
Action Plan
Motivate Action
Assess Options
Analyze & Diagnose
Prioritize & Choose
Organize Action
Marshal Resources
Create Metrics
Coordinate Partners
Manage Activities
3steps
9elements
24
A PRACTITIONER'S GUIDE FOR PLANNING AND ANALYSIS
The third phase in an economic development planning exercise entails implementing the action plan. Implementation also involves developing new iterations of the plan based on real-life experience during the plan’s execution. This stage involves monitoring county economic performance as well as strategy implementation outcomes. Comparing the county’s performance with that of other counties can be particularly useful in ascribing credit for strategies that may be implemented in one place but not in another.
In summary, the web tool provides a valuable instrument for policymakers and practitioners seeking to understand the importance of diversity and specialization in defining their county’s economic risks and opportunities. The tool provides an approach to examining diversity using data rather than anecdotes and it also provides a quantitative method for identifying benchmark counties and regions. Appropriate benchmarks ultimately help leaders better assess more precisely how well their local economic development efforts are doing.
25
A PRACTITIONER'S GUIDE FOR PLANNING AND ANALYSIS
BIBLIOGRAPHY
Commisson, A. R. (2013, August). Distressed Designation and County Economic Status Classification System, FY 2007 – FY 2014. Retrieved from Appalanchia Regional Commission: http://www.arc.gov/research/SourceandMethodologyCountyEconomicStatusFY2007FY2014.asp
Council for Community and Economic Research. (2011). Creating Regional Coopetition: A Data-Driven Approach to Strategic Economic Planning: Training Guidebook. Cornwall, ON: Economic Developers Council of Ontario.
University of Illinois, Regional Economics Applications Laboratory; Center for Regional Economic Competitiveness; RUPRI Center on Entrepreneurship. (October 2013). Economic Diversity in Appalachia. Washington, DC: Appalachian Regional Commission.
26