pradeep kumar ch. et al. / ijpdt / 3 (2), 2013, 80-96 ... · pradeep kumar ch. et al. / ijpdt / 3...
TRANSCRIPT

Pradeep Kumar CH. et al. / IJPDT / 3 (2), 2013, 80-96.
80 | P a g e
International Journal of Pharmaceutical
Development & Technology e ISSN - 2248 - 910X
www.ijpdt.com Print ISSN - 2248 - 9096
FORMULATION AND EVALUATION OF MEFENAMIC ACID
EXTENDED RELEASE LIQUISOLID TABLETS
CH.Pradeep Kumar*1, P.Venugopalaiah, CH. Praveen Kumar, K. Gnanaprakash,
M. Gobinath
1Department of Pharmaceutics, Ratnam Institute of Pharmacy, SPSR Nellore, Andhra Pradesh, India-524346
ABSTRACT
Liquisolid system refers to formulations formed by conversion of liquid drugs, drug suspension or drug solution in non-
volatile solvents in to non-adherent, free flowing and compressible powder mixtures by blending the solution or suspension with
selected carriers and coating materials. The aim of the present work was to formulate and evaluate extended release liquisolid
compacts of Mefenamic acid. Liquisolid extended release formulations were prepared by using HPMC K100M as adjuvant for
extended release. Different liquisolid compacts were prepared using a mathematical model to calculate the required quantities of
powder and liquid ingredients to produce acceptable and free flowing compressible mixtures. Avicel PH 102, Aerosil-200 were
employed as carrier and coating materials. The prepared liquisolid compacts were evaluated for their flow properties such as bulk
density, tapped density, angle of repose, Carr’s compressibility index, Hausner’s ratio. Drug-excipients interactions were studied
by FT-IR. Drug release rates of liquisolid compacts shows significant benefit and distinct drug release profiles when compared to
normal extended release tablets and from the results it was concluded that at higher amount of Aerosil 200 (Batch F12), drug
release was found to be retarded as compared to other batches. Increase in concentration of HPMC K100M might be responsible
to get extended effect. The obtained drug release data of liquisolid compacts were fitted into several mathematical models such as
Zero order, First order, Higuchi, Korsemayer-Peppas, and the obtained data was fitted into zero order release pattern followed by
non-fickian transport mechanism. Drug release profiles on model fitting follow Peppas model as best fit model which indicates
drug diffusion in hydrated matrix and polymer relaxation.
Keywords: Liquisolid compacts, Mefenamic acid, Liquid retention potential (Ø), Avicel-PH 102, Aerosil 200, drug release
kinetics.
INTRODUCTION
The oral route is the preferred route for the chronic
drug therapy. Numerous potent lipophilic drugs exhibit low
oral bioavailability due to their poor aqueous solubility
properties. Therapeutic effectiveness of a drug depends up
on the bioavailability and ultimately upon the solubility and
dissolution rate of drug molecules. Solubility and
dissolution rate are the important parameters to achieve
desired concentration of drug in systemic circulation for
pharmaceutical response to be shown [1].
BCS class II drugs pose challenging problems in
their pharmaceutical product development process because
of their low solubility and dissolution rates. They require
enhancement in solubility and dissolution rate in their
formulation development especially solid dosage forms such
as tablets and capsules.
More recently, powdered solution (liquisolid)
technology has been proposed as a technique for the
delivery of water-soluble drugs. The concept of powdered
solutions involves converting drug solutions or liquid drugs
into a dry, non-adherent, free-flowing compressible powder
by admixturing the liquid drugs or drug solutions with a
selected carrier. Although the dosage form is a solid, the
drug was held in a solubilized liquid state, which enhances
diffusion directly into cells. Alternatively, improves the
wetting properties of the drug and therefore enhanced
dissolution [2].
Since drug dissolution is often the rate limiting step
in gastrointestinal absorption, the significant increase in
wetting properties and surface area of drug particles
available for dissolution from liquisolid compacts may be
expected to display enhanced drug release characteristics
and, consequently, improved oral bioavailability.
The technique of liquisolid compacts has been
successfully employed to improve the In Vitro release of
poorly water soluble drugs such as Carvidilol [3],
Corresponding Author :- CH.Pradeep Kumar Email:- [email protected]
Pradeep Kumar CH. et al. / IJPDT / 3 (2), 2013, 80-96.
81 | P a g e
Bromhexine Hydrochloride [4], Furosemide [5],
carbamazepine [6], Fenifibrate [7], Indomethacin [8],
Aceclofenac [9], ketoprofen [10], theophylline [11],
propranolol hydrochloride [12], Lansoprazole [13],
Irbesartan [14], Lornoxicam [15], simvastatin [16], tramadol
hydrochloride [17], and fenofibrate [18].
Mefenamic acid is one of the Anthranilic acid
derivatives of Non-Steroidal Anti-Inflammatory Drugs
(NSAID). Recent clinical studies on Mefenamic acid
revealed that the drug is an effective agent for accumulation
and moderate to severe ulceration in GI tract. Repeated
administration of high doses of mefenamic acid (250-500
mg- 3 times/day) leads to accumulation of drug in GIT
causes Inflammatory bowel diseases, peptic ulcers, and also
due to its sudden release causes local irritation in the
stomach which is a major limitation for mefenamic acid as
conventional release dosage form, and its less half-life
period (< 2hrs). To reduce frequent administration of dosage
form and to improve patient compliance extended release
liquisolid mefenamic acid formulation is desirable.
Hence the main objective of this work was to
retard/sustain the drug release from the dosage form to
eliminate the repeated administration and also to increase
the half-life of mefenamic acid in GI environment.
In the present study, Hydroxy Propyl Methyl
Cellulose (HPMC) K100M was used as adjuvant for
sustaining the drug release from liquisolid compacts. Poly
Ethylene Glycol (PEG-400) was used as non-volatile
lipophilic solvent. Avicel PH 102 (Microcrystalline
cellulose), Pregelatinized Starch and Aerosil 200 (Colloidal
silicon dioxide) were used as carrier and coating materials,
respectively. Precompression studies such as determination
of angle of slide, Hausner’s ratio, Carr’s index and
stereomicroscopic analysis was also studied. The
discrimination of release profiles was compared with normal
extended release tablets of Mefenamic acid (without liquid
lipophilic solvent and Aerosil 200). Model fitting of the
results was also done for different models such as Zero
order, First order, Higuchi plot and Korsemayer-Peppas plot
models. The formulation design of liquisolid systems was
done in accordance with new mathematical model described
by spireas et al., [19].
MATERIALS AND METHODS
Materials
Mefenamic acid was obtained from Alexo pharma
(India). HPMC K100M, Avicel PH-102, Starch
pregelatinized, Aerosil 200 were purchased from Drugs
India Pvt ltd (India). Poly ethylene glycol 400 was obtained
from Fischer scientific. All the remaining ingredients and
chemicals utilized were of analytical grade.
Methods
Application of mathematical model for design of
Liquisolid compacts
Before designing the liquisolid system, the preformulation
studies should be performed first, includes
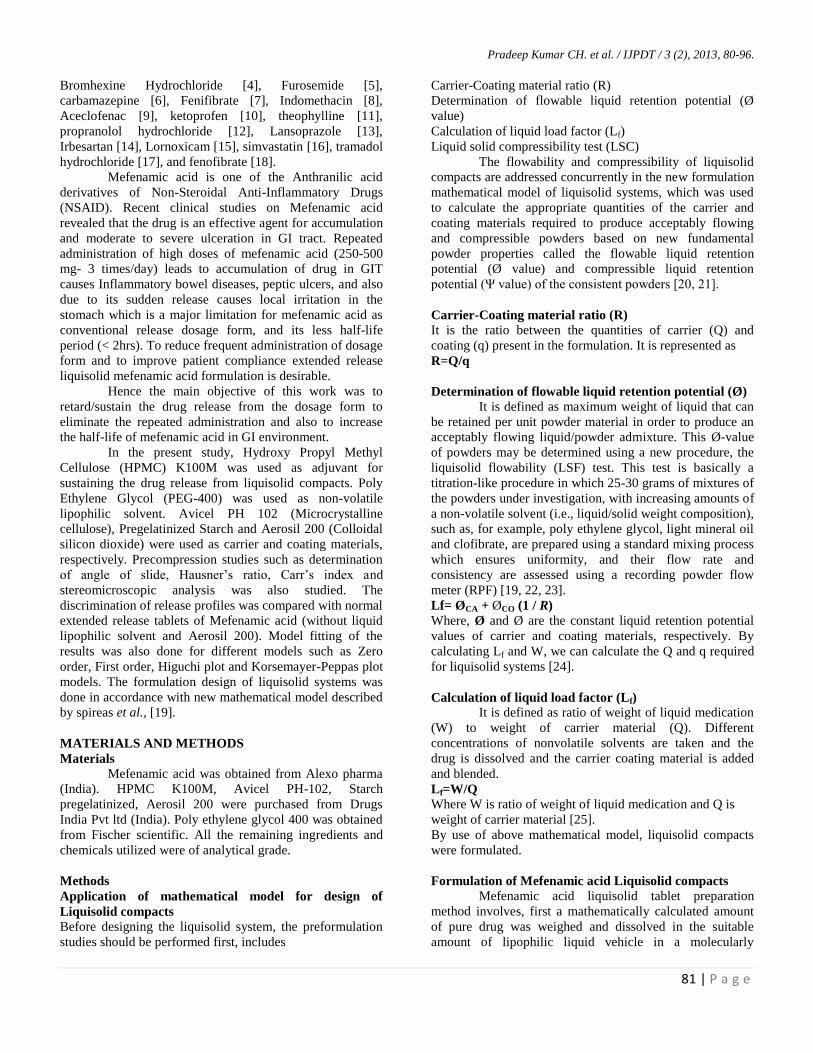
Carrier-Coating material ratio (R)
Determination of flowable liquid retention potential (Ø
value)
Calculation of liquid load factor (Lf)
Liquid solid compressibility test (LSC)
The flowability and compressibility of liquisolid
compacts are addressed concurrently in the new formulation
mathematical model of liquisolid systems, which was used
to calculate the appropriate quantities of the carrier and
coating materials required to produce acceptably flowing
and compressible powders based on new fundamental
powder properties called the flowable liquid retention
potential (Ø value) and compressible liquid retention
potential (Ψ value) of the consistent powders [20, 21].
Carrier-Coating material ratio (R)
It is the ratio between the quantities of carrier (Q) and
coating (q) present in the formulation. It is represented as
R=Q/q
Determination of flowable liquid retention potential (Ø)
It is defined as maximum weight of liquid that can
be retained per unit powder material in order to produce an
acceptably flowing liquid/powder admixture. This Ø-value
of powders may be determined using a new procedure, the
liquisolid flowability (LSF) test. This test is basically a
titration-like procedure in which 25-30 grams of mixtures of
the powders under investigation, with increasing amounts of
a non-volatile solvent (i.e., liquid/solid weight composition),
such as, for example, poly ethylene glycol, light mineral oil
and clofibrate, are prepared using a standard mixing process
which ensures uniformity, and their flow rate and
consistency are assessed using a recording powder flow
meter (RPF) [19, 22, 23].
Lf= ØCA + ØCO (1 / R)
Where, Ø and Ø are the constant liquid retention potential
values of carrier and coating materials, respectively. By
calculating Lf and W, we can calculate the Q and q required
for liquisolid systems [24].
Calculation of liquid load factor (Lf)
It is defined as ratio of weight of liquid medication
(W) to weight of carrier material (Q). Different
concentrations of nonvolatile solvents are taken and the
drug is dissolved and the carrier coating material is added
and blended.
Lf=W/Q
Where W is ratio of weight of liquid medication and Q is
weight of carrier material [25].
By use of above mathematical model, liquisolid compacts
were formulated.
Formulation of Mefenamic acid Liquisolid compacts
Mefenamic acid liquisolid tablet preparation
method involves, first a mathematically calculated amount
of pure drug was weighed and dissolved in the suitable
amount of lipophilic liquid vehicle in a molecularly
Pradeep Kumar CH. et al. / IJPDT / 3 (2), 2013, 80-96.
82 | P a g e
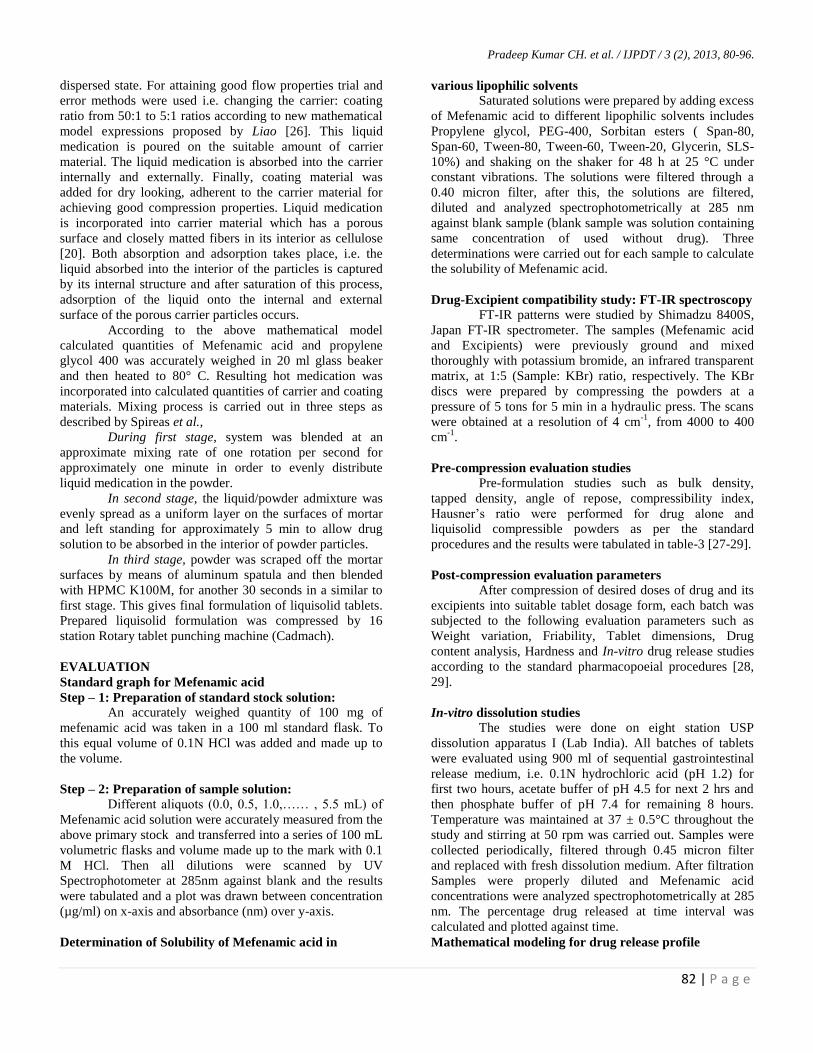
dispersed state. For attaining good flow properties trial and
error methods were used i.e. changing the carrier: coating
ratio from 50:1 to 5:1 ratios according to new mathematical
model expressions proposed by Liao [26]. This liquid
medication is poured on the suitable amount of carrier
material. The liquid medication is absorbed into the carrier
internally and externally. Finally, coating material was
added for dry looking, adherent to the carrier material for
achieving good compression properties. Liquid medication
is incorporated into carrier material which has a porous
surface and closely matted fibers in its interior as cellulose
[20]. Both absorption and adsorption takes place, i.e. the
liquid absorbed into the interior of the particles is captured
by its internal structure and after saturation of this process,
adsorption of the liquid onto the internal and external
surface of the porous carrier particles occurs.
According to the above mathematical model
calculated quantities of Mefenamic acid and propylene
glycol 400 was accurately weighed in 20 ml glass beaker
and then heated to 80° C. Resulting hot medication was
incorporated into calculated quantities of carrier and coating
materials. Mixing process is carried out in three steps as
described by Spireas et al.,
During first stage, system was blended at an
approximate mixing rate of one rotation per second for
approximately one minute in order to evenly distribute
liquid medication in the powder.
In second stage, the liquid/powder admixture was
evenly spread as a uniform layer on the surfaces of mortar
and left standing for approximately 5 min to allow drug
solution to be absorbed in the interior of powder particles.
In third stage, powder was scraped off the mortar
surfaces by means of aluminum spatula and then blended
with HPMC K100M, for another 30 seconds in a similar to
first stage. This gives final formulation of liquisolid tablets.
Prepared liquisolid formulation was compressed by 16
station Rotary tablet punching machine (Cadmach).
EVALUATION
Standard graph for Mefenamic acid
Step – 1: Preparation of standard stock solution:
An accurately weighed quantity of 100 mg of
mefenamic acid was taken in a 100 ml standard flask. To
this equal volume of 0.1N HCl was added and made up to
the volume.
Step – 2: Preparation of sample solution:
Different aliquots (0.0, 0.5, 1.0,…… , 5.5 mL) of
Mefenamic acid solution were accurately measured from the
above primary stock and transferred into a series of 100 mL
volumetric flasks and volume made up to the mark with 0.1
M HCl. Then all dilutions were scanned by UV
Spectrophotometer at 285nm against blank and the results
were tabulated and a plot was drawn between concentration
(µg/ml) on x-axis and absorbance (nm) over y-axis.
Determination of Solubility of Mefenamic acid in
various lipophilic solvents
Saturated solutions were prepared by adding excess
of Mefenamic acid to different lipophilic solvents includes
Propylene glycol, PEG-400, Sorbitan esters ( Span-80,
Span-60, Tween-80, Tween-60, Tween-20, Glycerin, SLS-
10%) and shaking on the shaker for 48 h at 25 °C under
constant vibrations. The solutions were filtered through a
0.40 micron filter, after this, the solutions are filtered,
diluted and analyzed spectrophotometrically at 285 nm
against blank sample (blank sample was solution containing
same concentration of used without drug). Three
determinations were carried out for each sample to calculate
the solubility of Mefenamic acid.
Drug-Excipient compatibility study: FT-IR spectroscopy
FT-IR patterns were studied by Shimadzu 8400S,
Japan FT-IR spectrometer. The samples (Mefenamic acid
and Excipients) were previously ground and mixed
thoroughly with potassium bromide, an infrared transparent
matrix, at 1:5 (Sample: KBr) ratio, respectively. The KBr
discs were prepared by compressing the powders at a
pressure of 5 tons for 5 min in a hydraulic press. The scans
were obtained at a resolution of 4 cm-1
, from 4000 to 400
cm-1
.
Pre-compression evaluation studies
Pre-formulation studies such as bulk density,
tapped density, angle of repose, compressibility index,
Hausner’s ratio were performed for drug alone and
liquisolid compressible powders as per the standard
procedures and the results were tabulated in table-3 [27-29].
Post-compression evaluation parameters
After compression of desired doses of drug and its
excipients into suitable tablet dosage form, each batch was
subjected to the following evaluation parameters such as
Weight variation, Friability, Tablet dimensions, Drug
content analysis, Hardness and In-vitro drug release studies
according to the standard pharmacopoeial procedures [28,
29].
In-vitro dissolution studies The studies were done on eight station USP
dissolution apparatus I (Lab India). All batches of tablets
were evaluated using 900 ml of sequential gastrointestinal
release medium, i.e. 0.1N hydrochloric acid (pH 1.2) for
first two hours, acetate buffer of pH 4.5 for next 2 hrs and
then phosphate buffer of pH 7.4 for remaining 8 hours.
Temperature was maintained at 37 ± 0.5°C throughout the
study and stirring at 50 rpm was carried out. Samples were
collected periodically, filtered through 0.45 micron filter
and replaced with fresh dissolution medium. After filtration
Samples were properly diluted and Mefenamic acid
concentrations were analyzed spectrophotometrically at 285
nm. The percentage drug released at time interval was
calculated and plotted against time.
Mathematical modeling for drug release profile
Pradeep Kumar CH. et al. / IJPDT / 3 (2), 2013, 80-96.
83 | P a g e
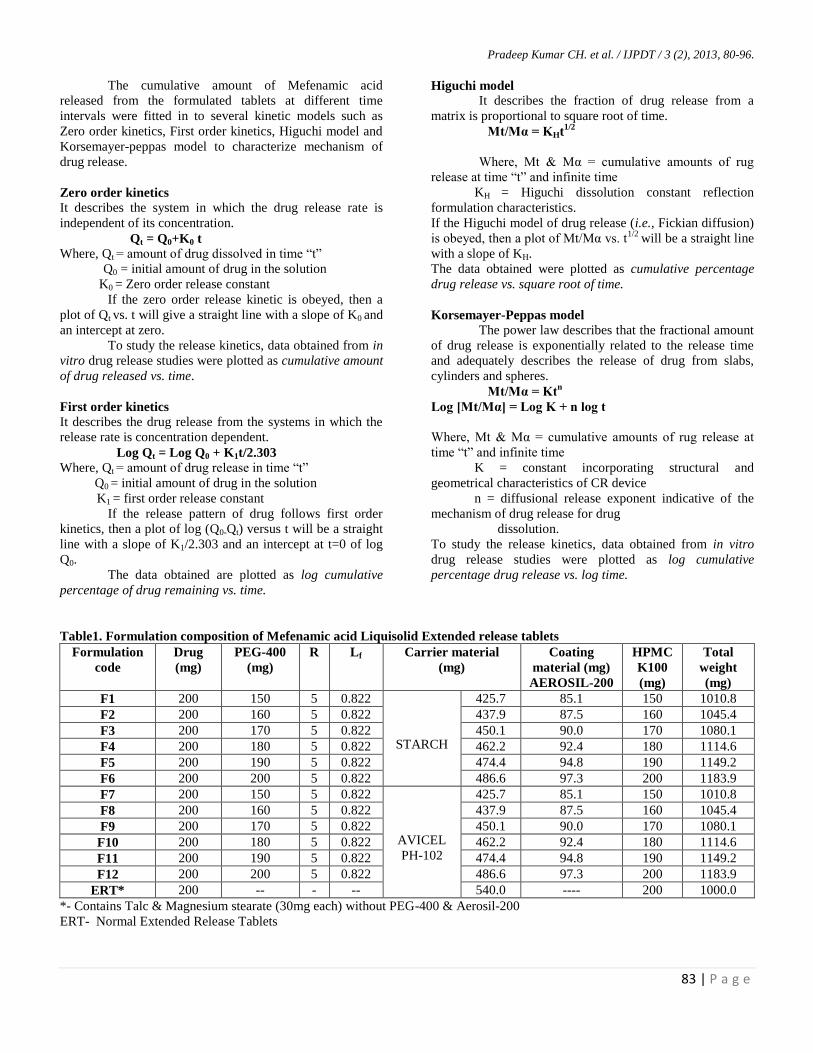
The cumulative amount of Mefenamic acid
released from the formulated tablets at different time
intervals were fitted in to several kinetic models such as
Zero order kinetics, First order kinetics, Higuchi model and
Korsemayer-peppas model to characterize mechanism of
drug release.
Zero order kinetics It describes the system in which the drug release rate is
independent of its concentration.
Qt = Q0+K0 t
Where, Qt = amount of drug dissolved in time “t”
Q0 = initial amount of drug in the solution
K0 = Zero order release constant
If the zero order release kinetic is obeyed, then a
plot of Qt vs. t will give a straight line with a slope of K0 and
an intercept at zero.
To study the release kinetics, data obtained from in
vitro drug release studies were plotted as cumulative amount
of drug released vs. time.
First order kinetics
It describes the drug release from the systems in which the
release rate is concentration dependent.
Log Qt = Log Q0 + K1t/2.303
Where, Qt = amount of drug release in time “t”
Q0 = initial amount of drug in the solution
K1 = first order release constant
If the release pattern of drug follows first order
kinetics, then a plot of log (Q0-Qt) versus t will be a straight
line with a slope of K1/2.303 and an intercept at t=0 of log
Q0.
The data obtained are plotted as log cumulative
percentage of drug remaining vs. time.
Higuchi model
It describes the fraction of drug release from a
matrix is proportional to square root of time.
Mt/Mα = KHt1/2
Where, Mt & Mα = cumulative amounts of rug
release at time “t” and infinite time
KH = Higuchi dissolution constant reflection
formulation characteristics.
If the Higuchi model of drug release (i.e., Fickian diffusion)
is obeyed, then a plot of Mt/Mα vs. t1/2
will be a straight line
with a slope of KH.
The data obtained were plotted as cumulative percentage
drug release vs. square root of time.
Korsemayer-Peppas model
The power law describes that the fractional amount
of drug release is exponentially related to the release time
and adequately describes the release of drug from slabs,
cylinders and spheres.
Mt/Mα = Ktn
Log [Mt/Mα] = Log K + n log t
Where, Mt & Mα = cumulative amounts of rug release at
time “t” and infinite time
K = constant incorporating structural and
geometrical characteristics of CR device
n = diffusional release exponent indicative of the
mechanism of drug release for drug
dissolution.
To study the release kinetics, data obtained from in vitro
drug release studies were plotted as log cumulative
percentage drug release vs. log time.
Table1. Formulation composition of Mefenamic acid Liquisolid Extended release tablets
Formulation
code
Drug
(mg)
PEG-400
(mg)
R Lf Carrier material
(mg)
Coating
material (mg)
AEROSIL-200
HPMC
K100
(mg)
Total
weight
(mg)
F1 200 150 5 0.822
STARCH
425.7 85.1 150 1010.8
F2 200 160 5 0.822 437.9 87.5 160 1045.4
F3 200 170 5 0.822 450.1 90.0 170 1080.1
F4 200 180 5 0.822 462.2 92.4 180 1114.6
F5 200 190 5 0.822 474.4 94.8 190 1149.2
F6 200 200 5 0.822 486.6 97.3 200 1183.9
F7 200 150 5 0.822
AVICEL
PH-102
425.7 85.1 150 1010.8
F8 200 160 5 0.822 437.9 87.5 160 1045.4
F9 200 170 5 0.822 450.1 90.0 170 1080.1
F10 200 180 5 0.822 462.2 92.4 180 1114.6
F11 200 190 5 0.822 474.4 94.8 190 1149.2
F12 200 200 5 0.822 486.6 97.3 200 1183.9
ERT* 200 -- - -- 540.0 ---- 200 1000.0
*- Contains Talc & Magnesium stearate (30mg each) without PEG-400 & Aerosil-200
ERT- Normal Extended Release Tablets
Pradeep Kumar CH. et al. / IJPDT / 3 (2), 2013, 80-96.
84 | P a g e
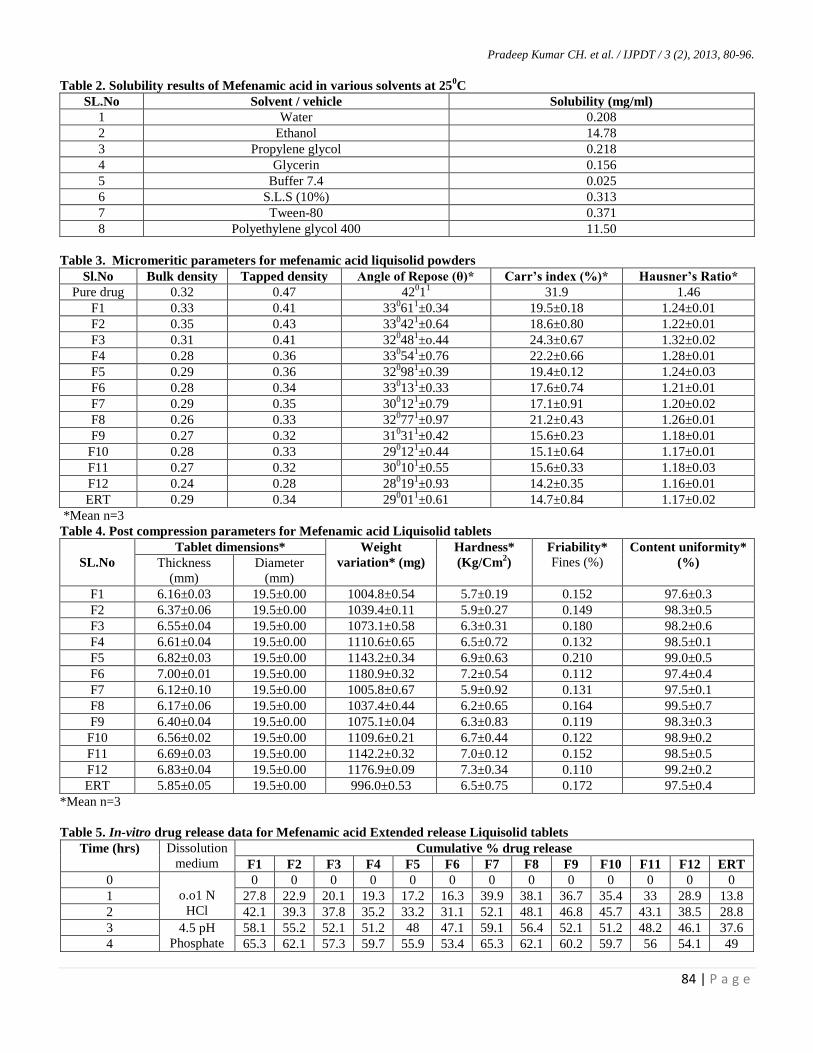
Table 2. Solubility results of Mefenamic acid in various solvents at 250C
SL.No Solvent / vehicle Solubility (mg/ml)
1 Water 0.208
2 Ethanol 14.78
3 Propylene glycol 0.218
4 Glycerin 0.156
5 Buffer 7.4 0.025
6 S.L.S (10%) 0.313
7 Tween-80 0.371
8 Polyethylene glycol 400 11.50
Table 3. Micromeritic parameters for mefenamic acid liquisolid powders
Sl.No Bulk density Tapped density Angle of Repose (θ)* Carr’s index (%)* Hausner’s Ratio*
Pure drug 0.32 0.47 4201
1 31.9 1.46
F1 0.33 0.41 33061
1±0.34 19.5±0.18 1.24±0.01
F2 0.35 0.43 33042
1±0.64 18.6±0.80 1.22±0.01
F3 0.31 0.41 32048
1±o.44 24.3±0.67 1.32±0.02
F4 0.28 0.36 33054
1±0.76 22.2±0.66 1.28±0.01
F5 0.29 0.36 32098
1±0.39 19.4±0.12 1.24±0.03
F6 0.28 0.34 33013
1±0.33 17.6±0.74 1.21±0.01
F7 0.29 0.35 30012
1±0.79 17.1±0.91 1.20±0.02
F8 0.26 0.33 32077
1±0.97 21.2±0.43 1.26±0.01
F9 0.27 0.32 31031
1±0.42 15.6±0.23 1.18±0.01
F10 0.28 0.33 29012
1±0.44 15.1±0.64 1.17±0.01
F11 0.27 0.32 30010
1±0.55 15.6±0.33 1.18±0.03
F12 0.24 0.28 28019
1±0.93 14.2±0.35 1.16±0.01
ERT 0.29 0.34 29001
1±0.61 14.7±0.84 1.17±0.02
*Mean n=3
Table 4. Post compression parameters for Mefenamic acid Liquisolid tablets
SL.No
Tablet dimensions* Weight
variation* (mg)
Hardness*
(Kg/Cm2)
Friability*
Fines (%) Content uniformity*
(%) Thickness
(mm)
Diameter
(mm)
F1 6.16±0.03 19.5±0.00 1004.8±0.54 5.7±0.19 0.152 97.6±0.3
F2 6.37±0.06 19.5±0.00 1039.4±0.11 5.9±0.27 0.149 98.3±0.5
F3 6.55±0.04 19.5±0.00 1073.1±0.58 6.3±0.31 0.180 98.2±0.6
F4 6.61±0.04 19.5±0.00 1110.6±0.65 6.5±0.72 0.132 98.5±0.1
F5 6.82±0.03 19.5±0.00 1143.2±0.34 6.9±0.63 0.210 99.0±0.5
F6 7.00±0.01 19.5±0.00 1180.9±0.32 7.2±0.54 0.112 97.4±0.4
F7 6.12±0.10 19.5±0.00 1005.8±0.67 5.9±0.92 0.131 97.5±0.1
F8 6.17±0.06 19.5±0.00 1037.4±0.44 6.2±0.65 0.164 99.5±0.7
F9 6.40±0.04 19.5±0.00 1075.1±0.04 6.3±0.83 0.119 98.3±0.3
F10 6.56±0.02 19.5±0.00 1109.6±0.21 6.7±0.44 0.122 98.9±0.2
F11 6.69±0.03 19.5±0.00 1142.2±0.32 7.0±0.12 0.152 98.5±0.5
F12 6.83±0.04 19.5±0.00 1176.9±0.09 7.3±0.34 0.110 99.2±0.2
ERT 5.85±0.05 19.5±0.00 996.0±0.53 6.5±0.75 0.172 97.5±0.4
*Mean n=3
Table 5. In-vitro drug release data for Mefenamic acid Extended release Liquisolid tablets
Time (hrs) Dissolution
medium Cumulative % drug release
F1 F2 F3 F4 F5 F6 F7 F8 F9 F10 F11 F12 ERT
0
o.o1 N
HCl
0 0 0 0 0 0 0 0 0 0 0 0 0
1 27.8 22.9 20.1 19.3 17.2 16.3 39.9 38.1 36.7 35.4 33 28.9 13.8
2 42.1 39.3 37.8 35.2 33.2 31.1 52.1 48.1 46.8 45.7 43.1 38.5 28.8
3 4.5 pH
Phosphate
58.1 55.2 52.1 51.2 48 47.1 59.1 56.4 52.1 51.2 48.2 46.1 37.6
4 65.3 62.1 57.3 59.7 55.9 53.4 65.3 62.1 60.2 59.7 56 54.1 49
Pradeep Kumar CH. et al. / IJPDT / 3 (2), 2013, 80-96.
85 | P a g e
5 buffer 71.5 68.7 65.1 65.9 62.5 59.7 70.1 69.4 67 64.1 63.1 59.7 56.9
6
7.4 pH
phosphate
buffer
76.1 73.1 70.1 71 68.6 64.7 76.1 73.1 71.8 71.4 68.6 64.7 68.4
8 83.9 82.3 80.4 81.3 78 75 85.6 82.3 83.6 81.1 78 75 79.3
10 91.3 89.6 87.6 87.5 84.9 83.7 92.1 90.6 87.6 87.5 84.9 83.7 90.1
12 96.3 95.9 93.6 92.9 91.8 89.2 98.9 97.9 94.3 93.2 91.9 87.5 97.8
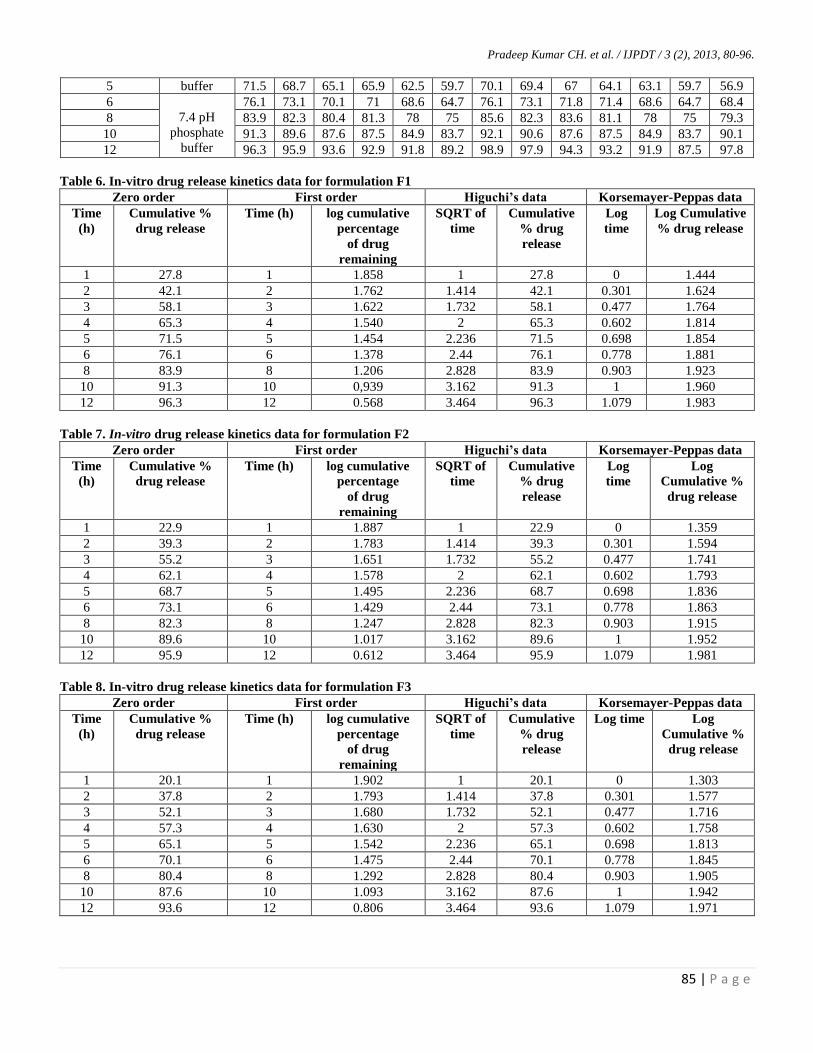
Table 6. In-vitro drug release kinetics data for formulation F1
Zero order First order Higuchi’s data Korsemayer-Peppas data
Time
(h)
Cumulative %
drug release
Time (h) log cumulative
percentage
of drug
remaining
SQRT of
time
Cumulative
% drug
release
Log
time
Log Cumulative
% drug release
1 27.8 1 1.858 1 27.8 0 1.444
2 42.1 2 1.762 1.414 42.1 0.301 1.624
3 58.1 3 1.622 1.732 58.1 0.477 1.764
4 65.3 4 1.540 2 65.3 0.602 1.814
5 71.5 5 1.454 2.236 71.5 0.698 1.854
6 76.1 6 1.378 2.44 76.1 0.778 1.881
8 83.9 8 1.206 2.828 83.9 0.903 1.923
10 91.3 10 0,939 3.162 91.3 1 1.960
12 96.3 12 0.568 3.464 96.3 1.079 1.983
Table 7. In-vitro drug release kinetics data for formulation F2
Zero order First order Higuchi’s data Korsemayer-Peppas data
Time
(h)
Cumulative %
drug release
Time (h) log cumulative
percentage
of drug
remaining
SQRT of
time
Cumulative
% drug
release
Log
time
Log
Cumulative %
drug release
1 22.9 1 1.887 1 22.9 0 1.359
2 39.3 2 1.783 1.414 39.3 0.301 1.594
3 55.2 3 1.651 1.732 55.2 0.477 1.741
4 62.1 4 1.578 2 62.1 0.602 1.793
5 68.7 5 1.495 2.236 68.7 0.698 1.836
6 73.1 6 1.429 2.44 73.1 0.778 1.863
8 82.3 8 1.247 2.828 82.3 0.903 1.915
10 89.6 10 1.017 3.162 89.6 1 1.952
12 95.9 12 0.612 3.464 95.9 1.079 1.981
Table 8. In-vitro drug release kinetics data for formulation F3
Zero order First order Higuchi’s data Korsemayer-Peppas data
Time
(h)
Cumulative %
drug release
Time (h) log cumulative
percentage
of drug
remaining
SQRT of
time
Cumulative
% drug
release
Log time Log
Cumulative %
drug release
1 20.1 1 1.902 1 20.1 0 1.303
2 37.8 2 1.793 1.414 37.8 0.301 1.577
3 52.1 3 1.680 1.732 52.1 0.477 1.716
4 57.3 4 1.630 2 57.3 0.602 1.758
5 65.1 5 1.542 2.236 65.1 0.698 1.813
6 70.1 6 1.475 2.44 70.1 0.778 1.845
8 80.4 8 1.292 2.828 80.4 0.903 1.905
10 87.6 10 1.093 3.162 87.6 1 1.942
12 93.6 12 0.806 3.464 93.6 1.079 1.971

Pradeep Kumar CH. et al. / IJPDT / 3 (2), 2013, 80-96.
86 | P a g e
Table 9. In-vitro drug release kinetics data for formulation F4
Zero order First order Higuchi’s data Korsemayer-Peppas data
Time
(h)
Cumulative %
drug release
Time (h) log cumulative
percentage
of drug
remaining
SQRT of
time
Cumulative
% drug
release
Log time Log
Cumulative %
drug release
1 19.3 1 1.906 1 19.3 0 1.285
2 35.2 2 1.811 1.414 35.2 0.301 1.546
3 51.2 3 1.688 1.732 51.2 0.477 1.709
4 59.7 4 1.605 2 59.7 0.602 1.775
5 65.9 5 1.532 2.236 65.9 0.698 1.818
6 71 6 1.462 2.44 71 0.778 1.851
8 81.3 8 1.271 2.828 81.3 0.903 1.910
10 87.5 10 1.096 3.162 87.5 1 1.942
12 92.9 12 0.851 3.464 92.9 1.079 1.968
Table 10. In-vitro drug release kinetics data for formulation F5
Zero order First order Higuchi’s data Korsemayer-Peppas data
Time
(h)
Cumulative %
drug release
Time (h) log cumulative
percentage
of drug
remaining
SQRT of
time
Cumulative
% drug
release
Log time Log
Cumulative %
drug release
1 17.2 1 1.918 1 17.2 0 1.235
2 33.2 2 1.824 1.414 33.2 0.301 1.521
3 48 3 1.716 1.732 48 0.477 1.681
4 55.9 4 1.644 2 55.9 0.602 1.747
5 62.5 5 1.574 2.236 62.5 0.698 1.795
6 68.6 6 1.496 2.44 68.6 0.778 1.836
8 78 8 1.342 2.828 78 0.903 1.892
10 84.9 10 1.178 3.162 84.9 1 1.928
12 91.8 12 0.918 3.464 91.8 1.079 1.962
Table-11. In-vitro drug release kinetics data for formulation F6
Zero order First order Higuchi’s data Korsemayer-Peppas data
Time
(h)
Cumulative %
drug release
Time (h) log cumulative
percentage
of drug
remaining
SQRT of
time
Cumulative
% drug
release
Log time Log
Cumulative %
drug release
1 16.3 1 1.922 1 16.3 0 1.212
2 31.1 2 1.838 1.414 31.1 0.301 1.492
3 47.1 3 1.723 1.732 47.1 0.477 1.673
4 53.4 4 1.668 2 53.4 0.602 1.727
5 59.7 5 1.605 2.236 59.7 0.698 1.775
6 64.7 6 1.547 2.44 64.7 0.778 1.810
8 75 8 1.397 2.828 75 0.903 1.875
10 83.7 10 1.220 3.162 83.7 1 1.922
12 89.2 12 1.033 3.464 89.2 1.079 1.950
Table 12. In-vitro drug release kinetics data for formulation F7
Zero order First order Higuchi’s data Korsemayer-Peppas data
Time
(h)
Cumulative %
drug release
Time (h) log cumulative
percentage
of drug
remaining
SQRT of
time
Cumulative
% drug
release
Log time Log
Cumulative %
drug release
1 39.9 1 1.778 1 39.9 0 1.600
Pradeep Kumar CH. et al. / IJPDT / 3 (2), 2013, 80-96.
87 | P a g e
2 52.1 2 1.680 1.414 52.1 0.301 1.716
3 59.1 3 1.611 1.732 59.1 0.477 1.771
4 65.3 4 1.540 2 65.3 0.602 1.814
5 70.1 5 1.475 2.236 70.1 0.698 1.845
6 76.1 6 1.378 2.44 76.1 0.778 1.881
8 85.6 8 1.158 2.828 85.6 0.903 1.932
10 92.1 10 0.897 3.162 92.1 1 1.964
12 98.9 12 0.041 3.464 98.9 1.079 1.995
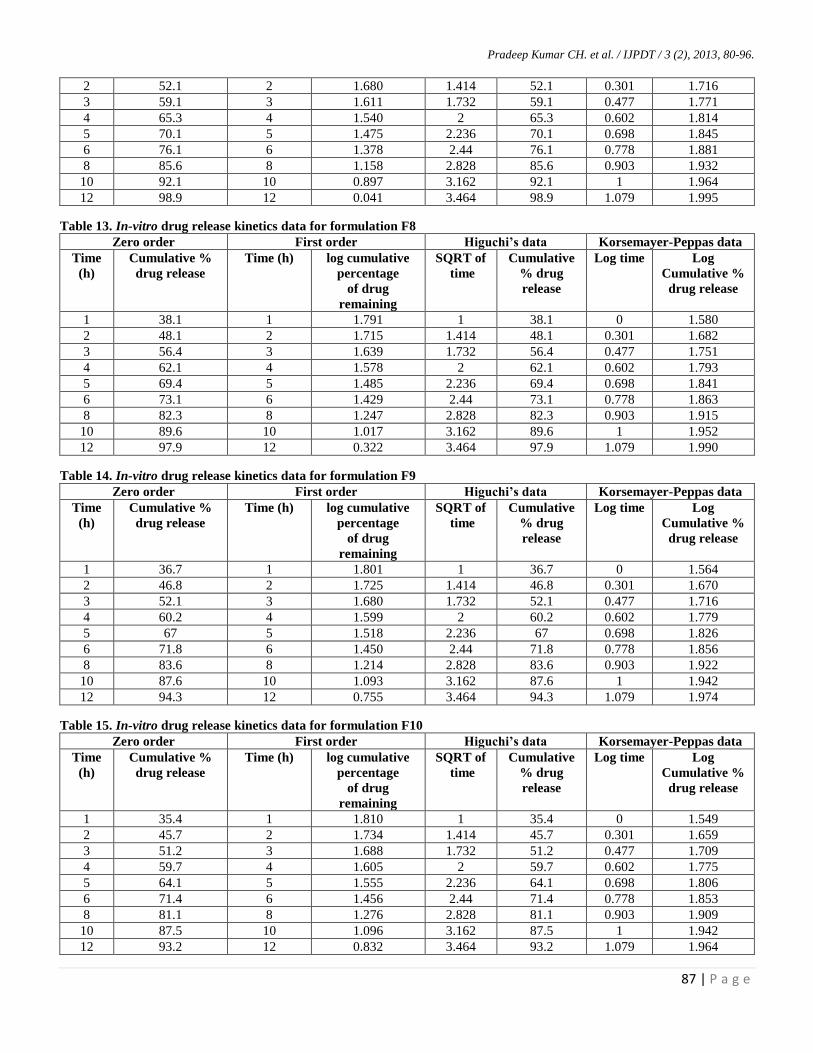
Table 13. In-vitro drug release kinetics data for formulation F8
Zero order First order Higuchi’s data Korsemayer-Peppas data
Time
(h)
Cumulative %
drug release
Time (h) log cumulative
percentage
of drug
remaining
SQRT of
time
Cumulative
% drug
release
Log time Log
Cumulative %
drug release
1 38.1 1 1.791 1 38.1 0 1.580
2 48.1 2 1.715 1.414 48.1 0.301 1.682
3 56.4 3 1.639 1.732 56.4 0.477 1.751
4 62.1 4 1.578 2 62.1 0.602 1.793
5 69.4 5 1.485 2.236 69.4 0.698 1.841
6 73.1 6 1.429 2.44 73.1 0.778 1.863
8 82.3 8 1.247 2.828 82.3 0.903 1.915
10 89.6 10 1.017 3.162 89.6 1 1.952
12 97.9 12 0.322 3.464 97.9 1.079 1.990
Table 14. In-vitro drug release kinetics data for formulation F9
Zero order First order Higuchi’s data Korsemayer-Peppas data
Time
(h)
Cumulative %
drug release
Time (h) log cumulative
percentage
of drug
remaining
SQRT of
time
Cumulative
% drug
release
Log time Log
Cumulative %
drug release
1 36.7 1 1.801 1 36.7 0 1.564
2 46.8 2 1.725 1.414 46.8 0.301 1.670
3 52.1 3 1.680 1.732 52.1 0.477 1.716
4 60.2 4 1.599 2 60.2 0.602 1.779
5 67 5 1.518 2.236 67 0.698 1.826
6 71.8 6 1.450 2.44 71.8 0.778 1.856
8 83.6 8 1.214 2.828 83.6 0.903 1.922
10 87.6 10 1.093 3.162 87.6 1 1.942
12 94.3 12 0.755 3.464 94.3 1.079 1.974
Table 15. In-vitro drug release kinetics data for formulation F10
Zero order First order Higuchi’s data Korsemayer-Peppas data
Time
(h)
Cumulative %
drug release
Time (h) log cumulative
percentage
of drug
remaining
SQRT of
time
Cumulative
% drug
release
Log time Log
Cumulative %
drug release
1 35.4 1 1.810 1 35.4 0 1.549
2 45.7 2 1.734 1.414 45.7 0.301 1.659
3 51.2 3 1.688 1.732 51.2 0.477 1.709
4 59.7 4 1.605 2 59.7 0.602 1.775
5 64.1 5 1.555 2.236 64.1 0.698 1.806
6 71.4 6 1.456 2.44 71.4 0.778 1.853
8 81.1 8 1.276 2.828 81.1 0.903 1.909
10 87.5 10 1.096 3.162 87.5 1 1.942
12 93.2 12 0.832 3.464 93.2 1.079 1.964
Pradeep Kumar CH. et al. / IJPDT / 3 (2), 2013, 80-96.
88 | P a g e
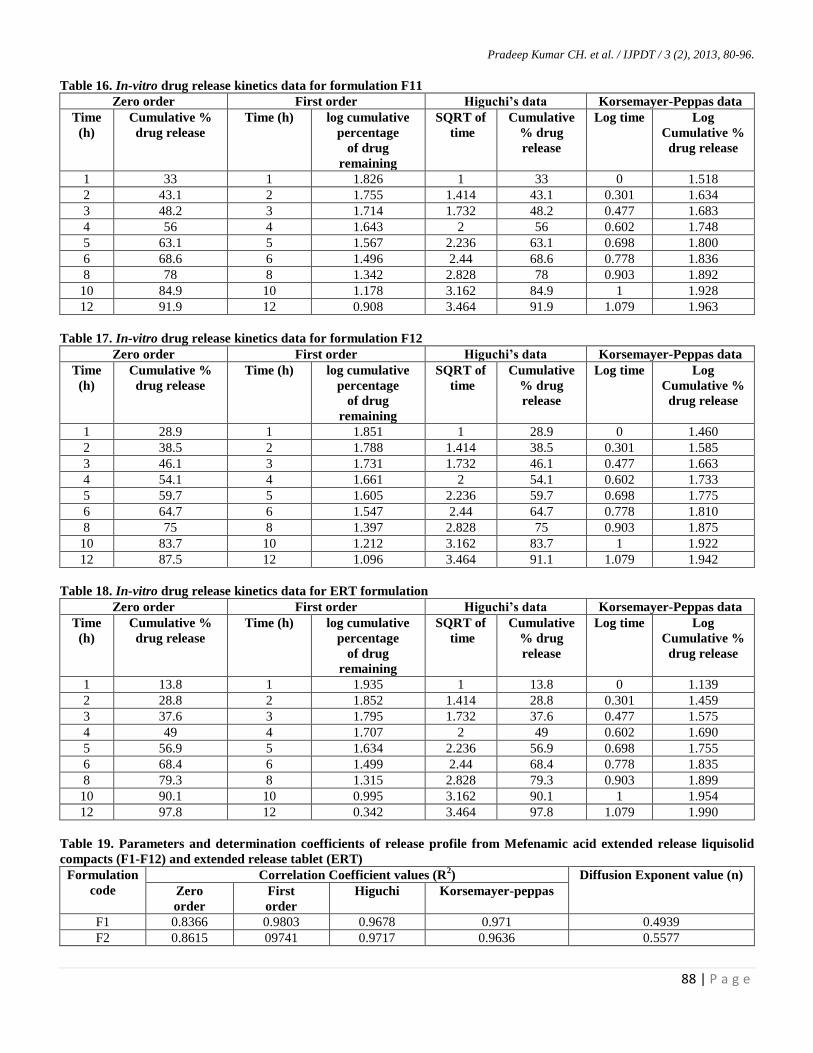
Table 16. In-vitro drug release kinetics data for formulation F11
Zero order First order Higuchi’s data Korsemayer-Peppas data
Time
(h)
Cumulative %
drug release
Time (h) log cumulative
percentage
of drug
remaining
SQRT of
time
Cumulative
% drug
release
Log time Log
Cumulative %
drug release
1 33 1 1.826 1 33 0 1.518
2 43.1 2 1.755 1.414 43.1 0.301 1.634
3 48.2 3 1.714 1.732 48.2 0.477 1.683
4 56 4 1.643 2 56 0.602 1.748
5 63.1 5 1.567 2.236 63.1 0.698 1.800
6 68.6 6 1.496 2.44 68.6 0.778 1.836
8 78 8 1.342 2.828 78 0.903 1.892
10 84.9 10 1.178 3.162 84.9 1 1.928
12 91.9 12 0.908 3.464 91.9 1.079 1.963
Table 17. In-vitro drug release kinetics data for formulation F12
Zero order First order Higuchi’s data Korsemayer-Peppas data
Time
(h)
Cumulative %
drug release
Time (h) log cumulative
percentage
of drug
remaining
SQRT of
time
Cumulative
% drug
release
Log time Log
Cumulative %
drug release
1 28.9 1 1.851 1 28.9 0 1.460
2 38.5 2 1.788 1.414 38.5 0.301 1.585
3 46.1 3 1.731 1.732 46.1 0.477 1.663
4 54.1 4 1.661 2 54.1 0.602 1.733
5 59.7 5 1.605 2.236 59.7 0.698 1.775
6 64.7 6 1.547 2.44 64.7 0.778 1.810
8 75 8 1.397 2.828 75 0.903 1.875
10 83.7 10 1.212 3.162 83.7 1 1.922
12 87.5 12 1.096 3.464 91.1 1.079 1.942
Table 18. In-vitro drug release kinetics data for ERT formulation
Zero order First order Higuchi’s data Korsemayer-Peppas data
Time
(h)
Cumulative %
drug release
Time (h) log cumulative
percentage
of drug
remaining
SQRT of
time
Cumulative
% drug
release
Log time Log
Cumulative %
drug release
1 13.8 1 1.935 1 13.8 0 1.139
2 28.8 2 1.852 1.414 28.8 0.301 1.459
3 37.6 3 1.795 1.732 37.6 0.477 1.575
4 49 4 1.707 2 49 0.602 1.690
5 56.9 5 1.634 2.236 56.9 0.698 1.755
6 68.4 6 1.499 2.44 68.4 0.778 1.835
8 79.3 8 1.315 2.828 79.3 0.903 1.899
10 90.1 10 0.995 3.162 90.1 1 1.954
12 97.8 12 0.342 3.464 97.8 1.079 1.990
Table 19. Parameters and determination coefficients of release profile from Mefenamic acid extended release liquisolid
compacts (F1-F12) and extended release tablet (ERT)
Formulation
code
Correlation Coefficient values (R2) Diffusion Exponent value (n)
Zero
order
First
order
Higuchi Korsemayer-peppas
F1 0.8366 0.9803 0.9678 0.971 0.4939
F2 0.8615 09741 0.9717 0.9636 0.5577
Pradeep Kumar CH. et al. / IJPDT / 3 (2), 2013, 80-96.
89 | P a g e
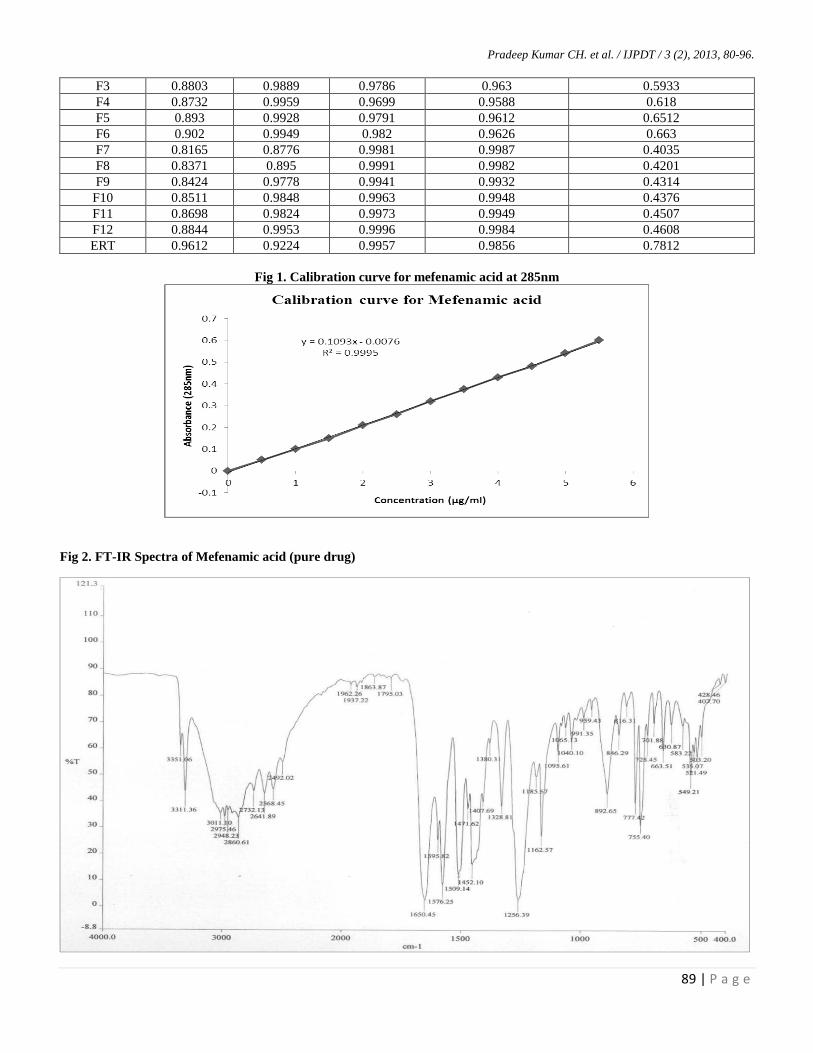
F3 0.8803 0.9889 0.9786 0.963 0.5933
F4 0.8732 0.9959 0.9699 0.9588 0.618
F5 0.893 0.9928 0.9791 0.9612 0.6512
F6 0.902 0.9949 0.982 0.9626 0.663
F7 0.8165 0.8776 0.9981 0.9987 0.4035
F8 0.8371 0.895 0.9991 0.9982 0.4201
F9 0.8424 0.9778 0.9941 0.9932 0.4314
F10 0.8511 0.9848 0.9963 0.9948 0.4376
F11 0.8698 0.9824 0.9973 0.9949 0.4507
F12 0.8844 0.9953 0.9996 0.9984 0.4608
ERT 0.9612 0.9224 0.9957 0.9856 0.7812
Fig 1. Calibration curve for mefenamic acid at 285nm
Fig 2. FT-IR Spectra of Mefenamic acid (pure drug)
Pradeep Kumar CH. et al. / IJPDT / 3 (2), 2013, 80-96.
90 | P a g e
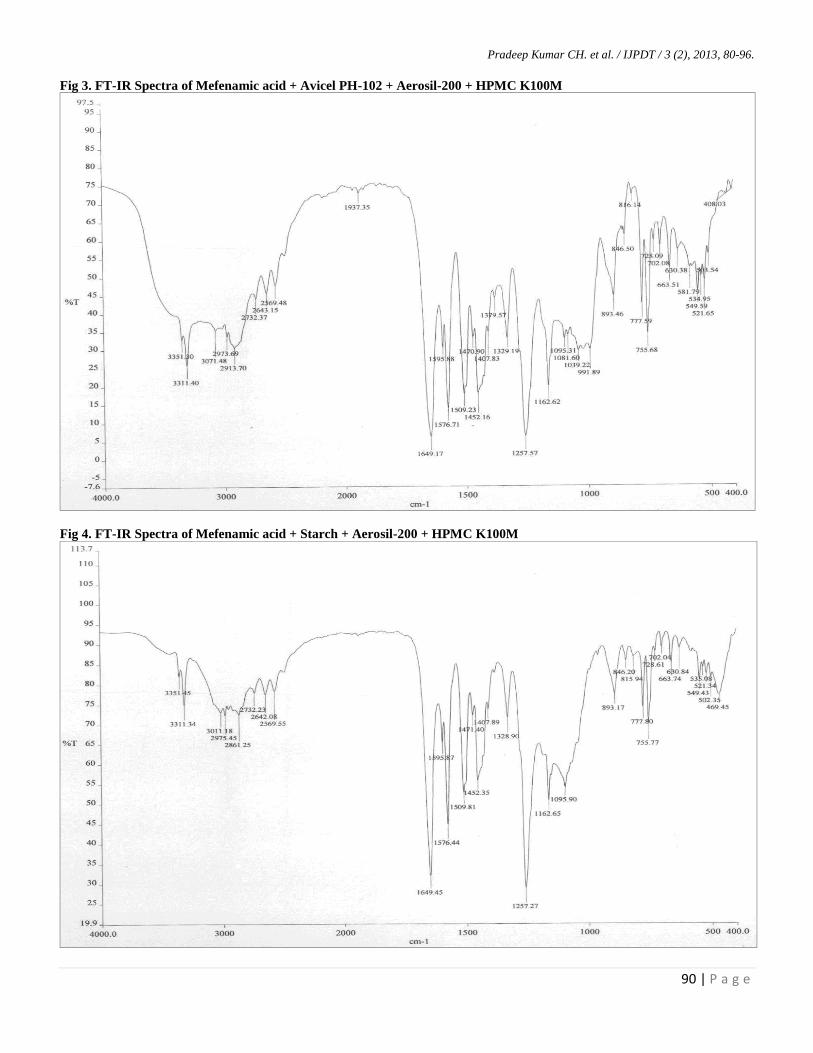
Fig 3. FT-IR Spectra of Mefenamic acid + Avicel PH-102 + Aerosil-200 + HPMC K100M
Fig 4. FT-IR Spectra of Mefenamic acid + Starch + Aerosil-200 + HPMC K100M
Pradeep Kumar CH. et al. / IJPDT / 3 (2), 2013, 80-96.
91 | P a g e
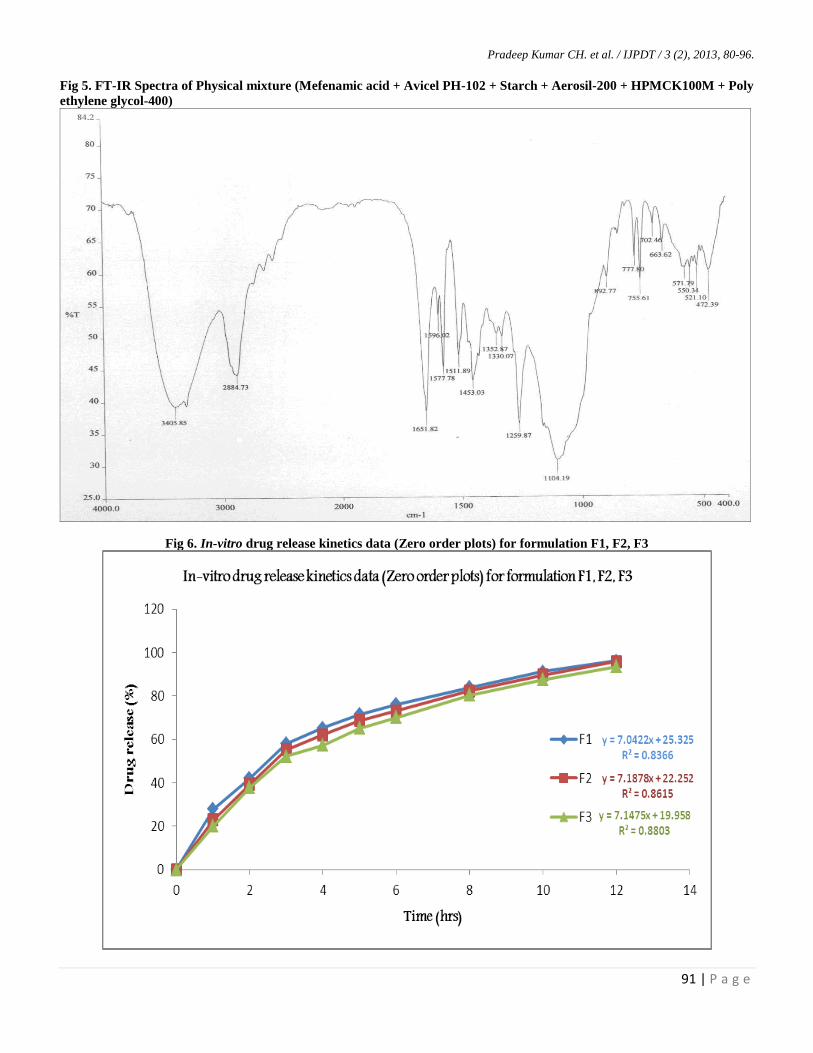
Fig 5. FT-IR Spectra of Physical mixture (Mefenamic acid + Avicel PH-102 + Starch + Aerosil-200 + HPMCK100M + Poly
ethylene glycol-400)
Fig 6. In-vitro drug release kinetics data (Zero order plots) for formulation F1, F2, F3

Pradeep Kumar CH. et al. / IJPDT / 3 (2), 2013, 80-96.
92 | P a g e
Fig 7. In-vitro drug release kinetics data (Zero order
plots) for formulation F4, F5, F6
Fig 8. In-vitro drug release kinetics data (Zero order
plots) for formulation F7, F8, F9
Fig 9. In-vitro drug release kinetics data (Zero order
plots) for formulation F10, F11, F12
Fig 10. In-vitro drug release kinetics data (First order
plots) for formulation F1, F2, F3
Fig 11. In-vitro drug release kinetics data (First order
plots) for formulation F4, F5, F6
Fig 12. In-vitro drug release kinetics data (First order
plots) for formulation F7, F8, F9
Pradeep Kumar CH. et al. / IJPDT / 3 (2), 2013, 80-96.
93 | P a g e
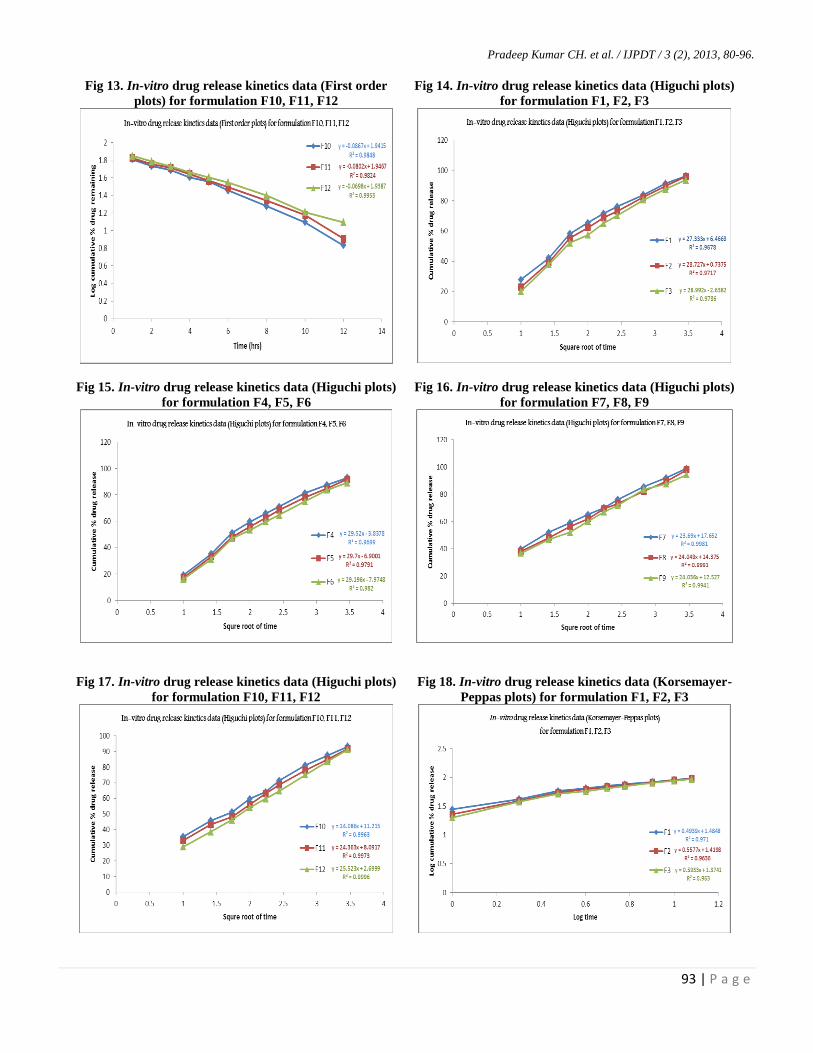
Fig 13. In-vitro drug release kinetics data (First order
plots) for formulation F10, F11, F12
Fig 14. In-vitro drug release kinetics data (Higuchi plots)
for formulation F1, F2, F3
Fig 15. In-vitro drug release kinetics data (Higuchi plots)
for formulation F4, F5, F6
Fig 16. In-vitro drug release kinetics data (Higuchi plots)
for formulation F7, F8, F9
Fig 17. In-vitro drug release kinetics data (Higuchi plots)
for formulation F10, F11, F12
Fig 18. In-vitro drug release kinetics data (Korsemayer-
Peppas plots) for formulation F1, F2, F3

Pradeep Kumar CH. et al. / IJPDT / 3 (2), 2013, 80-96.
94 | P a g e
Fig 19. In-vitro drug release kinetics data (Korsemayer-
Peppas plots) for formulation F4, F5, F6
Fig 20. In-vitro drug release kinetics data (Korsemayer-
Peppas plots) for formulation F7, F8, F9
Fig 21. In-vitro drug release kinetics data (Korsemayer-
Peppas plots) for formulation F10, F11, F12
Fig 22. Structure of mefenamic acid showing the group
responsible for the COX inhibiting activity
RESULTS
Application of new mathematical model for design of
liquisolid systems Mefenamic acid was selected as model drug for
this study as a suitable candidate for extended release.
Liquisolid hypothesis of Spireas et al., states that drug
candidate dissolved in liquid nonvolatile vehicle and
incorporated into carrier material having porous structure
and closely matted fibers in its interior, phenomenon of both
adsorption and absorption occurs. This concludes that drug
in the form of liquid medication is absorbed initially in the
interior of particles of carrier and after saturation of this
process it gets adsorbed into internal and external surfaces
of carrier. Coating materials such as Aerosil 200 which have
high adsorptivity and grater surface area lead the liquisolid
systems desirable flow properties [15].
Mathematical model equation for Avicel PH 102
and Aerosil 200 in poly ethylene glycol can be given
according to values of Phi (Φ) as given by Spireas et.al.
Lf= 0.16+3.31(1/R)
Based on this equation, Lf is calculated by using different R
values.
DISCUSSION
Fig-2 demonstrates the FT-IR spectra of pure drug
(Mefenamic acid) which shows characteristic peaks at
755.40, 1162.57, 1256.39, 1452.10-1595.82 and 1650.45
cm-1
represents C-H bending (Aromatic), O-H bending, C-O
stretching, C=C stretching (Aromatic), N-H bending along
with C-N stretching respectively. Among which C-H
bending (Aromatic), O-H bending, C-O stretching N-H
bending along with C-N stretching are responsible peaks for

Pradeep Kumar CH. et al. / IJPDT / 3 (2), 2013, 80-96.
95 | P a g e
the formation of acidic group (COOH) which was attached
to an aromatic ring of Mefenamic acid.
From the MOA of NSAID’s
(Anthranilates/Fenamates group) it was observed that the
acidic group (-COOH) attached to an aromatic ring was
responsible for the COX inhibiting activity of Mefenamic
acid.
Hence when fig-2 (pure drug-mefenamic acid) was
compared with fig-3, 4 and 5 (drug with mixture of
excipients) we can conclude that there is no characteristic
change in the above peaks represents there is no any
incompatibilities with the excipients utilized in the
formulation of liquisolid compacts, leads FT-IR results were
confirming there were no any chemical interactions between
the pure drug and physical mixtures.
Solubility of mefenamic acid in water, phosphate
buffer 7.4, propylene glycol, PEG-400, Glycerin, SLS and
Tween-80 was given in table-2. As shown in the table its
solubility was found to be very poor in water (0.208mg/ml).
In propylene glycol, the solubility of mefenamic acid was
found to be 0.218mg/ml, which is slightly greater than that
of water. This slight increase is probably through hydrogen
bonding. It was found that the solubility of mefenamic acid
was very high in PEG-400 (11.50mg/ml) compared with
other nonvolatile solvents. This increase in solubility is due
to the large non polar part and several hydroxyl groups in
PEG were responsible for the enhanced solubility. Thus,
among the solvents tested, PEG-400 could be a better choice
as a non-volatile solvent.
From the micromeritic properties it was observed
that mefenamic acid drug alone due to its amorphous nature
shows poor flow properties when compared to its physical
mixture which shows good flow properties and passable.
From the results of post-formulation parameters it
was concluded that there should be certain amount of
strength or hardness and resistance to friability for the
tablet, so that tablet should not break during handling.
However, it has also effect on drug dissolution. Average
hardness of liquisolid tablet ranges from 5.7±0.19 to
7.3±0.34 kg/cm2. Compactness of tablet may be due to
hydrogen bonding between Avicel PH 102 molecules. As
poly ethylene glycol is an alcoholic compound, it might
show hydrogen bonding due to presence of hydroxyl groups
and may contribute to compactness of compacts. Friability
studies of liquisolid compacts are in the range of 0.110 % to
0.210%. This indicates that acceptable resistance is shown
by liquisolid compacts to withstand handling.
In preparation of liquisolid compacts, liquid
medications containing drug were adsorbed on the surface
of carrier materials. When this system is exposed to the
dissolution medium, drug located onto the surface of
compacts dissolves fast and diffuses into dissolution
medium. This can be assumed to be the cause of the burst
release effect observed. The concentration of drug in liquid
medication is an important aspect as it affects drug release.
As it was proved previously, increase in drug concentration
in liquid medication, lower drug release rate would observe.
It was due to fact that at higher drug concentration, drug
tends to precipitate within silica (Aerosil 200) pores. At
higher amount of Aerosil 200 (Batch F12), drug release was
found to be retarded as compared to other batches. Increase
in concentration of HPMC K100M might be responsible to
get extended effect. This is reflected in batches F5, F6, and
F11, F12. However, normal extended release tablets showed
faster release as compared to liquisolid extended release
formulations. Liquisolid compacts containing Avicel PH
102 retards drug release compared to compacts containing
starch as carrier due to high wettability nature of Avicel.
Although model independent methods are simple
and easy to apply, they lack scientific justification. Hence
different model dependent approaches (Zero order, First
order, Higuchi, Korsemayer- Peppas plots) were performed
for dissolution profile comparison of all liquisolid compacts.
The results of these models indicate all liquisolid compacts
follow Peppas model as “best fit model”. This is due to
previously proved fact depending on R2
value obtained from
model fitting. From the results batches F6 and F12 showed
more release retarding effect. It is thus found that T50 %
value increases as concentration of HPMC K100M
increases. Korsemayer - Peppas release exponent (n) values
of all liquisolid compacts are greater than 0.45 indicating
non - Fickian diffusion.
CONCLUSION
From the results it was concluded that, percent
drug release was decreased with increase in the
concentrations of HPMCK100M. The 12 hour drug release
profile may improve patient compliance with the usage of
carrier and coating materials along with drug retarding
polymer, such that the drug release reduces in the gastric pH
and increases when reaches to the intestinal pH which leads
to decreased gastric cavity disorders and also the total
amount of drug was completely dissolved in to PEG which
was further completely available to the intestinal medium
after passage through GIT which was not observed in non-
liquisolid extended release tablets, because the drug in
conventional dosage form was not in completely dissolved
form hence causes gastric irritation.
Based on the in-vitro drug release studies, the data
were fitted into different kinetic models shows zero order
release pattern followed by non-fickian transport
mechanism. Drug release profiles on model fitting follow
Peppas model as best fit model which indicates drug
diffusion in hydrated matrix and polymer relaxation. Among
the models used for dissolution profile comparison, it was
concluded that model independent methods were found to
be very simple, but discrimination between dissolution
profiles can be found using model dependent approach.
Pradeep Kumar CH. et al. / IJPDT / 3 (2), 2013, 80-96.
96 | P a g e
REFERENCES
1. Thakur N, Khokra SL, Sharma D, Thakur NS, Purohit R and Arya V. A review on pharmaceutical applications of liquisolid
technique. Amer J Pharmatech Res, 1(3), 2011, 1-18.
2. Baby DA, Saroj S and Sabitha M. Mechanism of solubility of liquisolid formulation in non volatile solvent: A Review. Int J
Pharm Pharm Sci, 4(3), 2012, 710-715.
3. Meer TA, Sav A. Solubility Enhancement of Carvidilol using Liquisolid Compact Technique. Journal of Applied Pharmacy,
1(4), 2012, 531-537.
4. Gubbi S, Jarag R. Liquisolid Technique for Enhancement of Dissolution Properties of Bromhexine Hydrochloride. Research
Journal of Pharmacy and Technology, 2(2), 2009, 382-386.
5. Akinlade B, Elkordy AA. Liquisolid Systems to Improve the Dissolution of Furosemide. Scientia Pharmaceutica, 78, 2010,
325-344.
6. Javadzadeh Y, Ali N. Liquisolid Technique for Dissolution Rate Enhancement of a High Dose Water-Insoluble Drug
(Carbamazepine). International Journal of Pharmaceutics, 341, 2007, 26–34.
7. Karmarkar AB, Gonjari ID. Dissolution Rate Enhancement of Fenifibrate using Liquisolid Tablet Technique. Latin American
Journal of Pharmacy, 28(2), 2009, 219-225.
8. Yadav VB, Yadav AV. Improvement of Solubility and Dissolution of Indomethacin by Liquisolid and Compaction
Granulation Technique. Journal of Pharmacy Science & Research, 1(2), 2009, 44-51.
9. Yadav AV, Shete AS. Formulation and Evaluation of Orodispersible Liquisolid Compacts of Aceclofenac. Indian Journal of
Pharmacy Education and Research, 44(3), 2010, 227-235.
10. Nagabandi V, Tadikonda R. Formulation Development and Evaluation of Liquisolid Systems to Improve the Dissolution
Rate of Ketoprofen. International Journal of Biomedical Research, 2(10), 2011, 530-541.
11. Nokhodchi A, Aliakbar R. Liquisolid Compacts: The Effect of Co solvent and HPMC on Theophylline Release. Journal of
Colloid Surface Study, 79, 2010, 262-269.
12. Javadzadeh Y, Musaalrezaei. Liquisolid Technique as a New Approach to Sustain Propranolol Hydrochloride Release from
Tablet Matrices. International Journal of Pharmaceutics, 362, 2008, 102-108.
13. Kasture SV, Gondkar SB. Enhancement of Dissolution Rate of Lansoprazole Using Liquisolid Tablet Technique.
International Journal of Pharmaceutical Research, 3(2), 2011, 27-31.
14. Boghra R, Patel A. Formulation and Evaluation of Irbesartan Liquisolid Tablets. International Journal of Pharma Science
Review and Research, 9(2), 2011, 32-36.
15. Ganesh NS, Deecaraman. Formulation and Evaluation of Sustained Release Lornoxicam by Liquisolid Technique.
International Journal of Pharmacy Science Review and Research, 11(1), 2011, 53-57.
16. Burra S, Kudikala S. Formulation and Evaluation of Simvastatin Liquisolid Tablets. Der Pharmacia letter, 3(2), 2011, 419-
426.
17. Gonjari ID, Karmakar AB. Evaluation of In vitro Dissolution Profile Comparison Methods of Sustained Release Tramadol
Hydrochloride Liquisolid Compact Formulations with Marketed Sustained Release Tablets. Drug Discoveries &
Therapeutics, 2010, 4(1), 26-32.
18. Karmarkar AB. Effect of Ceolus KG-802 on the Dissolution Rate of Fenofibrate Liquisolid Tablets: Preformulation and
Formulation Development Studies. Drug Discoveries & Therapeutics, 4(6), 2010, 493-498.
19. Spiras S, Bolton SM. Liquisolid systems and methods for preparing same, United States patent 5,968,550, 1999.
20. Grover R, Spireas S, Wang T. Effect of powder substrate on the dissolution properties of Methchrothiazide liquisolid
compacts. Drug Dev Ind Pharm, 25, 1999, 163-168.
21. Furer R, Geiger M. A simple method of determining the aqueous solubility of organic substances. J Pharm Sci, 8(4), 1976,
337-344.
22. Spiras S. Liquisolid systems and methods for preparing same, United States patent 6, 423, 339 BI, 2002.
23. Spiras S, Bolton SM. Liquisolid systems and methods for preparing same, United States patent 6,096,337, 2000.
24. Spiro S, Srinivas S. Enhancement of Prednisolone dissolution properties using liquisolid compacts. Int J Pharm, 166, 1998,
177-188.
25. Li XS, Wang JX, Shen ZG et al., Preparation of uniform Prednisolone micro crystals by a controlled micro precipitation
method. Int J Pharm, 342, 2007, 26-32.
26. Liao CC, Jarowski CI. Dissolution rates of corticoid solutions dispersed on silicas. J Pharm Sci, 73, 1984, 401-403.
27. Subhramanyam CVS. Textbook of Physical Pharmaceutics, 2nd
ed, Vallabh Prakashan, New Delhi, 2001, 205-219.
28. Martin. Physical Pharmacy. 2, 2003, 286.
29. Brahmankar DM, Jaishwal SB. Biopharmaceutics and Pharmacokinetics a Trease, Vallabh Prakashan, Delhi. 1, 1995, 335.