pradigm shift in trading
DESCRIPTION
New trading paradigm.TRANSCRIPT

The Paradigm Shift(a new way to think about trading)
The Paradigm Shift - new rules to trading
** Perry Kuafman (2013) Trading Systems and Methods, fifth edition
*Tharp, Van (2008). Van Tharp's Definitive Guide to Position Sizing. International Institute of Trade Mastery, Inc.
1. Losses are more important than gains. Think of it this way, if you have a MDD of 50% say $100,000.00 to $50,000.00 what percent return will it take to get you back to even? 50%, nope if you have a 50% return on the 50,000.00 you will only have $75,000.00 account and a 25% loss. If you lose 50% it will take 100% just to break even. Point is KEEP YOUR LOSES SMALL and think risk before you think return.
"New traders focus on how much money they can make, whereas, veteran traders focus on how much money they can lose."
2. Design some core objectives for your trading.* Those objectives are two fold. what you would like to make and second The point at which you stop trading. once you have established those objectives you can use position sizing to meet those objectives. Testing should be the process of validating your ideas.
3. Start thinking in terms of probabilities. No system is going to be correct 100% of the time. There will be losers and that is ok. Try to avoid the need to be right all the time. Instead think in terms of statistics and the probability of success or failure and manage a traders "Risk of Ruin" .
4. Know your exit condition and initial risk in advance * Initial Risk is The point at which you will get out of the position to preserve your capital. This point is your initial stop loss and it establishes your initial risk.
5. Define your profits and losses of your System as some ratio of your initial risk*. Dr. Tharp calls these R-multiples. If you risk $100 and you make $200 you have a 2 R gain. if you risk $100 and you lose $150 then you nave a 1.5 R loss.
6. Only risk a small amount of total capital on any one trade.** The total amount risked should allow you to comfortably survive a number of losses in a row. No trade should ever risk more than 5% of the invested capital.
7. Limit your losses to 1 R or less*. If you set your initial stop level and Then change it because you don't want to realize a loss, your in trouble. this is now you create 4 R losses.
8. Exit a trade quickly.** Exit a trade as soon as you recognize that is has gone wrong. Don't try and manage the loss. Many floor traders believe that the smartest trader is the first one out.
9. Make sure your profits, on average are greater than 1R*. Even if your system is wrong 80% of the time, you can still be profitable if your wins are large enough.
10. Be consistent with your trading philosophy.** If you are a trend follower, then keep losses small and let your profits run. You cannot be a trend follower by taking profits whenever they occur.
11. Don't meet margin calls.** Experienced traders believe that a margin call is an objective statement of a trade gone wrong, or a system that is not meeting expectations. It is time to review trading performance rather that invest more.
12. Liquidate your worst position first when lightening up.** The profitable trades have proved that they are trending or performing properly; the losing ones have proved they are not. Stay with the good positions and liquidate the worst.
13. Understand your trading system in terms of The mean (average R) and the standard deviation of your R multiples*. The trading results can be expressed as a multiple of your initial risk, or a set of R-multiples.
14. Calculate your t-score to give You some idea of how to meet your objectives. Generally, the better t-Score, the easier it is to use position sizing to meet your objectives. "Your statistical Edge"
15. Practice proper position sizing in order to meet your objectives*. This answers the magic question of now much I should invest.
16. Follow your system precisely. deviating from the system will only skew the results making the probability of success and failure a shot in the dark. The next trade that you skip might be the trade that you need to be profitable.
17. The Holy Grail of trading is risk management. There is no trading signal that is known to exist that is good enough to be considered to be the fabled holy grail system. The real holy grail to trading is proper risk management too avoid ruin and keep you trading.
Aaron Soderstrom
The Paradigm Shift(a new way to think about trading)
Where to start? (Define the Objective)
Work Cited:
Tharp, Van (2008). Van Tharp's Definitive Guide to Position Sizing. International Institute of Trade Mastery, Inc.
Holy grail system
t-Score(SQN)
Less than 1.00
1.01 to 2.00
2.01 to 3.00
3.01 to 5.00
5.01 to 7.00
7.00 +
System Rating
Probably very hard to trade
Average system (critical t value)
Good system (minimum 2.5 to trade)
Excellent system
Superb system (few exist)
So, assuming that I am correct and the Holy Grail of trading is the statically edge one receives by controlling there probability of ruin vs. there probability of success, where does one start? First in order to know the probability of success and ruin, both success and ruin needs to be defined.
Success is the amount on profit one is happy with for the amount of money that is at risk. Ruin is the point at which you would turn off the system. For example: I would happy risking 30% of the portfolio is I had a high probability of reaching a 90% return. This is my risk to reward ratio; a profit to drown down ratio of 3 to 1.
However, there is no right answer to this question; it all depends on the trader/clients own risk to reward tolerance. Be realistic when defining this objective, a 10 to 1 ratio is unrealistic. The timeframe on how to measure the risk to reward also needs to be defined. I prefer to take time out of the equation and measure the time-frame by number of trades. My time-frame is 1,000 trades. Avoid having a small number of trades, lower calculations in statics causes a sampling error. Sampling errors will cause false expectations and probabilities. If the trading system trades long-term charts (daily/weekly) make sure to have at minimum 100 trade objective.
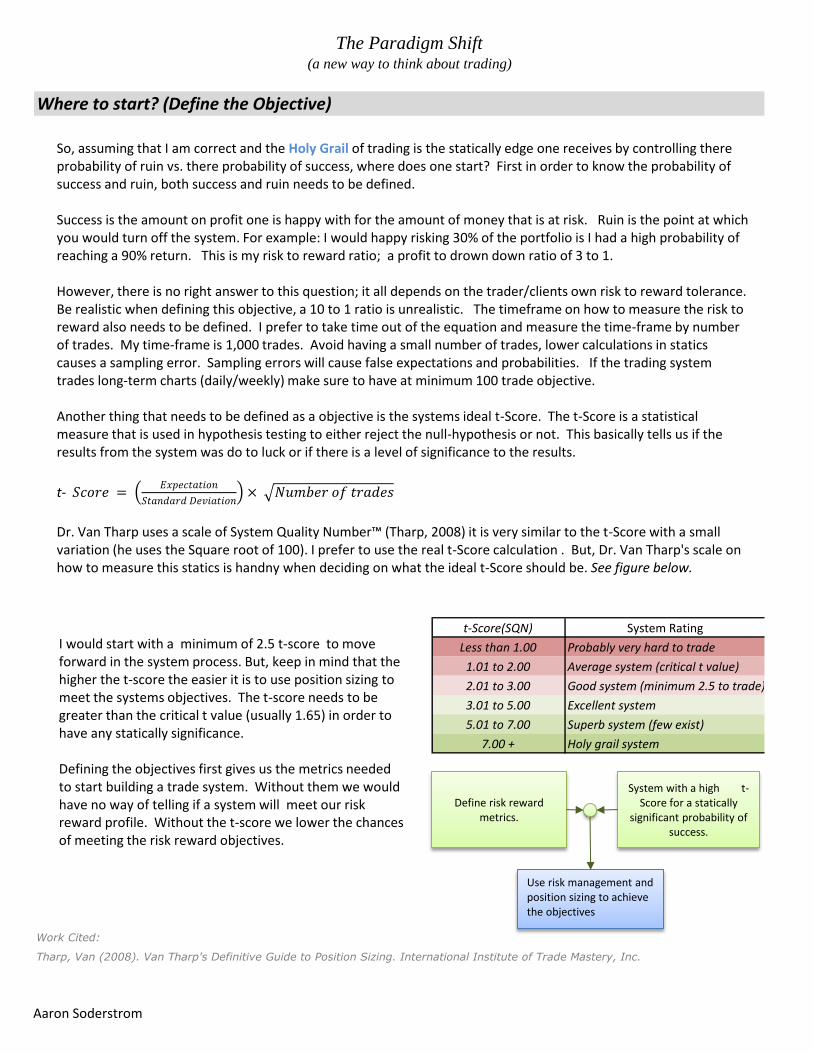
Another thing that needs to be defined as a objective is the systems ideal t-Score. The t-Score is a statistical measure that is used in hypothesis testing to either reject the null-hypothesis or not. This basically tells us if the results from the system was do to luck or if there is a level of significance to the results.
t- 𝑆𝑐𝑜𝑟𝑒 =𝐸𝑥𝑝𝑒𝑐𝑡𝑎𝑡𝑖𝑜𝑛
𝑆𝑡𝑎𝑛𝑑𝑎𝑟𝑑 𝐷𝑒𝑣𝑖𝑎𝑡𝑖𝑜𝑛× 𝑁𝑢𝑚𝑏𝑒𝑟 𝑜𝑓 𝑡𝑟𝑎𝑑𝑒𝑠
Dr. Van Tharp uses a scale of System Quality Number™ (Tharp, 2008) it is very similar to the t-Score with a small variation (he uses the Square root of 100). I prefer to use the real t-Score calculation . But, Dr. Van Tharp's scale on how to measure this statics is handny when deciding on what the ideal t-Score should be. See figure below.
I would start with a minimum of 2.5 t-score to move forward in the system process. But, keep in mind that the higher the t-score the easier it is to use position sizing to meet the systems objectives. The t-score needs to be greater than the critical t value (usually 1.65) in order to have any statically significance.
Defining the objectives first gives us the metrics needed to start building a trade system. Without them we would have no way of telling if a system will meet our risk reward profile. Without the t-score we lower the chances of meeting the risk reward objectives.
Define risk reward metrics.
System with a high t-Score for a statically
significant probability of success.
Use risk management and position sizing to achievethe objectives
Aaron Soderstrom

The Paradigm Shift(a new way to think about trading)
What are R-Multiples?
R is simply the dollar risk per trade. It's nothing but a reward to risk ratio defined by the entry price and the initial stop.
If the initial stop was $500.00 dollar loss and the trade breakeven the R would be 0R. If you hit the stop the R would be -1R and if you make $1,000.00 then R would be 2R.
R-Multiples where designed by Dr. Van Tharp in his book "Trade Your Way to Financial Freedom". From there it has hit a grass root campaign across the trading communities. In the trading systems that we design R-Multiples holds a vital role in our analysis because of there scalability. If one system is trading $100,000 and the other One Million, how would you compare a trade that made $10,000 from one system and the other? If it was defined in R-Multiples than it is easily converted.
Many of the concepts that are in Van Tharp's process are incorporated in our trading systems. If you have not read the book and are serous about trading, the book is a must read. Dr. Van Tharp also teaches a trading course and it is the only trading course that we recommend.
2R
A good understanding or R-Multiples is needed before moving on.
Aaron Soderstrom

The Paradigm Shift(a new way to think about trading)
R-Multiples - "The Paradigm Shift"
R-Multiples are so critical in testing and developing a trading system because it adds a key factor to the success of applying a trading system; scalability. For example when a traditional tradert looks at statistics of a trading system they would look at dollars gained and lost then percentages such as percent win and percent loss. They rely on ratios such as profit factors to see scalability or how would this account act on a smaller account or a large account. R-multiples adds the scalability from the start so instead of comparing ratios one can look directly at the trade.
Assuming a trader risks 1% per trade (fixed fractional risk management) using R-Multiples the system has an average R of .50 a trade. Then after 200 trades the system is expected to make 100%. This would be hard to measure is you are doing the same math on a traditional system. If the system averages $5000.00 a trade how many trades to make a 100%? You can't answer that because you need more information the account value. But what is one client is investing 500,000.00 and the other is investing 5 Million?
Using R-Multiples the system now has scalability.
When building a trade system I focus mainly on three numbers. The average R-multiple, standard deviation of R, and the t-score. I am not that nieve to assume only three numbers, but focusing on these will be the basis of my design. Other statiscs will be used to explain the system beyond those three numbers.
Mean(μ)
R-Multiples
Standard deviation (σ)
of R
Calculate t-Score
Position Sizing Algorithm
Meet Objectives
"Keep your losses small and let your
profits run" - Dr. Van Tharp
Aaron Soderstrom