prairie state generating company
TRANSCRIPT

Prairie State Generating
Company Next Generation of Coal
1

The Campus
2

The Energy Campus
• Power Plant and Coal Mine on same campus
• Best Available Control Technology allows for use of Illinois Basin Coal
• Nearly 7 Million Tons of Coal Mined Annually to fuel 1,600 megawatt Power Plant
• Largest coal power plant built in the U.S. since 1982
• 4,000 construction jobs at peak; more than 500 permanent jobs
3

4
Prairie State’s Owners Serve More
Than 2.5 Million People In Eight States
AMP
368 MW
Indiana Municipal Power
200 MW
Missouri Joint Municipal
Electric Utility Commission
195 MW
Prairie Power, Inc.
130 MW
Illinois Municipal Electric
240 MW
Southern Illinois
Power Cooperative
125 MW
Northern Illinois Municipal
Power 120 MW
Kentucky Municipal Power
124 MW

Lively Grove Mine
5
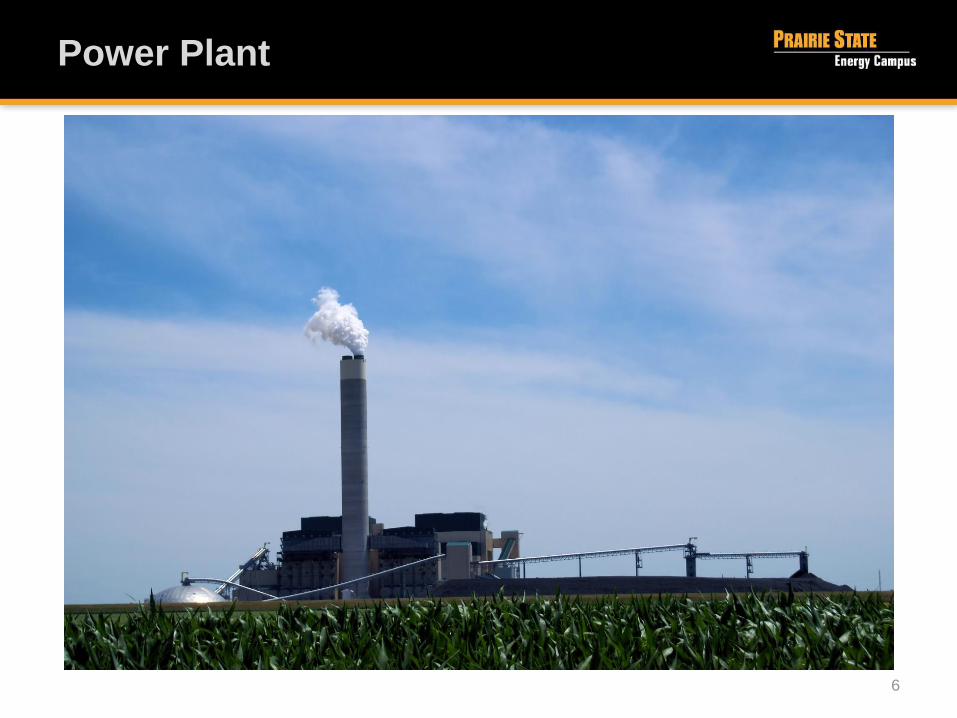
Power Plant
6

The Prairie State Environmental Difference
7

• Super Critical Technology
• Runs at a higher temperature and pressure
• Less coal needed = Less CO2
• Without accounting for $1 billion investment in air quality control system, produces 15 percent less CO2 than the typical U.S. coal plant
• Mine mouth design completely eliminates CO2 emissions associated with coal transportation
How Prairie State Reduces CO2
8

Why Coal? Why now?
9

Electricity Enables People to Live
Longer and Better
United Nations Links Affordable Energy to Quality of Life
*CIA World Fact Book 2009, U.N.’s Development Program’s Human Development Report, 2009
10

Low-Cost Electricity from Coal
*Energy Information Administration, February 2012 11

Decades of Declines:
Lowest Income Pay Price for Inaction
*American Coalition for Clean Coal Electricity, “Energy Cost Burdens on American Families,” Trisko, 2010. 12

Second Act for Illinois Coal
• 300-year history in the
state
• 65 percent of the state’s
geography
• 38 Billion Metric Tons of
coal
• More BTUs than foreign
oil supplies
• High energy producing
10,000 – 14,000 BTUs/lb
13
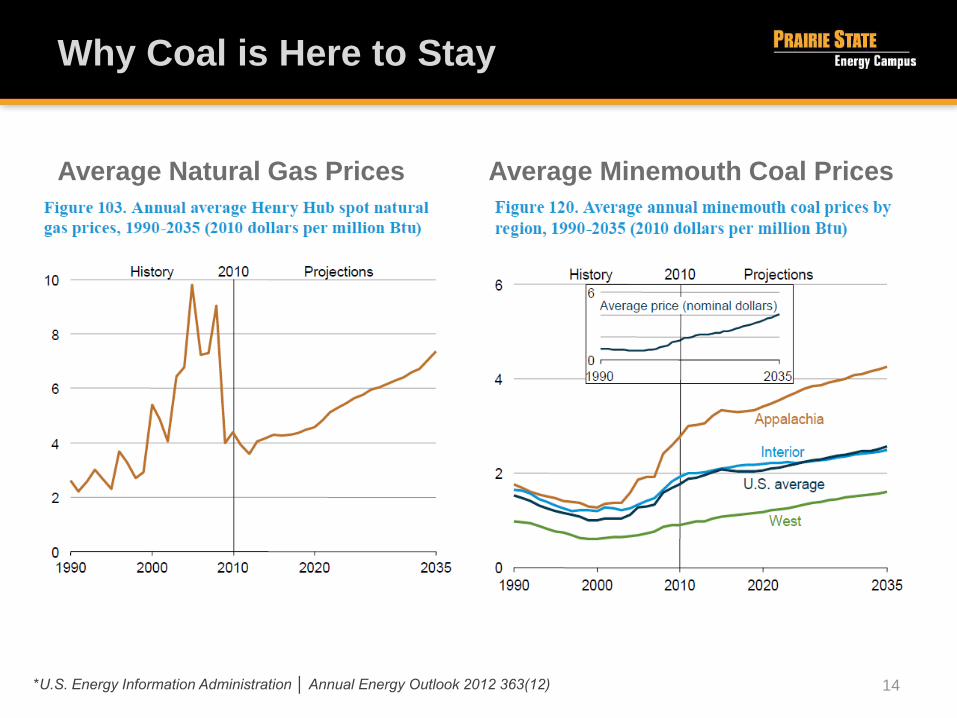
Why Coal is Here to Stay
*U.S. Energy Information Administration │ Annual Energy Outlook 2012 363(12)
Average Natural Gas Prices Average Minemouth Coal Prices
14

Prairie State’s Economics
• Base load, responsible,
reliable power for its
Owners at low $50’s per
Megawatt Hour
• Midwestern Megawatt
Hour Prices = $200 -
$2,500 during summer
months
• PSGC’s coal cost is
very stable
• Availability = Demand
$0.00
$1.00
$2.00
$3.00
$4.00
$5.00
$6.00
$7.00
2011 2015 2020 2030
Natural Gas Coal PSGC Coal
15

Prioritize Energy Reduction Opportunities (TBL)
$-
$50
$100
$150
$200
$250
$300
$350
$400
$450
$500
$0.00
$10.00
$20.00
$30.00
$40.00
$50.00
$60.00
$70.00
$80.00
$90.00
$100.00
Illin
ois
Fo
rwar
d C
apac
ity
Pri
ces
(201
2$/k
W/Y
ear)
Illin
ois
Fo
rwar
d E
ner
gy P
rice
(201
2$/M
Wh
)
Comparison of MISO - Illinois Forward Energy and Capacity Prices
2008 Forward Capacity Price ($/kW/Year)
2012 Forward Capacity Price ($/kW/Year)
2008 Forward ($/MWh)
2012 Forward ($/MWh)
Increase due to assumed GHG Pricing
Comparison of MISO Forecasts
16

Prioritize Energy Reduction Opportunities (TBL)
$0.00
$20.00
$40.00
$60.00
$80.00
$100.00
$120.00
$140.00
2013 2014 2015 2016 2017 2018 2019 2020 2021 2022 2023 2024 2025 2026 2027 2028 2029 2030 2031 2032 2033 2034 2035
Ener
gy P
rocu
rem
ent C
ost
(201
2$/M
Wh
)Comparison of Energy Procurement Cost - Prairie State vs. Market
(Assumes Customer with 60% Load Factor)
Market Cost at 60% Load Factor ($/MWh)
Prairie State Cost at 60% Load Factor ($/MWh)
Levelized CostPrairie State: $60.75/MWhMarket Purchases: $63.03/MWh
Energy Procurement Cost Comparison
17

Clean Coal Technology, A Success Story
*EPA’s Clean Air Markets database, July 2011; Project Permits, FutureGen Environmental Impact Study, November 2007 18

Questions?
19