p.ramesh babu doctorial thesis- 7036 -...
TRANSCRIPT

CHAPTER-IV
Experimental Setup and Experimentation

CHAPTER- IV
EXPERIMENTAL SET UP AND EXPERIMENTATION
Direct Injection Diesel engine available in the engines laboratory of Department
of Marine Engineering, Andhra University is utilized for the experimentation. Four blends
of diethyl ether in Mahua Methyl Ester (MME) were tested, namely, 3%, 5%, 10%, and
15% by volume additive Diethyl ether (DEE) is added to bio-diesel (MME). The crank
case oil dilution is regularly tested to verify the extent of contamination. Experimentation
is carried out at various engine loads (Engine Loading device is eddy current
dynamometer) to record the cylinder pressure and finally to compute heat release rates
with respect to the crank-angle. Engine performance data is acquired to study the
performance along with the engine cylinder vibration and engine pollution parameters.
Engine cylinder vibration in FFT form is monitored at each load and for each fuel
combination simultaneously to compare the cylinder excitation frequencies with the base
line frequencies using diesel oil. Time wave forms on the cylinder head are also recorded
to analyze the combustion. Since the very combustion in the cylinder is the basic exciter,
the vibration study of the engine cylinder through the measured FFT spectra and time
waveforms are the representatives of combustion propensity. The smoke values in HSU,
the exhaust gas temperatures and exhaust gas analysis of different components of exhaust
are measured and compared.
4.1 Experimental Setup
The experimental setup consists of the following equipment:
1.Single cylinder DI-diesel engine loaded with eddy current dynamometer
2.Engine Data Logger
3.Exhaust gas Analyzer
4.Smoke Analyzer
5.Vibration Analyzer
The schematic diagram (Figure 4.1) represents the instrumentation set up for the
experiment. The Piezo electric transducer is fixed (flush in type) to the cylinder body
(with water cooling adaptor) to record the pressure variations in the combustion chamber.
Crank angle is measured using crank angle encoder. Exact TDC position is identified by
the valve timing diagram and fixed with a sleek mark on the fly wheel and the same is

used as a reference point for the encoder to with respect to which the signals of crank
angle will be transmitted to the data logger. The data logger synthesizes the two signals
and final data is presented in the form of a graph on the computer using C7112 software.
Vibration accelerometer is mounted on the cylinder head, preferably on the bolt
connecting to head and cylinder to record the engine vibrations using DC-11 data logger
which directly gives spectral data in the form of FFT, the overall vibration levels. This
FFT data recorded is collected by On-Time window based software designed by e-predict
Inc., Argentina. The time waveforms are obtained on the cylinder head by DC-11 in OFF-
ROUT mode and are presented in graphic form by Vast-an doss based software, designed
by VAST, Inc., Russia.
Figure 4.1 Schematic diagram of Data Integration circuit taking data from the encoder and pressure transducer
Piezo
sensor
3
2
8
7
6
1
2
3
4
5
6
8
1
2
3
RS232
C
2
3
5
PIEZO
1
CA
1
2
3
1
2
3
9 P
in D
-Typ
e
25 Pin D-
Type
3 core
shielded
(M) RS232C
(F)
Engine
Indicator
Piezo BNC
Conn.
Encoder
Encoder
Yellow
Green
Black
Red
Black
Encoder (M)
9 pin D-type
Shielded
3 mt. cable

4.1.1 Direct injection (DI) Diesel Engine
The DI diesel engine (make Kirloskar company, Pune) is used for conducting the
experimentation. The details of the engine are given in Table 4.1 below.
Table 4.1 Specifications of the DI- Diesel Engine
Model AV1, kirloskar make
Rated Horse power: 5 hp (3.73 kW)
Rated Speed: 1500rpm
No of Strokes: 4
Mode of Injection and injection
pressure
Direct Injection, 200 kg/cm2
No of Cylinders: 1
Stroke 110 mm
Bore 80 mm
Compression ratio 16.5
4.1.2 Engine Loading System:
Engine is loaded with eddy current dynamometer and a spring balance as shown in
Figure 4.4. The load on the engine can be changed with the dynamometer control panel
shown in Figure 4.5. Full load on the engine is equal to 40 kg on the spring balance.
This dynamometer is popular for its stable and consistent readings even in the case of
minor variation in engine speed and engine vibration. To accommodate the crank angle
encoder, the dynamometer is fixed in parallel to the engine with a belt drive coupled to
the engine as shown in Figure 4.4.

Figure 4.2 Schematic arrangements of the engine test bed, Instrumentation and data logging system.
Figure 4.3 Experimental Set up
EGT
Fuel Tank
(MME+DEE)
Crank Angle Encoder
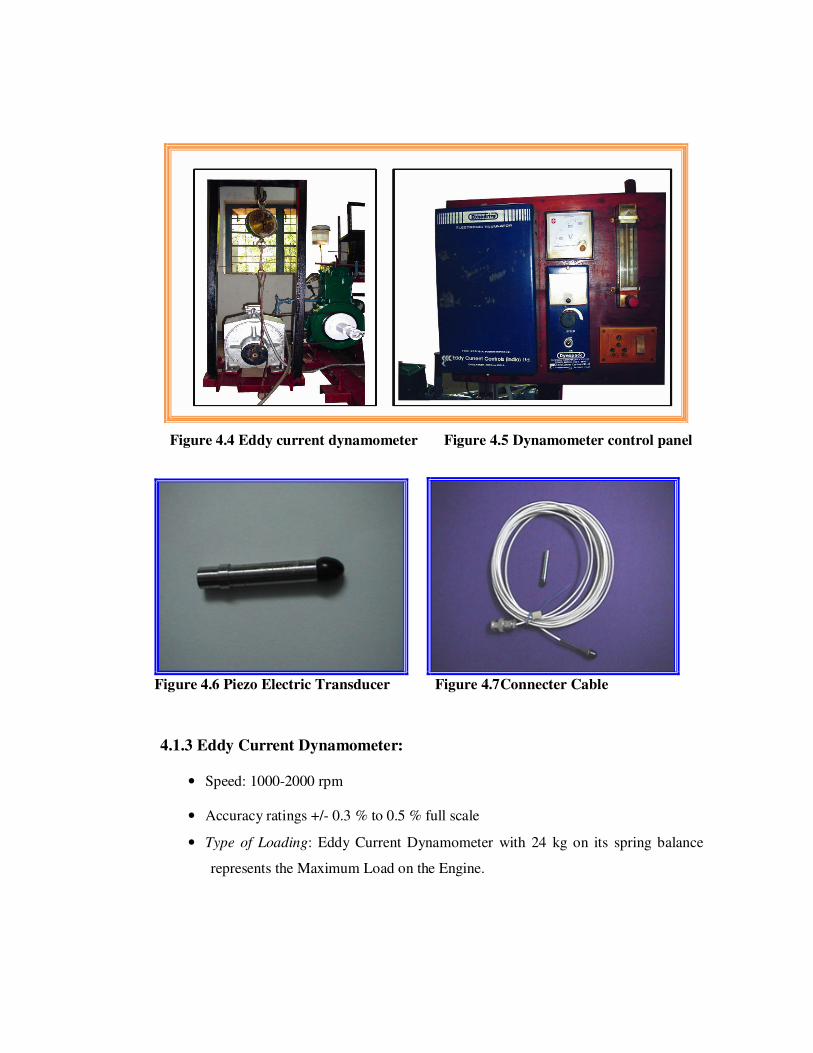
Figure 4.4 Eddy current dynamometer Figure 4.5 Dynamometer control panel
Figure 4.6 Piezo Electric Transducer Figure 4.7Connecter Cable
4.1.3 Eddy Current Dynamometer:
• Speed: 1000-2000 rpm
• Accuracy ratings +/- 0.3 % to 0.5 % full scale
• Type of Loading: Eddy Current Dynamometer with 24 kg on its spring balance
represents the Maximum Load on the Engine.
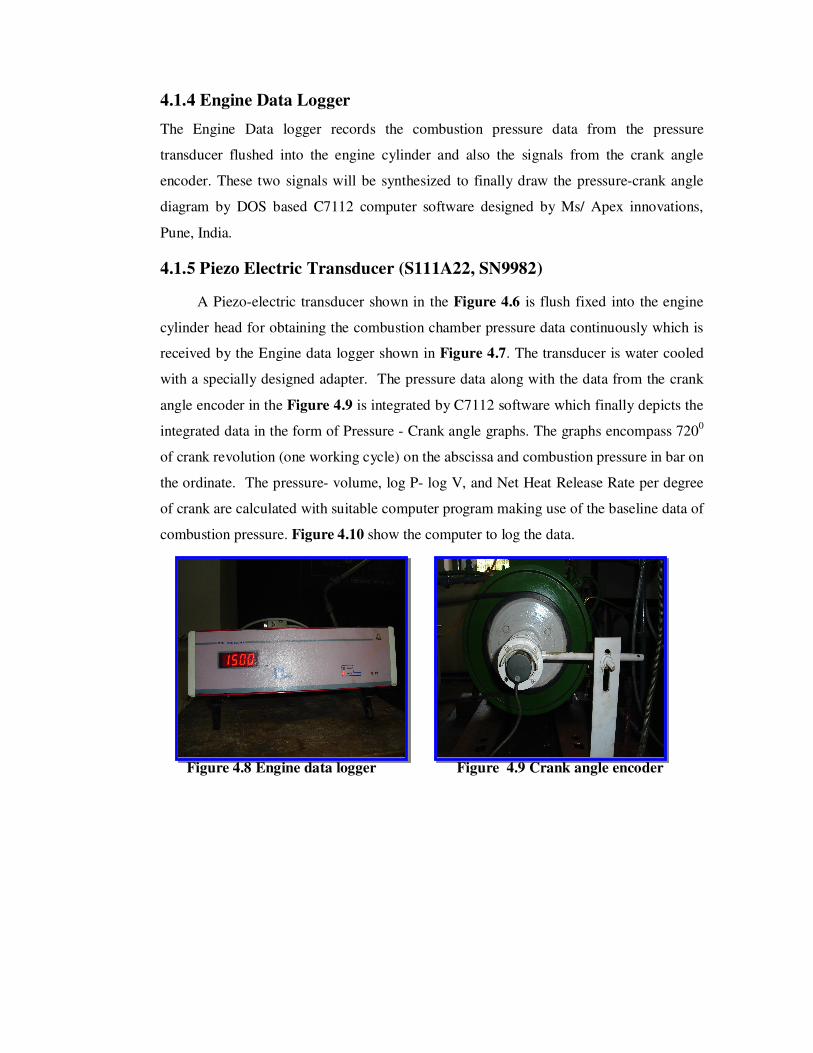
4.1.4 Engine Data Logger
The Engine Data logger records the combustion pressure data from the pressure
transducer flushed into the engine cylinder and also the signals from the crank angle
encoder. These two signals will be synthesized to finally draw the pressure-crank angle
diagram by DOS based C7112 computer software designed by Ms/ Apex innovations,
Pune, India.
4.1.5 Piezo Electric Transducer (S111A22, SN9982)
A Piezo-electric transducer shown in the Figure 4.6 is flush fixed into the engine
cylinder head for obtaining the combustion chamber pressure data continuously which is
received by the Engine data logger shown in Figure 4.7. The transducer is water cooled
with a specially designed adapter. The pressure data along with the data from the crank
angle encoder in the Figure 4.9 is integrated by C7112 software which finally depicts the
integrated data in the form of Pressure - Crank angle graphs. The graphs encompass 7200
of crank revolution (one working cycle) on the abscissa and combustion pressure in bar on
the ordinate. The pressure- volume, log P- log V, and Net Heat Release Rate per degree
of crank are calculated with suitable computer program making use of the baseline data of
combustion pressure. Figure 4.10 show the computer to log the data.
Figure 4.8 Engine data logger Figure 4.9 Crank angle encoder

Figure 4.10 Computer to Log the data from the Engine data Logger
4.2 Exhaust Gas Analyzer (DELTA 1600- L,).
The DELTA 1600- L shown in the Figure 4.11(Make: M/S MRU GmbH
GERMANY) measures the exhaust emissions such as Carbon Monoxide (CO), Carbon
Dioxide (CO2), Hydro Carbon (HC), Oxygen (O2) and Nitric Oxide (NO) by means of
infrared measurement. These five gases of analysis is processed by integrated micro
processor quantitatively and shown in the display panel. At the end of a measurement, the
measured values, the date and time can be documented by an integrated printer. This
instrument is calibrated with propane gas at regular intervals after usage.
Figure 4.11 Delta 1600-L Exhaust Gas Analyzer

4.2.1 Technical Specifications 4.2.1.1 Measuring ranges and Calibration values Table 4.2 Measuring ranges and calibration values of Delta 1600-L
Carbon Monoxide 0-1500 % volume
Carbon Dioxide 0-200 % volume
Hydro Carbon 0-20000 ppm (n-hexane)
Nitric Oxide 0-2000 ppm
Excess Air Calculated according to
Brettschneider
Temperature -40 oC to 650 oC
Rounds per minute 400……10000 U/min
4.2.1.2 Precision
Table 4.3 Precision levels achievable by Delta 1600-L
Carbon Monoxide ± 0.06 %
Carbon Dioxide 0.5 %
Hydro Carbon ± 12 ppm
Nitric Oxide ± 5 ppm
Temperature ± 1 % (T < 150 oC
)
± 2 % (T < 250 oC
)
± 3 % (T > 350 oC
)
Rounds per minute ± 1 %
4.2.1.3 Resolution
Table 4.4 Resolution provided by Delta 1600-L
Carbon Monoxide 0.01 %
Carbon Dioxide 0.1%
Hydro Carbon 1 ppm
Nitric Oxide 1 ppm
Temperature 0.1 oC
Rounds per minute 1 U/min (< 6000)
10 U/min (> 6000)

4.2.1.4 Features
� Continuous emission analysis
� Illuminated and graphical LCD display
� High accuracy and performance through 16- bit microprocessor
� Serial interface RS 232
� Response time 15 seconds
4.3Smoke Density Tester (Diesel Tune 114)
This meter mainly contains the following elements as shown in [Figures 4.12 & 4.13].
Exhaust gas pipe with holder, exhaust probe, and pump unit, calibration paper, white filter
paper disc and filter paper holder.
4.4.1. Features
Voltage: 4.5 V- (dry cell battery)
Range: 0-10 FSN unit
On- Load testing
Figure 4.12 Diesel Tune Smoke Analyzer Figure 4.13 Exhaust suction gun to Collect gas Sample
4.4 Vibration Analyzer Equipment
The DC-11 FFT analyzer [Figure 4.14] made by DPL group Canada is a digital
spectrum analyzer and data collector specifically designed for machine condition
monitoring, advanced bearing fault detection and measurement diagnostics. The following
are the measurements that can be made by the instrument DC-11
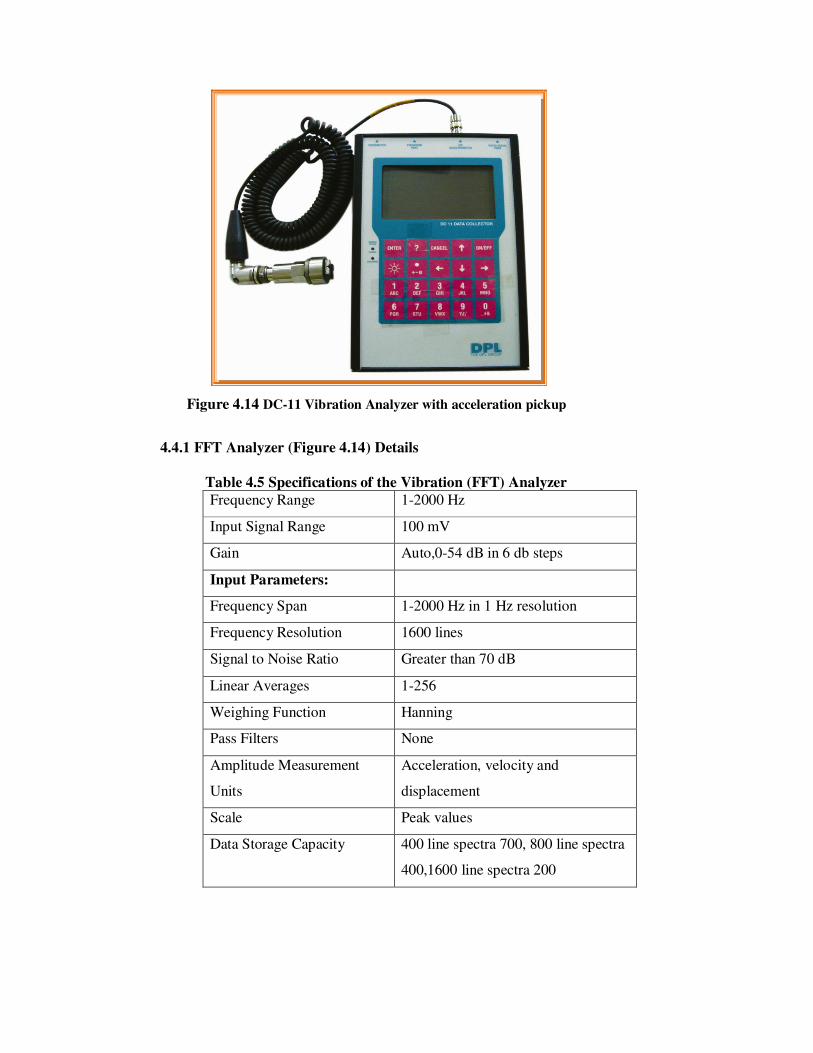
Figure 4.14 DC-11 Vibration Analyzer with acceleration pickup
4.4.1 FFT Analyzer (Figure 4.14) Details
Table 4.5 Specifications of the Vibration (FFT) Analyzer Frequency Range 1-2000 Hz
Input Signal Range 100 mV
Gain Auto,0-54 dB in 6 db steps
Input Parameters:
Frequency Span 1-2000 Hz in 1 Hz resolution
Frequency Resolution 1600 lines
Signal to Noise Ratio Greater than 70 dB
Linear Averages 1-256
Weighing Function Hanning
Pass Filters None
Amplitude Measurement
Units
Acceleration, velocity and
displacement
Scale Peak values
Data Storage Capacity 400 line spectra 700, 800 line spectra
400,1600 line spectra 200

4.4.2. Features
� Time wave form (oscilloscope) in OFF-ROUTE mode.
� FFT auto spectra
� Envelop spectra selected by multiple band pass filters
� Rotation speed
� Amplitude and phase on rotation speed and its harmonics
4.5 Experimental Procedure
The experimentation is conducted on the single cylinder direct injection diesel
engine operated at normal room temperatures of 28 0C to 33 0C in the Department of
Marine Engineering, Andhra University. The fuels used are Diesel fuel in neat condition
and as well as methyl ester of Mahua oil (MME) with 3%,5%, 10%, and 15% additive
Diethyl ether (DEE) and at five discrete part load conditions, namely No Load, One
Fourth Full Load, Half Full Load, Three Fourth Full Load and Full Loads. The data
collection is done independently for the above said oils. The engine is initially made to
run at 1500rpm continuously for one hour in order to achieve the thermal equilibrium
under operating conditions.
4.5.1 Fuel Consumption Measurement
Time taken for 10 ml consumption of fuel is recorded at all the above mentioned
loads with neat Diesel and with neat MME operation and MME with all percentages of
DEE implementation. Same procedure is repeated with diesel operation at the same
loading conditions for comparison. Finally the fuel consumption is expressed in kg/hr.
4.5.2 Combustion Pressure Measurement
The Piezo electric transducer (Figure 4.6) is fixed (flush in type) to the cylinder
body (with water cooling adaptor) to record the pressure variations in the combustion
chamber for each and every degree of crank angle. Crank angle is measured using crank
angle encoder. Exact TDC position is identified by the valve timing diagram and fixed
with a sleek mark on the fly wheel and the same is used as a reference point for the
encoder with respect to which the signals of crank angle will be transmitted to the data

logger. The data logger synthesizes the two signals and finally the data is presented in the
form of a graph on the computer using C7112 software.
The net heat release rates and the cumulative heat release rates are derived from
this recorded Pressure-Crank angle data with the help of C7112 software designed and
developed based on Gatowski model for heat release rates. The derived output is also
presented for every crank angle in the graphic format by the above said software.
4.5.3 Emission Measurement
Delta 1600-L Exhaust Gas Analyzer (Figure 4.11) collects the exhaust gas from the
exhaust piping, measures and provides the values mainly about six components of it
namely nitric oxide, hydro carbons, carbon monoxide, carbon dioxide, oxygen and free air
either in the percentage basis or as parts per million in the printed format.
4.5.4 Smoke Measurement
Exhaust suction gun (Figure 4.13) collects gas sample by suction. During this
process the smoke paper placed inside the suction gun absorbs the smoke. The smoke
density is measured using the Diesel Tune Smoke Analyzer (Figure 4.12) and then
converted in HSU units by using proper conversion tables.
4.5.5 Exhaust Gas Temperature Measurement
Exhaust gas temperatures for each and every load with diesel as well as MME
implementation for all the exhaust gases are recorded by means of a temperature
measuring (thermocouple based) device (Figure 4.13) whose sensor is placed on the
exhaust pipe immediately after the exhaust valve.
4.5.6 Vibration Measurement
Four strategic points on the engine cylinder body and the foundation are chosen to
assess the engine vibration. These four points are
1) Vertical on top of the cylinder head,
2) Radial on the cylinder and parallel to the axis of the crank shaft,
3) Radial on the cylinder and perpendicular to the axis of the crank shaft,
and
4) On the foundation.

The vibration data recorded at these four points encompasses the engine vibration in
the vertical direction, the two horizontal directions and the vibration transmitted to the
foundation, respectively. The vibration data is recorded with the help of an accelerometer
and DC-11 (Figure 4.11) data logger which directly gives the spectral data in the form of
FFT. This FFT data recorded is collected in the form of Vast-an off- routes. The time
waveforms are also obtained on the cylinder head by DC-11 in the OFF-ROUTE mode
and are presented in graphic form by Vast-an, a DOS based software, designed by VAST,
Inc., Russia.
4.5.7 Error Analysis
Experimental errors:
It should be noted that all of the data collected by the data acquisition system used
in this experimental study is subject to small errors. The errors due to the data acquisition
systems used in this study are on the order of 0.02% for the 12 bit system and 0.001% for
the 16 bit system and are considered negligibly small when compared to the other sources
of error.
The error in the values of the engine torque is ±0.1 Nm. Thus, the uncertainty in
the values of torque is estimated to be in the range of 0.14–0.07%. The error in the
measurements of the engine speed is ±1 rpm. Thus, the uncertainty in the values of the
engine speed is estimated to be in the range of 0.1–0.02%.
The error in the measurement of the fuel and water flow rates may be estimated by
considering the error in the electronic balances, which have 0.1 g resolutions. The timer
used in the test has a resolution of 0.1 s. Hence, the uncertainties in the values of the water
and fuel flow rates are estimated to be in the range of 0.4–0.7%. The error in the
measurements of temperatures during the tests may be estimated by considering the error
in the type of thermocouples used. Such an error for type T is 2.2 oC
or 0.75%, whichever
is greater, and for type K, it is 2.2 oC or 0.75%. Thus, the uncertainty in the measurements
of temperature is estimated to be in the range 2–5%.
An error analysis for the derived quantities, such as engine power, brake specific
fuel consumption, thermal efficiency, heat rejection to the coolant water, heat lost through
the exhaust gases, energy supplied to the engine and unaccounted heat losses, is
performed. The error analysis by considering the method of Kline et al. (1953) indicates
that the uncertainty is in the range of 3–7%. It should be clearly noted that the estimated

errors in the measurements of the basic and derived quantities do not significantly
influence the overall uncertainty in the final results.
4.6 Summary
The fuel consumption for the methyl ester run at various percentages of additive
as well as for the neat ester and diesel is measured at all defined loads both with U-tube
manometer and fuel Rota meter. This is an attempt to evaluate engine performance for
comparison, which is taken up in the following chapter (Chapter V).
The heat release rate values are derived from the pressure-crank angle signatures
by a suitable computer program.
The engine vibration is monitored by assessing the vibration on the cylinder head
in three directions namely vertical, inline to the crank shaft axis and perpendicular to the
crank shaft axis as well as on the foundation. The time waveforms are measured on the
cylinder head in vertical direction while the engine is running at different loads.
The exhaust gas and smoke analysis are taken up to assess the pollution
parameters and smoke levels. The results are elaborately discussed in the next Chapter
V.