prashant 2
TRANSCRIPT
VRL LOGISTICS pvt ltd Varur-Hubli
ACKNOWLEDGEMENT
Before we get deep into the project, I would to take opportunity to express my profound thanks to people who have become part of this project.
I would like to express my sincere and profound sense of gratitude to the management of “VRL Logistics Pvt Ltd in Varur-Hubli “ for providing me such a great opportunity, and their support and valuable guidance for “Working Capital Management in their department”.
I would like to thank the managing director of VRL Mr.Anand sankeshwar and also to Shri. S.G.Patil General Manager (HRD), for their support and advice and for giving me all the valuable information required to fulfill the needs of this project.
I would also thank the entire Departmental staff of VRL who were very kind and supportive enough to spare their busy schedules, and for giving each and every detail I needed to complete my project.
I extend my heartfelt and sincere thanks to our principal Dr. R.V. DADIBBAVI, OXFORD COLLEGE OF BBA, HUBLI for his valuable and timely guidance and support, and for his constant motivation throughout my project period.
I also extend my heart full thank to my project guide Prof. jitendra.s, OXFORD COLLEGE OF BBA, HUBLI, without whose support and guidance I would not have been able to prepare this project.
OXFORD College Of Business administration, Hubli 1
VRL LOGISTICS pvt ltd Varur-Hubli
CONTENTS
1. PROJECT PROFILE 5-7 Executive summary
Scope of study
Objectives of the study
Methodology
Limitation
2. INDUSTRY PROFILE 9-15 Introduction
Out look of the VRL
3. COMPANY PROFILE 17-26 Brief history
Organization profile
Quality policy
Customers
Organization chart
4. WORKING CAPITAL MANAGEMENT 28-36 Introduction
Concept
Importance
Determinates
Analysis
OXFORD College Of Business administration, Hubli 2
VRL LOGISTICS pvt ltd Varur-Hubli
5. CASH MANAGEMENT 38-41 Introduction
Motives
Cash management cycle
Objectives
6. RECEIVABLE MANAGEMENT 43-48 Introduction
Credit evaluation
Optimum credit policy
Benefits
Company practice
Average collection period
7. DATA ANALYSIS AND INTERPRETATION 50-73
8. SWOT ANALYSIS Strength
Weakness
Conclusion
BIBLIOGRAPHY
ANNEXURES
OXFORD College Of Business administration, Hubli 3
VRL LOGISTICS pvt ltd Varur-Hubli
PROJECT PROFILE
OXFORD College Of Business administration, Hubli 4
VRL LOGISTICS pvt ltd Varur-Hubli
EXECUTIVE SUMMARY
I have selected. VRL Logistics pvt ltd Varur-Hubli, for the project work “Working capital management” which I learned at my BBA 5th semester.
VRL Logistics Pvt Ltd commenced its operation and started in year 1976.
VRL Logistics is one of the leading road transportation companies in India, with operations in parcel transportation, express cargo, aviation and courier segments. Management of working capital is an essence of business activity a company should always maintain good amount of working capital on continuous basis.
So I took this opportunity to study the working capital management of VRL Varur-Hubli.
OXFORD College Of Business administration, Hubli 5
VRL LOGISTICS pvt ltd Varur-Hubli
SCOPE OF THE STUDY
The customer satisfaction survey activity entails: identification of customer segments in more details; listing the types of courier interfaces with customers; categorization of services received by various segment. Intended project activity for 2010 encompasses the desing, data collection, analysis and reporting of a statistically relisble survey of customer segments, perceptions of courier current levels of performance, service of performance standards exceptions, and service improvement opportunities. In order to be consistent with previous customer satisfaction studies, both the listof directorates and the “satisfaction criteria” will be consistent. However additional items of information will be added.
OBJECTIVES OF THE STUDY
To know the attribute of the customer towards the company’s service. To know the service provide by the VRL Logistics. The understand the present service system. To find out the gap between present service and customer expectation. To know the price level of the VRL Logistics Ltd courier service compared to other
competitors. To know the safety of documents and time management. To know the staff behavior with the customer. To sasses the level of satisfaction of customer towards courier service offered by the
VRL Logistics Ltd.
OXFORD College Of Business administration, Hubli 6
VRL LOGISTICS pvt ltd Varur-Hubli
METHODOLOGY
The data is collected from both primary and secondary source they are . Primary source: conversation with Mr. S. sudhakar. Financial conculter and also with
college guie Mr. Anand Faculty in Finance.
Secondary source: company’s annual report and the company www.vrllogistics.com
LIMITATIONS
The time is the main limitation to this project. Because “working capital management” is a very vast subject and to study it thoroughly one month is a very short period.
OXFORD College Of Business administration, Hubli 7
VRL LOGISTICS pvt ltd Varur-Hubli
INDUSTRY PROFILE
OXFORD College Of Business administration, Hubli 8
VRL LOGISTICS pvt ltd Varur-Hubli
INDUSTRY PROFILE
INTRODUCTION:
Had its start some 15-20 years ago. The courier industry was initially limited to the four metros – New Delhi, Mumbai, kolkatta, and Chennai and to some extent to Bangalore. The reason was the airport connection these metros were. But, the changing economy and technical advancement seen on a daily basis, the industry has grown and extended faster to several cities and even rural areas. And it is still growing.
A courier company anywhere in the world has its primary virtue is its efficiency to render service. The better the quality of service, the more the satisfied customers, better the chances of survival. The industry s booming and market is cut-throat competitive. The advancement of technology and internet has thing slight easier and more competitive as well.
Courier services in India can be segregated in few categories. Basically, it begins with intra-city service which are about speedy delivery of mails and goods within the city. Broadening the services, inter-city service are covered. Normally this is termed as surface cargo service where short distance and bulk loads are handled. Surface mode service is performed through two ways: firstly, on road (by bus or vehicle) and secondly on track (by train) service. The products are normally delivered through door to door.
Courier companies work in tandem with the foremost airlines and in sync with their well tuned, well associated set of connections the timely deliverance and protected service is guaranteed. Few other variant of service could be express service, ocean freight, industry solutions, logistics solutions, shipping tools. These particular services are individual of a company’s area of specialization and diversification.
OXFORD College Of Business administration, Hubli 9
VRL LOGISTICS pvt ltd Varur-Hubli
COURIER:
A courier is a person or a company who delivers message, packages, and mail courier are distinguished from ordinary mail services by features such as speed security, tracking. Signature, specialization and individualization of services, and committed delivery times, which are optional for most everyday mail services, as a premium service, courier are usually more expensive than usual mail services, and their use is typically restricted to packages where one or more of these features are considered important enough to warrant the cost.
Different courier service operate on all scales, from within specific towns or cities,to regional, national and global service. The world’s largest courier companies are velox express, DHL, FEDEX, OBC, express Ltd, TNT.NV, UPS, and Aramex these offer services worldwide, typically via a hub and spoke model.
Couriers before the industrial area:
In ancient times runners and homing pigeon and riders on horseback were used to deliver timely messages. Before there were mechanized courier services foot messengers physically ran miles to their destinations. to this day are marathons directly related to actual historical messenger’s routes.
OXFORD College Of Business administration, Hubli 10
VRL LOGISTICS pvt ltd Varur-Hubli
TYPES OF COURIERS :
In cities, there is often bicycle courier or motorcycle courier but for consignments requiring delivery over greater distance networks, this may often include lorries, railway and aircraft.
Many companies who operate under a JUST IN TIME or “JIT” inventory method often utilize on - board couriers. On - board couriers are individuals who can travel at a moment’s notice anywhere in the world, usually via commercial airlines. While this type of service is the second costliest – GENERAL AVIATION charters are far more expensive – companies analyze the cost of service to engage an on – board courier versus the “cost” the company will realize should the product not arrive by a specified time.
OXFORD College Of Business administration, Hubli 11
VRL LOGISTICS pvt ltd Varur-Hubli
INDIAN LOGISTICS OUT LOOK:
On the other hand, since year 2000, the Indian industrial sector has also begun to look up, and in 2006, it registered over 10% growth for the time decades. Primarily driven by the manufacturing and capital goods segments. In the Indian manufacturing industry, textile plays a predominant role, while the chemical industry is the second largest industrial sector (12% of the GDP). However, India’s influence in global trade remains low and the country represents only 1% of the world exports trade. India mainly exports engineering goods, germs and jewelers (83% of diamond sold in the world are cut in India), textile and fabrics, and leather goods. The major imports are oil, precious stones, chemical products and machinery/engineering equipments. India’s main trade partners (exports and imports ) are Belgium, china, Switzerland, UAE, the UK, and US. With India’s GDP growing at 9% and the manufacturing sector enjoying double digit growth rates the logistics industry is at an inflection point. Strong growth enables exist today in the forum of $250 billion worth of infrastructure investment phased introduction of vat, and development of organized retail, telecom, and auto component manufacturing will lead to increased market opportunities for logistics service providers (LSPs). India currently spends over 13% of its GDP on logistics, which is very high compared to western Europe and north America, where logistics cost as a percentage of GDP is in the become imperative and the growth in domestic demand is driven by a number of factors including the rising income level and easy availability of low – cost finance. The auto sectors are key to the Indian economy from both the perspective of economic contribution as well as that of employment generation. The sectors employs 13 million people and contribution to around 17% of the direct taxes kitty, the growth in the domestic demand is driven by a number of factors including the rising income levels and easy availability of low – cost finance. The auto sectors are key to the Indian economy from both the perspective of economic contribution as well as that of employment generation. The 13 million people and contribution to around 17% of the direct taxes kitty.
OXFORD College Of Business administration, Hubli 12
VRL LOGISTICS pvt ltd Varur-Hubli
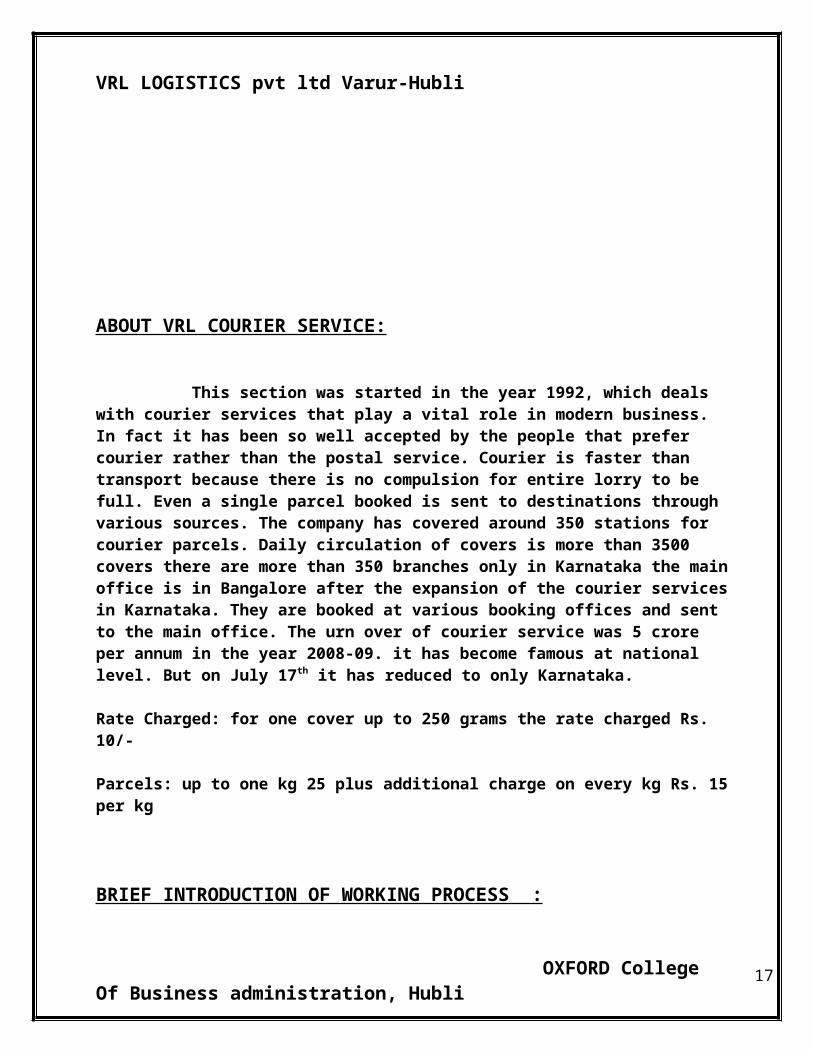
ABOUT VRL COURIER SERVICE:
This section was started in the year 1992, which deals with courier services that play a vital role in modern business. In fact it has been so well accepted by the people that prefer courier rather than the postal service. Courier is faster than transport because there is no compulsion for entire lorry to be full. Even a single parcel booked is sent to destinations through various sources. The company has covered around 350 stations for courier parcels. Daily circulation of covers is more than 3500 covers there are more than 350 branches only in Karnataka the main office is in Bangalore after the expansion of the courier services in Karnataka. They are booked at various booking offices and sent to the main office. The urn over of courier service was 5 crore per annum in the year 2008-09. it has become famous at national level. But on July 17th it has reduced to only Karnataka.
Rate Charged: for one cover up to 250 grams the rate charged Rs. 10/-
Parcels: up to one kg 25 plus additional charge on every kg Rs. 15 per kg
BRIEF INTRODUCTION OF WORKING PROCESS :
Hubli courier office is the main office. And all collected consignment and documents which have collected through company employees and company agents are come to main office. In main office courier are classified according to city name and keeping that document in separate section. For keeping those classified documents the section has separate place for every state and city area, after this classified parcels will be sent to its destinations places.
OXFORD College Of Business administration, Hubli 13
VRL LOGISTICS pvt ltd Varur-Hubli
Punch line of VRL courier service
“Any where any time”
OXFORD College Of Business administration, Hubli 14
VRL LOGISTICS pvt ltd Varur-Hubli
VRL EXPRESS CARGO:
Surface, train and cargo mode service
Dedicated company owned vehicle
Door pick up and delivery
On – time delivery
24*7*365 days operation
Dedicated and well – ground customer care windows
Extensive nation – wide network
COMPETITORS OF VRL COURIER SERVICE :
Ksrts
Dtdc
Professional courier service
Sharma travels
National travel
OXFORD College Of Business administration, Hubli 15
VRL LOGISTICS pvt ltd Varur-Hubli
Company profile
OXFORD College Of Business administration, Hubli 16
VRL LOGISTICS pvt ltd Varur-Hubli
COMPANY PROFILE
BRIEF HISTORY OF THE COMPANY
Vijayanda Road Lines ltd a company registered under the provision of company act 1956 has with its “symbol of service”. The ‘VRL’ has built and maintained goodwill in the minds of public at large in the country in general and in Karnataka particular.
The managing director Mr. Vijay.B.Sankeshar started as an individual transport in January 1976 without any background of experience. Initially for the first two years he suffered heavy loss. Then by end of 1977 he started as local transporter between in Hubli and Gadag. Due to effective service, business picked up and purchased one more lorry in 1978. during this work he observed activities of other well know transporter and started first parcel service from Bangalore to Hubli and Belgaum with only two lorries. Gradually the business picked up. Later the above proprietorship were converted onto private ltd. The company came onto existence in the year march 31st 1983, VRL company initially in the transportation of goods and service subsequently it concerned the business of courier service in the year 1996 it acquired passenger buses, initially vijayanda travels operating in the state Karnataka and Maharastra.
Presently VRL existing with largest network in India, the VRL parcel service is indispensable for large no of corporate houses. This network spans the length and breadth of the country and is supported by large number transshipment hubs, VRL operates through a network of 2629 Locations 911 branches, franchises and valuable customer, now VRL expanding its service to reach even the remote location of the country with the help of 2900 vehicles (including 300 hi-tech buses).
Over the year VRL has pioneered in providing a safe and reliable delivery network in the field of parcel service. It has spread its operations to courier service express cargo and aviation to meet the growing of the customer base.
OXFORD College Of Business administration, Hubli 17
VRL LOGISTICS pvt ltd Varur-Hubli
At the core of the groups transport business is its 43 acre transport cum warehouse complex in Varur, Hubli. This unique facility has all the essential back up service under one roof. The total built up area of complex is 2,50,00,000 sq ft with an additional 1,00,000 sq, ft, of land utilized for sheds and vehicle parking, this complex contain the head office building, transshipment godown, workshop, canteen, drivers rest room, own diesel bunk.
FINANCIAL HIGHLIGHTS OF THE YEAR 2010-11
The company earned total revenues of Rs. 892.92 crores and recorded profits after tax to the tune of Rs. 50.97 crores as against corresponding revenues of Rs. 714.67 crores and profits after tax of Rs. 29.10 crores for the earlier financial year. The same translates to a revenue growth of 25% driven by higher volumes and complemented by the consolidation measures initiated by the company during the earlier fiscal. I am confident of the company scaling greater heights in the years to come.
OXFORD College Of Business administration, Hubli 18
VRL LOGISTICS pvt ltd Varur-Hubli
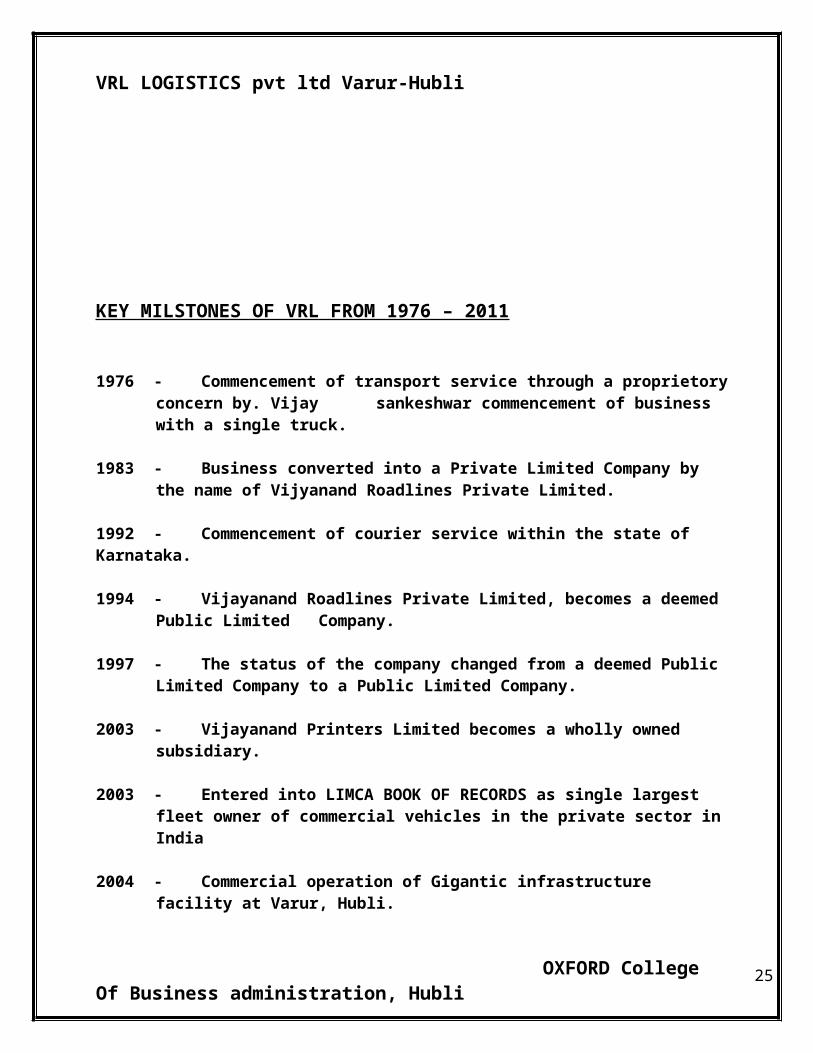
KEY MILSTONES OF VRL FROM 1976 – 2011
1976 - Commencement of transport service through a proprietory concern by. Vijay sankeshwar commencement of business with a single truck.
1983 - Business converted into a Private Limited Company by the name of Vijyanand Roadlines Private Limited.
1992 - Commencement of courier service within the state of Karnataka.
1994 - Vijayanand Roadlines Private Limited, becomes a deemed Public Limited Company.
1997 - The status of the company changed from a deemed Public Limited Company to a Public Limited Company.
2003 - Vijayanand Printers Limited becomes a wholly owned subsidiary.
2003 - Entered into LIMCA BOOK OF RECORDS as single largest fleet owner of commercial vehicles in the private sector in India
2004 - Commercial operation of Gigantic infrastructure facility at Varur, Hubli.
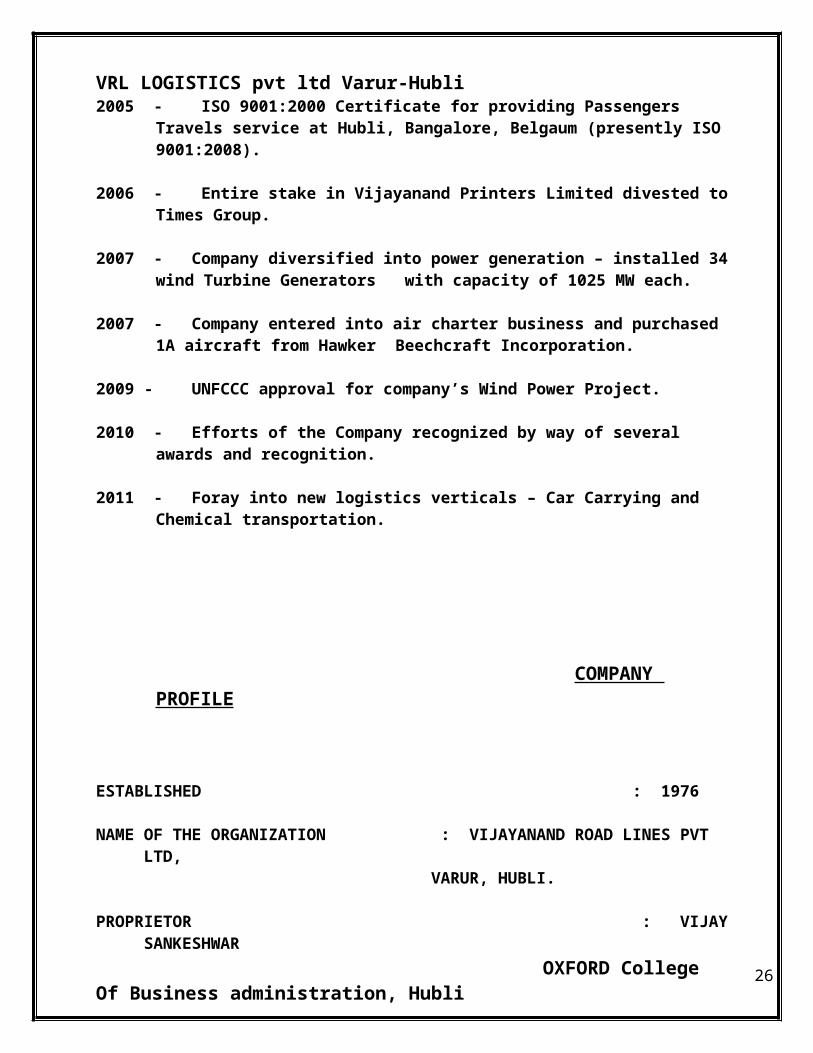
2005 - ISO 9001:2000 Certificate for providing Passengers Travels service at Hubli, Bangalore, Belgaum (presently ISO 9001:2008).
2006 - Entire stake in Vijayanand Printers Limited divested to Times Group.
2007 - Company diversified into power generation – installed 34 wind Turbine Generators with capacity of 1025 MW each.
2007 - Company entered into air charter business and purchased 1A aircraft from Hawker Beechcraft Incorporation.
2009 - UNFCCC approval for company’s Wind Power Project.
2010 - Efforts of the Company recognized by way of several awards and recognition.
2011 - Foray into new logistics verticals – Car Carrying and Chemical transportation.
OXFORD College Of Business administration, Hubli 19
VRL LOGISTICS pvt ltd Varur-Hubli
COMPANY PROFILE
ESTABLISHED : 1976
NAME OF THE ORGANIZATION : VIJAYANAND ROAD LINES PVT LTD, VARUR, HUBLI.
PROPRIETOR : VIJAY SANKESHWAR
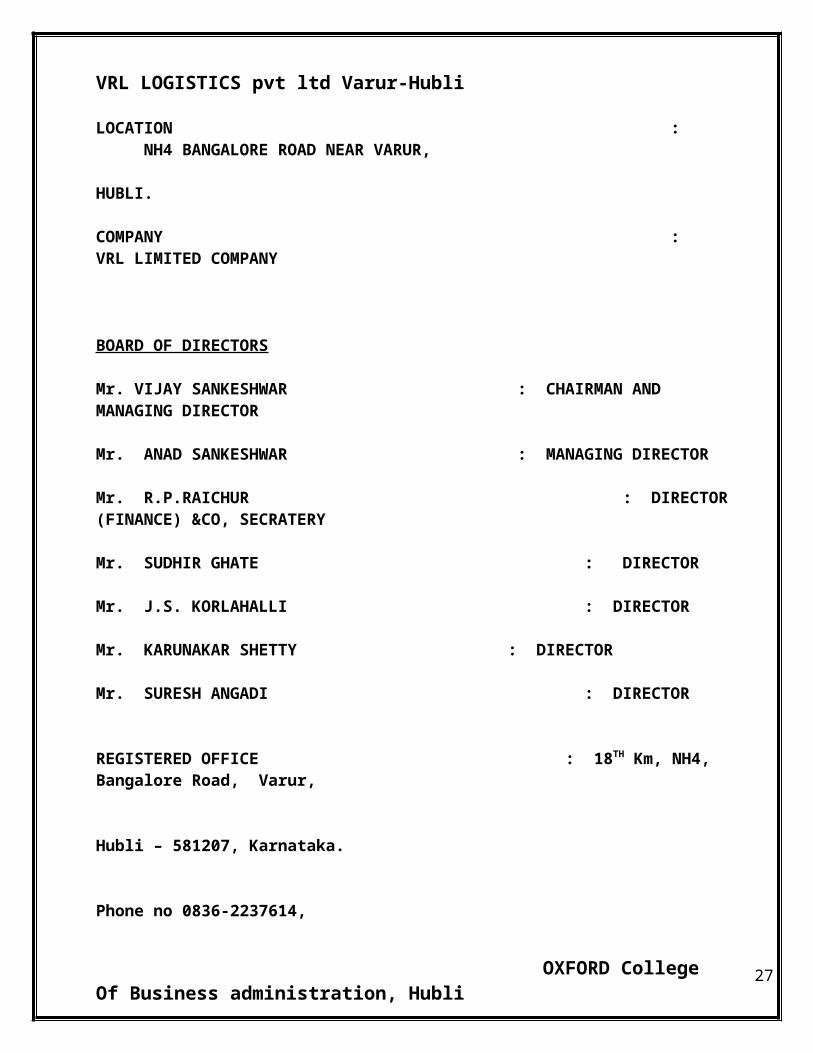
LOCATION : NH4 BANGALORE ROAD NEAR VARUR, HUBLI.
COMPANY : VRL LIMITED COMPANY
BOARD OF DIRECTORS
Mr. VIJAY SANKESHWAR : CHAIRMAN AND MANAGING DIRECTOR
Mr. ANAD SANKESHWAR : MANAGING DIRECTOR
Mr. R.P.RAICHUR : DIRECTOR (FINANCE) &CO, SECRATERY
Mr. SUDHIR GHATE : DIRECTOR
Mr. J.S. KORLAHALLI : DIRECTOR
Mr. KARUNAKAR SHETTY : DIRECTOR
Mr. SURESH ANGADI : DIRECTOR
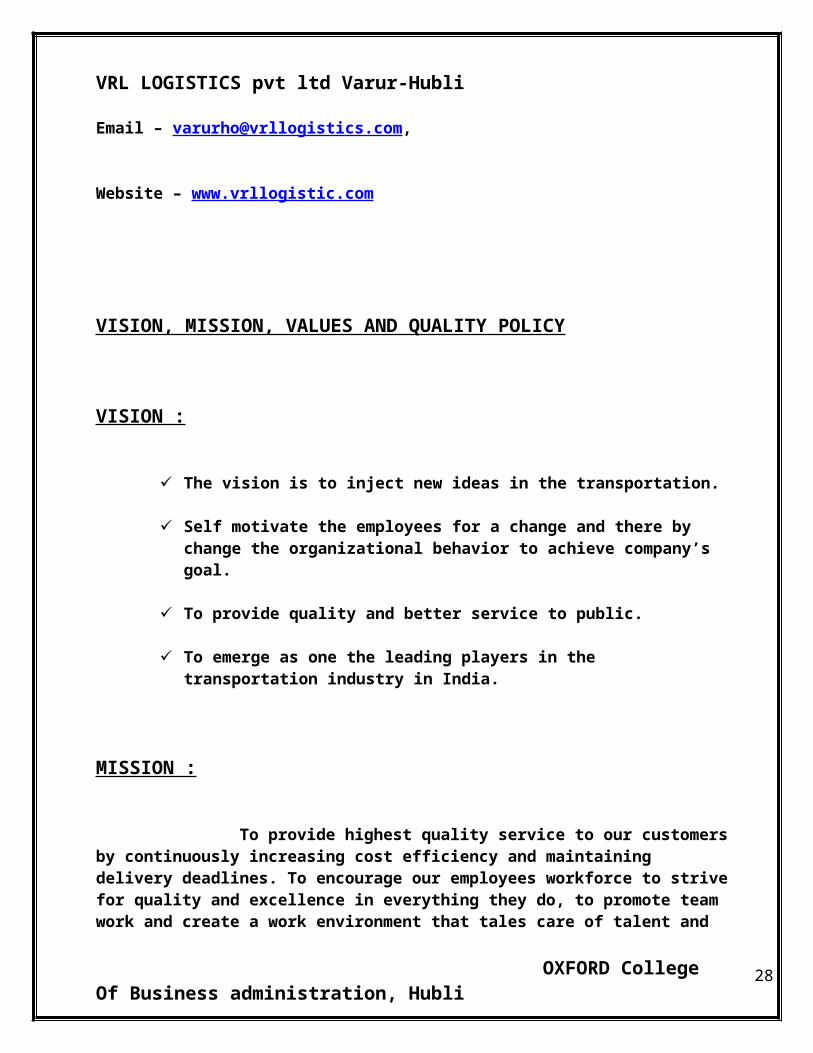
REGISTERED OFFICE : 18TH Km, NH4, Bangalore Road, Varur, Hubli – 581207, Karnataka. Phone no 0836-2237614, Email – [email protected],
OXFORD College Of Business administration, Hubli 20
VRL LOGISTICS pvt ltd Varur-Hubli Website – www.vrllogistic.com
VISION, MISSION, VALUES AND QUALITY POLICY
VISION :
The vision is to inject new ideas in the transportation.
Self motivate the employees for a change and there by change the organizational behavior to achieve company’s goal.
To provide quality and better service to public.
To emerge as one the leading players in the transportation industry in India.
MISSION :
To provide highest quality service to our customers by continuously increasing cost efficiency and maintaining delivery deadlines. To encourage our employees workforce to strive for quality and excellence in everything they do, to promote team work and create a work environment that tales care of talent and bring out the best in our employees. Providing a quick and safe delivery of goods service is their motto.
THE VALUES :
“Punctuality, Integrality, Honesty, Loyalty, and Credibility”.
PHILOSOPHY :
They immensely follow : “Time is Gold”
OXFORD College Of Business administration, Hubli 21
VRL LOGISTICS pvt ltd Varur-Hubli
QUALITY POLICY :
The VRL started with the sing of “Symbol Of Service” the VRL are committed to meet the needs and expectations of our customers by providing quick, prompt, efficiency, reliable, cost effective and safe service. Maintaining transparency in all their truncation and strive for continual improvement for enhancing customer satisfaction.
In the words of chairman and managing director “we are committed to provide quality transportation and logistics service consistently at reasonable rate and to continually improve the same to achieve customer to delight on sustainable basis.
CUSTOMERS OF THE VRL ;
Deep traders
Surya agencies
N.K. Electronics
G.K. tires
Birla tires
Supreem Agencies
Girias
Sumitra Traders
Samsung India Pvt ltd
Onida Electronics
Britania
OXFORD College Of Business administration, Hubli 22
VRL LOGISTICS pvt ltd Varur-Hubli Asian paints
Sony India Pvt ltd
ORGANISATION GOALS :
The customer satisfaction is the key factor in today’s market as “customer is the king”, hence forecast and analyze the requirement of the customer is a must. The goals of the company are as below.
Quick and safe service
Customer satisfaction and employee satisfaction
Competition [rice
Attain market leadership
OBJECTIVES OF THE COMPANY :
The main objective if the company is to provide good service to customer eith the reasonable rate and provide quick prompt and service.
Human resource development.
To develop the transportation business in states like Andra Pradesh, Tamilunadu and kerala.
Training for all employees
Customer satisfaction
To have independent own building with printing machines and computer for each and every district
Competitive price
Productivity and innovation
To build highly motivated and committed team of staff by providing a good work culture to achieve individual performance
OXFORD College Of Business administration, Hubli 23
VRL LOGISTICS pvt ltd Varur-Hubli
To implement ISO 9002
SERVICES ;
The person who are booked for the travels are the covered by insurance
They provide returned journey ticket booking facility
To maintain their good service they go for only selected hotel place for hygienic food
Incentives are their provided to drivers for safe and timely service
Concession is provide for the school and college going students for their study trips
Careful handling of goods consigned
ACHIEVEMENTS AND AWARDS :
ACHIEVEMENTS;
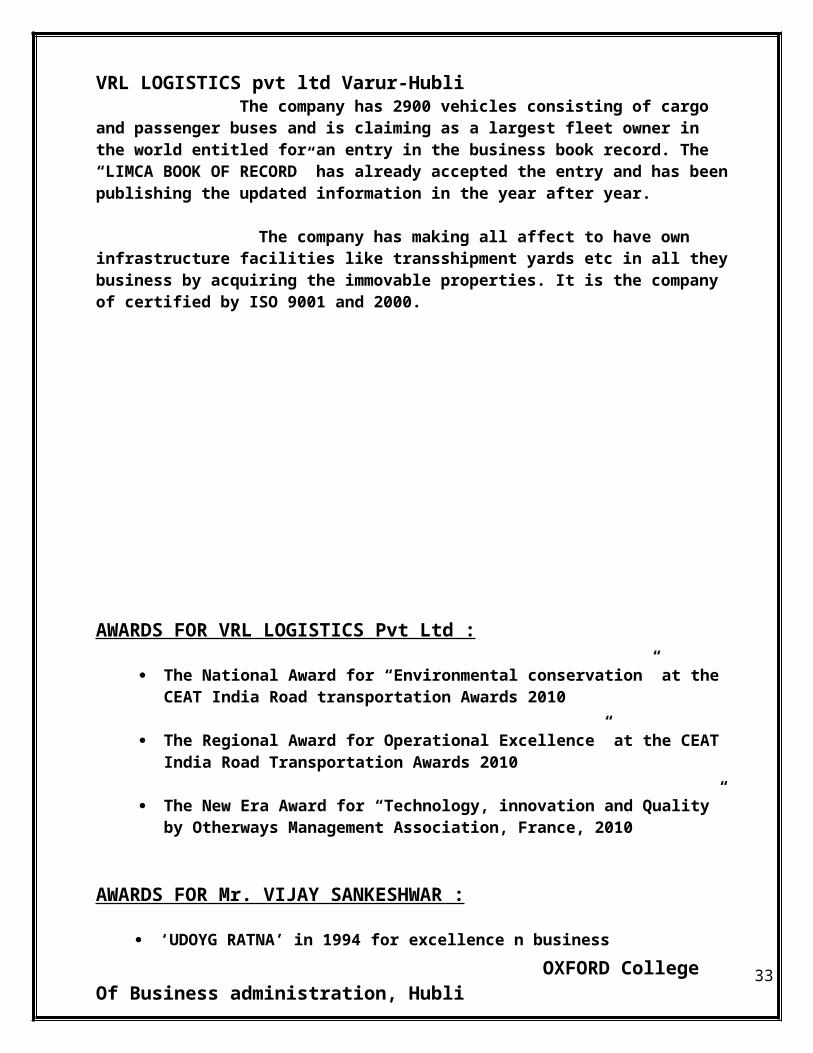
The company has 2900 vehicles consisting of cargo and passenger buses and is claiming as a largest fleet owner in the world entitled for an entry in the business book record. The “LIMCA BOOK OF RECORD” has already accepted the entry and has been publishing the updated information in the year after year. The company has making all affect to have own infrastructure facilities like transshipment yards etc in all they business by acquiring the immovable properties. It is the company of certified by ISO 9001 and 2000.
OXFORD College Of Business administration, Hubli 24
VRL LOGISTICS pvt ltd Varur-Hubli
AWARDS FOR VRL LOGISTICS Pvt Ltd :
The National Award for “Environmental conservation” at the CEAT India Road transportation Awards 2010
The Regional Award for Operational Excellence” at the CEAT India Road Transportation Awards 2010
The New Era Award for “Technology, innovation and Quality” by Otherways Management Association, France, 2010
AWARDS FOR Mr. VIJAY SANKESHWAR :
‘UDOYG RATNA’ in 1994 for excellence n business
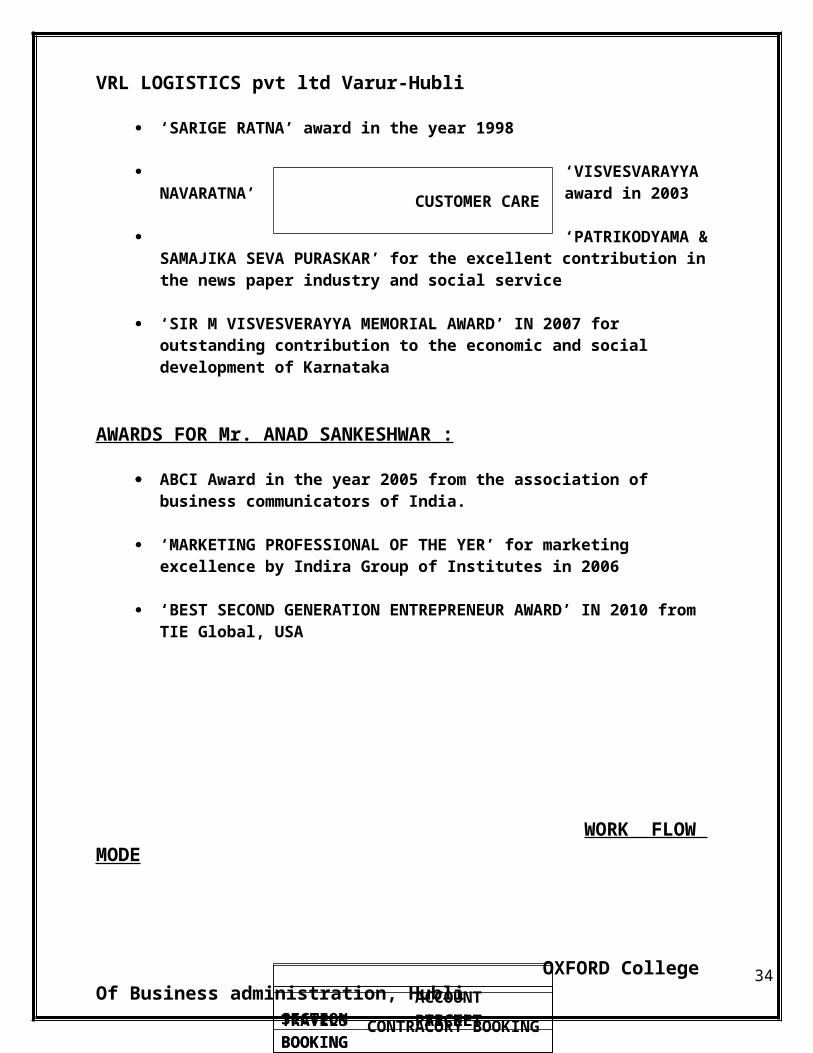
‘SARIGE RATNA’ award in the year 1998
‘VISVESVARAYYA NAVARATNA’ award in 2003
‘PATRIKODYAMA & SAMAJIKA SEVA PURASKAR’ for the excellent contribution in the news paper industry and social service
‘SIR M VISVESVERAYYA MEMORIAL AWARD’ IN 2007 for outstanding contribution to the economic and social development of Karnataka
AWARDS FOR Mr. ANAD SANKESHWAR :
ABCI Award in the year 2005 from the association of business communicators of India.
‘MARKETING PROFESSIONAL OF THE YER’ for marketing excellence by Indira Group of Institutes in 2006
‘BEST SECOND GENERATION ENTREPRENEUR AWARD’ IN 2010 from TIE Global, USA
OXFORD College Of Business administration, Hubli 25
VRL LOGISTICS pvt ltd Varur-Hubli
WORK FLOW MODE
OXFORD College Of Business administration, Hubli
TICKET BOOKING
TRAVELS
ACCOUNT SECTION
CONTRACORY BOOKING
PARCEL BOOKING
CUSTOMER CARE
26
VRL LOGISTICS pvt ltd Varur-Hubli
WORKING CAPITAL MANAGEMENT
OXFORD College Of Business administration, Hubli 27
VRL LOGISTICS pvt ltd Varur-Hubli
WORKING CAPITAL MANAGEMENT
MEANING :
Working capital is the short – term investment, which is, concerned with the problems that arise to manage current assets the current liabilities and the relationship that exist between them.
CONCEPTS :
There are two concepts of working capital
I. Gross Working Capital
II. Net Working Capital
GROSS WORKING CAPITAL ;
The total capital employed in current assets or firms investments in current assets.
Current are those assets which can be covered into cash within an accounting year and include cash short term securities, debtors, bills receivables, inventory it focuses on two aspects of current assets management.
1. Optimum investment in current assets – i. e. to avoid two extreme prints excess and inadequate investments in current assets.
2. Financing of current assets it should make necessary arrangement of working capital fund whenever a firm due to increase level of business activities or for any other reasons.
OXFORD College Of Business administration, Hubli 28
VRL LOGISTICS pvt ltd Varur-Hubli
NET WORKING CAPITAL :
It is difference between current assets and current liabilities of the excess current assets over current liabilities.
Current liabilities are those claims of the outsiders, which are expected to nature for payment within an accounting year and include creditor’s bills payable etc.
NEED FOR WORKING CAPITAL :
A firm needs working capital for the following reasons.
1. To run the day-to-day business activities.
2. To maximize the wealth of the share holders
3. To deal with the problem arising out of the luck of immediate realization of cash against goods sold.
4. To match between cash outflow and cash inflow of the firm
5. To smooth, uninterrupted functioning of firm activities.
6. stock of raw material, work in progress are kept to ensure smooth production and to guard against non-availability of raw material and there components.
OXFORD College Of Business administration, Hubli 29
VRL LOGISTICS pvt ltd Varur-Hubli
DETERMINANTS OF WORKING CAPITAL :
There are no set rules or formulas to determine the working capital requirements of firm a large number of factors each having a different importance affects the working capital of a firm.
The operating cycle is explained above in detail in also one of the determinant to the working capital requirement, so these following are some other factors that generally insurance the working capital requirements of a firm.
1) NATURE OF BUSINESS : Working capital need is influenced by nature of the business trading and finance firms have a very small investments in fixed assets, but require a large sum of money to be invested in working capital.
2) BUSINESS CYCLE : Working capital requirement is determined by the nature of the business cycle business fluctuation lead to cyclical and seasonal changed which in turn cause a shift in the working capital position.
3) PRODUCTION CYCLE :
It is another important factor to determine the working capital need of a company. How much working capital is require for procurements of raw materials is determined by this factor. The completion of the manufacturing process leads to the production of finished goods.
OXFORD College Of Business administration, Hubli 30
VRL LOGISTICS pvt ltd Varur-Hubli
4) CREDIT POLICY :
Credit policy relating to the sales and purchase also affects the working capital used it policy influence the requirement of working capital in 2 ways.
Through credit terms granted by the company to its customers.
Credit terms available to the firms from its creations.
5) PRICE LEVEL CHANGES :
Changes in the price level also affect the requirement of working capital. Rising prices necessitate the rise of move funds for maintaining an existence level of activity changing price levels on working capital position vary from company to company depending on the nature of its operations its stand in the market.
6) RISKS :
The greater the uncertainty of receipt and expenditure, more the need of working capital, so, risk can also be an influencing factor on determining the working capital requirement of a firm.
OXFORD College Of Business administration, Hubli 31
VRL LOGISTICS pvt ltd Varur-Hubli
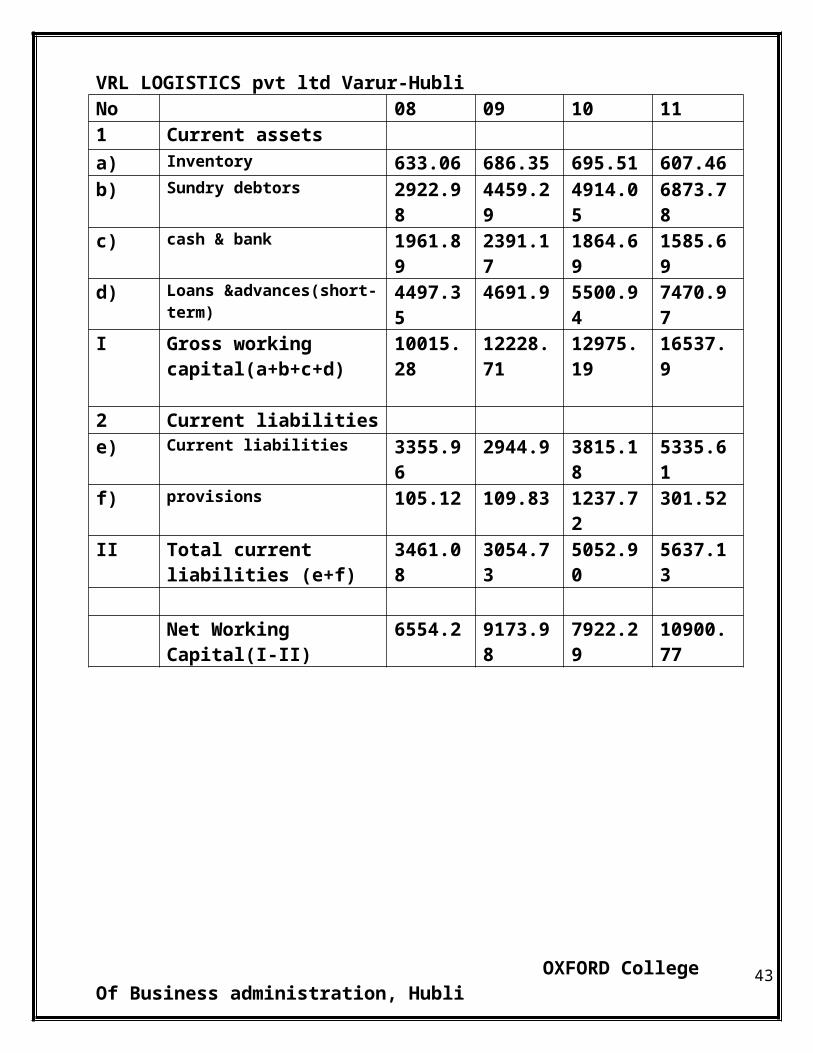
TABLE SHOWING NET WORKING CAPITAL CHANGE OF VRL LOGISTICS PVT, LTD.
SI. No Particulars 2007-08 2008-09 2009-10 2010-11
1 Current assets
a) Inventory 633.06 686.35 695.51 607.46
b) Sundry debtors 2922.98 4459.29 4914.05 6873.78
c) cash & bank 1961.89 2391.17 1864.69 1585.69
d) Loans &advances(short-term) 4497.35 4691.9 5500.94 7470.97
I Gross working capital(a+b+c+d)
10015.28 12228.71 12975.19 16537.9
2 Current liabilities
e) Current liabilities 3355.96 2944.9 3815.18 5335.61
f) provisions 105.12 109.83 1237.72 301.52
II Total current liabilities (e+f)
3461.08 3054.73 5052.90 5637.13
Net Working Capital(I-II) 6554.2 9173.98 7922.29 10900.77
OXFORD College Of Business administration, Hubli 32
VRL LOGISTICS pvt ltd Varur-Hubli
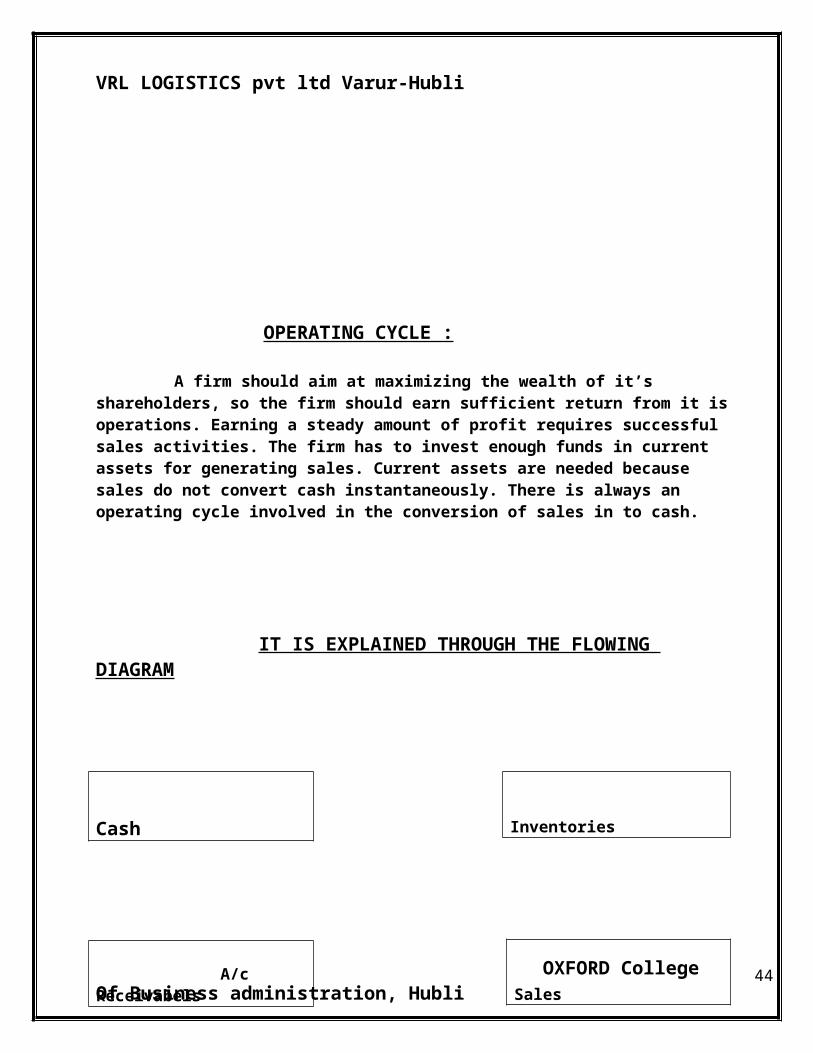
OPERATING CYCLE :
A firm should aim at maximizing the wealth of it’s shareholders, so the firm should earn sufficient return from it is operations. Earning a steady amount of profit requires successful sales activities. The firm has to invest enough funds in current assets for generating sales. Current assets are needed because sales do not convert cash instantaneously. There is always an operating cycle involved in the conversion of sales in to cash.
IT IS EXPLAINED THROUGH THE FLOWING DIAGRAM
OXFORD College Of Business administration, Hubli
Inventories Cash
Sales A/c Receivabels
33
VRL LOGISTICS pvt ltd Varur-Hubli
LENGTH OF OPERATING CYCLE
The length of the operating cycle can be calculated in two ways ;
I. Gross Operating Cycle II. Net Operating Cycle
I. Gross Operating Cycle :
The gross operating cycle of a trading concern in is the sum of inventory conversion period and debtors (Receivables) conversion period. Thus gross operating cycle is given as follows :
INVENTORY CONVERSION PERIOD + DEBTORS CONVERSION PERRIOD
II. Net Operating Cycle : Net Operating Cycle is the difference between Gross Operating Cycle and creditors (Payable) deferral period.
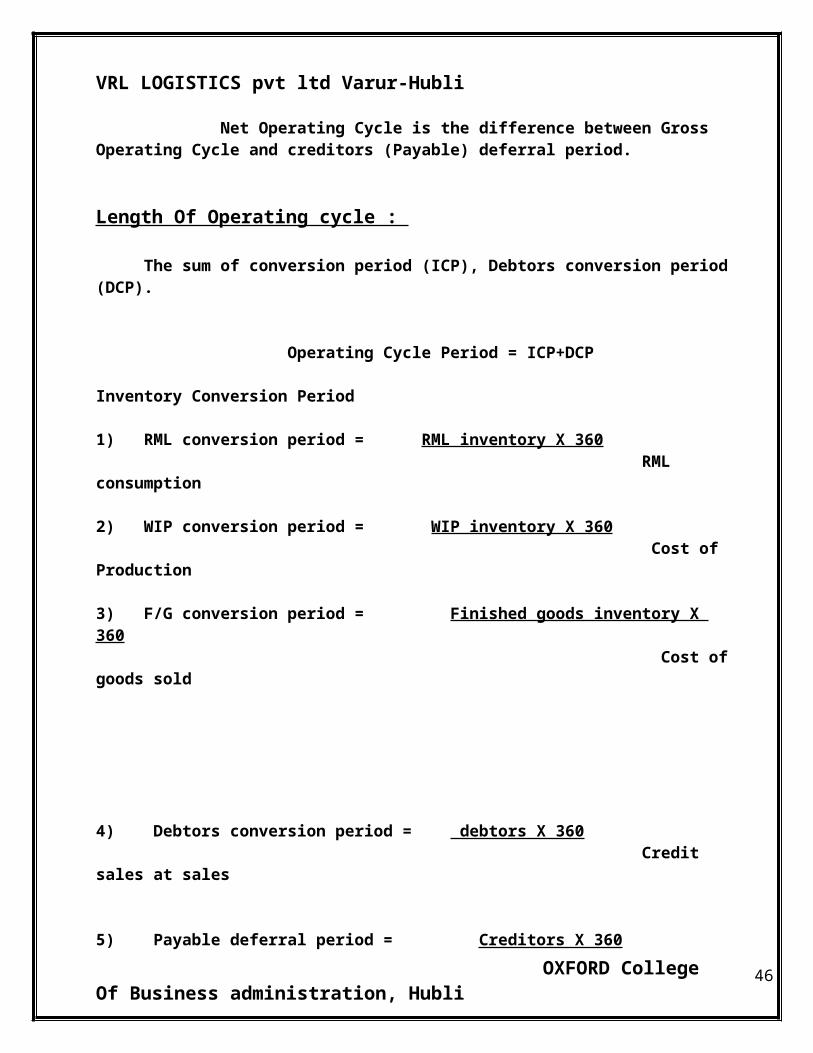
Length Of Operating cycle :
The sum of conversion period (ICP), Debtors conversion period (DCP).
Operating Cycle Period = ICP+DCP
Inventory Conversion Period
1) RML conversion period = RML inventory X 360 RML consumption
2) WIP conversion period = WIP inventory X 360 Cost of Production
3) F/G conversion period = Finished goods inventory X 360 Cost of goods sold
OXFORD College Of Business administration, Hubli 34
VRL LOGISTICS pvt ltd Varur-Hubli
4) Debtors conversion period = debtors X 360 Credit sales at sales
5) Payable deferral period = Creditors X 360 Credit sales
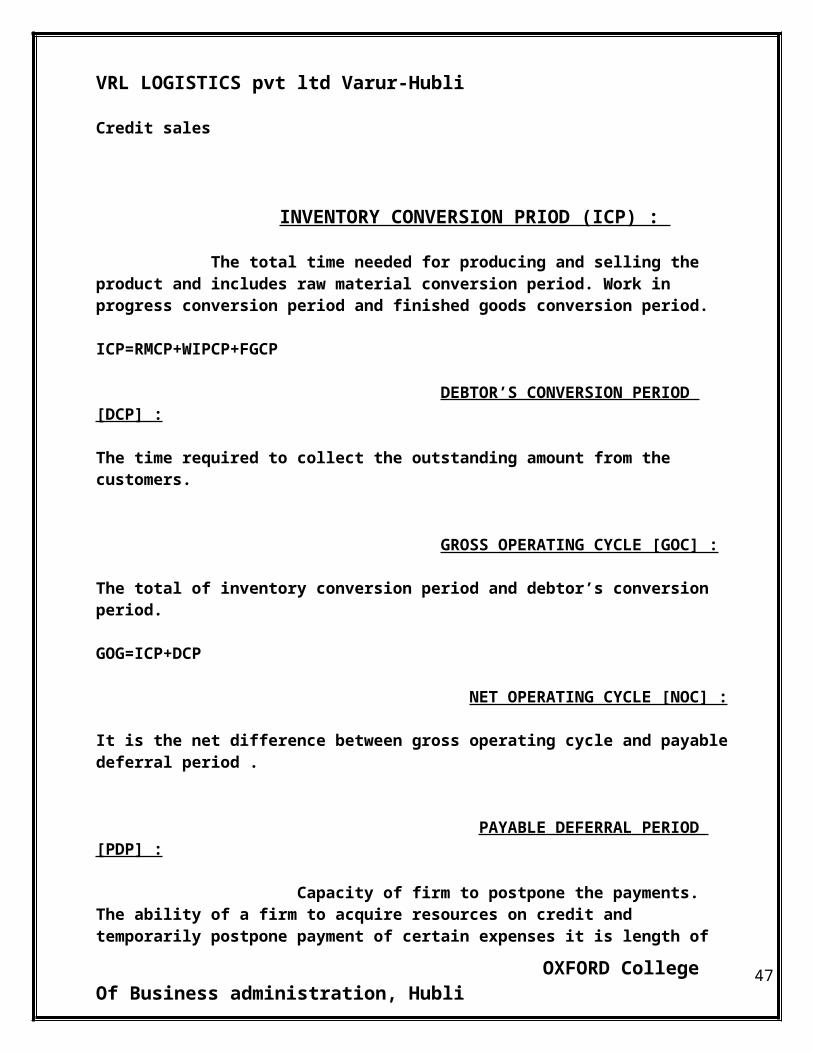
INVENTORY CONVERSION PRIOD (ICP) :
The total time needed for producing and selling the product and includes raw material conversion period. Work in progress conversion period and finished goods conversion period.
ICP=RMCP+WIPCP+FGCP
DEBTOR’S CONVERSION PERIOD [DCP] :
The time required to collect the outstanding amount from the customers.
GROSS OPERATING CYCLE [GOC] :
The total of inventory conversion period and debtor’s conversion period.
GOG=ICP+DCP NET OPERATING CYCLE [NOC] :
It is the net difference between gross operating cycle and payable deferral period .
PAYABLE DEFERRAL PERIOD [PDP] :
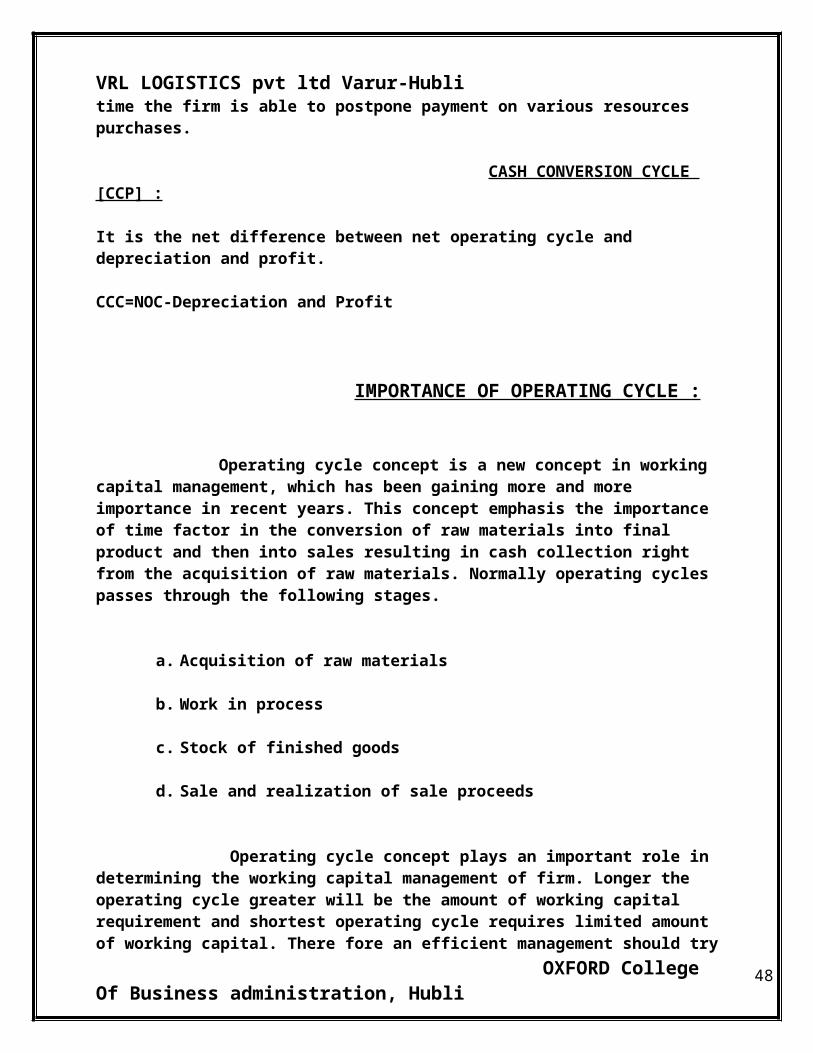
Capacity of firm to postpone the payments. The ability of a firm to acquire resources on credit and temporarily postpone payment of certain expenses it is length of time the firm is able to postpone payment on various resources purchases.
CASH CONVERSION CYCLE [CCP] :
It is the net difference between net operating cycle and depreciation and profit.
OXFORD College Of Business administration, Hubli 35
VRL LOGISTICS pvt ltd Varur-Hubli
CCC=NOC-Depreciation and Profit
IMPORTANCE OF OPERATING CYCLE :
Operating cycle concept is a new concept in working capital management, which has been gaining more and more importance in recent years. This concept emphasis the importance of time factor in the conversion of raw materials into final product and then into sales resulting in cash collection right from the acquisition of raw materials. Normally operating cycles passes through the following stages.
a. Acquisition of raw materials
b. Work in process
c. Stock of finished goods
d. Sale and realization of sale proceeds
Operating cycle concept plays an important role in determining the working capital management of firm. Longer the operating cycle greater will be the amount of working capital requirement and shortest operating cycle requires limited amount of working capital. There fore an efficient management should try to reduce the time elapsed in these consecutive stages of operating cycle.
Duration of manufacturing process right from the acquisition of raw materials till they are sold out after being converted onto final product and the realized determines the amount of working capital required.
REASONS FOR LENGTH OPERATING CYCLE :
Pro-longed operating cycles may be due to the following reasons :
1) In effective receivable management.
2) Lack of credit facilities from the suppliers.
3) In effective purchase policies.
OXFORD College Of Business administration, Hubli 36
VRL LOGISTICS pvt ltd Varur-Hubli
CASH MANAGEMENT
OXFORD College Of Business administration, Hubli 37
VRL LOGISTICS pvt ltd Varur-Hubli
CASH MANAGEMENT :
MEANING :
Cash is the important current assets for the operations of the business. Cash a basis input needed to keep the business running on a continuous basis it is also the ultimate output expected to be realized by selling the service or product manufactured by the company. The company should keep the sufficient cash neither ,ore or less cash shortage will descript the firm’s manufacture operation while excessive cash will simply remain idle without contributing anything towards the company’s profitability. Thus, a major function of the financial manager is to maintain a sound cash position.
Cash is the money, which a firm can disburse immediately without any restriction the term cash included coins currency and cheques held by the firm and balance in its bank accounts. Sometimes more cash items such as marketable securities or bank time deposits are also included in cash.
MOTIVES FOR HOLDING CASH :
1) Transaction motive :
The transaction motive requires a company to held to conduct its business in the ordinary course the company needs cash primary to make payments for purchases. Wages, salaries, other operating expenses etc.
2) Precautionary motive :
The precautionary motive is its need to hold cash to meet contingencies in futures. It provides a cushion to with stand some unexpected emergency. The precautionary amount of cash defends upon the predictability of cash flows. The precautionary balance many kept cash and marketable securities.
OXFORD College Of Business administration, Hubli 38
VRL LOGISTICS pvt ltd Varur-Hubli
3) Speculative Motive :
The speculative motive relates to the holding of cash for investing in profit making opportunity as send when they arise. The opportunity to make profit may arise when the security prices changes.
CASH PLANNING
Cash inflows and outflows should be planned to project cash surplus or deficit for cash period of the planning period. Cash budget should be prepared for this purpose.
MANAGING THE CASH FLOW
The flow of cash should be properly managed. The cash inflows should be accelerated as far as possible, decorating the cash outflows.
OPTIMUM CASH LEVEL
The company should decide about appropriate level of cash balance. The cost of excess cash and danger of cash deficiency should be matched to determine the optimum level of cash balances.
INVESTING SURPLUS CASH
The surplus cash balances should be properly invested to earn profit. The firm should decide about the division of cash balance between bank deposits, marketable securities and inter corporate lending.
OXFORD College Of Business administration, Hubli 39
VRL LOGISTICS pvt ltd Varur-Hubli
CASH MANAGEMENT AT VRL LOGISTICS PVT LTD
A well management of cash needs in a company can represents the amount of money company keeps with a bank on current or deposite account and the money holeds on the company.
To control a company’s cash flows one requires a plan of the company’s operations for the relevant future period. This plan is based on forecasts of cash receipts. In patil works and cash disbursements for costs and purchase of equipment’s etc.
COMPANY PRACTICE :
Inflows and outflows of cash by the VRL (Varur-Hubli)
CASH INFLOWS OF THE COMPANY :
Advanced payment by the customers
Sundry debtors / receivables
Export incentives
Other income
CASH OUTFLOWS OF THE COMPANY :
Sundry creditor’s payment
Account payable
Other expenses
Wages and salary
OXFORD College Of Business administration, Hubli 40
VRL LOGISTICS pvt ltd Varur-Hubli
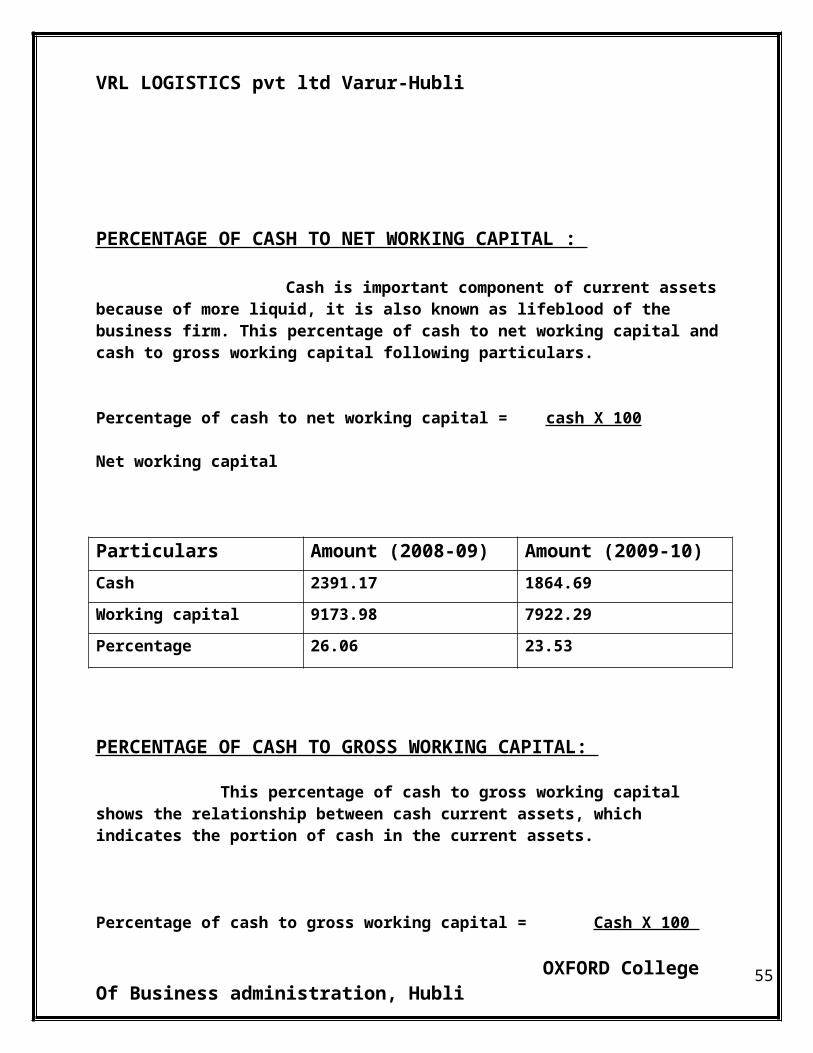
PERCENTAGE OF CASH TO NET WORKING CAPITAL :
Cash is important component of current assets because of more liquid, it is also known as lifeblood of the business firm. This percentage of cash to net working capital and cash to gross working capital following particulars.
Percentage of cash to net working capital = cash X 100 Net working capital
Particulars Amount (2008-09) Amount (2009-10)
Cash 2391.17 1864.69
Working capital 9173.98 7922.29
Percentage 26.06 23.53
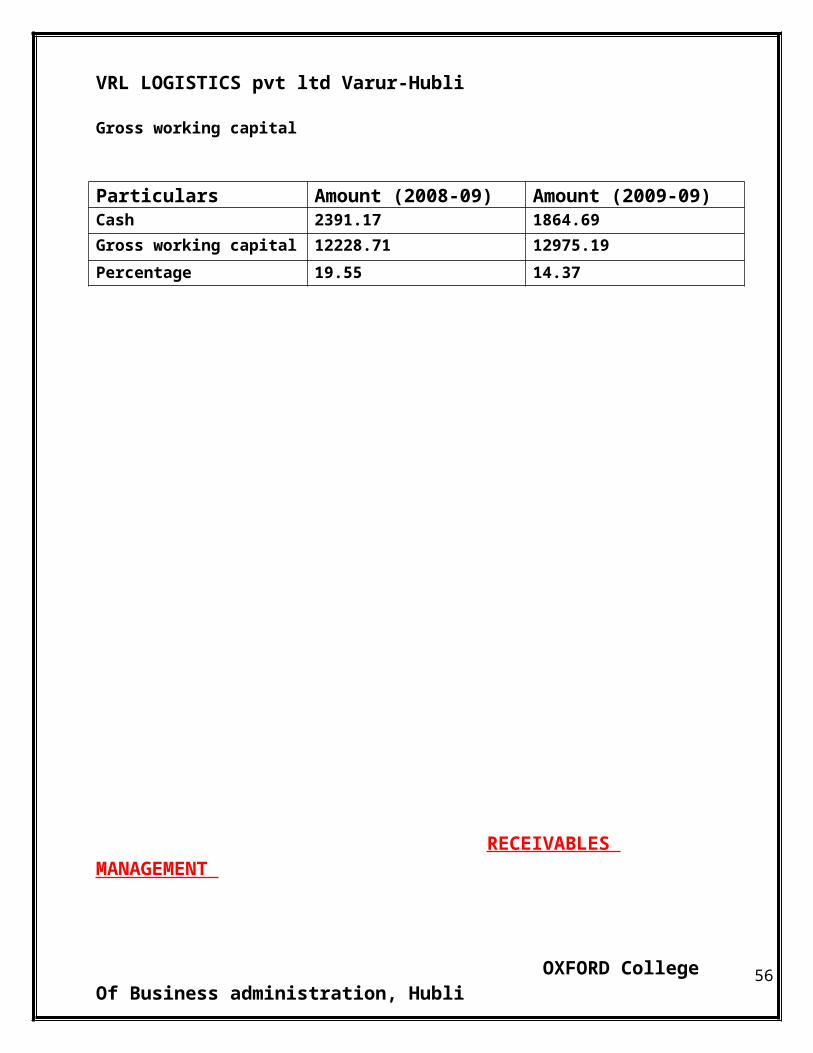
PERCENTAGE OF CASH TO GROSS WORKING CAPITAL:
This percentage of cash to gross working capital shows the relationship between cash current assets, which indicates the portion of cash in the current assets.
Percentage of cash to gross working capital = Cash X 100 Gross working capital
Particulars Amount (2008-09) Amount (2009-09) Cash 2391.17 1864.69
Gross working capital 12228.71 12975.19
Percentage 19.55 14.37
OXFORD College Of Business administration, Hubli 41
VRL LOGISTICS pvt ltd Varur-Hubli
RECEIVABLES MANAGEMENT
OXFORD College Of Business administration, Hubli 42
VRL LOGISTICS pvt ltd Varur-Hubli
RECEIVABLE MANAGEMENT
MEANING :
Receivables contribution a substantial portion of current assets of several firms e.g. in India tread debtors, after in ventures one the major components of current assets. They from about one third of current assets in India granting credit and creating debtors amount to the blocking of the company’s funds. The interval between the date of sale and payment has to be financed out of working capital. These necessities the firm to get funds from banks or other sources. thus trade debtors represent investment, as substantial amounts are ties up in trade debtor’s, it needs careful analysis and proper management.
OBJECTIVES :
The following are the objectives of receivables management
a. To maintain the good will of the company in the minds of customers :
Good will is an intangible asset clearly specifies the reputation of the company to maintain the good will in the customers mind is essential because good will is only the alternative food for long life of the company there fore providing credit facility to the customers is to maintain the reputation.
b. To have the regular customers
Providing credit facility is to protect its sales from the competition and to attract the potential customers to buy its products at favorable terms. Regular customers are like KEB etc.
OXFORD College Of Business administration, Hubli 43
VRL LOGISTICS pvt ltd Varur-Hubli
ESTABLISHING OPTIMUM CREDIT POLICY :
A company’s investment in accounts receivable depends on :
a) Volume of credit sales
b) Collection period
The volume of credit sales is a functions of the firm’s total sales and percentage of credit sales to total sales. Total sales depend on market size firm’s market share product quality. Intensity of competition economic conditions etc. the financial manager hardly has any control over these variables. The percentage of credit sales to total sales are mostly influenced by the native of business and industry norms.
The term credit policy is used to refer to the combination of the decision variables they are-
i. Credit standard
ii. Credit terms
iii. Collections efforts
On which the financial manager has influence.
THE CREDIT STANDARD :
It is the criteria to decide the types of customer’s to whom goods could be sold on credit. It a company has more slow playing customers its investment in account receivables. will increase. The company will also expose to higher risk of default. Credit terms specify duration of credit and terms of payment by customer’s investment accounts receivables will be high if the customers are allowed extended time period for making payments collection efforts. Determine the actual collection period. The lower the collection period, the lower investment in accounts receivables and vice-versa.
OXFORD College Of Business administration, Hubli 44
VRL LOGISTICS pvt ltd Varur-Hubli
OPTIMUM CREDIT – POLICY : A Cost Benefit – Analysis :
The firm operating is maximized when total cost is maximized for a given level of revenue. Optimum credit policy is one, which maximize the company’s value. The value of the company is maximized when the incremental rate of return on investment is equal to the incremental cost of funds to finance the investment. As the firm looses its credit policy. Its investment in accounts receivable becomes more risky because of increase in slow paying and defaulting accounts.
Thus we many state that goal of the firm’s credit policy is to maximize the value of the company. To achieve this goal the evaluation of investment in accounts receivable should involve the following steps.
Estimation of incremental operating profit
Estimation of the incremental investment in account receivables
Estimation of the incremental rate of return of investment
Comparison of the rate of return with the required rate of return.
CREDIT TERM :
The stipulations under which the sells on credit to customers are called credit terms. These stipulations include : a) the credit period b) the cash discount
CREDIT PERIOD :
The length of time for which credit is expected to customers is called the credit period. It is generally started in terms of a net date. A firm’s credit period may be governed by the industry norms. However, depending on its objectives, the firm can lengthen the credit period on the other hand. The company may tighten it credit period if customers are defaulting too frequently and bad looses are building up.
OXFORD College Of Business administration, Hubli 45
VRL LOGISTICS pvt ltd Varur-Hubli
COLLECTION PERIOD :
A collection policy is needed because all customers are slow payers while some are nonpayer. The collection efforts should there fore at accelerating collections from slow payers and reducing bad debts looses. A collection policy should ensure prompt collection is needed for fast turnover of working capital keeping collection costs and bad debts within limits and maintaining collection efficiency. Regularity in collections keeps debtors alert and they tend to pay their dues promptly.
Receivables management at Patil Electric Works :
a) To achieve growth in sales
b) To increase profit
c) To meet competition
Credit policy variables in Patil Electric Works
Credit policy has important implication for the co0mpany’s production, marketing and finance functions.
CREDIT STANDARDS :
Credit standard are the criteria, which a firm follows in selecting customers for the purpose of extension.
OXFORD College Of Business administration, Hubli 46
VRL LOGISTICS pvt ltd Varur-Hubli
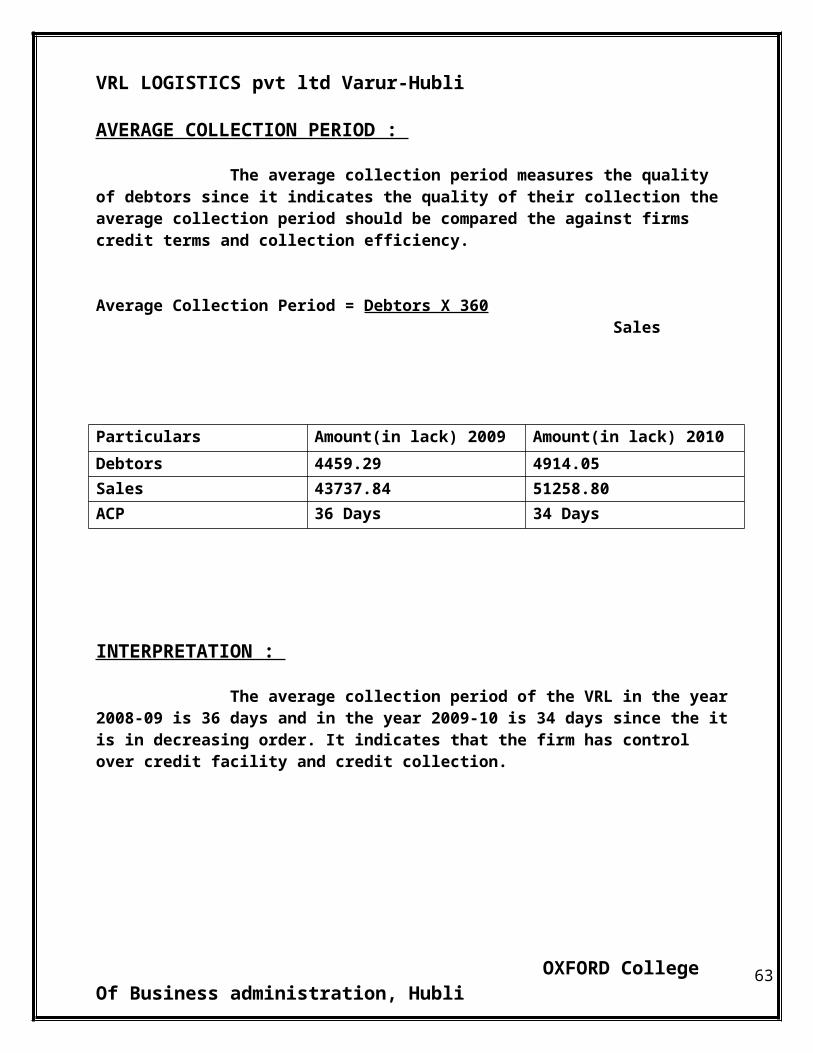
AVERAGE COLLECTION PERIOD :
The average collection period measures the quality of debtors since it indicates the quality of their collection the average collection period should be compared the against firms credit terms and collection efficiency.
Average Collection Period = Debtors X 360 Sales
Particulars Amount(in lack) 2009 Amount(in lack) 2010
Debtors 4459.29 4914.05
Sales 43737.84 51258.80
ACP 36 Days 34 Days
INTERPRETATION :
The average collection period of the VRL in the year 2008-09 is 36 days and in the year 2009-10 is 34 days since the it is in decreasing order. It indicates that the firm has control over credit facility and credit collection.
OXFORD College Of Business administration, Hubli 47
VRL LOGISTICS pvt ltd Varur-Hubli
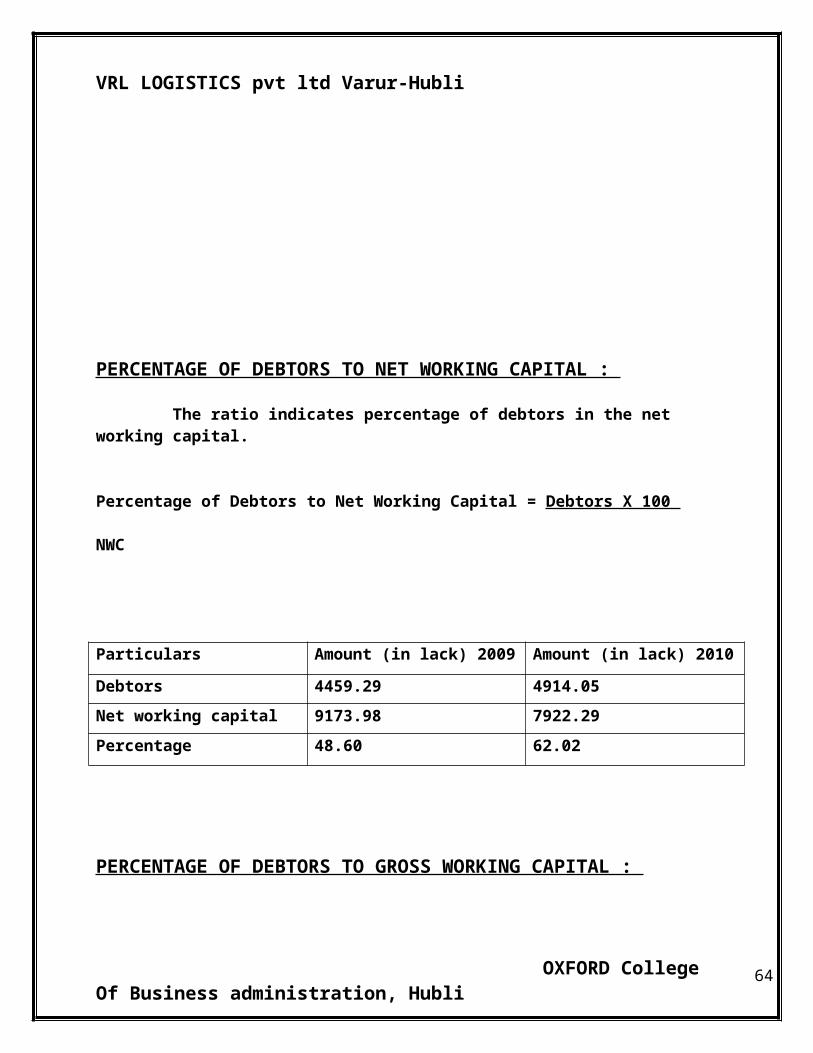
PERCENTAGE OF DEBTORS TO NET WORKING CAPITAL :
The ratio indicates percentage of debtors in the net working capital.
Percentage of Debtors to Net Working Capital = Debtors X 100 NWC
Particulars Amount (in lack) 2009 Amount (in lack) 2010
Debtors 4459.29 4914.05
Net working capital 9173.98 7922.29
Percentage 48.60 62.02
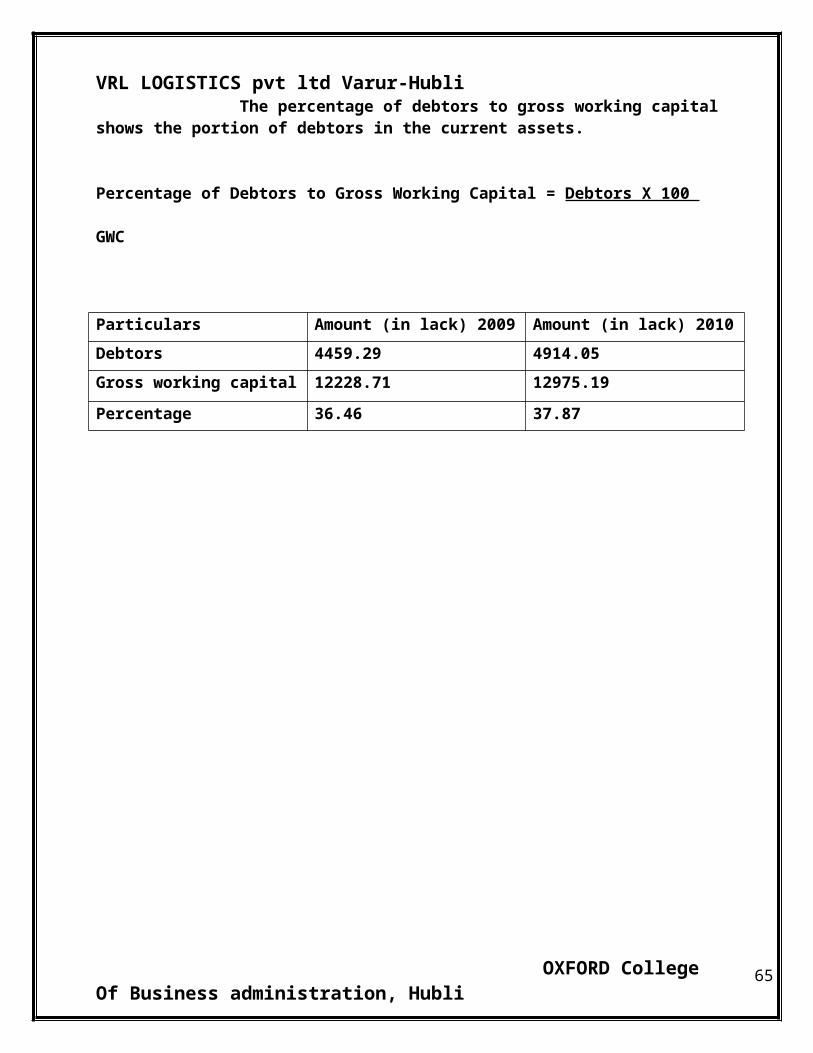
PERCENTAGE OF DEBTORS TO GROSS WORKING CAPITAL :
The percentage of debtors to gross working capital shows the portion of debtors in the current assets.
Percentage of Debtors to Gross Working Capital = Debtors X 100 GWC
Particulars Amount (in lack) 2009 Amount (in lack) 2010
Debtors 4459.29 4914.05
Gross working capital 12228.71 12975.19
Percentage 36.46 37.87
OXFORD College Of Business administration, Hubli 48
VRL LOGISTICS pvt ltd Varur-Hubli
DATA ANALYSIS AND INTERPRETATION
OXFORD College Of Business administration, Hubli 49
VRL LOGISTICS pvt ltd Varur-Hubli
DATA ANALYSIS AND INTERPRETATION
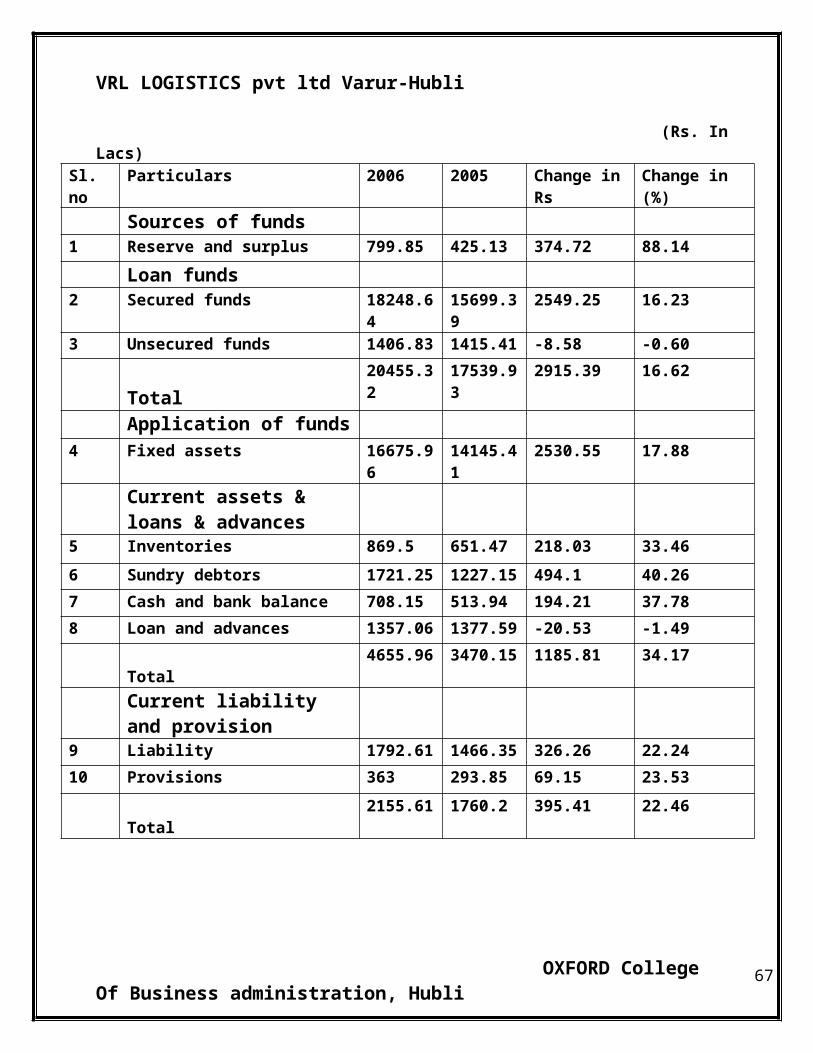
BALANCE SHEET FOR THE YEAR 2005-2006
(Rs. In Lacs)Sl. no Particulars 2006 2005 Change in Rs Change in (%)
Sources of funds 1 Reserve and surplus 799.85 425.13 374.72 88.14
Loan funds2 Secured funds 18248.64 15699.39 2549.25 16.23
3 Unsecured funds 1406.83 1415.41 -8.58 -0.60
Total 20455.32 17539.93 2915.39 16.62
Application of funds
4 Fixed assets 16675.96 14145.41 2530.55 17.88
Current assets & loans & advances
5 Inventories 869.5 651.47 218.03 33.46
6 Sundry debtors 1721.25 1227.15 494.1 40.26
7 Cash and bank balance 708.15 513.94 194.21 37.78
8 Loan and advances 1357.06 1377.59 -20.53 -1.49
Total 4655.96 3470.15 1185.81 34.17
Current liability and provision
9 Liability 1792.61 1466.35 326.26 22.24
10 Provisions 363 293.85 69.15 23.53
Total 2155.61 1760.2 395.41 22.46
OXFORD College Of Business administration, Hubli 50
VRL LOGISTICS pvt ltd Varur-Hubli
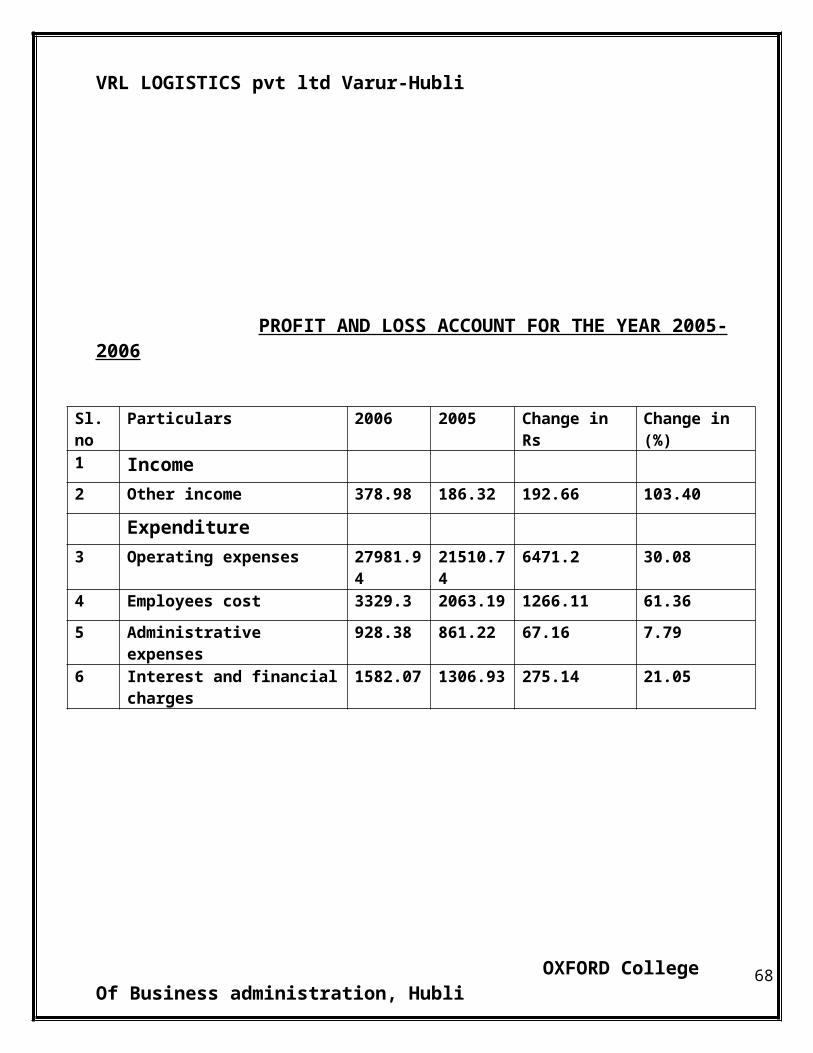
PROFIT AND LOSS ACCOUNT FOR THE YEAR 2005-2006
Sl.no Particulars 2006 2005 Change in Rs Change in (%)
1 Income
2 Other income 378.98 186.32 192.66 103.40
Expenditure
3 Operating expenses 27981.94 21510.74 6471.2 30.08
4 Employees cost 3329.3 2063.19 1266.11 61.36
5 Administrative expenses 928.38 861.22 67.16 7.79
6 Interest and financial charges 1582.07 1306.93 275.14 21.05
OXFORD College Of Business administration, Hubli 51
VRL LOGISTICS pvt ltd Varur-Hubli
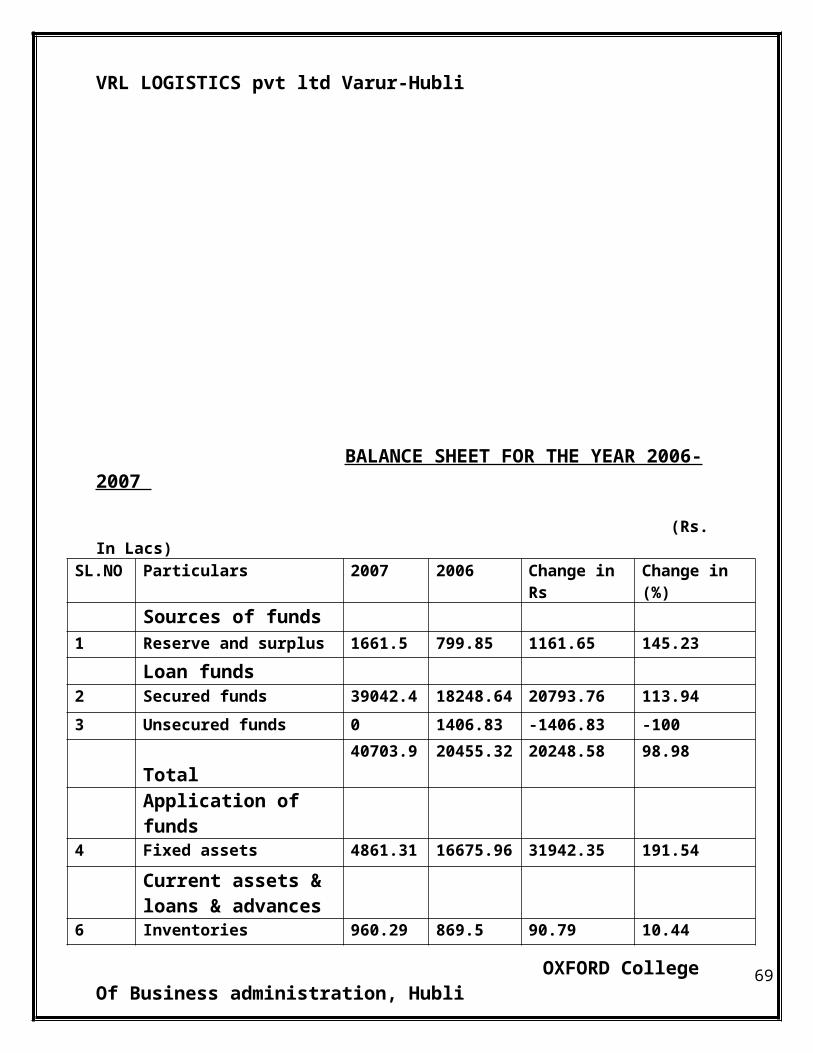
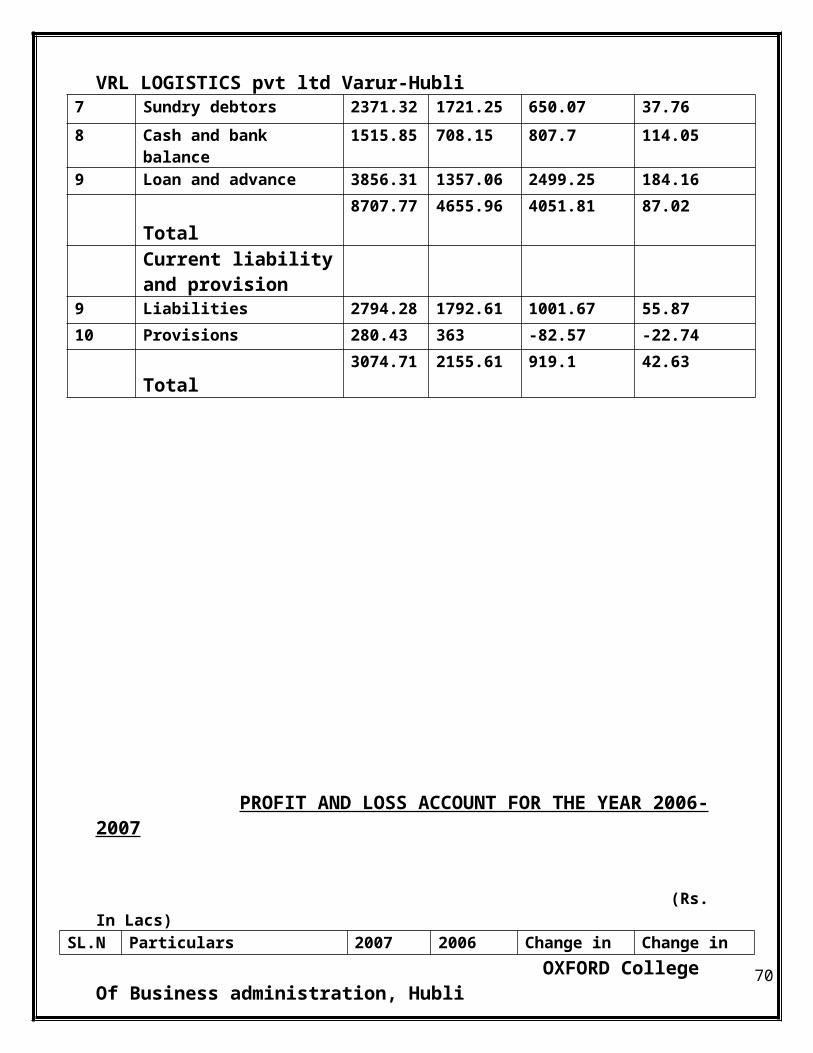
BALANCE SHEET FOR THE YEAR 2006-2007
(Rs. In Lacs)SL.NO Particulars 2007 2006 Change in Rs Change in (%)
Sources of funds
1 Reserve and surplus 1661.5 799.85 1161.65 145.23
Loan funds2 Secured funds 39042.4 18248.64 20793.76 113.94
3 Unsecured funds 0 1406.83 -1406.83 -100
Total 40703.9 20455.32 20248.58 98.98
Application of funds 4 Fixed assets 4861.31 16675.96 31942.35 191.54
Current assets & loans & advances
6 Inventories 960.29 869.5 90.79 10.44
7 Sundry debtors 2371.32 1721.25 650.07 37.76
8 Cash and bank balance 1515.85 708.15 807.7 114.05
9 Loan and advance 3856.31 1357.06 2499.25 184.16
Total 8707.77 4655.96 4051.81 87.02
Current liability and provision
9 Liabilities 2794.28 1792.61 1001.67 55.87
10 Provisions 280.43 363 -82.57 -22.74
Total 3074.71 2155.61 919.1 42.63
OXFORD College Of Business administration, Hubli 52
VRL LOGISTICS pvt ltd Varur-Hubli
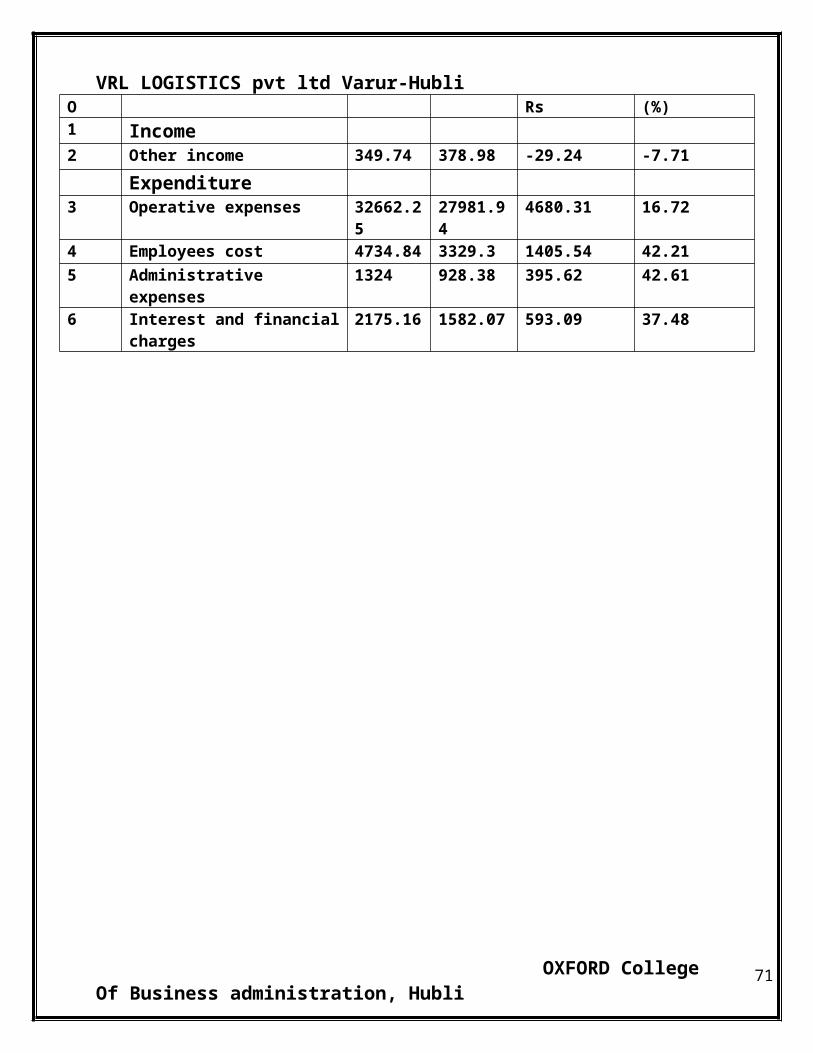
PROFIT AND LOSS ACCOUNT FOR THE YEAR 2006-2007
(Rs. In Lacs)SL.NO Particulars 2007 2006 Change in Rs Change in (%)
1 Income 2 Other income 349.74 378.98 -29.24 -7.71
Expenditure 3 Operative expenses 32662.25 27981.94 4680.31 16.72
4 Employees cost 4734.84 3329.3 1405.54 42.21
5 Administrative expenses 1324 928.38 395.62 42.61
6 Interest and financial charges 2175.16 1582.07 593.09 37.48
OXFORD College Of Business administration, Hubli 53
VRL LOGISTICS pvt ltd Varur-Hubli
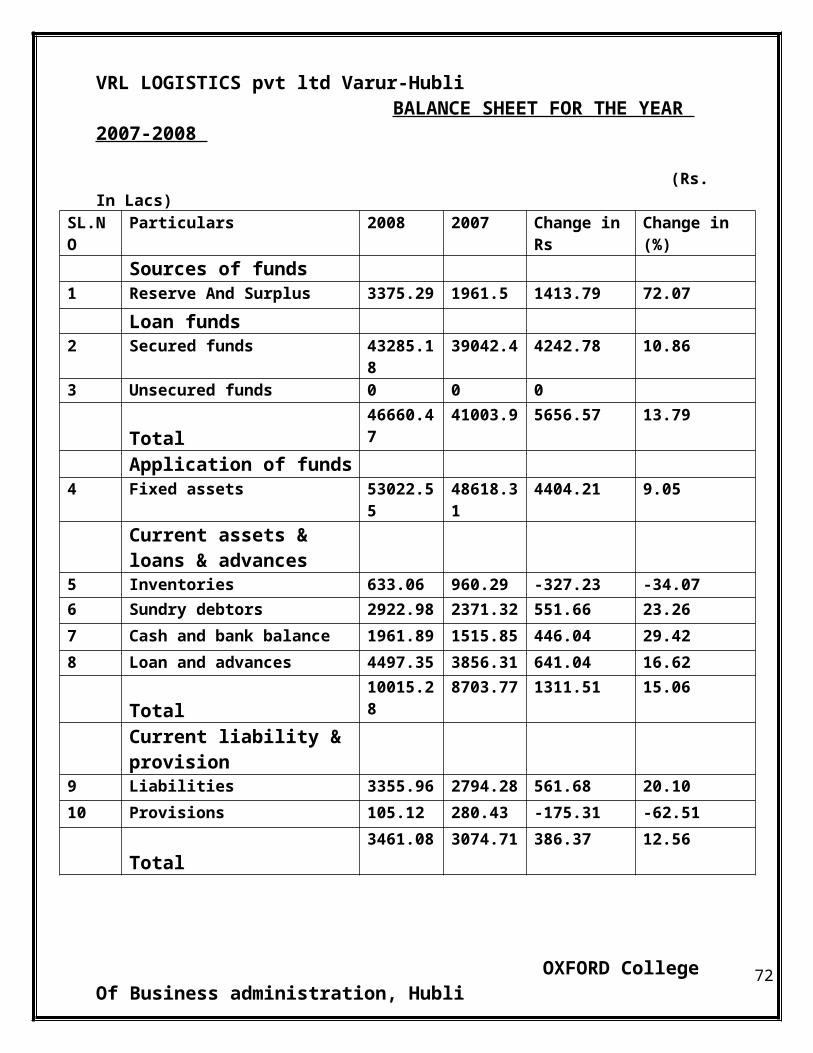
BALANCE SHEET FOR THE YEAR 2007-2008
(Rs. In Lacs)SL.NO Particulars 2008 2007 Change in Rs Change in (%)
Sources of funds1 Reserve And Surplus 3375.29 1961.5 1413.79 72.07
Loan funds2 Secured funds 43285.18 39042.4 4242.78 10.86
3 Unsecured funds 0 0 0
Total 46660.47 41003.9 5656.57 13.79
Application of funds4 Fixed assets 53022.55 48618.31 4404.21 9.05
Current assets & loans & advances
5 Inventories 633.06 960.29 -327.23 -34.07
6 Sundry debtors 2922.98 2371.32 551.66 23.26
7 Cash and bank balance 1961.89 1515.85 446.04 29.42
8 Loan and advances 4497.35 3856.31 641.04 16.62
Total 10015.28 8703.77 1311.51 15.06
Current liability & provision
9 Liabilities 3355.96 2794.28 561.68 20.10
10 Provisions 105.12 280.43 -175.31 -62.51
Total 3461.08 3074.71 386.37 12.56
OXFORD College Of Business administration, Hubli 54
VRL LOGISTICS pvt ltd Varur-Hubli
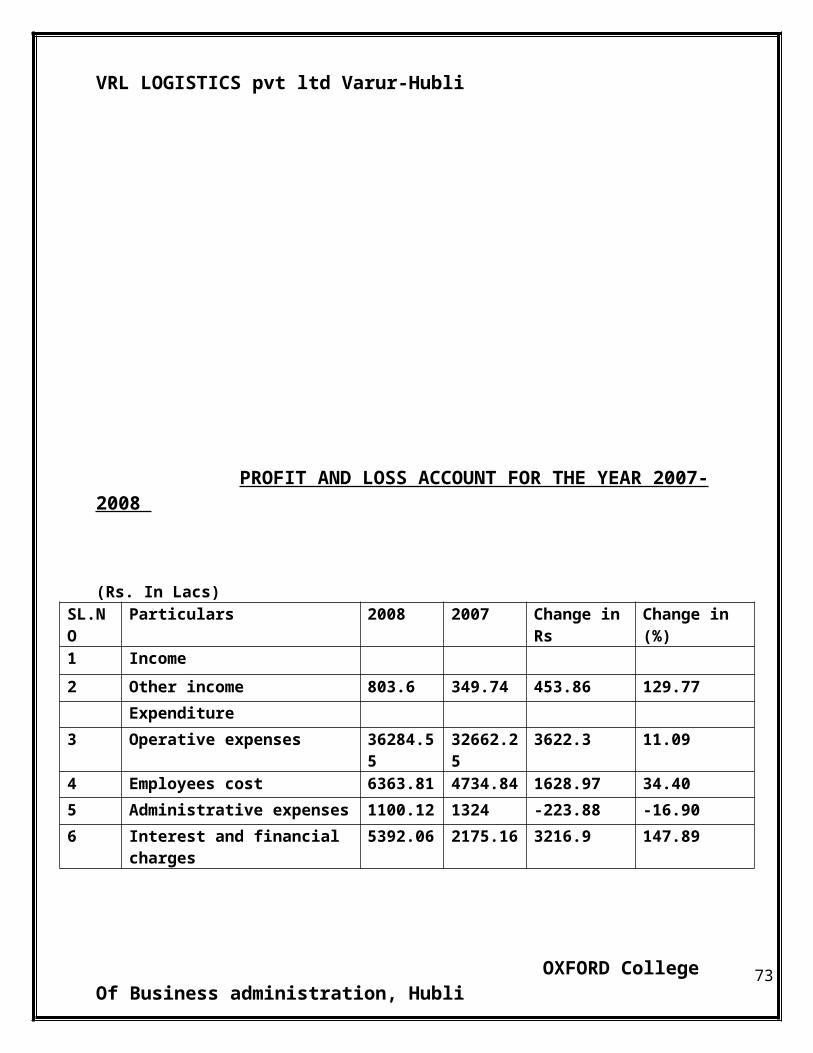
PROFIT AND LOSS ACCOUNT FOR THE YEAR 2007-2008
(Rs. In Lacs)SL.NO Particulars 2008 2007 Change in Rs Change in (%)
1 Income
2 Other income 803.6 349.74 453.86 129.77
Expenditure
3 Operative expenses 36284.55 32662.25 3622.3 11.09
4 Employees cost 6363.81 4734.84 1628.97 34.40
5 Administrative expenses 1100.12 1324 -223.88 -16.90
6 Interest and financial charges 5392.06 2175.16 3216.9 147.89
OXFORD College Of Business administration, Hubli 55
VRL LOGISTICS pvt ltd Varur-Hubli
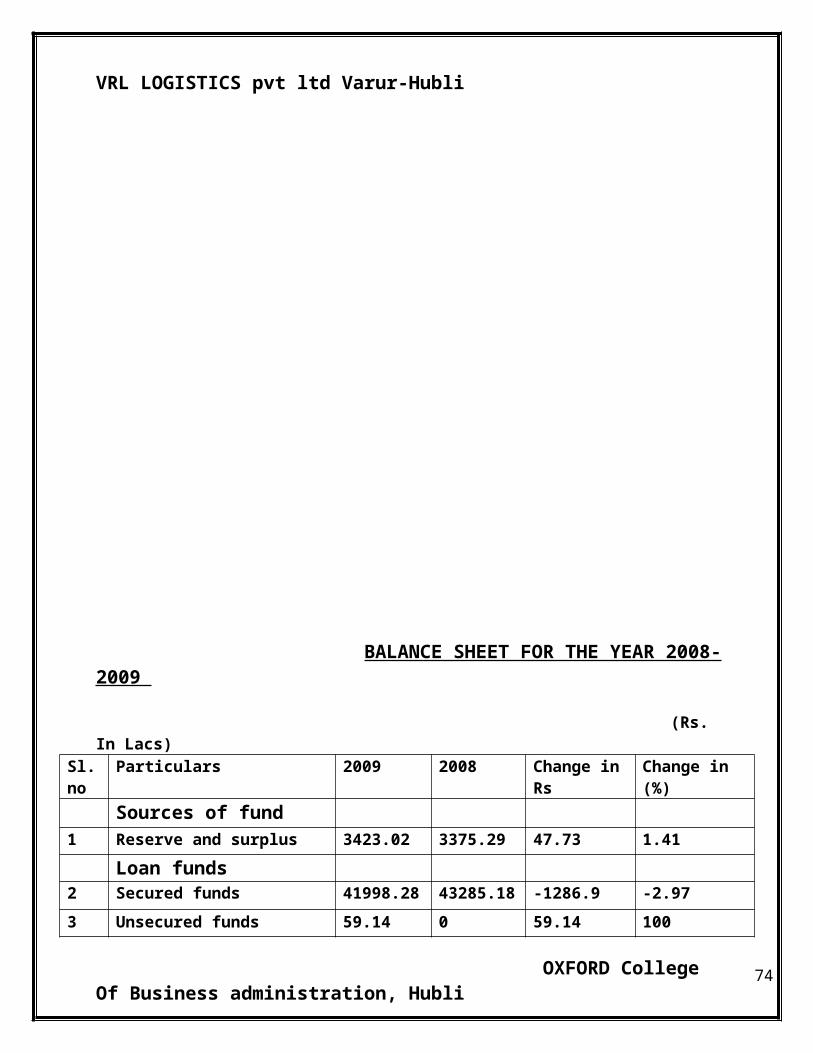
BALANCE SHEET FOR THE YEAR 2008-2009
(Rs. In Lacs)Sl.no Particulars 2009 2008 Change in Rs Change in (%)
Sources of fund
1 Reserve and surplus 3423.02 3375.29 47.73 1.41
Loan funds2 Secured funds 41998.28 43285.18 -1286.9 -2.97
3 Unsecured funds 59.14 0 59.14 100
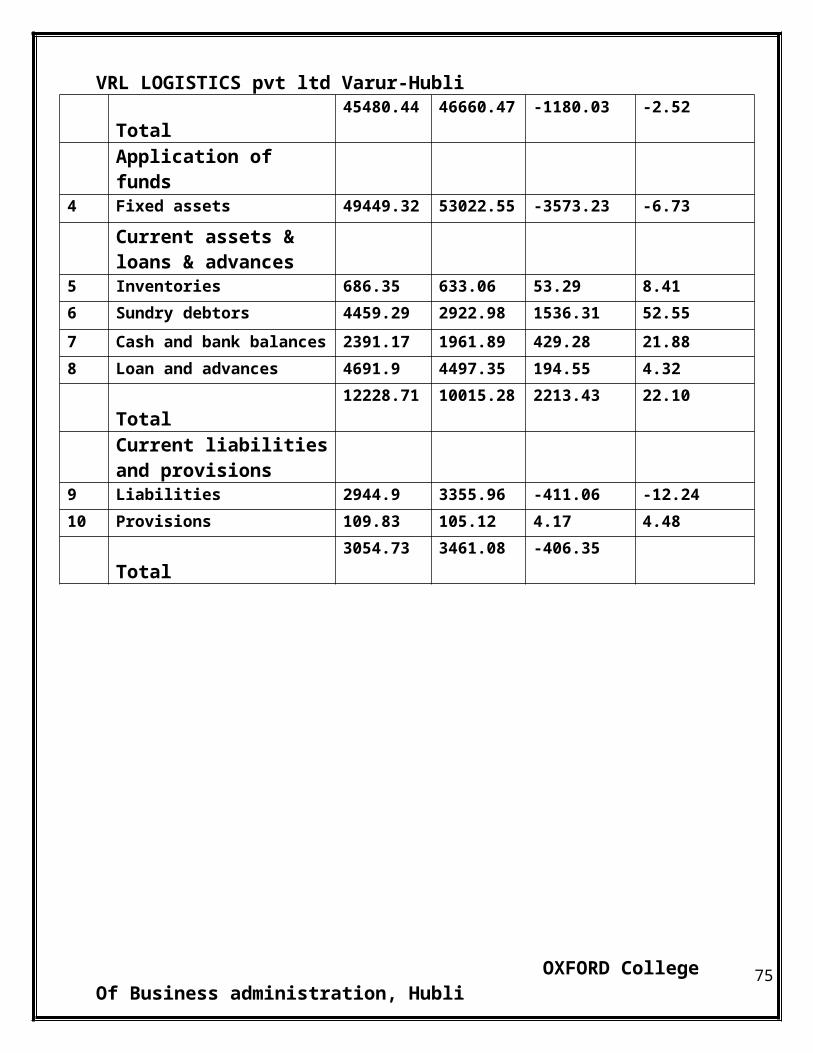
Total 45480.44 46660.47 -1180.03 -2.52
Application of funds4 Fixed assets 49449.32 53022.55 -3573.23 -6.73
Current assets & loans & advances
5 Inventories 686.35 633.06 53.29 8.41
6 Sundry debtors 4459.29 2922.98 1536.31 52.55
7 Cash and bank balances 2391.17 1961.89 429.28 21.88
8 Loan and advances 4691.9 4497.35 194.55 4.32
Total 12228.71 10015.28 2213.43 22.10
Current liabilities and provisions
9 Liabilities 2944.9 3355.96 -411.06 -12.24
10 Provisions 109.83 105.12 4.17 4.48
Total 3054.73 3461.08 -406.35
OXFORD College Of Business administration, Hubli 56
VRL LOGISTICS pvt ltd Varur-Hubli
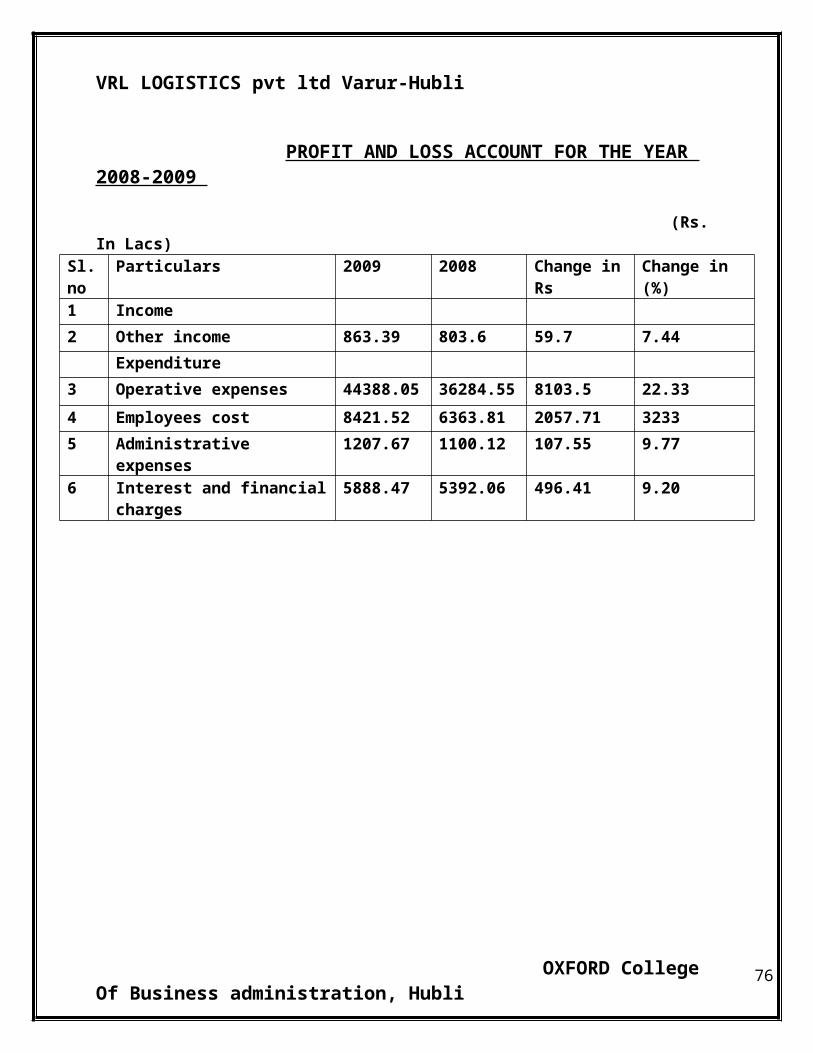
PROFIT AND LOSS ACCOUNT FOR THE YEAR 2008-2009
(Rs. In Lacs)Sl.no Particulars 2009 2008 Change in Rs Change in (%)
1 Income
2 Other income 863.39 803.6 59.7 7.44
Expenditure
3 Operative expenses 44388.05 36284.55 8103.5 22.33
4 Employees cost 8421.52 6363.81 2057.71 3233
5 Administrative expenses 1207.67 1100.12 107.55 9.77
6 Interest and financial charges 5888.47 5392.06 496.41 9.20
OXFORD College Of Business administration, Hubli 57
VRL LOGISTICS pvt ltd Varur-Hubli
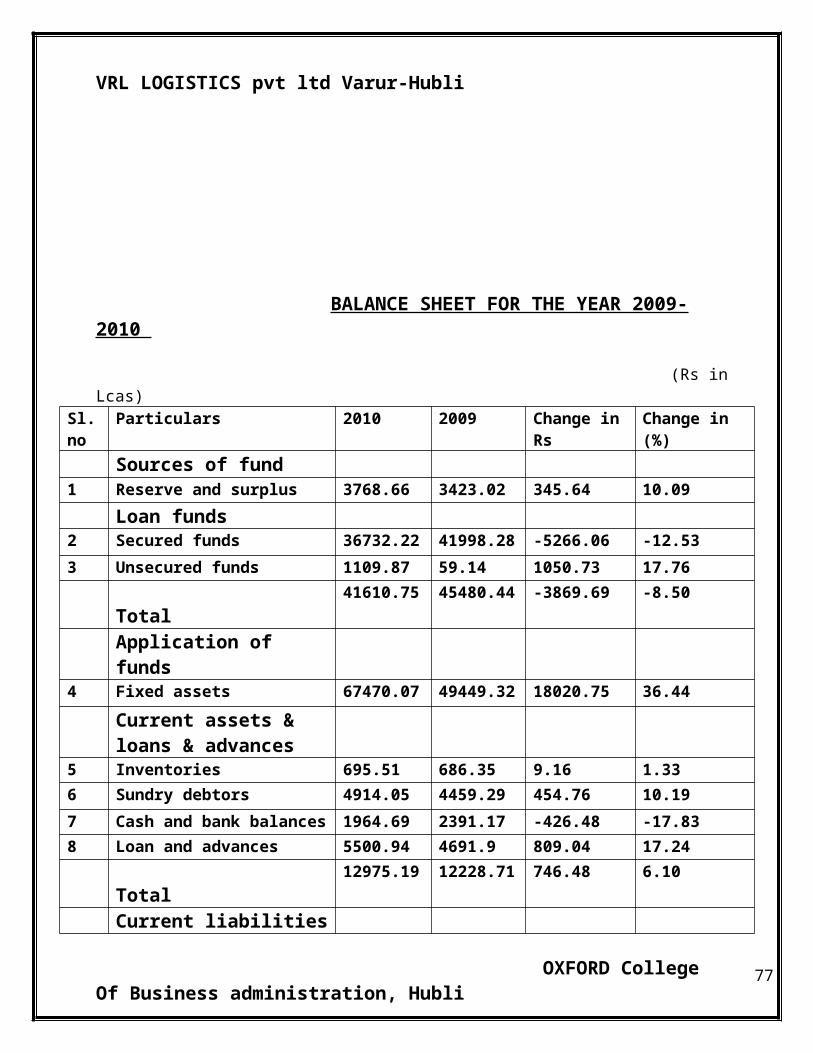
BALANCE SHEET FOR THE YEAR 2009-2010
(Rs in Lcas)Sl.no Particulars 2010 2009 Change in Rs Change in (%)
Sources of fund1 Reserve and surplus 3768.66 3423.02 345.64 10.09
Loan funds2 Secured funds 36732.22 41998.28 -5266.06 -12.53
3 Unsecured funds 1109.87 59.14 1050.73 17.76
Total 41610.75 45480.44 -3869.69 -8.50
Application of funds4 Fixed assets 67470.07 49449.32 18020.75 36.44
Current assets & loans & advances
5 Inventories 695.51 686.35 9.16 1.33
6 Sundry debtors 4914.05 4459.29 454.76 10.19
7 Cash and bank balances 1964.69 2391.17 -426.48 -17.83
8 Loan and advances 5500.94 4691.9 809.04 17.24
Total 12975.19 12228.71 746.48 6.10
Current liabilities and provisions
9 Liabilities 3815.18 2944.9 870.28 29.55
10 Provisions 1237.72 109.83 1127.89 10.26
Total 5052.90 2835.07 2217.83 78.22
OXFORD College Of Business administration, Hubli 58
VRL LOGISTICS pvt ltd Varur-Hubli
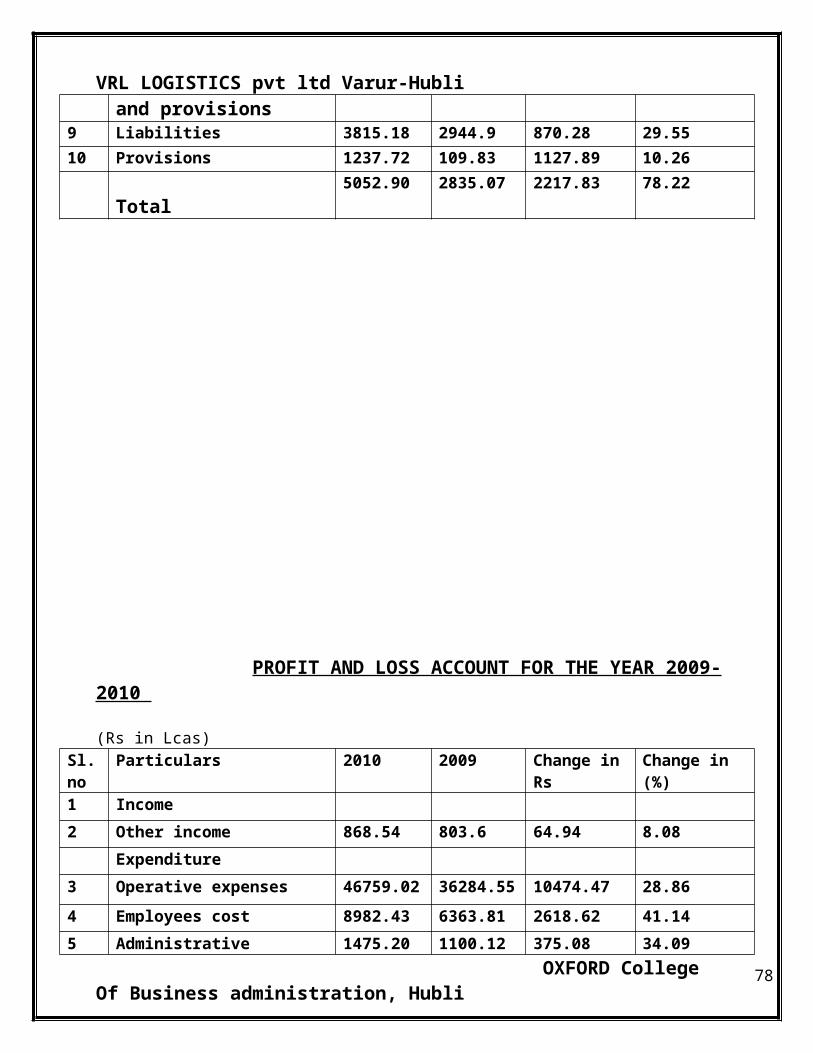
PROFIT AND LOSS ACCOUNT FOR THE YEAR 2009-2010
(Rs in Lcas)Sl.no Particulars 2010 2009 Change in Rs Change in (%)
1 Income
2 Other income 868.54 803.6 64.94 8.08
Expenditure
3 Operative expenses 46759.02 36284.55 10474.47 28.86
4 Employees cost 8982.43 6363.81 2618.62 41.14
5 Administrative expenses 1475.20 1100.12 375.08 34.09
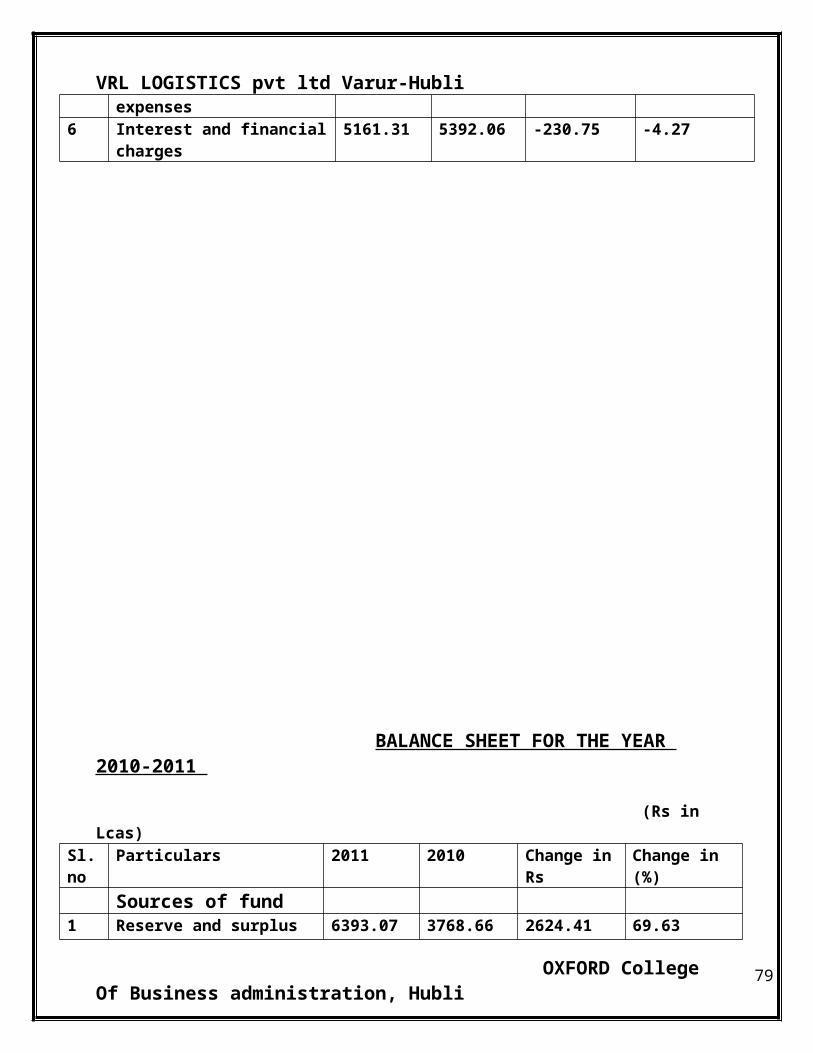
6 Interest and financial charges 5161.31 5392.06 -230.75 -4.27
OXFORD College Of Business administration, Hubli 59
VRL LOGISTICS pvt ltd Varur-Hubli
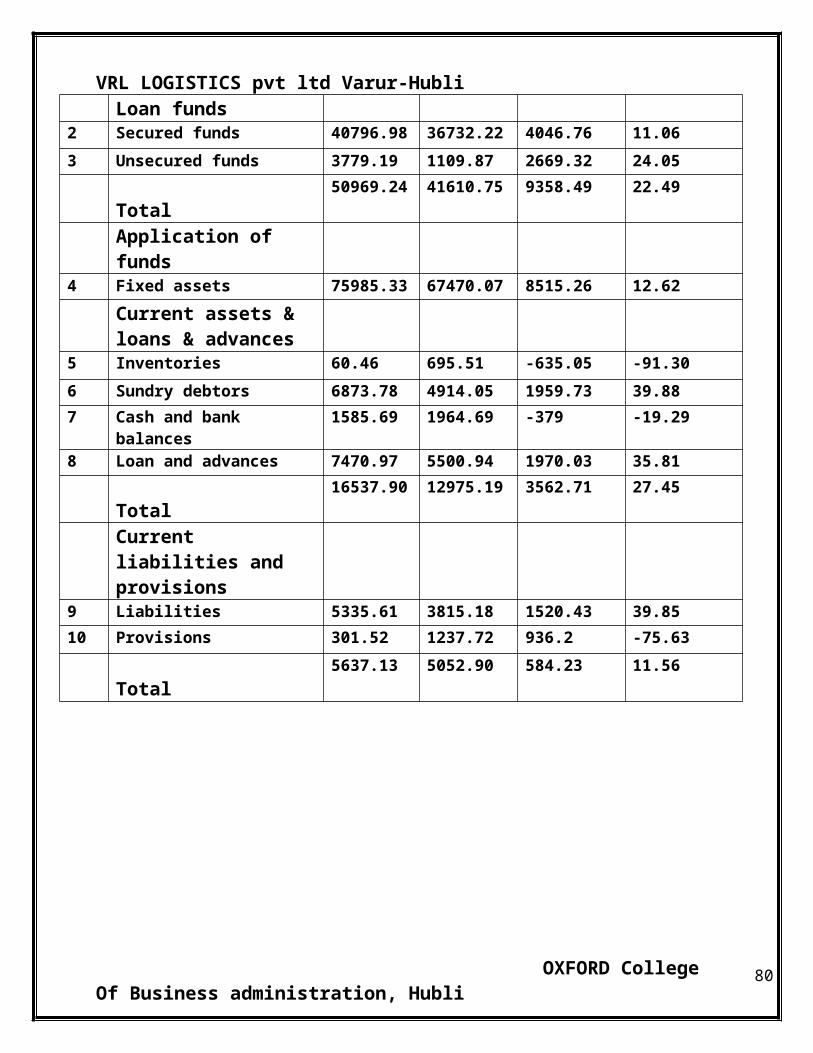
BALANCE SHEET FOR THE YEAR 2010-2011
(Rs in Lcas)Sl.no Particulars 2011 2010 Change in Rs Change in (%)
Sources of fund1 Reserve and surplus 6393.07 3768.66 2624.41 69.63
Loan funds2 Secured funds 40796.98 36732.22 4046.76 11.06
3 Unsecured funds 3779.19 1109.87 2669.32 24.05
Total 50969.24 41610.75 9358.49 22.49
Application of funds4 Fixed assets 75985.33 67470.07 8515.26 12.62
Current assets & loans & advances
5 Inventories 60.46 695.51 -635.05 -91.30
6 Sundry debtors 6873.78 4914.05 1959.73 39.88
7 Cash and bank balances 1585.69 1964.69 -379 -19.29
8 Loan and advances 7470.97 5500.94 1970.03 35.81
Total 16537.90 12975.19 3562.71 27.45
Current liabilities and provisions
9 Liabilities 5335.61 3815.18 1520.43 39.85
10 Provisions 301.52 1237.72 936.2 -75.63
Total 5637.13 5052.90 584.23 11.56
OXFORD College Of Business administration, Hubli 60
VRL LOGISTICS pvt ltd Varur-Hubli
PROFIT AND LOSS ACCOUNT FOR THE YEAR 2010-2011
(Rs in Lcas)Sl.no Particulars 2011 2010 Change in Rs Change in (%)
1 Income
2 Other income 1095.16 868.54 226.62 26.06
Expenditure
3 Operative expenses 60336.08 46759.02 13577.06 29.03
4 Employees cost 10448.23 8982.43 1465.8 16.31
5 Administrative expenses 1425.35 1475.20 -49.85 -3.37
6 Interest and financial charges 4874.64 5161.31 -286.67 -5.55
OXFORD College Of Business administration, Hubli 61
VRL LOGISTICS pvt ltd Varur-Hubli
ANANLYSIS OF PERCENTAGE CHANGE IN RUPEES FOR THE PERIOD 2005-06 TO 2010-11
Sl.no Particulars 2005-06 2006-07 2007-08 2008-09 2009-10 2010-11
1 Reserves & surplus 88% 145% 72% 1.41% 10.09 69.63
2 Inventories 33% 10% -34% 8.42% 1.33 -91.30
3 Sundry debtors 40% 37% 23% 53% 10.19 39.88
4 Cash & bank balance 37% 114% 29% 22% -17.83 -19.29
5 Liabilities 22% 55% 20% -12% 29.55 39.85
6 Other income 103% -8% 129% 7% 8.08 26.06
7 Operative expense 30% 17% 11% 22% 28.86 29.03
8 Administrative expense 8% 43% -16% 10% 34.09 -3.37
9 Interest & financial charge
21% 37% 148% 9% -4.27 -5.55
OXFORD College Of Business administration, Hubli 62
VRL LOGISTICS pvt ltd Varur-Hubli
CURRENT ASSETS
CASH AND BANK BALANCE FROM 2006-07 TO 2010-11
YEAR AMOUNT DIFFERENCE
2006-2007 1515.85 807.07
2007-2008 1961.89 446.04
2008-2009 2391.17 429.28
2009-2010 1864.69 526.48
2010-2011 1585.69 279
807.07
446.04 429.28526.48
279
0
200
400
600
800
1000A
M
O
U
N
T
2006-2007
2007-2008
2008-2009
2009-2010
2010-2011
YEAR
DIFFERENCE
The bank are the substitutes for cash are most liquid for the company. The more cash and bank balance may be required when there is more operation to be done. In the last 4 years it has be clear that the highest growth in cash and bank balance found in the year 2006-07 (807.07)
OXFORD College Of Business administration, Hubli 63
VRL LOGISTICS pvt ltd Varur-Hubli
SUNDRY DEBTORS FROM 2006-07 TO 2010-11
YEAR AMOUNT DIFFERENCE2006-2007 2371.32 650.07
2007-2008 2922.98 551.66
2008-2009 4459.29 1536.31
2009-2010 4914.05 454.76
2010-2011 6873.78 1959.73
650.07 551.66
1536.31
454.76
1959.73
0
500
1000
1500
2000A
M
O
U
N
T
2006-2007
2007-2008
2008-2009
2009-2010
2010-2011
YEAR
DIFFERENCE
Sundry debtors are debts owned by the customer as good are sold on credit basis and are considered to be the most liquid current assets for the firm. As for the calculation, the highest rate in debtors found in the year 2010-11 at rate (1959.73)
OXFORD College Of Business administration, Hubli 64
VRL LOGISTICS pvt ltd Varur-Hubli
INVENTORIES FROM 2006-07 TO 2010-11
YEAR AMOUNT DIFFERENCE2006-2007 960.29 9.79
2007-2008 633.06 327.23
2008-2009 686.35 -53.29
2009-2010 695.51 -9.16
2010-2011 607.46 88.05
9.79
327.23
-53.29 -9.1688.05
-100
0
100
200
300
400A
M
O
U
N
T
2006-2007
2007-2008
2008-2009
2009-2010
2010-2011
YEAR
DIFFERENCE
The inventories constitute that major part of the current assets. The difference change in growth highest rate over the last 5 years 2007-08 (327.23)
OXFORD College Of Business administration, Hubli 65
VRL LOGISTICS pvt ltd Varur-Hubli
CURRENT LIABILITIES
SUNDRY CREDITORS FROM 2006-07 TO 2010-11
YEAR AMOUNT DIFFERENCE2006-2007 2794.28 1197.97
2007-2008 3355.96 561.68
2008-2009 2944.90 411.06
2009-2010 3815.18 870.28
2010-2011 5335.61 1520.43
1197.97
561.68411.06
870.28
1520.43
0
500
1000
1500
2000A
M
O
U
N
T
2006-2007
2007-2008
2008-2009
2009-2010
2010-2011
YEAR
DIFFERENCE
It may be inferred that the sundry creditors increases to during the year of 2006-07 (1197.97) as compared to present year 2010-11 (-1520.43) it will not increase.
OXFORD College Of Business administration, Hubli 66
VRL LOGISTICS pvt ltd Varur-Hubli
OTHER LIABILITIES FROM 2006-07 TO 2010-11
YEAR AMOUNT DIFFERENCE2006-2007 280.43 82.57
2007-2008 105.12 175.31
2008-2009 109.83 -4.17
2009-2010 1237.72 -1127.89
2010-2011 301.52 936.2
82.57 175.31 -4.71
-1127.89
936.2
-1500
-1000-500
0500
1000A
M
O
U
N
T
2006-2007
2007-2008
2008-2009
2009-2010
2010-2011
YEAR
DIFFERENCE
It may be inferred the other liabilities increased to during the year of 2010-11 (936.2). will be compared with the figure of 2009-10 (-1127.89).
OXFORD College Of Business administration, Hubli 67
VRL LOGISTICS pvt ltd Varur-Hubli
Information relating to various current assets and liabilities includes in the year 2006-07
PARTICULARS AMOUNT PERCENTAGE (%)
Current assetsInventories 960.29 19.01%
Sundry debtors 2371.32 48.91%
Cash and bank balance 1515.85 54.44%
Total 4847.46 100.00%
Current liabilities Sundry creditors 2784.28 90.84
Provisions 280.43 9.15
Total 3064.71 100.00%
90.84%
9.15%
0.00%
20.00%
40.00%60.00%
80.00%
100.00%
Sundry
creditors
P rovisions
current liabilities
19.81%
48.91% 54.44%
0.00%10.00%20.00%30.00%40.00%50.00%60.00%
Inventories Sundrydebtors
Cash andbank
balance
current assets
It may be revealed that in the over all composition of sundry creditors ate the highest (90.84%), followed by sundry debtors (48.91%), Inventories (19.01%), Cash and bank balance ( 54.44%), Provisions (9.15%).
OXFORD College Of Business administration, Hubli 68
VRL LOGISTICS pvt ltd Varur-HubliInformation relating to various current assets and liabilities includes in the
year 2007-08
PARTICULARS AMOUNT PERCENTAGE (%)
Current assetsInventories 633.06 11.47%
Sundry debtors 2922.98 52.97%
Cash and bank balance 1961.89 35.55%
Total 5517.93 100.00%
Current liabilities Sundry creditors 3355.96 96.96%
Provisions 105.12 3.03%
Total 3461.08 100.00%
11.47%
52.97% 35.55%
0.00%
20.00%
40.00%
60.00%
Inventories Sundrydebtors
Cash andbank
balance
Current assets
96.96%
3.03%
0.00%
50.00%
100.00%
Sundry creditors Provisions
current liabilities
It may be revealed that in the over all composition of sundry creditors ate the highest (96.96%), followed by sundry debtors (52.97%), Inventories (11.47%), Cash and bank balance ( 35.55%), Provisions (3.03%).
OXFORD College Of Business administration, Hubli 69
VRL LOGISTICS pvt ltd Varur-Hubli
Information relating to various current assets and liabilities includes in the year 2008-09
PARTICULARS AMOUNT PERCENTAGE (%)
Current assetsInventories 686.35 9.10%
Sundry debtors 4459.29 59.16%
Cash and bank balance 2391.17 31.72%
Total 7536.81 100.00%
Current liabilities Sundry creditors 2944.9 96.40%
Provisions 109.83 3.59%
Total 3054.73 100.00%
9.10%
59.16%
31.72%
0.00%
20.00%
40.00%
60.00%
Inventories Sundrydebtors
Cash andbank
balance
Current assets
96.40%
3.59%
0.00%
50.00%
100.00%
Sundry creditors Provisions
Current liabilities
It may be revealed that in the over all composition of sundry creditors ate the highest (96.40%), followed by sundry debtors (59.16%), Inventories (9.10%), Cash and bank balance ( 31.72%), Provisions (3.59%).
OXFORD College Of Business administration, Hubli 70
VRL LOGISTICS pvt ltd Varur-Hubli
Information relating to various current assets and liabilities includes in the year 2009-10
PARTICULARS AMOUNT PERCENTAGE (%)
Current assetsInventories 695.51 9.30%
Sundry debtors 4914.05 65.74%
Cash and bank balance 1864.69 24.94%
Total 7474.25 100.00%
Current liabilities Sundry creditors 3815.18 75.50%
Provisions 1237.72 24.49%
Total 5052.9 100.00%
9.30%
65.74%
24.94%
0.00%20.00%40.00%60.00%80.00%
Inventories Sundrydebtors
Cash andbank
balance
Current assets
75.50%
24.49%
0.00%
20.00%
40.00%
60.00%
80.00%
Sundry creditors Provisions
Current liabilities
It may be revealed that in the over all composition of sundry creditors ate the highest (75.50%), followed by sundry debtors (65.74%), Inventories (9.30%), Cash and bank balance ( 24.94%), Provisions (24.49%).
OXFORD College Of Business administration, Hubli 71
VRL LOGISTICS pvt ltd Varur-HubliInformation relating to various current assets and liabilities includes in the
year 2010-11
PARTICULARS AMOUNT PERCENTAGE (%)
Current assets
Inventories 607.46 6.69%
Sundry debtors 6873.78 75.81%
Cash and bank balance 1585.69 17.48%
Total 9066.93 100.00%
Current liabilities Sundry creditors 5335.61 94.65%
Provisions 301.52 5.34%
Total 5637.13 100.00%
6.69%
75.81%
17.48%
0.00%20.00%40.00%60.00%80.00%
Inventories Sundrydebtors
Cash andbank
balance
Current assets
94.65%
5.34%
0.00%
50.00%
100.00%
Sundry creditors Provisions
Current liabilities
It may be revealed that in the over all composition of sundry creditors ate the highest (75.50%), followed by sundry debtors (65.74%), Inventories (9.30%), Cash and bank balance ( 24.94%), Provisions (24.49%).
OXFORD College Of Business administration, Hubli 72
VRL LOGISTICS pvt ltd Varur-Hubli
ESTIMATION OF NET WORKING CAPITAL
Year Current Assets Current Liabilities
Gross Working Capital
Net Working Capital
2006-2007 4847.46 3064.71 4847.46 1782.75
2007-2008 5517.93 3461.08 5517.93 2056.85
2008-2009 7536.81 3054.73 7536.81 4482.08
2009-2010 7474.25 5052.9 7474.25 2421.35
2010-2011 9066.93 5637.13 9066.93 3429.8
Net Working Capital (CA-CL)
3429.82421.35
4482.08
2056.851782.75
010002000300040005000
2006-2007
2007-2008
2008-2009
2009-2010
2010-2011
YEAR
A
M
O
U
N
T
OXFORD College Of Business administration, Hubli 73
VRL LOGISTICS pvt ltd Varur-Hubli
FINDINGS :
There is a dedicated workers increase in growth of their turnover
They provide good service that leads to customer satisfaction
The company is recommended by Indian books association Mumbai
They provide training facility
They have good brand image
They provide direct and indirect employment to many people
They did not under go any lockout, strike etc
They have new courier service called “CARGO EXPRESS” which refers to the 24 hours of service
The company is having wide network of branches spread all over Karnataka, Andhra Pradesh, Madhya Pradesh, Maharashtra, New Delhi.
OXFORD College Of Business administration, Hubli 74
VRL LOGISTICS pvt ltd Varur-Hubli
SWOT ANALYSIS
SWOT ANALYSIS
OXFORD College Of Business administration, Hubli 75
VRL LOGISTICS pvt ltd Varur-HubliSTRENGTHS :
In house body designing facility enabling maximum vehicle utilization
Vehicle repair and maintenance facility
Tie-ups with spare part suppliers resulting in cost savings.
Dedicated research and development team
Highly experienced management with sound industry expertise.
Active involvement of promoters in the management
OPERTUNITIES :
They can enter into hotel business
They can decentralize their garage and office
They can concentrate on remote villages
They can tie up with the government transport service
They can enter into international courier and cargo express service
They can extent heir service to north and south station
Another English newspaper to be published out of the side of the Karnataka
THREATS :
Uncertain policies of changing policy government
Competition can enter into market for leadership
New technology economic slowdown
Maintenance
Competition
OXFORD College Of Business administration, Hubli 76
VRL LOGISTICS pvt ltd Varur-Hubli
CONCLUSION
CONCLUSION :
OXFORD College Of Business administration, Hubli 77
VRL LOGISTICS pvt ltd Varur-Hubli
The conclusion of whole the study is that the management of working capital in the VRL Logistics Pvt. Ltd. Is very good as it is above corporate standard.
The profits of company are also growing with the sped, as the management of working capital is getting good.
As well as level of working capital liquidity of company is also affected positively. So the study showing it is true that the working capital is the guiding for the organization survival growth and profitability.
OXFORD College Of Business administration, Hubli 78
VRL LOGISTICS pvt ltd Varur-Hubli
BIBLIOGRAPHY
OXFORD College Of Business administration, Hubli 79
VRL LOGISTICS pvt ltd Varur-Hubli
BIBLIOGRAPHY :
Financial Management : Khan & Jain
Financial Management : I. M. Panday
Annual Report VRL
www. vrllogistics.com
www.google.com
OXFORD College Of Business administration, Hubli 80