pre-session orientation for new legislators december 3, 2014 state of nevada department of...
TRANSCRIPT

1
Pre-Session Orientation for New Legislators
December 3, 2014
State of NevadaDepartment of Transportation
Rudy Malfabon, P.E.Director
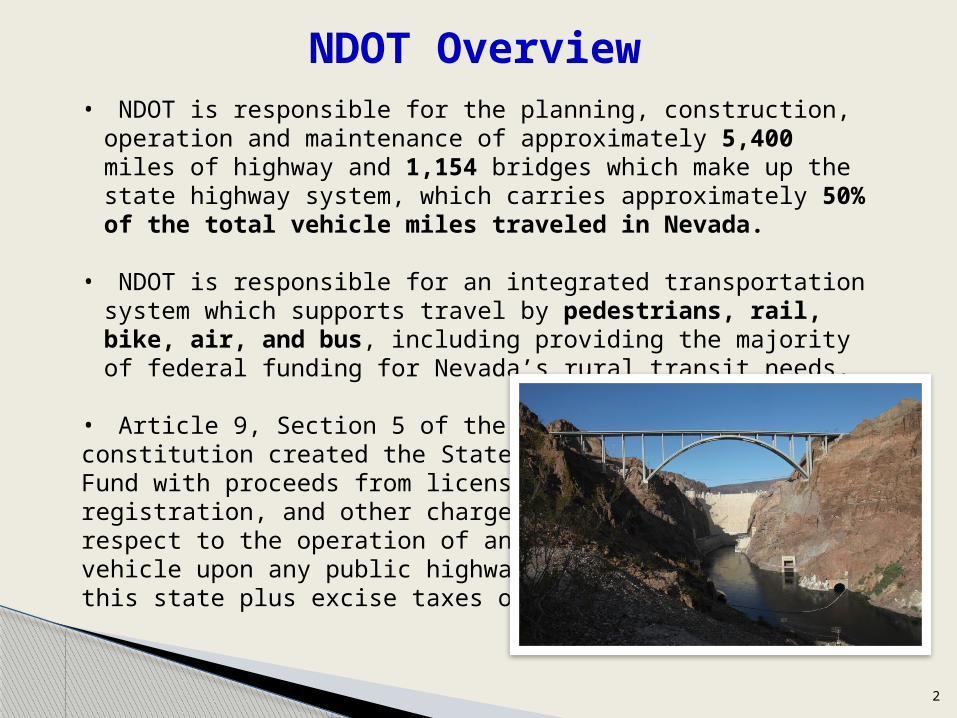
NDOT OverviewNDOT Overview• NDOT is responsible for the planning, construction, operation
and maintenance of approximately 5,400 miles of highway and 1,154 bridges which make up the state highway system, which carries approximately 50% of the total vehicle miles traveled in Nevada.
• NDOT is responsible for an integrated transportation system which supports travel by pedestrians, rail, bike, air, and bus, including providing the majority of federal funding for Nevada’s rural transit needs.
• Article 9, Section 5 of the Nevada constitution created the State Highway Fund with proceeds from licensing, registration, and other charges with respect to the operation of any motor vehicle upon any public highway in this state plus excise taxes on fuel.
2

NDOT Leadership
NDOT Leadership
Rudy Malfabon Director
3
Tracy Larkin-Thomason, Deputy Director, Southern Nevada
Bill HoffmanDeputy
Director
Sondra RosenbergAssistant Director, Planning
John TerryAssistant Director,
Engineering
Reid KaiserAssistant Director,
Operations
Robert NellisAssistant Director,
Administration
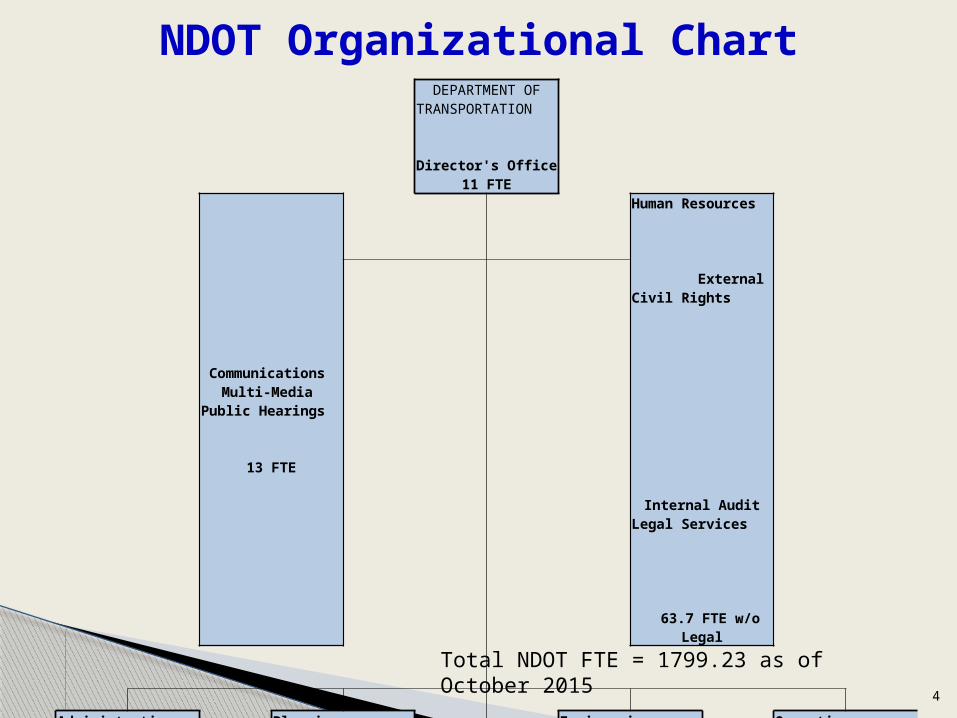
NDOT Organizational ChartNDOT Organizational Chart
Total NDOT FTE = 1799.23 as of October 2015
4
DEPARTMENT OF TRANSPORTATION
Director's Office
11 FTE
Communications Multi-Media
Public Hearings
13 FTE
Human Resources
External Civil Rights
Internal Audit
Legal Services 63.7 FTE
w/o Legal
Administration
117 FTE
Planning 92 FTE
Engineering
309 FTE
Operations
239.51 FTE
District I
Las Vegas
391.51 FTE
District II Reno
281.51 FTE
District III Elko
281 FTE
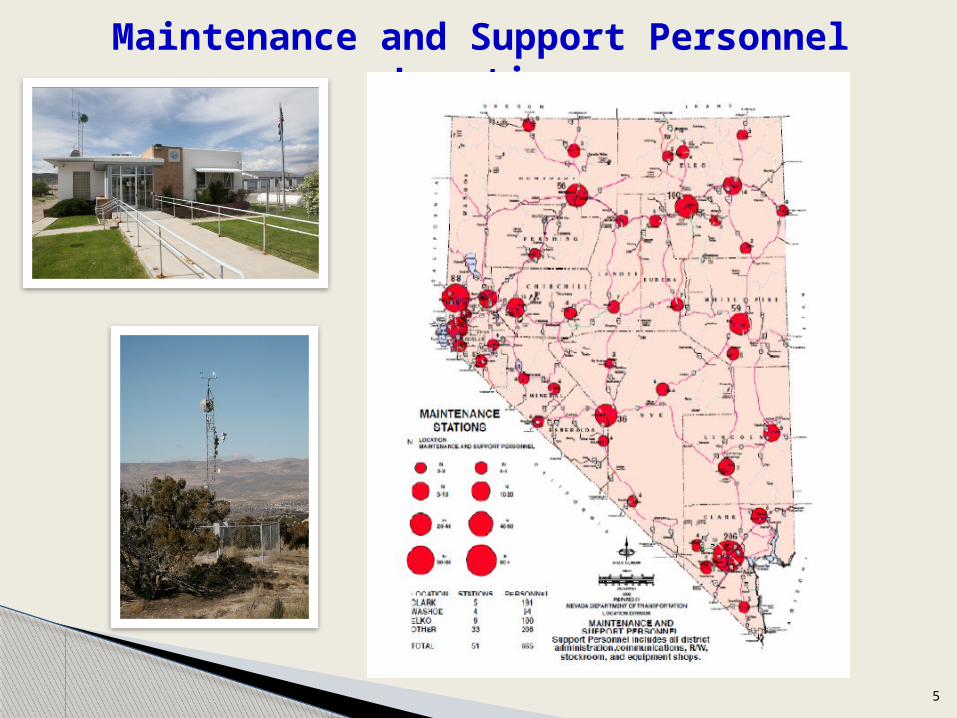
Maintenance and Support Personnel Locations
5
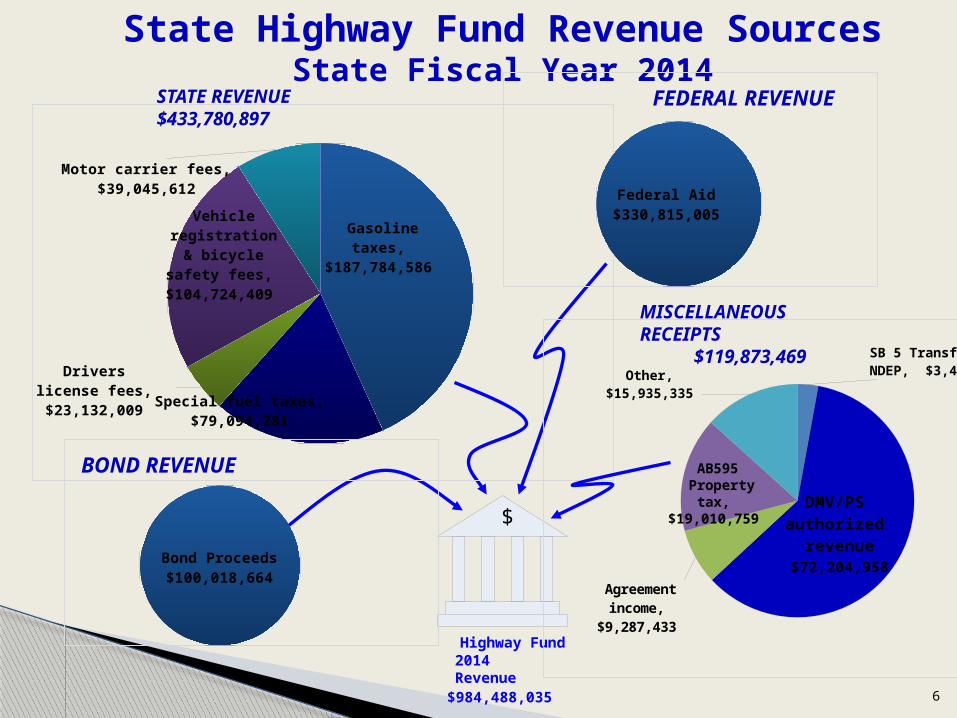
State Highway Fund Revenue SourcesState Fiscal Year 2014
State Highway Fund Revenue SourcesState Fiscal Year 2014
Gasoline taxes,
$187,784,586
Special fuel taxes, $79,094,281
Drivers li-cense fees, $23,132,009
Vehicle regis-tration & bi-cycle safety
fees, $104,724,409
Motor carrier fees, $39,045,612
STATE REVENUE$433,780,897
MISCELLANEOUS RECEIPTS
$119,873,469
Federal Aid $330,815,005
$
Highway Fund2014 Revenue
$984,488,035
FEDERAL REVENUE
SB 5 Transfer from NDEP, $3,434,985
Agreement income,
$9,287,433
Other, $15,935,335
DMV/PS authorized
revenue$72,204,958Bond Proceeds
$100,018,664
BOND REVENUE
AB595 Property
tax, $19,010,759
6

Gasoline TaxGasoline Tax
Federal18.400
¢
State 18.455¢
County Manda-
tory 6.350¢
County Op-
tional (Up to
9¢) 9.000¢
State Gas Tax HistoryYear Rate Per Gallon1935 4.000¢
1955 4.550¢
1981 8.050¢
1982 9.050¢
1985 10.050¢
1987 11.770¢
1988 12.700¢
1989 13.305¢
1991 15.805¢
1992 18.305¢
1995 * 18.455¢
Gasoline Tax Per Gallon
* No change since 1995
7

Special Fuel TaxSpecial Fuel Tax
Fed-eral
24.400¢
State 27.750
¢
Diesel Tax Per Gallon State Diesel Tax History
YearRate Per Gallon
1923 2.000¢1935 4.000¢1951 5.000¢1955 6.000¢1981 10.500¢1982 12.000¢1985 13.000¢1987 17.000¢1988 20.000¢1989 20.600¢1990 22.600¢1991 25.100¢1992 27.600¢
1995 * 27.750¢
Special Fuel Tax Rates
Per Gallon
Diesel
Federal Tax 24.4 ¢
State Tax 27.75 ¢
Propane (Liquefied Petroleum Gas)
Federal Tax 18.3 ¢
State Tax 22 ¢
Methane (Compressed Natural Gas)
Federal Tax 18.3 ¢
State Tax 21 ¢
* No change since 1995
8
9
• Fuel Revenue Indexing adjusts the revenues from fuel sales to the rate of inflation, which allows continued development, enhancement and rehabilitation of our infrastructure.
• In 2009 the State Legislature allowed Washoe County to index its fuel revenue indefinitely, and in 2013 the State Legislature allowed Clark County to index its fuel revenue through 2016.
• FRI dollars are helping fund NDOT projects in Clark County
with the Interstate 11 Boulder City Bypass – Phase 1 starting in 2015. Without FRI funding, Phase 1 was scheduled for 2018 and Phase 2 was unfunded. US 95 widening improvements are also being funded with FRI dollars.
• RTC Washoe used FRI funding for the Southeast Connector, which will relieve I-580 traffic and free up other federal funds for joint projects.
Fuel Revenue Indexing (FRI)Fuel Revenue Indexing (FRI)

Highway Fund Cash BalanceHighway Fund Cash Balance
10
Less than $50 million – Fall 2012
More than $160 million – Now

How the Federal Aid Highway Program Works
How the Federal Aid Highway Program Works
• Normally, funding levels are authorized in a six-year surface transportation bill. Recently federal transportation legislation has been funded via a series of short-term continuing resolutions, with the exception of Moving Ahead for Progress in the 21st Century Act (MAP-21) which covered federal fiscal years 2013 and 2014.
• The amount of funds that may actually be obligated in any
year is established during the annual appropriations process. This obligation limitation controls the rate at which funds may be used.
• The most recent federal bill, the Highway and
Transportation Funding Act of 2014 was signed into law by the President on August 8, 2014. This legislation provides federal transportation funding through May 2015 and provides additional funding for the Highway Trust Fund which was experiencing a shortfall.
11
How the Federal Aid Highway Program WorksHow the Federal Aid Highway Program Works
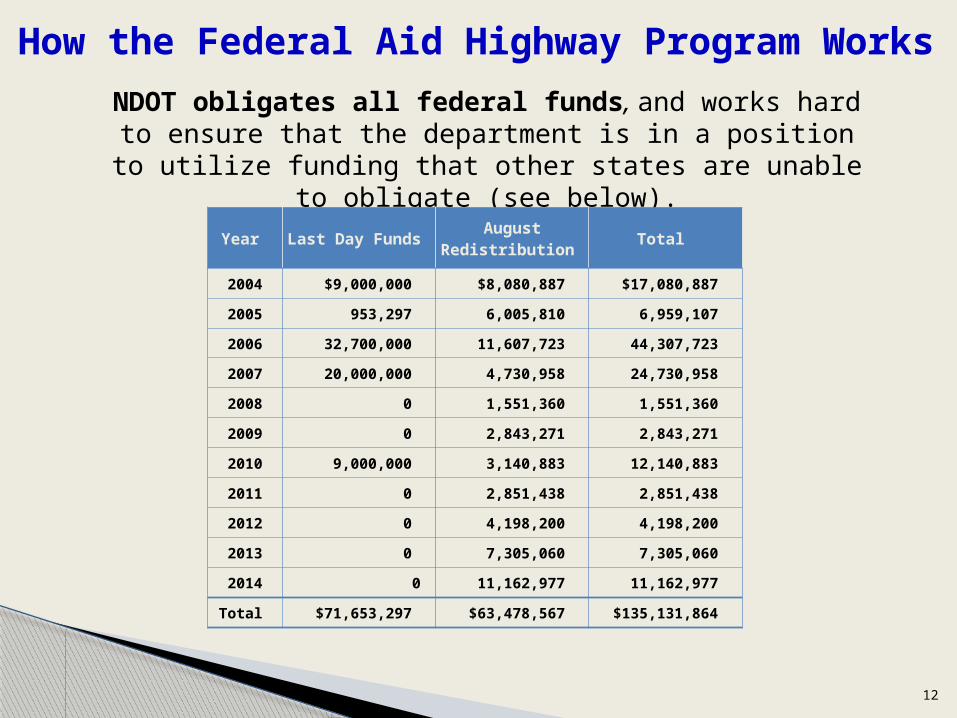
NDOT obligates all federal funds, and works hard to ensure that the department is in a position to utilize funding that other states are unable to obligate (see
below).Year Last Day Funds
August Redistribution
Total
2004 $9,000,000 $8,080,887 $17,080,887
2005 953,297 6,005,810 6,959,107
2006 32,700,000 11,607,723 44,307,723
2007 20,000,000 4,730,958 24,730,958
2008 0 1,551,360 1,551,360
2009 0 2,843,271 2,843,271
2010 9,000,000 3,140,883 12,140,883
2011 0 2,851,438 2,851,438
2012 0 4,198,200 4,198,200
2013 0 7,305,060 7,305,060
2014 0 11,162,977 11,162,977
Total $71,653,297 $63,478,567 $135,131,864
12

13
State Highway Fund DisbursementsState Fiscal Year 2014
State Highway Fund DisbursementsState Fiscal Year 2014
Other
OTHER DISBURSEMENTS$75,453,777
To bond fund $70,100,865
Labor, $123,256,988
Travel, $1,934,155
Operating, $61,011,698
Equipment, $4,566,677
Capital im-provements, $324,457,950
Bond expen-ditures,
$5,927,852 Other,
$12,106,502
TRANSPORTATION$533,261,822
MOTOR VEHICLES
$90,912,209
PUBLIC SAFETY
$78,739,379
$
Highway FundDisbursements $778,367,188
$5,352,912
14
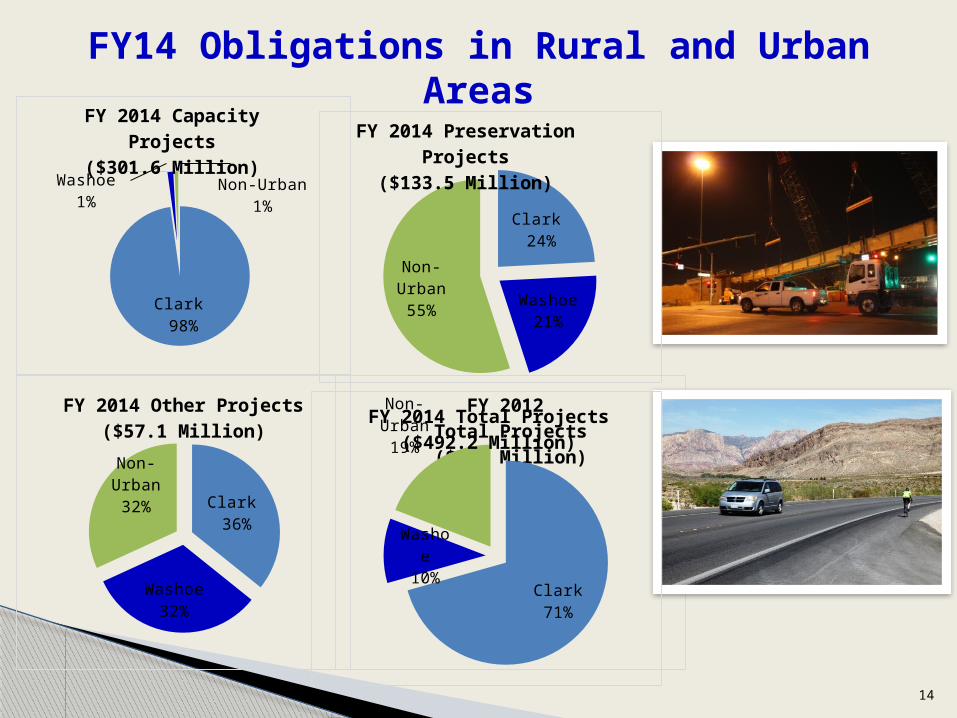
FY14 Obligations in Rural and Urban Areas
FY14 Obligations in Rural and Urban Areas
FY 2012 Total Projects($669 Million)
Clark 98%
Washoe1%
Non-Urban1%
FY 2014 Capacity Projects
($301.6 Million)
Clark 24%
Washoe21%
Non-Urban55%
FY 2014 Preservation Projects
($133.5 Million)
Clark 36%
Washoe32%
Non-Urban32%
FY 2014 Other Projects($57.1 Million)
Clark 71%
Washoe
10%
Non-Urban19%
FY 2014 Total Projects($492.2 Million)
15
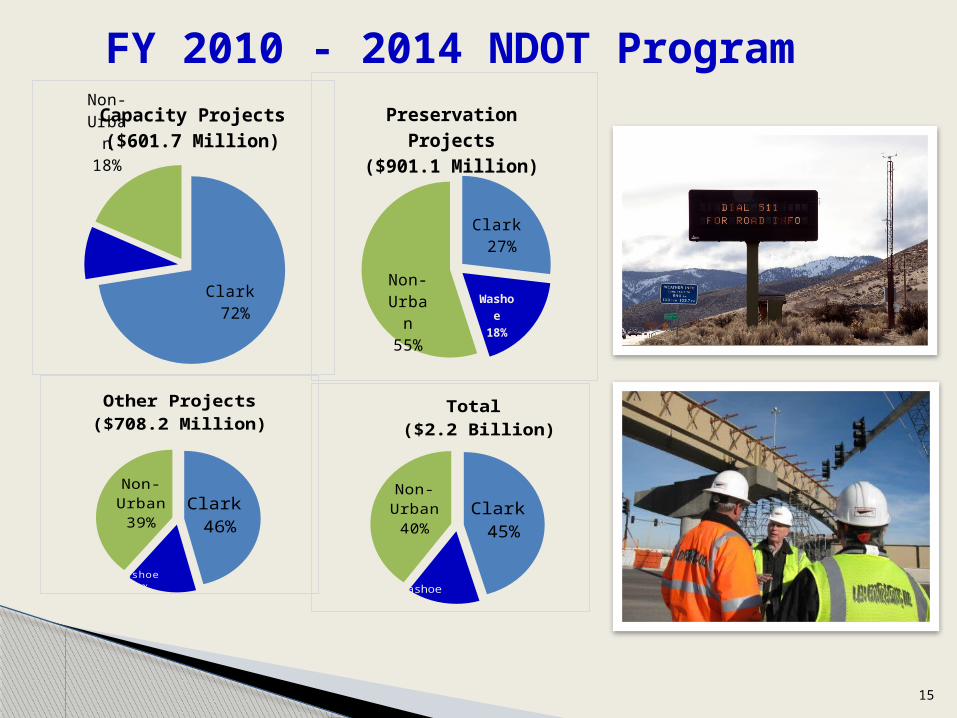
Clark 72%
Washoe
9%
Non-Ur-ban18%
Capacity Projects($601.7 Million)
Clark 27%
Washoe
18%
Non-Ur-ban55%
Preservation Projects($901.1 Million)
Clark 46%
Washoe15%
Non-Urban39%
Other Projects($708.2 Million)
Clark 45%
Washoe15%
Non-Urban40%
Total ($2.2 Billion)
FY 2010 - 2014 NDOT Program

16
247 pedestrian fatalities (797 serious injuries) on Nevada roads (2009-2013).
Where?
Why?
Pedestrian Safety. What is Nevada Doing?

17
Electric/Hybrid Vehicles and VMT Electric/Hybrid Vehicles and VMT Electric vehicle ownership has been increasing since 1999. It
increased 108% nationwide from 2011 to 2013. Average fuel economy has increased from 24 MPG in 1982 to 34.9
MPG in 2014. It is required to go up to 54.5 MPG by 2025. This has led to decreased per capita fuel consumption and increased vehicle-miles-traveled.
In Nevada, between 2007 and 2013, VMT increased from 12.6 billion VMT to 23.5 billion VMT, while highway revenue declined from $297,141,989 in FY 2007 to $266,878,866 in FY 2014.
$297.1 $293.9
$254.0
$265.5 $264.7 $264.4 $266.6 $266.9
27.5 27.5 27.5 27.530.4
33.3 34.2 34.9
10
15
20
25
30
35
40
230
240
250
260
270
280
290
300
310
2007 2008 2009 2010 2011 2012 2013 2014
(
mpg)
Mill
ions
($)
FISCAL YEAR
TOTAL FUEL REVENUE Vs VEHICLE EFFICIENCY (CAFE)
Total Revenue
Vehicle mpg

NDOT Major Projects 2014 - 2018NDOT Major Projects 2014 - 2018
18
Southern Nevada• Project NEON - $500 million• Boulder City Bypass/ I-11 - $125
million
Northern Nevada• USA Parkway - $70 million• Carson City Bypass - $42
million
2015 NDOT Bill Draft Requests2015 NDOT Bill Draft Requests• BDR 375 – Extend amortization period of highway revenue
bonds from 20 to 30 years.
• BDR 376 - Match federal to state reporting requirements (housekeeping).
• BDR 377 - Ensure confidentiality of NDOT bidding and procurement process.
19

NDOT Thanks You for Your Continued Support
NDOT Thanks You for Your Continued SupportNDOT and the state’s transportation partners are ready
to deliver well-designed transportation projects that will bolster the economy, put people to work, and improve travelers’ mobility and accessibility.
Primary Contacts:
Rudy Malfabon, P.E., Director, [email protected]
Robert Nellis, Assistant Director, Administration, [email protected]
Sean Sever, Communications Director, [email protected]
20