precipitation climatology and mapping in the united states
DESCRIPTION
Precipitation Climatology and Mapping in the United States. Christopher Daly Director Spatial Climate Analysis Service Oregon State University Corvallis, Oregon. Outline. Precipitation climatology PRISM overview PRISM map products. Issues of Scale (Spatial and Temporal). - PowerPoint PPT PresentationTRANSCRIPT

Precipitation Climatology and Precipitation Climatology and Mapping in the United StatesMapping in the United States
Christopher DalyChristopher DalyDirectorDirector
Spatial Climate Analysis ServiceSpatial Climate Analysis Service
Oregon State UniversityOregon State University
Corvallis, OregonCorvallis, Oregon

OutlineOutline
Precipitation climatologyPrecipitation climatology PRISM overviewPRISM overview PRISM map productsPRISM map products

Issues of ScaleIssues of Scale(Spatial and Temporal)(Spatial and Temporal)
Over long averaging times (say, Over long averaging times (say, the 30 year normal maps), only the the 30 year normal maps), only the most important and consistent most important and consistent meteorological factors are evidentmeteorological factors are evident
Progressively shorter time spans Progressively shorter time spans reveal ever-increasing nuances of reveal ever-increasing nuances of the atmospheric systemthe atmospheric system

Instantaneous

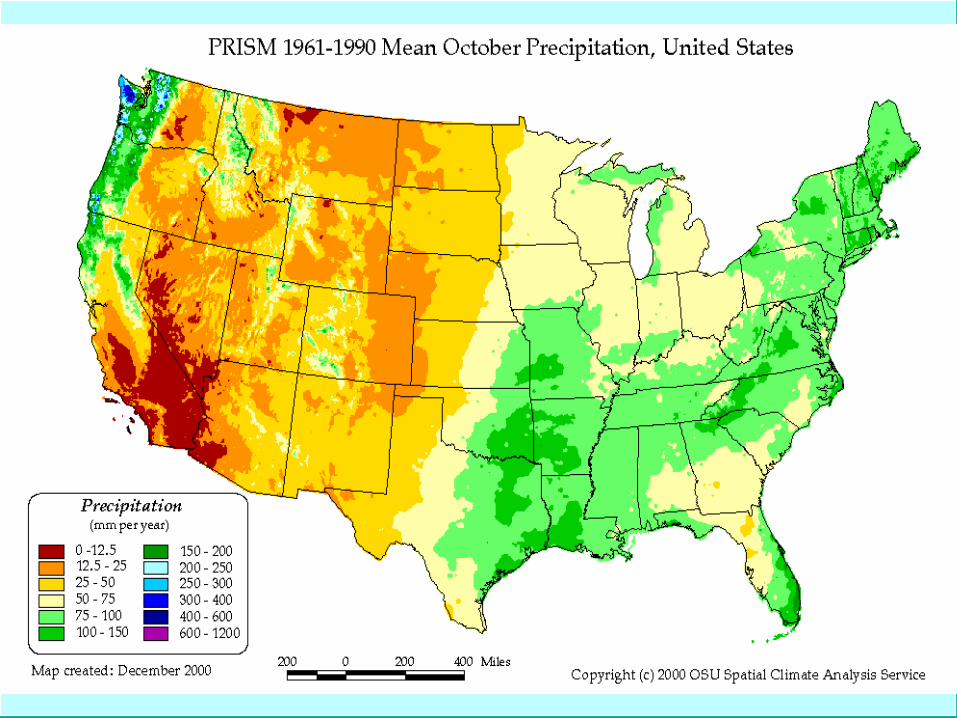
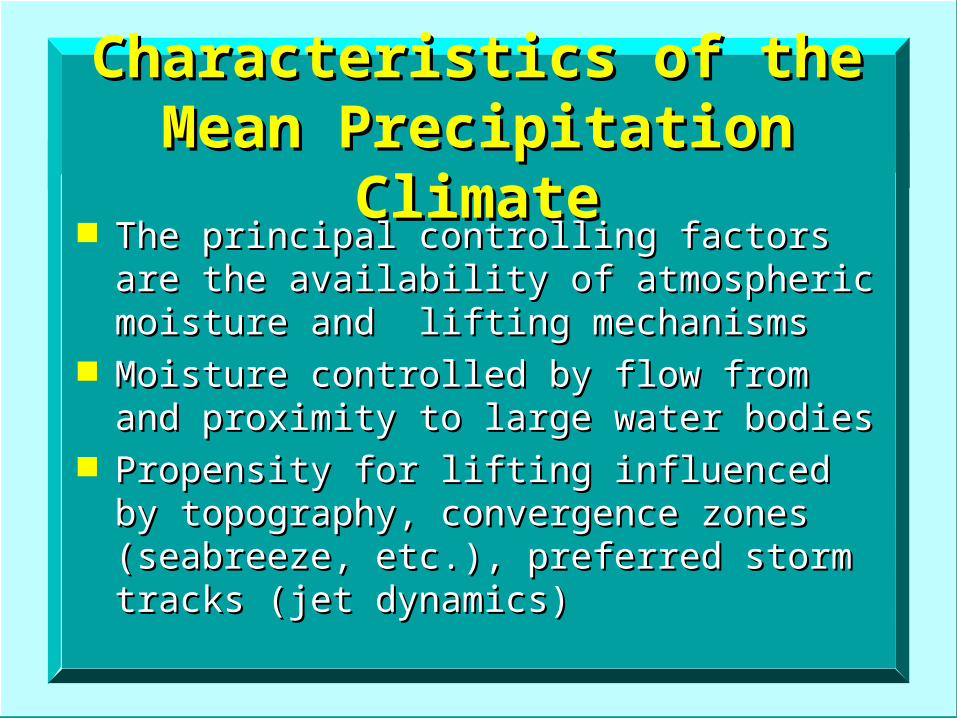
Characteristics of the Mean Characteristics of the Mean Precipitation ClimatePrecipitation Climate
The principal controlling factors are the The principal controlling factors are the availability of atmospheric moisture and availability of atmospheric moisture and lifting mechanisms lifting mechanisms
Moisture controlled by flow from and Moisture controlled by flow from and proximity to large water bodiesproximity to large water bodies
Propensity for lifting influenced by Propensity for lifting influenced by topography, convergence zones topography, convergence zones (seabreeze, etc.), preferred storm tracks (seabreeze, etc.), preferred storm tracks (jet dynamics)(jet dynamics)

Orographic Precipitation Orographic Precipitation Enhancement FactorsEnhancement Factors
Atmospheric Moisture Atmospheric Moisture – Precipitable waterPrecipitable water– Vertical distribution of moistureVertical distribution of moisture
Terrain blocking capabilityTerrain blocking capability– ““Footprint”Footprint”– SteepnessSteepness– OrientationOrientation


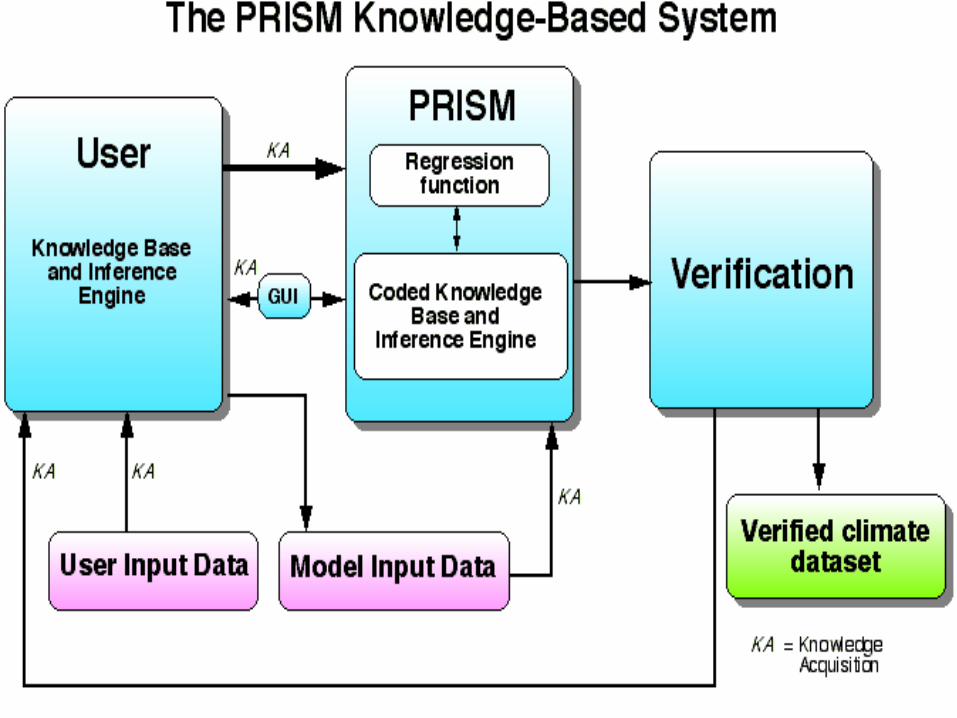
PRISM Spatial Climate PRISM Spatial Climate Modeling SystemModeling System
PRISM (Parameter-elevation Regressions PRISM (Parameter-elevation Regressions on Independent Slopes Model)on Independent Slopes Model)
Knowledge-based system using point Knowledge-based system using point data, digital elevation model, & other data, digital elevation model, & other spatial data setsspatial data sets
Generates gridded estimates of climatic Generates gridded estimates of climatic parameters (such as precipitation & parameters (such as precipitation & temperature)temperature)
Accounts for rain shadows, inversions, Accounts for rain shadows, inversions, coastal proximity, and otherscoastal proximity, and others

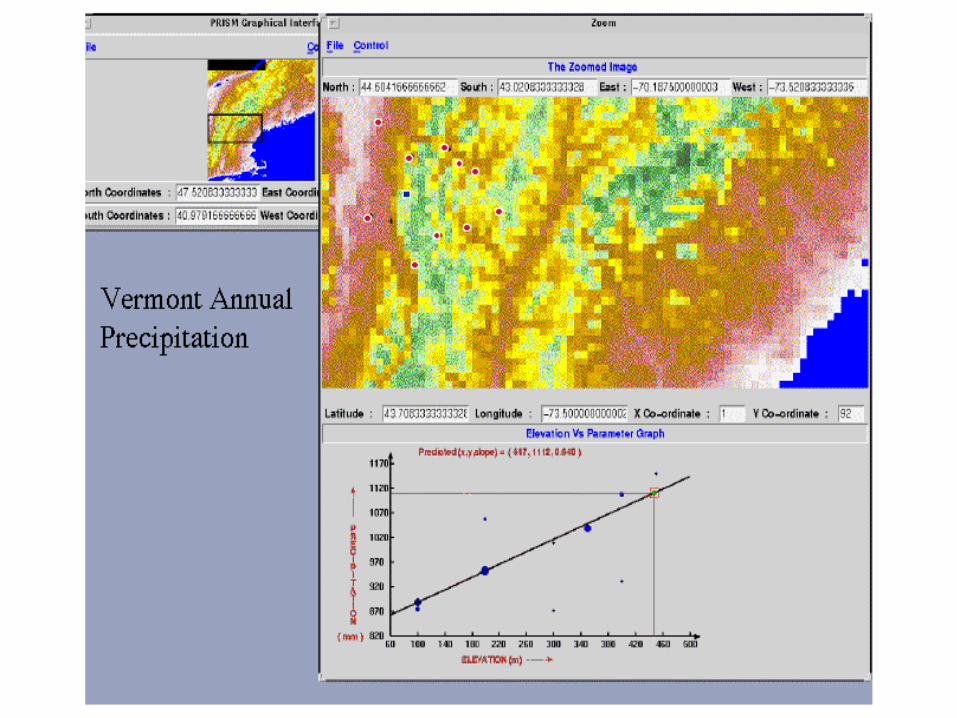
Form of Grid Cell PredictionForm of Grid Cell Prediction
Y = Y = 11X + X + 00 , ,
where Y is the predicted climate where Y is the predicted climate element and X is the DEM elevation element and X is the DEM elevation at the target cell. at the target cell. 00 and and 11 are are regression slope and intercept, and regression slope and intercept, and are determined by x,y pairs of are determined by x,y pairs of elevation and climate observations elevation and climate observations from nearby climate stations from nearby climate stations

Station WeightingStation Weighting Combined weight of a station is:Combined weight of a station is:
W = f {WW = f {Wdd, W, Wzz, W, Wcc, W, Wll, W, Wff, W, Wpp, W, Wee} ,} ,
where Wwhere Wdd, W, Wzz, W, Wcc, W, Wll, W, Wff, W, Wpp, W, Wee are the are the distance, elevation, cluster, vertical layer, distance, elevation, cluster, vertical layer, topographic facet, coastal proximity and topographic facet, coastal proximity and effective terrain height weights.effective terrain height weights.


Olympic Mtns Annual Precipitation Facets On + Vertical Extrapolation On
Inches

Olympic Mtns Annual Precipitation Facets On + Vertical Extrapolation Off
Inches

Olympic Mtns Annual Precipitation Facets Off + Vertical Extrapolation Off
Inches

Olympic Mtns Annual Precipitation No elevation
Inches

Olympic Mtns Annual Precipitation Facets On + Vertical Extrapolation On
Inches


Some SCAS ProjectsSome SCAS Projects
ProjectProject
US Precip & tempUS Precip & tempUS Climate Atlas - 40 US Climate Atlas - 40
elementselementsUS 103-yr precip & tempUS 103-yr precip & tempCanada precip & tempCanada precip & tempChina/Mongolia precip & tempChina/Mongolia precip & tempWA, OR, CA, BC precip WA, OR, CA, BC precip
intensityintensityBC PMP analysisBC PMP analysisPNW flood analysisPNW flood analysisSW and OH Precip frequencySW and OH Precip frequencyUS R-factor and EI10US R-factor and EI10
ClientClientUSDA NRCSUSDA NRCSNOAA NCDCNOAA NCDCNASA & NOAA OGPNASA & NOAA OGPEnvironment Canada, BCEnvironment Canada, BCUSDA, ORUSDA, ORWA DOT, OR WRD, BC HydroWA DOT, OR WRD, BC HydroBC HydroBC HydroUSDA Forest ServiceUSDA Forest ServiceNWS-HDSCNWS-HDSCUSEPAUSEPA


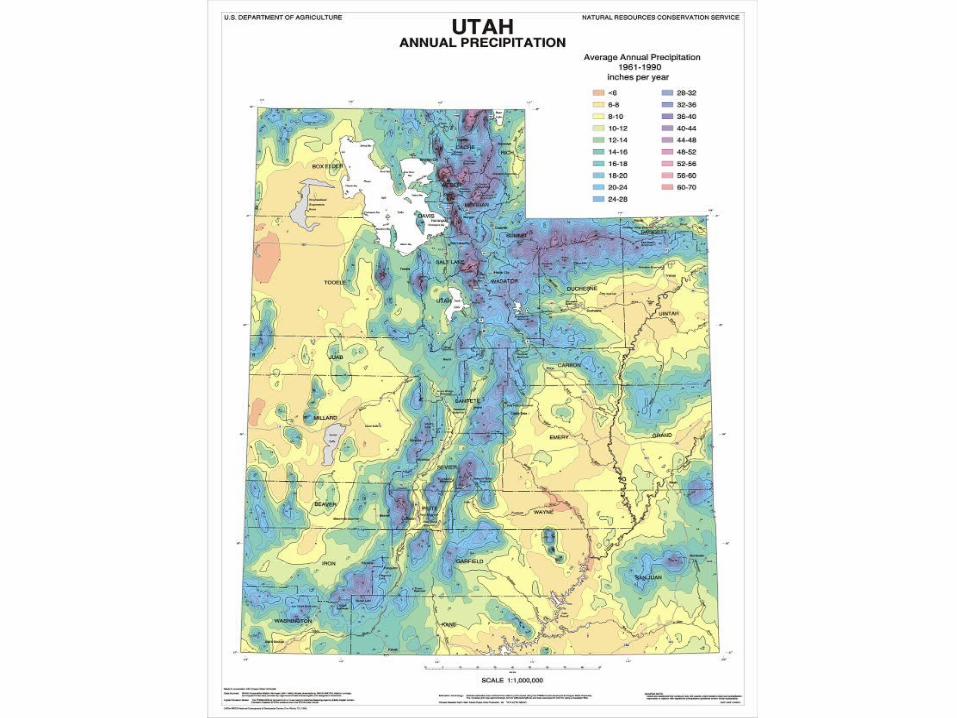
Cartographic-quality Map of Mean Annual
Precipitation for Idaho Produced at the USDA-NRCS NCGC

PRISM Product PRISM Product DisseminationDissemination
Hardcopy mapsHardcopy maps
Cartographic-quality, walls-size maps of Cartographic-quality, walls-size maps of mean annual precipitation for each mean annual precipitation for each statestate
Available from the NRCS Climate Data Available from the NRCS Climate Data Liaison in each state or OSU SCASLiaison in each state or OSU SCAS
**Sign-up sheet**Sign-up sheet

PRISM Precipitation PRISM Precipitation Product DisseminationProduct Dissemination
Compact DiscsCompact Discs
All precipitation layers for all of the All precipitation layers for all of the U.S. 3 CD’s (East, Central, U.S. 3 CD’s (East, Central, West) of the lower 48 states. West) of the lower 48 states. Includes Arc Explorer viewing Includes Arc Explorer viewing software, and all documentation.software, and all documentation.
Available from the NRCS-NCGC:Available from the NRCS-NCGC:
800-672-5559800-672-5559
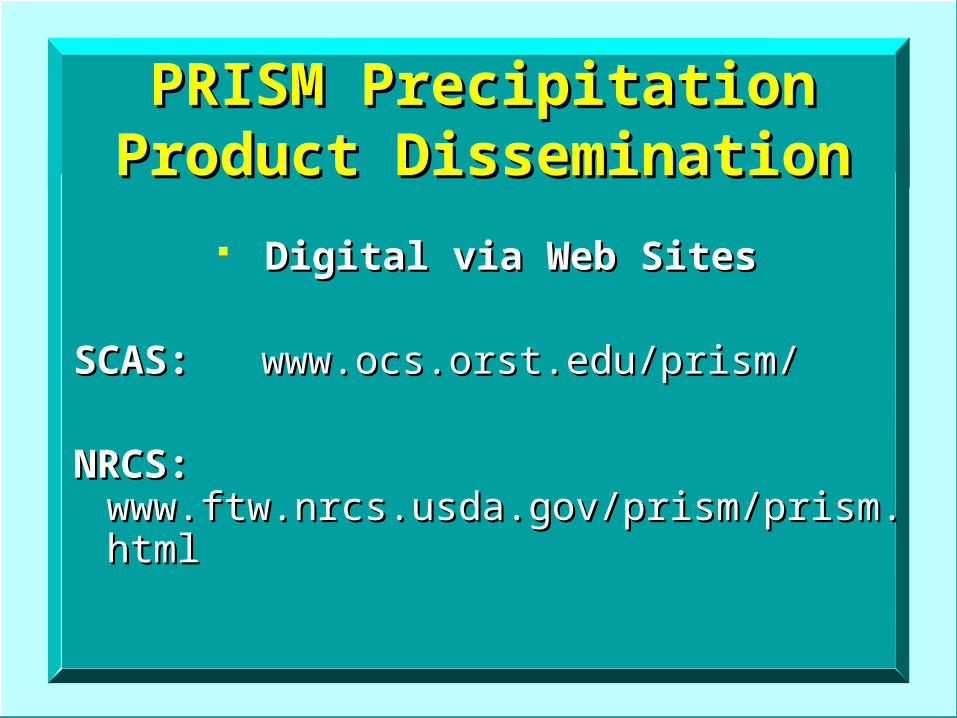
PRISM Precipitation PRISM Precipitation Product DisseminationProduct Dissemination
Digital via Web SitesDigital via Web Sites
SCAS: SCAS: www.ocs.orst.edu/prism/www.ocs.orst.edu/prism/
NRCS: NRCS: www.ftw.nrcs.usda.gov/prism/prism.htmlwww.ftw.nrcs.usda.gov/prism/prism.html

Oregon Annual Precipitation


All PRISM gridded products to dateavailable on CD from:

Hydrometeorological Design Hydrometeorological Design Studies Center (HDSC) of the Studies Center (HDSC) of the
NWS:NWS:
http://www.nws.noaa.gov/oh/hdsc/index.hhttp://www.nws.noaa.gov/oh/hdsc/index.htmltml

Oregon Annual Precipitation

Oregon Annual Precipitation