precipitative softening and ultrafiltration treatment of
TRANSCRIPT
University of South FloridaScholar Commons
Graduate Theses and Dissertations Graduate School
4-5-2006
Precipitative Softening and UltrafiltrationTreatment of Beverage WaterJorge T. AguinaldoUniversity of South Florida
Follow this and additional works at: http://scholarcommons.usf.edu/etd
Part of the American Studies Commons
This Thesis is brought to you for free and open access by the Graduate School at Scholar Commons. It has been accepted for inclusion in GraduateTheses and Dissertations by an authorized administrator of Scholar Commons. For more information, please contact [email protected].
Scholar Commons CitationAguinaldo, Jorge T., "Precipitative Softening and Ultrafiltration Treatment of Beverage Water" (2006). Graduate Theses andDissertations.http://scholarcommons.usf.edu/etd/3895

Precipitative Softening and Ultrafiltration Treatment of Beverage Water
by
Jorge T. Aguinaldo
A thesis submitted in partial fulfillment of the requirements for the degree of
Master of Science in Environmental Engineering Department of Civil and Environmental Engineering
College of Engineering University of South Florida
Major Professor: Robert P. Carnahan, Ph.D. Marilyn Barger, Ph.D. Daniel H. Yeh, Ph.D.
Date of Approval: April 5, 2006
Keywords: lime softening, membrane water treatment, carbonated soft drinks, alkalinity reduction, immersed membrane
© Copyright 2006, Jorge T. Aguinaldo

Acknowledgements
I would like to thank Dr. Robert P. Carnahan, Ph.D, my Major Professor who
are among the few who believed in my idea, supported and encouraged me
throughout my research. I would like to thank and acknowledge my committee
members, Dr. Marilyn Barger, Ph.D and Dr. Daniel H.Yeh, Ph.D for the valuable
time they spent reviewing my thesis and providing very important comments and
suggestions. I would like to thank the management, and staff of Doosan Hydro
Technology Inc.: Mr. Ali Kalantar, CEO; Mr. Del Martinez, Director of Sales, who
shared his experiences on lime soda softening and my coordinator with CSD Bottlers;
Mr. Dalmacio Aviso, Manufacturing Manager, who built the pilot unit; Mr. Carlo
Canezo, Engineering Trainee who helped in the manufacture and operation of the
pilot unit; Ms. Sarah Vinson, Technology & Development Coordinator, who helped
in formatting the manuscript; and Dr. Silvana Ghiu, Ph.D, Process & Development
Engineer, who reviewed the final manuscript and provided valuable suggestions. I
would like also to thank Mr. Ben Goulds and Mr. Michael Snodgrass, both from
Trisep Corporation for the information and data they provided on the Immersed
Spirasep UF membrane.

i
Table of Contents List of Tables iii List of Figures iv Abstract v Chapter One: Introduction 1 Chapter Two: Background 7
2.1 Lime Softening 7 2.2 Limitations/Problems Associated With Lime Softening 9 2.3 Precipitative Softening 10 2.4 Ultrafiltration 14
Chapter Three: Materials and Methods 16 3.1 Experimental Plan 16 3.2 Pilot Lime Softening Ultrafiltration Unit 17 3.2.1 Lime Reactor 17 3.2.2 SpiraSep Ultrafiltration Membrane 18 3.2.3 Pilot Lime Softening Ultrafiltration Control Description 19 3.3 Chemicals 26 3.4 Experimental Procedures 27 3.5 Analytical Procedures 29 3.5.1 pH and Temperature 30 3.5.2 Alkalinity 30 3.5.3 Calcium and Magnesium Hardness 30 3.5.4 Turbidity 30 3.5.5 Total Suspended Solids 31 3.5.6 Total Organic Carbon 31 Chapter Four: Results and Discussions 32 4.1 Initial Operating Conditions Without Chemical Addition 32 4.2 Operation at Varying pH and Flux 34 4.3 Operation at CSD Bottler Plant Conditions 39

ii
Chapter Five: Summary and Conclusions 42 5.1 Alkalinity Reduction 42 5.2 UF Filtrate Turbidity 42 5.3 Trans-membrane Pressure (TMP) vs. pH and Flux 43 5.4 Permeability 43 5.5 Total Organic Carbon (TOC) 45 5.6 Hardness Reduction 46 5.7 Operating Flux 46 5.8 Chlorination 47 5.9 Benefits of the Lime Softening Ultrafiltration (LSUF) Process to CSD Bottler 47 References 49 Appendices 51 Appendix A: Pilot Unit Equipment Description 52 Appendix B: SpiraSep Trans-membrane Pressure (TMP) Measurements 58

iii
List of Tables Table 1 Selected Contaminants Limits from the National Primary and Secondary Drinking Water Standards (EPA, 2003) 3 Table 2 CSD Bottlers Water Quality Survey 4 Table 3 Canadian Water Quality Guidelines for Carbonated Beverage 5 Table 4 Raw Water Analysis 34 Table 5 Average TMP Values Before and After UF Backflushing at Various Flux Values 35 Table 6 Flux vs. Permeability at Various Operating pH 35 Table 7 Analysis of Water Samples at Various Operating Conditions 38 Table 8 Analysis of the Filtrate by CSD Bottler 40 Table 9 Average Suspended Solids Concentrations at the Membrane Reactor 41

iv
List of Figures Figure 1 Spiral Wound Membrane 15 Figure 2 SpiraSep Immersed UF Membrane Configuration 19 Figure 3 SpiraSep UF Membrane in Backflushing Mode 21 Figure 4 SpiraSep UF Membrane Air Scour 22 Figure 5 UF System during Filtration 22 Figure 6 UF System during Backflushing 23 Figure 7 Process Flow Diagram of the Pilot Unit 25 Figure 8 Permeability Profile at Various Operating Conditions 36 Figure 9 TMP Profile at Various Operating Conditions 37 Figure 10 Permeability Profile at CSD Bottler Operating Conditions 40 Figure 11 TMP Profile at CSD Bottler Operating Conditions 41 Figure 12 Permeability vs. pH at Various Flux Rates 44 Figure 13 TMP vs. pH at Various Flux Rates 44 Figure 14 Permeability vs. Flux at Various Operating pH 45 Figure 15 TMP vs. Flux at Various Operating pH 45
v
Precipitative Softening and Ultrafiltration Treatment of Beverage Water
Jorge T. Aguinaldo
ABSTRACT
Lime softening, chlorination, clarification and filtration have been long recognized
treatment processes for beverage water specifically the carbonated soft drink (CSD) because
it provides consistent water quality required for bottling plants, however these processes are
becoming uneconomical and causes more problems than the benefits they offer. These
processes require very large foot print, occupy large plant volume, and generate large
volume of sludge which causes disposal problems. Chlorination produces trihalomethanes
(THMs) and other by-products which are detrimental to health and imparts tastes to the final
products. Using the newly developed submerged spiral wound ultrafiltration membranes in
conjunction with lime softening may replace the conventional lime softening, clarification
and filtration processes.
This research was conducted to demonstrate the feasibility of integrating immersed
ultrafiltration (UF) membrane with lime softening. The objectives of this research was to
achieve the water quality required by the CSD bottlers; determine the relationships of
operating parameters such as pH and membrane flux with trans-membrane pressure (TMP),
and membrane permeability; determine the optimum dosage of lime; evaluate the operating
parameters as basis for the design and construction of the full scale plant; and predict the
membrane cleaning intervals.

vi
A pilot unit consisting of lime reactor and UF system was designed and built for this
research. The pilot unit was operated at various pH ranging from 7.3 to 11.2 and at
membrane flux rates of 15, 30 and 45 gfd. The pilot unit was also operated at the CSD
bottler’s operating conditions which is pH 9.8 at flux of 30 gfd. The pilot unit operated for a
total of 1800 hours. The raw water source was from city water supply.
The filtrate from the pilot unit achieved alkalinity reduction to 20 to 30 mg/L
preferred by CSD bottlers, with lime dosage close to the calculated value. The filtrate
turbidity during the test was consistently within 0.4 to 0.5 NTU. The TMP values obtained
during the test ranges from 0.1 to 2.5 psi, while the permeability values ranges from 18.19 to
29.6 gfd/psi. The increase in flux results to corresponding increase in TMP, and increase in
operating pH, increases the rate of TMP. Permeability decreases with increasing operating
pH. The TOC reduction ranges from 2.6 % to 15.8% with increasing operating pH. No
scaling of the UF membranes was observed during the test. Thirty days UF membrane
cleaning interval was predicted. The results from this research can use as the basis of
designing and operating a full scale Lime Softening UF Treatment Plant.

1
Chapter One
Introduction
The ingredients used in carbonated soft drinks (CSDs) including water are
approved and closely regulated by the US Food and Drug Administration (FDA), but
there are no defined water quality standards as long as it meets the federal and local
drinking quality standards. The source water for soft drink manufacture is typically the
municipal water supply, and at minimum it should comply with the primary and
secondary National Drinking Water Standards. The municipal water supply however vary
from one area to another and may not be able to provide consistent quality required for
soft drink manufacture, therefore additional treatment is necessary. Most of the
impurities that concerns the carbonated soft drink bottlers are those that affect the
appearance and flavor of the product. The important ingredients of CSDs, aside from
water are sugar, flavors and carbon dioxide. Carbon dioxide is the essential
characterizing ingredient in all soft drinks, the “tingly fizz” which gives a refreshing
taste. When CO2 is dissolved in water, it imparts a unique taste. Natural carbonated or
effervescent mineral water was popular because the minerals dissolved in water were
believed to have beneficial medical properties. By 1800, artificial effervescent mineral
water were introduced in Europe and North America. Then the innovative step of adding
flavors to these popular “soda water” gave birth to the soft drink beverage we enjoy
today.

2
Originally, carbon dioxide was made from sodium salts and the carbonated
beverage became known as “soda water” (American Beverage Association, 2005).
Lime softening is the most common water treatment process in CSD bottling plants.
The typical water treatment process includes pre-chlorination, lime softening with ferric salt
dosage, media filtration or manganese greensand filtration. The addition of coagulants, such
as ferric salts in lime softening process promotes better sludge settling and also can reduce
organic matter in the raw water. The unit processes above when accompanied by super
chlorination followed by activated carbon filter and polishing filter comprise the
conventional system for CSD product water (Morelli 1994).
Lime softening has been the choice of bottlers because it provides consistent
water quality suitable for bottling operations, regardless of the raw water quality.
Recently, many bottling plants are replacing the lime-soda softening with other
processes such as reverse osmosis, microfiltration and/or ultrafiltration. These
processes, in most cases provide treated water that meets the quality requirements of
the bottling. However, there are cases that lime softening can not just be replaced by
reverse osmosis, especially when the high concentration of hardness in the raw water limits
the recovery in the RO system. RO is excellent in reducing total dissolved solids, hardness
and alkalinity in raw water, but it requires pre-treatment such as media filter or membrane
microfiltration or ultrafiltration. The major CSD bottlers require the raw water feed to the
RO system to be chlorinated to prevent biological fouling of the RO membranes. The
drawback of chlorination of RO feed water is the breakdown of organic matter into smaller
molecules forming trihalomethanes (THMs), which are not rejected by the RO membranes.

3
The activated carbon, as part of the process removes residual chlorine and most of the
organic matter that may impart off-taste and odor in the final product.
Table 1 Selected Contaminants Limits in the National Primary and Secondary
Drinking Water Standards (EPA, 2003)
Primary Drinking Water Standards
Turbidity: < 1 NTU or < 0.3 NTU in 95% of daily sampling in a month
Chlorine (as Cl2): MRDL = 4.0 mg/L Cu: 1.0 mg/L Pb: 0.015 mg/L As: 0.010 mg/L F: 4.0 mg/L Hg: 0.002 mg/L NO2 (as N): 10 mg/L NO3 (as N): 1.0 mg/L TTHMs: 0.08 mg/L
Secondary Drinking Water Standards Aluminum: 0.05 to 0.2 mg/L Chloride: 250 mg/L Sulfate: 250 mg/L Color: 15 (CU) Foaming Agents: 2.0 mg/L Iron: 0.3 mg/L Manganese: 0.05 mg/L Odor: 3 threshold number pH: 6.5 - 8.5 TDS: 500 mg/L
In US there is no standard water quality specifically for CSD, because every bottler
has its own quality control requirements. At minimum, the water supply to CSD
bottling plant should meet the National Primary and Secondary Drinking Water
Standards as shown in Table 1.

4
In 1958, the Society of Soft Drink Technologists carried out survey among
bottlers on the quality of water they require for their plant (Morelli 1994). The result
of the survey is shown in Table 2. In Canada, the Agriculture and Agri-Food Canada
issued a water quality guideline (Agriculture and Agri-Food Canada 2000) for food
and beverage industry which specifically includes carbonated beverages as shown in
Table 3. In the CDS beverage industry variations in taste could be caused by the variations
in the alkalinity of the product water. Lime softening seems to be the only treatment process
that can provide consistent quality of treated water. Lime softening primarily will reduce
and/or maintain alkalinity in the treated water to less than 50 mg/L as CaCO3 and a pH range
of 8 to 9, however most CSD bottler operators are aiming for 20 to 30 mg/L alkalinity
because it provides better yield (or less rejection of final product due to off taste). Another
criterion is the hydroxide concentration which should be between 2 to 7 mg/L as CaCO3
based on calculation using Phenolphthalein and Methyl Orange Alkalinity values.
Table 2 CSD Bottlers Water Quality Survey
(Morelli 1994)
Max. Min. Avg. Median Avg. Turbidity, NTU 10 0 2.3 2.0 Color, CU 20 0 4.8 3.5 Organic, Matter, ppm 5 0 0.4 0 Taste & Odor 0 0 0 0 Chlorine, ppm 0.2 0 0.03 0 Alkalinity, ppm CaCO3 130 0 70 50 Sulphates, ppm 900 0 240 225 Chlorides, ppm 525 0 210 225 Iron & Manganese, ppm 1.8 0 0.4 0.1 Copper, ppm 0.05 0 -- -- Calcium, ppm 500 25 182 150 Magnesium, ppm 650 0 160 80 Sodium, ppm 900 500 -- --

5
Table 3
Canadian Water Quality Guidelines for Carbonated Beverage (AAFC, 2000)
pH < 6.9 Color < 10 Hazen Units Turbidity 1 – 2 NTU Taste, Odor N.D. TDS < 850 mg/L Iron < 0.1 mg/L Manganese < 0.1 mg/L Carbonate < 5 mg/L Sulphate < 200 mg/L Chloride < 250 mg/L Fluoride 0.2 to 1.0 mg/L Hardness 200 to 250 mg/L Alkalinity 50 to 128 mg/L
The CSD bottlers apply the multi-barrier concept in treating raw water into
product water. Shachman (2004) defines multi barrier system as an orderly series of
reliable processes that, in a complementary and incremental manner, completely
removes or reduces targeted raw water adverse quality factors to acceptable levels, at
lowest practical cost. To apply this concept, many CSD bottlers are incorporating
membrane treatment processes, such as ultrafiltration, microfiltration, nanofiltration
and reverse osmosis in their existing processes. In many cases, the membrane
processes alone cannot provide the required product water quality. It is common to
find membrane treatment after lime softeners. Talking to CSD quality personnel and
plant operators, the majority expressed desire to simplify the lime softening and
membrane processes, possibly to combine both processes. It is common for UF systems
in CSD bottling plants to dose coagulant, such as ferric sulfate or ferric chloride. A novel
approach is to dose lime to achieve softening. The application of lime for softening is not
6
the same as dosing ferric salts. By combining both the lime dosing and membrane treatment,
it will be possible to reduce the lime dosage and sludge production, and achieve the desired
product water quality at reduced cost. The membrane utrafiltration is a barrier that can
physically prevent microorganism from passing through into the treated water. The existing
lime softening facilities can integrated with ultrafiltration. Additional minor modification
will increase the existing plant’s capacity.
The purpose of this research is to demonstrate the feasibility of combining lime
softening with membrane ultrafiltration to achieve the water quality required in the
bottling process with minimum usage of chemicals and eliminating continuous
chlorination of the raw water.
7
Chapter Two
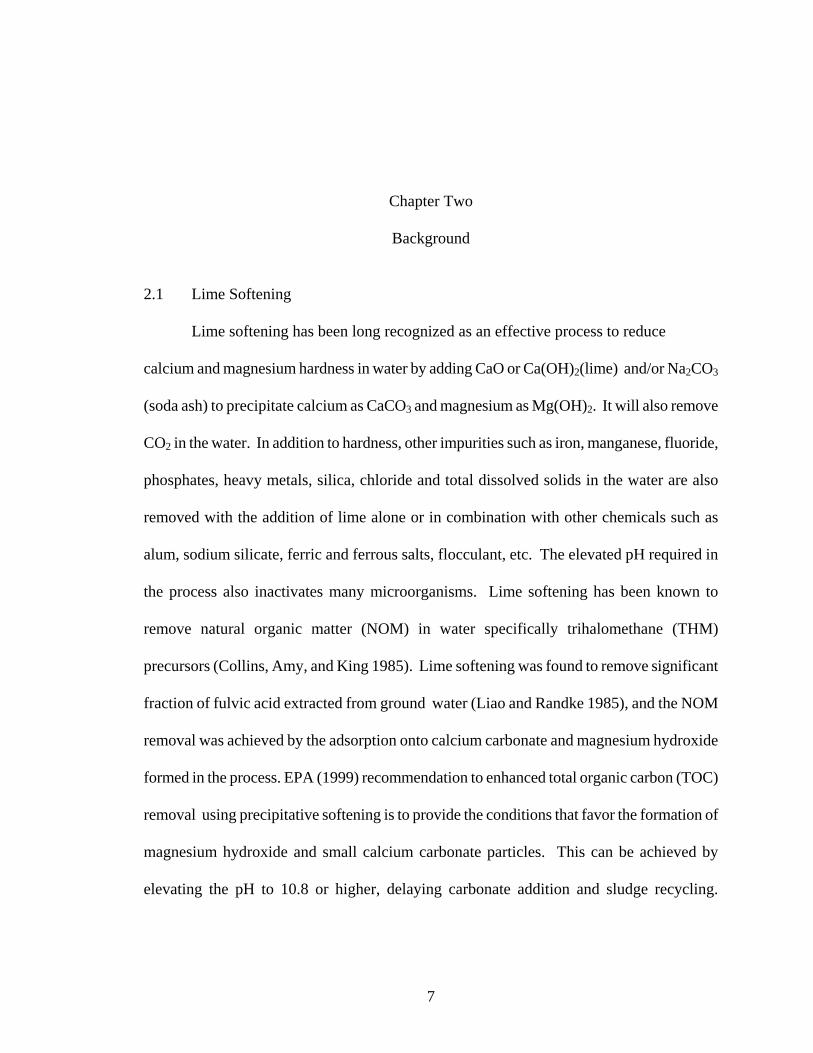
Background 2.1 Lime Softening
Lime softening has been long recognized as an effective process to reduce
calcium and magnesium hardness in water by adding CaO or Ca(OH)2(lime) and/or Na2CO3
(soda ash) to precipitate calcium as CaCO3 and magnesium as Mg(OH)2. It will also remove
CO2 in the water. In addition to hardness, other impurities such as iron, manganese, fluoride,
phosphates, heavy metals, silica, chloride and total dissolved solids in the water are also
removed with the addition of lime alone or in combination with other chemicals such as
alum, sodium silicate, ferric and ferrous salts, flocculant, etc. The elevated pH required in
the process also inactivates many microorganisms. Lime softening has been known to
remove natural organic matter (NOM) in water specifically trihalomethane (THM)
precursors (Collins, Amy, and King 1985). Lime softening was found to remove significant
fraction of fulvic acid extracted from ground water (Liao and Randke 1985), and the NOM
removal was achieved by the adsorption onto calcium carbonate and magnesium hydroxide
formed in the process. EPA (1999) recommendation to enhanced total organic carbon (TOC)
removal using precipitative softening is to provide the conditions that favor the formation of
magnesium hydroxide and small calcium carbonate particles. This can be achieved by
elevating the pH to 10.8 or higher, delaying carbonate addition and sludge recycling.
8
The degree of precipitation of calcium, magnesium and other impurities depends
on the operating pH. Soda ash is also added to precipitate non-carbonate hardness and to
precipitate excess lime. Caustic soda is also added to adjust the operating pH and
promote precipitation of calcium and magnesium. This process is often called caustic
soda softening. This process is applicable if there is enough calcium in the raw water to
complete the softening reactions. The typical reactions in lime, or similar precipitative
softening processes are:
Lime as CaO when water is added becomes Ca(OH)2
CO2 + Ca(CO)2 = CaCO3 + H2O At pH 9.5 or above the following reaction will occur:
Ca(HCO3)2 + Ca(OH)2 = 2CaCO3 + 2H2O
Mg(HCO3)2 + Ca(OH)2 = CaCO3 + Mg CO3 + 2H2O At pH 11 or above
Mg CO3 + Ca(OH)2 = CaCO3 + Mg(OH)2 + Ca(OH)2 (excess) Reactions with soda ash
Ca(OH)2 + Na2CO3 = CaCO3 + 2NaOH
CaSO4 + Na2CO3 = CaCO3 + Na2SO4
CaCl2 + Na2CO3 = CaCO3 + 2NaCl
Ca(NO3)2 + Na2CO3 = CaCO3 + 2NaNO3
MgSO4 + Na2CO3 + Ca(OH)2 = CaCO3 + Mg(OH)2 + Na2SO4
MgCl2 + Na2CO3 + Ca(OH)2 = CaCO3 + Mg(OH)2 + 2NaCl
Mg(NO3)2 + Na2CO3 + Ca(OH)2 = CaCO3 + Mg(OH)2 + 2NaNO3
9
In lime softening, additional and/or excess chemicals are often added to increase the
mass of sludge to promote settling.
2.2 Limitations/ Problems Associated with Lime Softening
The lime softening although reliable and being used in the beverage
industry for almost a century, has its limitations and problems. Some of the
limitations and problems associated with lime softening are:
- Disposal of large amount of sludge generated by the process
- Requires larger foot plant print for the lime reactor, as well as the
sludge handling equipment, lime preparation and storage
facilities.
- Additional chemicals are required to promote settling of the sludge and
solids.
- Requires media filtration after clarification.
- The lime softening plant should be continuously running and requires
longer time to stabilize after start-up.
- The lime-soda softening is more expensive compared to other
competing processes.
- There are very limited companies now specialized in the manufacture
of lime softening systems.

10
2.3 Precipitative Softening
The USEPA, acting on the 1986 Amendment to the Safe Drinking Water Act
(SDWA), set maximum contaminant level goals (MCLGs) for a variety of contaminant
that is present in drinking water. The disinfectants and disinfection byproducts
(DBPs) are among the list of contaminants for regulated in the Disinfection Byproduct Rule
(DBPR). USEPA developed treatment techniques or a maximum contaminant level (MCL)
that is as close to the MCLG as is feasible with the use of the best available technology
(BAT). As part of the DBPR has USEPA, included a treatment technique requirement to
remove natural organic matter (NOM) which serves as the primary precursor for DBP
formation. The goal of this pre-treatment technique is to provide additional removal of
NOM, measured by total organic carbon (TOC). The USEPA Enhanced Coagulation and
Enhanced Precipitative Softening Guidance Manual define enhanced coagulation as a term to
represent the process of obtaining improved removal of DBP precursor by conventional
treatment whereas enhanced softening refers to the process of obtaining improved removal
of DBP precursors by precipitative softening.
In the implementation of the enhanced coagulation and enhanced softening
requires process modification in the existing plants and will have some impacts which
may be either beneficial or detrimental. USEPA cited some of the impacts as:
- Inorganic constituents levels (manganese, aluminum, chloride and
sodium)
- Corrosion control
- Disinfection
- Particle and pathogen removal

11
- Residuals (handling, treatment, disposal)
- Operation and maintenance
- Recycle streams
In addition to the above, from the beverage plant operator’s point of view, the
impacts are:
- Maintaining treated water quality suitable for beverage bottling
operations that are often to higher quality standard compared to the
municipal drinking water quality.
- Operating costs
- Limited plant area to implement process modification
- Additional cost associated with the plant upgrade
Precipitative softening specifically lime process, comes in various forms and
variations. Humenick (1977) listed four process types, based on the amount of
chemicals added:
- Single-stage lime process is used when the source water has high
calcium, low magnesium carbonate hardness (usually less than 40 mg/L as
CaCO3), and no noncarbonate hardness. Single-stage lime softening
is not intended for magnesium hardness removal. Lime is added up
stream of the reactor in a separate flash mixing chamber or into the
reactor-clarifier. The pH of the water leaving flash mixer is about 10.2
to 10.5.

12
- Excess lime process is used when the source water has high calcium,
high magnesium hardness, and no noncarbonate hardness. Excess lime
process can be single or in two stages. Excess lime is added to precipitate
magnesium carbonate hardness as magnesium hydroxide. The pH of
the water after flash mixing will be from 10.2 to 11.2. Above pH 10.2,
causticity will be present.
- Single-stage lime-soda process is used when the source water has high
calcium, low magnesium hardness, (usually less than 40 mg/L as
CaCO3), and some calcium non-carbonate hardness. This is similar to
the single-stage lime process, except that the soda ash is added for the
removal of non-carbonate hardness. The soda ash is added in the flash mixer
or sequentially after the lime has been added.
- Excess lime-soda process is used when the source water has high
calcium, high magnesium carbonate hardness and some non-carbonate
hardness. The addition of soda ash in the excess lime process will
allow removal of non-carbonate hardness, while removing calcium and
magnesium hardness. Excess lime-soda process can be in one or two
stages, however two stage process is common practice, because the soda ash
added in the second stage will remove the excess lime.
In addition to the above, other variations of lime softening include the
following:
- Pellet softening (Van der Veen, C. & Graveland, A., 1988) uses
fluidized bed of grains on which crystallization of CaCO3 takes place.

13
The softening reaction takes place in the presence of suspended bed of
fine sand or crushed CaCO3 that acts as catalyst. Feed water and
chemicals enter tangentially at the bottom of the pellet reactor chamber
and mix immediately. The treated water rises through the reactor in
swirling motion. The upward velocity is sufficient to keep the sand
fluidized. The precipitated hardness particles attaches to the surface of
the sand grains and the sand diameter increases. Large grains are
continuously removed.
- Ultra high lime softening (Batchelor, B; Lasala, M. McDevitt, M;
Peacock, E., 1991) is another variation of lime softening and is used
when the source water has high calcium and magnesium hardness, and
high silica concentration. Excess lime is added to the reactor to
increase the operating pH to above 11. Ultra high lime softening is
usually is a two stage process.
- Other modification of lime softening is the addition of caustic soda
instead of lime to achieve the reaction pH.
In all the processes above the softening is achieved by precipitation of CaCO3
and Mg(OH)2 at elevated pH, where the solubilities of CaCO3 and Mg(OH)2 are
relatively low. The various process modifications in lime softening also enhances the
removal of the precipitate through effective settling or, in case of pellet softening
attachment to the fine sand grains

14
2.4 Ultrafiltration
Ultrafiltration is a pressure driven membrane process, where the source water
is passed through a membrane with nominal pore size of 0.01 to 0.1 mm, and
suspended solids, colloidal particles, bacteria and other particles are retained.
Ultrafiltration also removes high molecular weight organic matter. The typical
ultrafiltration membranes have a typical molecular cut-off of 150,000 daltons (1 dalton or
Da = 1/12 mass of one atom of Carbon-12), however through the addition of coagulants,
it can effectively remove organic matter with molecular weight down to less than 20,000
daltons. The addition of coagulant in the form of ferric salts, poly aluminum chloride or
alum is common in ultrafiltration process. The addition of lime in the feed of
ultrafiltration membrane was never been reported in the literature, but there were
published reports integrating pellet softening with UF membrane treatment (Li, Jian, and
Liao, 2004). In most membrane processes especially in reverse osmosis and
nanofiltration, CaCO3 scaling is a common problem. In treating hard water using
ultrafiltration, the precipitation of CaCO3 can be a problem, especially occurring in
capillary or small diameter tubular UF membranes. The development of the Spirasep UF
membrane, which air-scoured immersed membranes in spiral configuration developed by
Trisep, will minimized the build up of scale in the UF membrane surface. Compared to
RO or NF, there is no change in salt concentration in the membrane surface, therefore
formation of scale will be minimized. The Spirasep membrane is similar in appearance
to 8” diameter x 40” length RO membrane, made of polyethersulfone, and with effective
membrane area of 178 ft2. The operating pH is from 4 to 11 on continuous basis and pH
of 2 to 12 for cleaning. The Spirasep membrane has chlorine tolerance of 2,000 mg/L.
15
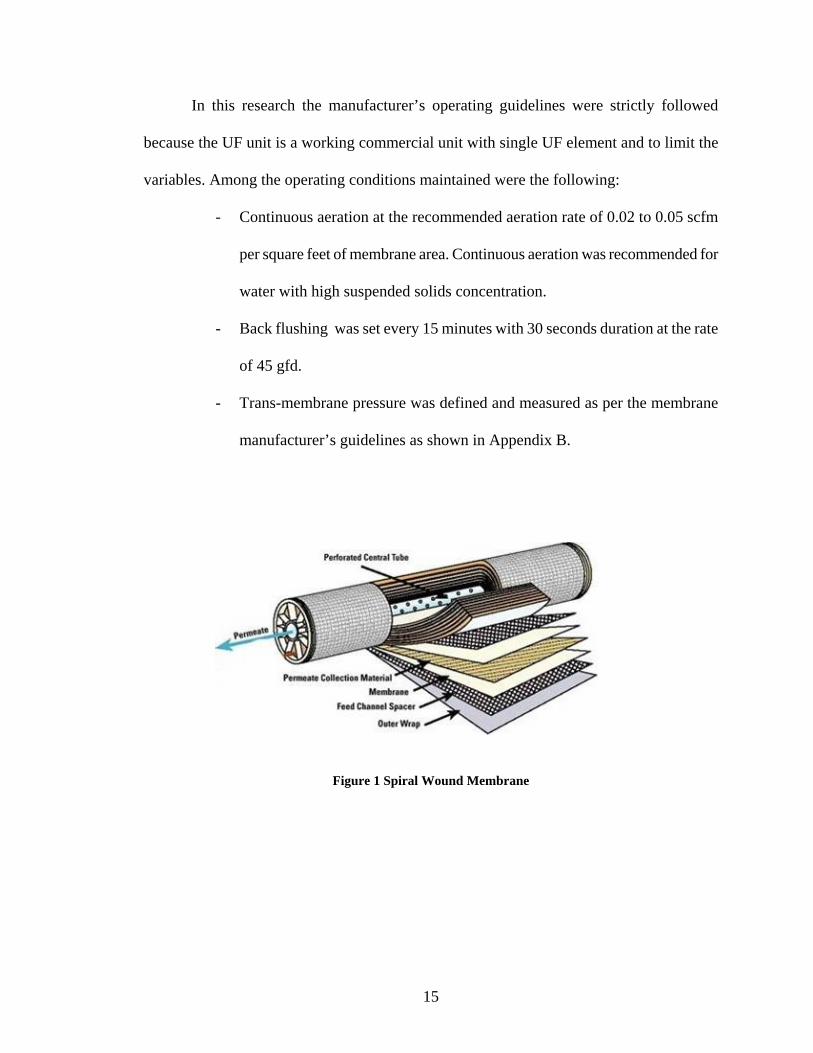
In this research the manufacturer’s operating guidelines were strictly followed
because the UF unit is a working commercial unit with single UF element and to limit the
variables. Among the operating conditions maintained were the following:
- Continuous aeration at the recommended aeration rate of 0.02 to 0.05 scfm
per square feet of membrane area. Continuous aeration was recommended for
water with high suspended solids concentration.
- Back flushing was set every 15 minutes with 30 seconds duration at the rate
of 45 gfd.
- Trans-membrane pressure was defined and measured as per the membrane
manufacturer’s guidelines as shown in Appendix B.
Figure 1 Spiral Wound Membrane
16
Chapter Three
Materials and Methods 3.1 Experimental Plan
The objective of this experiment is to demonstrate the applicability of combining
lime softening with ultrafiltration membrane to produce water that meets the beverage water
quality. The specific objectives are:
- Reduce hardness in the feed water and, at the same time, maintaining
alkalinity of the treated water to less than 50 mg/L as CaCO3
- Determine the relationships of operating pH and membrane flux with trans-
membrane pressure and membrane permeability.
- Compare the lime dosage in this research with the lime dosage used in
conventional lime softening plant, treating similar water source.
- Evaluate the operating parameters important in designing a full
scale plant. These includes membrane flux rates, permeability,
recovery, backwash intervals, cleaning intervals, and trans membrane
pressure.

17
3.2 Pilot Lime Softening Ultrafiltration Unit
The pilot lime softening ultrafiltration system was designed and built by
Doosan Hydro Technology, Tampa, Florida. The details of the plant are described in
Appendix A. The pilot unit is a full scale commercial operating plant with one
SpiraSep UF membrane immersed in a reactor tank.
3.2.1 Lime Reactor
The lime reactor is a polyethylene cylindrical conical bottom tank, with maximum
capacity of 200 gallons, to allow 30 minutes retention at the maximum flow of 5.7gallons per
minute (gpm). The tank was provided with discharges at three different levels for the
different flow rates. The elevation of the lime reactor is adjustable, in order to allow gravity
flow into the membrane reaction tank. The lime solution or slurry was fed by a BLUE-
WHITE Model A-100N Peristaltic Metering Pump, with a maximum capacity of 2.3 gallons
per hour (gph). The flow rate of the metering feed pump was controlled by the pH
transmitter.
The lime slurry or solution was fed to the incoming raw water into the mixing
chamber which directed the flow to the bottom of the lime reactor. The mixing chamber was
provided with a mixer (FPI Model PM1/20 PE) driven by a 1/20 horse power (hp) electric
motor. The precipitate, or sludge, settles at the bottom of the tank. Sludge was expected to
be carried over to the membrane reactor tank. The bottom of the lime reactor was provided
with a connection for pumping out the sludge at scheduled interval. The pH sensor was
installed at the inlet of the membrane reactor tank.
18
3.2.2 SpiraSep Ultrafiltration Membrane
The SpiraSep UF membrane manufactured by Trisep Corp. of Goleta,
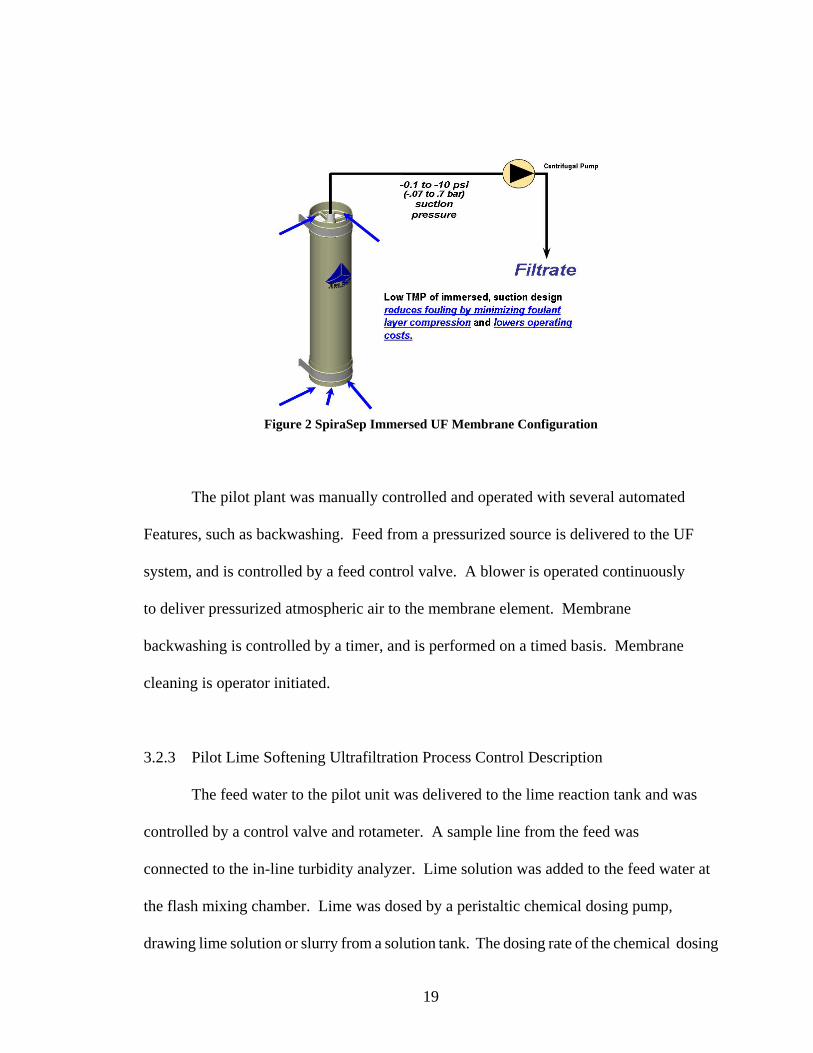
California is an immersed, negative-pressure ultrafiltration process, which will remove
suspended solids, turbidity, viruses, bacteria, and some organic compounds. A typical
SpiraSep system consists of an array of spiral wound elements submerged inside a
process tank. The membrane elements are attached to a manifold assembly, consisting
of a central permeate header with an array of membrane permeate ports, which
connects to the SpiraSep membrane. A vacuum is generated by the suction of a
centrifugal pump, creating the necessary net drive pressure to “pull” water through the
SpiraSep membrane. Air is bubbled up through each membrane element via bubble
diffusers, creating tremendous shear forces on the membrane surface that remove any
suspended solids. A small amount of a coagulant is injected into the process influent.
The enhanced coagulation process will help reduce organic fouling and improve
TOC and color reduction.
Periodically (on a timed basis), permeate water is reversed through the
membrane, or back flushed, to help further remove the accumulated suspended solids.
This process also introduces a small amount of disinfectant to help control the microbial
activity on the membrane surface. Concentrate is removed from the process tank, and
is typically less than 10% of the influent rate. SpiraSep membranes can also be
chemically cleaned through one of two processes: a periodic flux enhancement (PFE)
or a flux recovery clean (FRC) procedure.
19
Figure 2 SpiraSep Immersed UF Membrane Configuration
The pilot plant was manually controlled and operated with several automated
Features, such as backwashing. Feed from a pressurized source is delivered to the UF
system, and is controlled by a feed control valve. A blower is operated continuously
to deliver pressurized atmospheric air to the membrane element. Membrane
backwashing is controlled by a timer, and is performed on a timed basis. Membrane
cleaning is operator initiated.
3.2.3 Pilot Lime Softening Ultrafiltration Process Control Description
The feed water to the pilot unit was delivered to the lime reaction tank and was
controlled by a control valve and rotameter. A sample line from the feed was
connected to the in-line turbidity analyzer. Lime solution was added to the feed water at
the flash mixing chamber. Lime was dosed by a peristaltic chemical dosing pump,
drawing lime solution or slurry from a solution tank. The dosing rate of the chemical dosing
20
pump was controlled by the pre-set operating pH. The pH probe measures the pH of the
water in the overflow. From the flash mixing chamber, water flows downward to the
conical bottom of the lime reaction tank. A provision for another coagulant dosing was
included, in the event that another coagulant will be added in conjunction with or to
supplement the lime. The CaCO3 and other precipitates settled in the conical bottom of the
lime reactor tank and softened water overflowed to the UF process or membrane tank.
Carryover CaCO3 and/or precipitate were expected in the overflow.
Feed to the ultrafiltration unit results in two streams: filtrate and concentrate.
Feed was introduced to the membrane tank from the overflow in the lime reaction tank.
Once feed water was introduced to the membrane tank, the blower was turned on. The air
flow was manually adjusted to provide the proper air flow rate to the element. The air flow
rate was measured using a flow meter. The concentrate valve was set to obtain the proper
concentrate flow rate.
Once the membrane tank was completely filled, the Process Logic Controller
(PLC) will start the filtrate pump and open the concentrate valve. The UF filtrate pump
provides the necessary net drive pressure to force feed water through the membrane
surface. A self-priming centrifugal pump generates a vacuum, typically less than -10 psi,
drawing water through the UF membrane surface. Filtrate flow was manually set with a
control valve but pump operation is controlled via the PLC.

21
Figure 3 SpiraSep UF Membrane in Backflushing Mode
The filtrate pump flow rate was adjusted manually with the permeate control
valve. The UF membrane was back flushed at set interval The water required for the
membrane back flush was taken from the UF filtrate tank and pumped to the membranes
using a separate backwash pump. The backwash pump reverses the flow of water
through the UF membranes. A membrane back flush was performed every 15 minutes
for 30 seconds and is automatically controlled by the PLC.
Once filtrate production started, timers for the back flush frequency and Periodic
Flux Enhancement (PFE) are started. The blower remains on running at the manually set
value.

22
Figure 4 Spirasep UF Membrane Air Scour
Figure 5 UF System During Filtration
When a back flush sequence is started, the automatic feed valve was closed, and
the filtrate pump and blower were automatically turned off (concentrate valve remains

23
open). UF filtrate water and chlorine were then backflushed through the membrane for
a period of about 30 seconds. A Variable Frequency Drive (VFD) adjusts the back flush
pump speed, to the manually set value. Output of the metering pump was manually adjusted.
Excess water introduced to the tank was removed via a tank overflow and/or concentrate
line. Once the back flush sequence was completed, the back flush pump and chlorine
metering pump were automatically turned off. The blower was turned on and allowed to
operate for 10 – 15 seconds before the filtrate pump was restarted and the feed valve opened
to allow normal filtrate production.
Figure 6 UF System During Backflushing
The UF membrane was continuously aerated to prevent and minimize membrane
fouling. A blower takes atmospheric air and bubbles them up through individual
membrane module via an aeration disc. The blower was operated using a VFD, and the
motor speed is set manually. The operation of the blower was controlled by the PLC.

24
Air was delivered to the UF membrane through a coarse bubble diffuser. The air
diffuser was attached to an aeration pipe. The aeration pipe contains a manual flow
control valve and air flow indicator to ensure proper air flow.
Various chemicals were dosed for various system operations. Chlorine was dosed
during each back flush, in addition to PFE and Clean-In-Place (CIP) processes. Sodium
hydroxide was injected for just PFE and CIP processes. Citric acid was dosed for PFE and
CIP processes. The flow rates of the chemical dosing pumps were set manually. Operation
of the chemical dosing pumps during backwash, PFE, and CIP was controlled by the PLC.
Operating performance can be optimized through the use of PFE. A chemical
solution was backwashed through the membranes in situ to perform a quick chemical
treatment. This process was performed while the membrane tank was filled with process
water, requiring approximately 20 – 30 minutes. This was done on a daily or every two
days. When a PFE process was initiated, the feed valve was closed, and the filtrate pump
and blower were turned off. UF filtrate and chemicals were then automatically back flushed
through the membranes while they are still immersed in the feed water (i.e. membrane tank
is not drained for this process). Excess water introduced to the tank was removed via a tank
overflow and/or concentrate line.
During membrane cleaning, a cleaning solution was back flushed through the
membranes until the filtrate tank was completely filled. The membrane was statically
soaked in the cleaning solution for approximately 4 – 8 hours. A CIP process is typically performed once every 3 months for municipal water treatment. Actual CIP
frequency is determined through pilot testing and actual plant operation. CIP is a manual
operation. In high suspended solids environment like in lime softening CIP every 2-3 weeks

25
is acceptable. The UF system is normally designed to allow the membrane elements cleaned
in place in the membrane tank. UF filtrate and cleaning chemicals are back flushed through
the membranes until the CIP tank is completely filled. At the end of the chemical soak, the
tank is drained and then refilled.
Figure 7 Process Flow Diagram of Pilot Unit
26
3.3 Chemicals
The chemicals used in the pilot test are:
- Hydrated Lime, Ca(OH)2, 93%, CAS 1305 – 78-8, technical grade
- Sodium Hypochlorite, NaOCl, 12% chlorine CAS 7681-52-9
- Sodium Hydroxide, NaOH, 45% CAS 1310-73-2
- Citric Acid Anhydrous 99.5%, C6H8O2 CAS 77-92-9
A 3.2 % lime slurry was prepared by adding 32.24 grams of hydrated lime (93%
Ca(OH)2) per liter of water mixed into the slurry tank. The 3.2 % lime slurry has a
specific gravity of 1.020 or 2.84 Baume, which will be verified using a Hydrometer
(Cole Palmer Cat# C-08287-55, range SG 1.000 to 1.225, Baume 0 to 26 deg).
The sodium hypochlorite (12% chlorine) was dosed at 10 mg/L during back
flush and 100 mg/L during Periodic Flux Enhancement (PFE). The sodium
hypochlorite solution for both the back flush and the PFE back flush were dosed by
metering pumps drawing directly from the sodium hypochlorite container.
The citric acid crystals was dissolved in water at 200 grams/L solution.
From this stock solution, the citric acid was dosed directly to the PFE back flush line at
rate of 2 l/h. during CIP. The citric acid was dosed to the CIP line at the rate of 20
l/h.
Caustic soda, 45% solution was dosed at 0.1% or 1,000 ppm using chemical feed
pump at a rate of 0.63 l/h drawing directly from the caustic soda container.
27
3.4 Experimental Procedures
The pilot unit was initially operated for one week without any chemical
addition to stabilize the flow and calibrate the instruments. After one week the pilot
unit was operated for approximately one month with varying dosage of lime to
determine the conditions that can provide the desired water quality. The pilot unit was
operated for another month at the selected optimum operating conditions. The lime
slurry was dosed by peristaltic pump (Blue White Model A1N30F-6T) with maximum
capacity of 1.25 gph (4.73 lph). This pump is capable of delivering lime up to 346
mg/L when operating at flux of 15 gfd and 120 mg/L when operating at 45 gfd.
Operating flux of 15 gfd was selected to be the starting flux, based on previous pilot
testing using other coagulants such ferric chloride, ferric sulfate and alum. Trisep
recommends the following sustainable flux rates: For municipal secondary
effluent: 15 to 18 gfd; municipal drinking water: 25 gfd; landfill leachate (with
chemical precipitation): 15 gfd. The flux will eventually increase to 30, and 45 gfd.
Lime slurry was dosed to achieve pH of 8.3, 9.4, 10.6, and 11.2 at the lime reactor
overflow or discharge to the membrane tank. The various phases of testing were performed
at the following schedule:
Day Flux (gfd) pH
1 15 Feed water pH 2 15 Feed water pH 3 30 Feed water pH 4 30 Feed water pH 5 45 Feed water pH 6 45 Feed water pH 7 15 8.3 8 15 8.3 9 30 8.3 10 30 8.3

28
11 45 8.3 12 45 8.3 13 15 9.4 14 15 9.4 15 30 9.4 16 30 9.4 17 45 9.4 18 45 9.4 19 15 10.6 20 15 10.6 21 30 10.6 22 30 10.6 23 45 10.6 24 45 10.6 25 15 11.2 26 15 11.2 27 30 11.2 28 30 11.2 29 45 11.2 30 45 11.2
The flux was set by controlling the flow through the filtrate pump through the
adjustment of the filtrate control valve. During the test the trans-membrane pressure (TMP)
was monitored through a digital pressure indicator connected to a pressure transmitter
installed at the manifold between the UF membrane filtrate discharge and the suction
of the filtrate pump.
The pilot testing log will include the following information: Date and time,
actual flow rate reading, total flow (from flow totalizer), pH, temperature, raw water
and filtrate turbidity, TMP or UF pump suction line pressure located at the same level as the
water in the UF reactor tank. The net flow in each segment of test can be determined and
used as basis of calculating the average permeability.
29
The flow is indicated by a SIGNET Model 8550 Flow Transmitter with digital
flow indicator and totalizer, receiving signal from a SIGNET Model 515 flow sensor.
The pH is indicated by a SIGNET Model 8750 pH transmitter with digital pH and
temperature indicator, receiving signal from a SIGNET Model 2754 pH probe. The
TMP is measured by local mounted EFFECTOR pressure transmitter/ indicator. The
turbidity is continuously monitored by HACH Model 1720D Low Range Process
Turbidimeter, provided with sample connections to allow turbidity measurement of
either the raw water or the filtrate.
The permeability was plotted against elapsed time. The permeability was
calculated as flux (in gfd) divided by the trans membrane pressure (psi). The
permeability has a unit of gfd/psi. The TMP values were also plotted against time.
Composite samples of feed and filtrate were taken daily and were analyzed for
pH, alkalinity, calcium and magnesium hardness, conductivity, turbidity, and total
organic carbon (TOC). Sample of the water in the membrane reactor was also taken
for suspended solids analysis.
3.5 Analytical Procedures
The analysis of the water samples were made following the EPA Methods and
Standard Methods for the Examination of Water and Wastewater (APHA, AWWA, WEF,
1995). The water samples taken during the test were sent to Severn Trent Laboratories, Inc.
(STLI) in Tampa for analysis. STLI is EPA certified laboratory. Chemical analyses were
also conducted on site using Hach test kits for verification and calibration of instruments.

30
Water analysis was also conducted in the nearby CSD bottler’s laboratory, for comparison.
Analysis was also done at the Ameraican Water Chemicals facilities.
3.5.1 pH and Temperature
pH and temperature were directly measured using the installed pH analyzer
(Signet 8750 ProcessPro pH Transmitter) with immersed probe (Signet 2754 pH
probe). The immersed pH probe was calibrated with pH buffer kit (Signet PN 3-
0700.390). The pH of the water samples were measured using portable pH meter (Hach
SensION 1 Portable pH meter). The probe of the portable pH meter was calibrated using
pH 4.01 and pH 10.0 buffer solutions (Hach PN#22834-49 and PN#22836-49).
3.5.2 Alkalinity
Alkalinity was measured using SM18 2320 B.
3.5.3 Calcium and Magnesium Hardness
The calcium and magnesium hardness were measured using EPA SW846-
6010B Inductive Coupled Plasma – Atomic Emission Spectrometry- Total Recoverable.
.
3.5.4 Turbidity
Turbidity was measured using a portable turbidimeter (Hach Model 2100
Series) calibrated with <0.1, 1, 20, 100 and 800 NTU stabilized formazin standards (Hach
Calibration kit PN#26594-05) and EPA Method 180.1. Turbidity was also measured directly
from the HACH Model 1720D Low Range Process Turbidimeter installed in the pilot unit.
31
3.5.5 Total Suspended Solids
Total Suspended Solids was analyzed using EPA Method 160.2 . The suspended
solids analyzed was the calcium carbonate precipitate in the UF reactor tank.
3.5.6 Total Organic Carbon
Total organic carbon was analyzed using EPA Method 415.1
32
Chapter Four
Results and Discussions The pilot testing was conducted at Doosan Hydro Technology, Inc. facilities in
Tampa, Florida. The pilot testing was divided into three phases. The first phase was
to stabilized the flows and calibrate control valves and instruments. The first phase
started on October 15, 2005, and was supposed to last one week, however it was extended by
one more week, due to mechanical and instrument problems. The second phase was
performed at varying flux and pH conditions. It started on October 29, 2005 and lasted
four weeks. The objective of the third phase was to simulate the operation in a CSD Bottler
Plant, based on the data obtained from the second phase. The third phase started on
December 2, 2005 and ended on January 5, 2006. The source of feed water during the test
was city of water supply.
4.1 Initial Operating Conditions Without Chemical Addition
The purpose of running the pilot unit at different flux levels, without the
addition of chemicals, is to determine the flow characteristics of the unit and to calibrate
the instruments. Based on the UF membrane area of 178 ft2, the filtrate flow rates of
1.9, 3.7 and 5.6 gpm corresponded to flux values of approximately 15, 30 and 45 gfd.
During the initial test run, it was noticed that display on the pressure indicator in the

33
suction line of the UF permeate pump was giving reading on increments of 0.5 psig and
has to be replaced with a pressure indicator to provide reading down to 0.1 psig. pH and
temperature were continuously displayed. The pressure measured on the UF membrane
filtrate discharge and suction of the UF permeate pump pipework is the trans-membrane
pressure. The location of the pressure sensor was in the same level as the water level in the
UF reactor tank as recommended by the membrane manufacturer. This eliminated the need
for correcting for the difference in hydraulic heads. The vacuum pressure reading can be
considered as the trans-membrane pressure. Controlling the filtrate flow with the manual
ball valve at the discharge of the UF pump was difficult, especially at lower flow, and it was
replaced with a more accurate globe valve. After the flow and pressure readings were
stabilized, the pilot unit was operated with varying flows of 1.9 to 5.6 gpm. The back
flushing was set every 15 minutes for duration of 30 seconds. It was expected that the
TMP will increase prior to back flushing. During the initial run at 1.9 gpm, the TMP
remained at -0.5 psi, before and after back flushing throughout the 2 days of operation.
At the flow of 3.7 gpm, the TMP stayed consistently at -1.1 psi after back flushing,
and the pressure before back flushing was -1.5 psi. When operating at 5.6 gpm, the TMP
after back flushing was -1.7 psi and increased to -2.0 psi before back flushing. Water
samples were taken for analysis. Raw water analysis is shown in Table 4. The
average pH of the feed water is 7.3 and the water temperature ranges from 20 to 25oC.
Chlorine was not dosed during back flushing and during PFE.
34
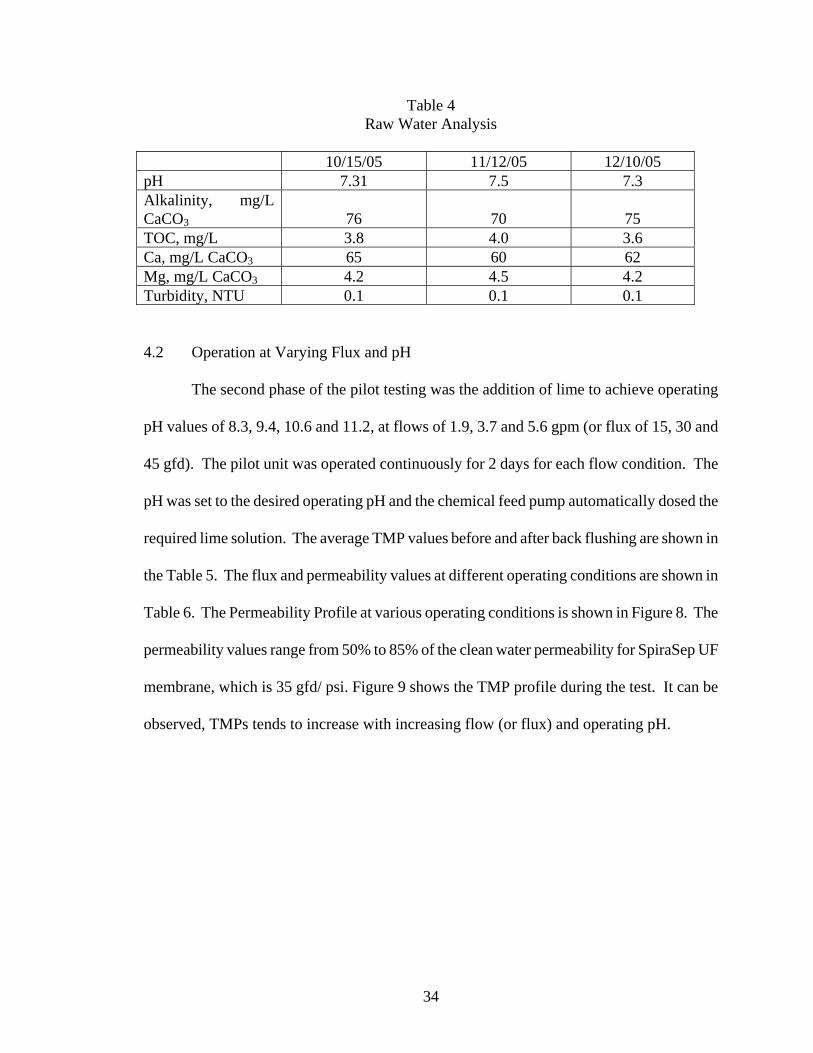
Table 4 Raw Water Analysis
10/15/05 11/12/05 12/10/05 pH 7.31 7.5 7.3 Alkalinity, mg/L CaCO3
76
70
75
TOC, mg/L 3.8 4.0 3.6 Ca, mg/L CaCO3 65 60 62 Mg, mg/L CaCO3 4.2 4.5 4.2 Turbidity, NTU 0.1 0.1 0.1 4.2 Operation at Varying Flux and pH The second phase of the pilot testing was the addition of lime to achieve operating
pH values of 8.3, 9.4, 10.6 and 11.2, at flows of 1.9, 3.7 and 5.6 gpm (or flux of 15, 30 and
45 gfd). The pilot unit was operated continuously for 2 days for each flow condition. The
pH was set to the desired operating pH and the chemical feed pump automatically dosed the
required lime solution. The average TMP values before and after back flushing are shown in
the Table 5. The flux and permeability values at different operating conditions are shown in
Table 6. The Permeability Profile at various operating conditions is shown in Figure 8. The
permeability values range from 50% to 85% of the clean water permeability for SpiraSep UF
membrane, which is 35 gfd/ psi. Figure 9 shows the TMP profile during the test. It can be
observed, TMPs tends to increase with increasing flow (or flux) and operating pH.

35
Table 5 Average Vacuum Pressures or TMP Values in psi Before and After
UF Back Flushing at Various Flux Values
Flux Values pH 15 gfd 30 gfd 15 gfd 7.3 -0.4/-0.5 psi -1.1/-1.3 psi -1.8/-2.0 psi 8.3 -0.6/-0.8 psi -1.2/-1.5 psi -1.9/-2.2 psi 9.4 -0.6/-0.8 psi -1.3/-1.8 psi -2.2/-2.6 psi 10.6 -0.7/-1.0 psi -1.6/-2.2 psi -2.4/-2.8 psi 11.2 -0.6/-1.0 psi -1.7/-2.3 psi -2.6/-3.4 psi
Note: After BF/Before BF
Table 6 Flux vs. Permeability at Various Operating pH
Flux
pH 15 gfd 30 gfd 45 gfd 7.3 29.6 26.29 26.12 8.3 25.81 25.31 23.95 9.4 25.14 23.03 20.43 10.6 23.0 19.32 19.21 11.2 21.4 19.05 18.17
Note: Permeability is gfd/psi

36
0.00
5.00
10.00
15.00
20.00
25.00
30.00
35.00
0 100 200 300 400 500 600 700 800 900
Operating Hours
gfd/
psi
Figure 8 Permeability Profile at Various Operating Conditions

37
0
0.5
1
1.5
2
2.5
3
0 100 200 300 400 500 600 700 800 900
Operating Hours
TMP p
si
Figure 9 TMP Profile at Various Operating Conditions
Composite raw water and filtered water samples were analyzed for Ca, Mg,
Alkalinity, pH, turbidity, and TOC. Grab water sample from the membrane reactor
was also taken for total suspended solids analysis. The results of the water analysis
are shown in Table 7.
An analysis of water sample was also conducted by the CSD Bottler and shown in
Table 8. Note that there is difference between the operating pH value and the pH of the
Filtrate analyzed in the laboratory. The pH of the filtrate was expected to be lower due to the
effect of aeration in the UF tank which tends to strip the CO2 or add CO2 from the air.
Aeration has stabilizing effect on the filtrate. During the test the amount of lime in each run
was not monitored, however every time a batch was prepared, the quantity was recorded.

38
Table 7 Analysis of Water Samples at Various Operating Conditions
Operating pH
7.3
7.3
8.3
9.4
10.6
11.2
pH of the Sample
7.31
7.31
8.06
9.2
10.3
10.8
Type of Water
Raw
Filtrate
Filtrate
Filtrate
Filtrate
Filtrate
Alkalinity, mg/L CaCO3
76
76
62
30
36
36
TOC, mg/L
3.8
3.8
3.7
3.5
3.3
3.2
Ca, mg/L as CaCO3
65
65
57
38
41
56
Mg, mg/L as CaCO3
4.6
4.6
4.5
4.3
3.9
2.4
Turbidity NTU
0.1
0.05
0.05
0.05
0.05
0.05
From the tables above, it can noted that there is a significant reduction of alkalinity
and hardness, whereas at pH 10.6, the alkalinity and hardness increased. At pH 10.6 and
Above, the increase in alkalinity and calcium was due to the lime addition. The
magnesium concentration continues to drop as the pH went up as expected.
The dilute sludge that accumulates at the bottom of the membrane reactor tank
is manually drained, when the unit is stopped. During backwashing, the water in the
membrane reactor overflows to lime reactor tank. The concentration of the suspended
solids in the membrane reactor is shown in Table 9. It was observed that there was
slight change in the sludge concentration when operating pH changed as shown in Table 9.
39
The concentrated sludge that accumulated at the bottom of the lime reactor tank was
pumped out using another rotary flexible impeller pump rated at 0.25 gpm. Usually, 1/3 of
the sludge in the conical section of the lime reactor tank was drained when the volume of
sludge reaches the top of the conical section.
4.3 Operation at CSD Bottler Plant Conditions The next phase of the test was to simulate the operation in an actual CSD bottler
plant condition. Operation at pH 9.4 to 9.8 was chosen because the results in the previous
tests satisfied the water quality requirement of the CSD bottler using the same source water
as used in this test, although their actual operating pH was slightly higher. The resulting
alkalinity level was favorable to their operation. The flux selection of 30 gfd (or flow of 3.7
gpm) was based on the following factors: economics, competing UF membrane’s operating
flux, test results from the second phase of the test, and guideline of the membrane
manufacturer. The test also predicted the intervals between cleaning and estimated the
consumption of lime. Water samples were taken and analyzed. The amount of lime used
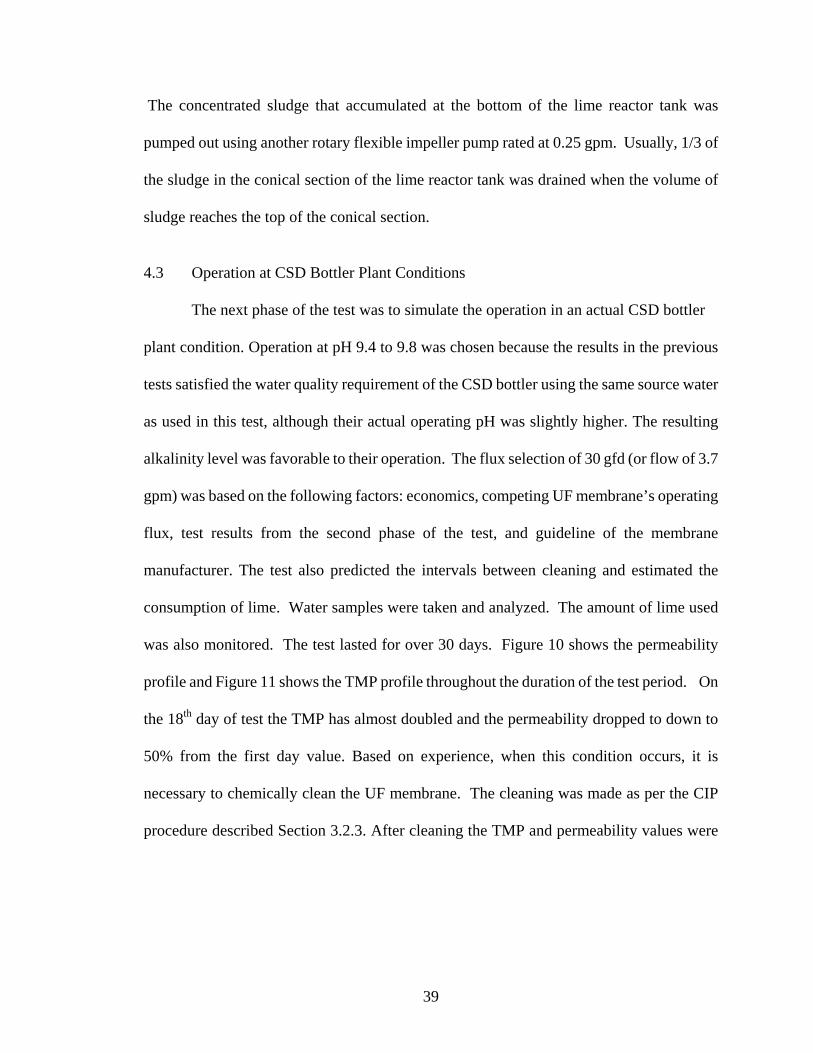
was also monitored. The test lasted for over 30 days. Figure 10 shows the permeability
profile and Figure 11 shows the TMP profile throughout the duration of the test period. On
the 18th day of test the TMP has almost doubled and the permeability dropped to down to
50% from the first day value. Based on experience, when this condition occurs, it is
necessary to chemically clean the UF membrane. The cleaning was made as per the CIP
procedure described Section 3.2.3. After cleaning the TMP and permeability values were

40
restored to the first day values. The operation of the pilot unit was continued for another 10
days after cleaning. The TMP and permeability profile after cleaning is similar to the initial
profile. The analysis of the filtrate by STLI and the CSD bottler are shown in Tables 7 and
8.
Table 8
Analysis of the Filtrate by CSD Bottler
Operating pH 7.3 9.45 9.6 9.8 pH (Lab) 7.3 8.49 9.65 9.14
Phenolphthalein Alkalinity, mg/L CaCO3
4.2
9.6
23.3
14.8
Methyl Orange Alkalinity,
mg/L CaCO3
88.1
35.8
33.7
26.8
0.00
5.00
10.00
15.00
20.00
25.00
30.00
35.00
0 200 400 600 800 1000
Operating Hours
Per
mea
bilit
y
Permeability gfd/psi
Figure 10 Permeability Profile at CSD Bottler Operating Conditions
41
0
0.5
1
1.5
2
2.5
0 200 400 600 800 1000
Operating Hours
TMP
psi
Figure 11 TMP Profile at CSD Bottler Operating Conditions
The concentration of suspended solids in the membrane reactor tank was
maintained at 600 to 700 mg/L range. Backflushing seemed to maintain constant solids
concentration in the membrane reactor. During backflushing, the excess water flowed back
to the lime reactor tank, carrying suspended solids, and the backwash water diluted the
water in membrane reactor. The sludge from the membrane and lime reactor
tanks were drained as described in Section 4.2.
Table 9 Average Suspended Solids Concentrations in the Membrane Reactor
Operating pH
7.3
8.3
9.4
10.6
11.2
Suspended Solids conc., mg/L
10
580
600
600
680

42
Chapter Five Summary and Conclusions
5.1 Alkalinity Reduction Alkalinity reduction to less than 50 mg/L or to the preferred level of 20 to 30
mg/L and maintenance of the desired Phenolphthalein Alkalinity and Methyl Orange
Alkalinity (2*P alk – MO alk = 2 to 7) can be achieved continuously in the lime
softening UF unit with relatively simpler control, operation and maintenance compared to
conventional lime softening process. The lime softening UF unit can be started in a
matter of minutes, unlike the conventional lime softening which requires hours or days to
build up of the sludge blanket before stable operation is achieved. The lime dosage
during the third phase of test (operating pH=9.8) was 70 mg/L, based on raw water
alkalinity concentration of 76 mg/L and pH of 7.3 and the filtrate alkalinity and pH are
26.8 mg/L and 9.18 respectively. The theoretical or calculated dosage using the
Rothberg, Tamburini, and Windsor model was 65 mg/L. The lime dosage of the CSD
bottler was in the range of 120 to 130 mg/L operating at pH of 9.8 to 10.2 with ferric
chloride addition.
5.2 UF Filtrate Turbidity
The turbidity of the filtrate was consistently observed to be in the range of 0.04 to
0.05 NTU throughout the duration of the test. The filtrate turbidity was not affected by

43
the incoming feed water turbidity. When the pilot unit was operated without the lime
addition, the feed water and filtrate turbidity were 0.1 NTU and 0.05 NTU,
respectively. The suspended solids concentration in the membrane reactor tank
throughout the test was in the range of 580 to 650 mg/L. Table 9 shows the average
suspended solids concentration in the membrane reactor.
5.3 Trans-membrane Pressure (TMP) vs. pH and Flux
The increase in flux results to corresponding increase in TMP, however as the
operating pH increases, the rate of TMP increases as shown in Figures 13 and 15.
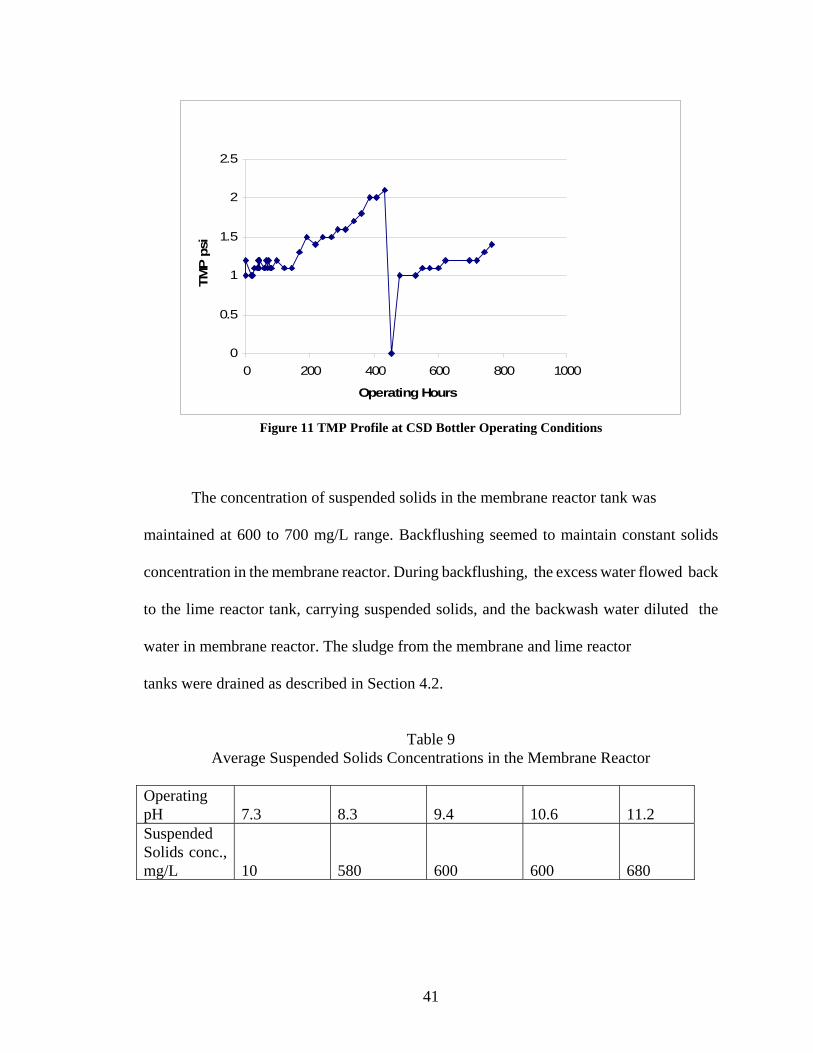
5.4 Permeability
The operating the pH vs. permeability profile shown in Figure12 indicates,
the permeability decreases with increasing operating pH. The TMP vs. flux
profile shown in Figure 14 , indicate permeability decrease with increasing flux.
The decline in permeability during the second phase of the test was due to the
increase in operating pH. The starting and ending average permeability values were
31.25 gfd/psi and 17.53 gfd/psi. The prolonged operation without CIP had not impacted
the permeability, because when the third phase of the test started, the starting average
permeability during the first 2 days of operation was 26.93 gfd/psi, which is
comparable to 25.5 gfd/psi when the operation started in second phase of the
test at pH 9.4.
44
0
10
20
30
40
50
60
70
80
90
7.3 8.3 9.4 10.6 11.2
Operating pH
Per
mea
bilit
y gf
d/ps
i
45 gfd
30 gfd
15 gfd
Figure 12 Permeability vs. Operating pH at Various Flux Rates
0
0.5
1
1.5
2
2.5
3
7.3 8.3 9.4 10.6 11.2
Operating pH
TMP
psi
15 gfd
30 gfd
45 gfd
Figure 13 TMP vs. Operating pH at Various Flux Rates

45
0
5
10
15
20
25
30
35
15 30 45
Flux gfd
Perm
eabi
lity
gfd/
psi
pH 7.3
pH 8.3
pH 9.4
pH 10.6
pH 11.2
Figure 14 Permeability vs. Flux at Various Operating pH
0
0.5
1
1.5
2
2.5
3
15 30 45
Flux gfd
TMP
psi
pH 7.3
pH 8.3
pH 9.4
pH 10.6
pH 11.2
Figure 15 TMP vs. Flux Various Operating pH
5.5 Total Organic Carbon (TOC)
The data in Table 7 indicate that there was no reduction in TOC when the
pilot unit was operated without lime addition. With the addition of lime, there was a
slight reduction of TOC. The reduction in TOC ranged from 2.6% to 15.8%, when the
pilot unit was operated at various pH values.

46
5.6 Hardness Reduction
Table 7 indicates the reduction in Ca and Mg hardness which was expected
as a result of the increase in operating pH. The reduction of hardness is secondary
concern in CSD bottling operations. It is assumed that alkalinity reduction will reduce
hardness.
5.7 Operating Flux
The operating flux of 30 gfd was initially selected because most of the
ultrafiltration membranes used in treating municipal operate at this flux value, although
Trisep recommendation is 25 gfd for treating municipal water supply, when dosing
coagulants (such as ferric chloride or sulfate, alum and polyaluminum chloride). It was
assumed that lime will behave like the other coagulants although there were concerns of
excessive fouling and scaling. The results of this research confirmed that the immersed
SpiraSep UF membrane can achieve the treatment objectives when operated at flux of 30
gfd, and fed with lime treated water at pH 9.8, with suspended solids concentration of
600 mg/L. The cleaning of the membrane or CIP was initiated when the TMP value was
doubled, which correspond to about 50% of clean membrane permeability. The CIP was
conducted after 19 days of operation, noting that the pilot unit has been in operation for
over 30 days in the first and second phases before the third phase started. The third phase
of the test also confirmed the following: the cleaning procedures and chemicals
mentioned in Section 3.2.3 effectively restored the membrane to its starting TMP and
permeability; by extrapolating the permeability and TMP profiles the expected next
cleaning will be after 48 days. This corresponds to 30 days cleaning interval.

47
5.8 Chlorination
During the entire duration of test, chlorine was not added to the back flush water
or in the PFE. The residual chlorine in the feed water ranged from 0.2 to 0.7
mg/L. Chlorine was dosed only during CIP and when the unit was stopped longer
than 24 hours.
5.9 Benefits of the Lime Softening Ultrafiltration (LSUF) Process to CSD Bottler
The benefits of the Lime Softening Ultrafiltration Process to CSD bottler, based
on the results of this study can be summarized in the following:
- There is considerable economic benefit when the conventional
treatment processes comprising of chlorination, lime softening,
clarification, and filtration, is replaced with LSUF comprising of a
single equipment with smaller footprint. With less equipment,
operation and maintenance will be simpler.
- The LSUF process requires shorter time for start-up, unlike
conventional lime softening which requires time to build up sludge,
stabilize the flow and attain the desired treated water quality.
- The LSUF process produces less sludge and dirty backwash water.
It can be operated at relatively lower pH and with no addition of ferric
chloride which significantly reduced the volume of sludge. The water during
backflush operation can be returned back to the system. The water wasted is
the water that goes with the waste sludge, which is minimal.
48
- Continuous chlorination of raw water can be eliminated, reducing the
formation of the THMs.
- Process control in LSUF reduced to adjustment of pH and flows.
The process is less sensitive to temperature.
- In LSUF process, the sludge removal is simplified because there is no
sludge blanket to maintain.
- The ultrafiltration process provides physical barrier for microorganism
and particles, minimizing the contamination in the down stream
processes.
- Existing lime softening plants can be retrofitted and their rated capacity
can be increased with just the addition of the UF system processes.

49
References Bachelor, B. and M. McDevitt ,1984. “ An Innovative Process for Treating Recycled
Cooling Water”. Journal WPCF, 56, 10, 1110 - 1117. Bachelor, B., M. Lasala, M. McDevitt, and E. Peacock, 1991. “Technical and Economic
Feasibility of Ultra-High Lime Treatment of Recycled Cooling Water”. Research Journal WPCF, 63, 7, 982 – 990.
Collins, M.R., G.L. Amy, and P.H. King, 1985 “Removal of Organic Matter in Water
Treatment.” J.Env. Eng., 111:6: 850 – 864. Gould, B., 2004.,Personal Communication, Trisep Corporation, Santa Barbara, CA, Gould, B., 2003 “Utilizing Spiral Wound Membrane Efficiency for Ultrafiltration by
Enabling Backwash Configuration “, Paper presented at 12th ACS Anniversary.
Li, C., J. Jian and J. Liao, 2004. “Integrating Membrane Filtration and a Fluidized-bed
Pellet Reactor for Hardness Removal”. J. AWWA, 96:8:151- 158. Liao, M.Y. and S.J. Randke, 1985. “Removing Fulvic Acid by Lime Softening”. J.
AWWA, 77:8:78 – 88. Humenick, M..J, 1977. Water and Wastewater Treatment. New York: Marcel: Decker,
Inc. Morelli, Cliff D., 1994. Water Manual 3rd ed., New York, World Beverage. Permutit, 1961, Water and Waste Treatment Data Book, New Jersey: The Permutit
Company. Scuras, S, M.R. Rothberg, S.D. Jones, and D.A. Alami, 1999. The Rothberg, Tamburini,
& Windsor Model for Water Process and Corrosion Chemistry Version 4 User’s Guide, Denver, Colorado: Rothberg, Tamburini, & Windsor, Inc.
Shachman, M., 2004. Soft Drink Companion: A Technical Handbook for Beverage
Industry, New York: CRC Press.
50
Trisep, 2003. SpiraSep Ultrafiltration Membrane Technology Transfer Manual, Trisep
Corporation, Goleta, CA. US EPA, 1999. Enhanced Coagulation and Enhanced Precipitative Softening Guidance
Manual. EPA 815-R-99-012. Washington, DC.

51
Appendices
52
Appendix A Pilot Unit Equipment Description
1.0 Pilot Plant Systems Parameters
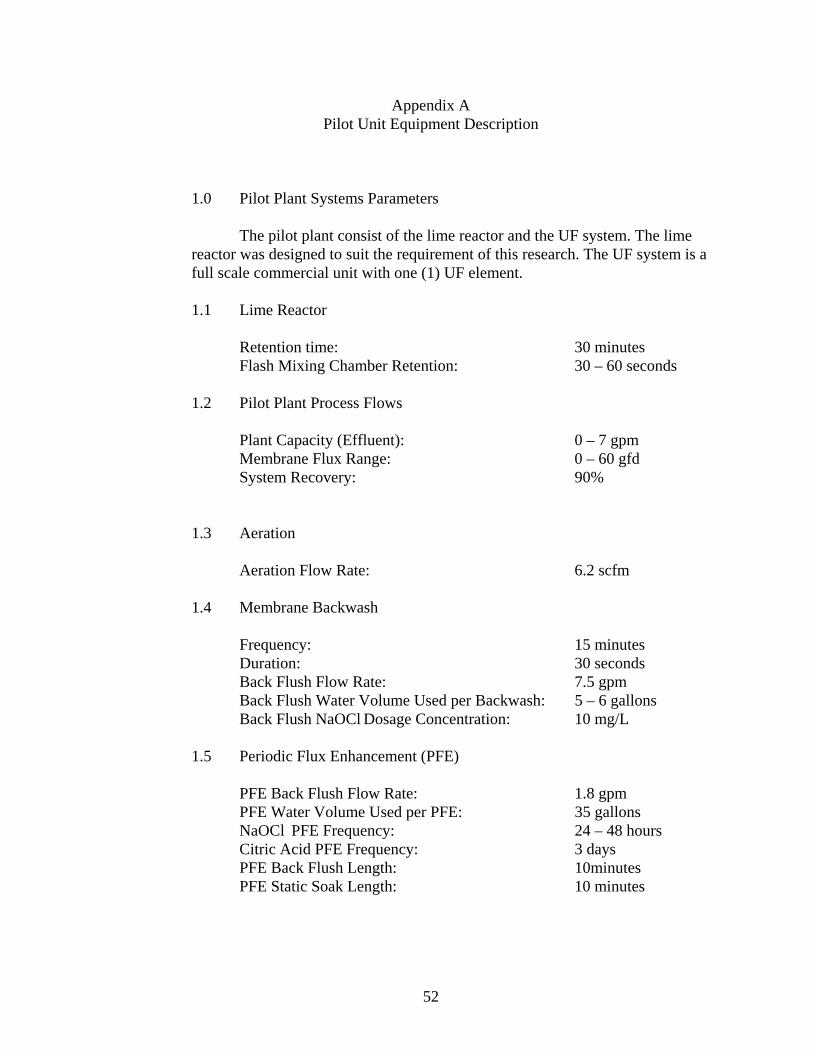
The pilot plant consist of the lime reactor and the UF system. The lime reactor was designed to suit the requirement of this research. The UF system is a full scale commercial unit with one (1) UF element. 1.1 Lime Reactor
Retention time: 30 minutes Flash Mixing Chamber Retention: 30 – 60 seconds
1.2 Pilot Plant Process Flows
Plant Capacity (Effluent): 0 – 7 gpm Membrane Flux Range: 0 – 60 gfd System Recovery: 90%
1.3 Aeration
Aeration Flow Rate: 6.2 scfm
1.4 Membrane Backwash
Frequency: 15 minutes Duration: 30 seconds Back Flush Flow Rate: 7.5 gpm Back Flush Water Volume Used per Backwash: 5 – 6 gallons Back Flush NaOCl Dosage Concentration: 10 mg/L
1.5 Periodic Flux Enhancement (PFE)
PFE Back Flush Flow Rate: 1.8 gpm PFE Water Volume Used per PFE: 35 gallons NaOCl PFE Frequency: 24 – 48 hours Citric Acid PFE Frequency: 3 days PFE Back Flush Length: 10minutes PFE Static Soak Length: 10 minutes

53
Appendix A: (Continued)
NaOCl PFE Dosage Concentration: 100 mg/L Citric Acid PFE Dosage Concentration: 0.1%
1.6 Clean-In-Place (CIP)
CIP Backwash Flow Rate: 1.8 gpm CIP Tank Volume per Manifold: 75 gallons NaOCl CIP Cleaning Frequency: 3 months CIP Duration: 4 – 8 hours NaOCl CIP Dosage Concentration: 2,000 mg/L NaOCl CIP Concentration: 0.1% Citric Acid CIP Cleaning Frequency: 3 months Citric Acid CIP Concentration: 1.0%
2.0 Equipment Specifications
2.1 Lime Reactor Type: Cylindrical with conical
bottom Capacity: 200 gallons Materials of Construction: PE Mixer: 1/20 hp
2.2 Ultrafiltration Membrane
Model: SpiraSep 900 Chemistry: PES Quantity: One (1) Element Diameter: 9.38 inches Element Length: 42 inches
2.3 Aeration Manifold
Material: Schedule 40 PVC Size: 1 inch Schedule 40 PVC
54
Appendix A: (Continued)
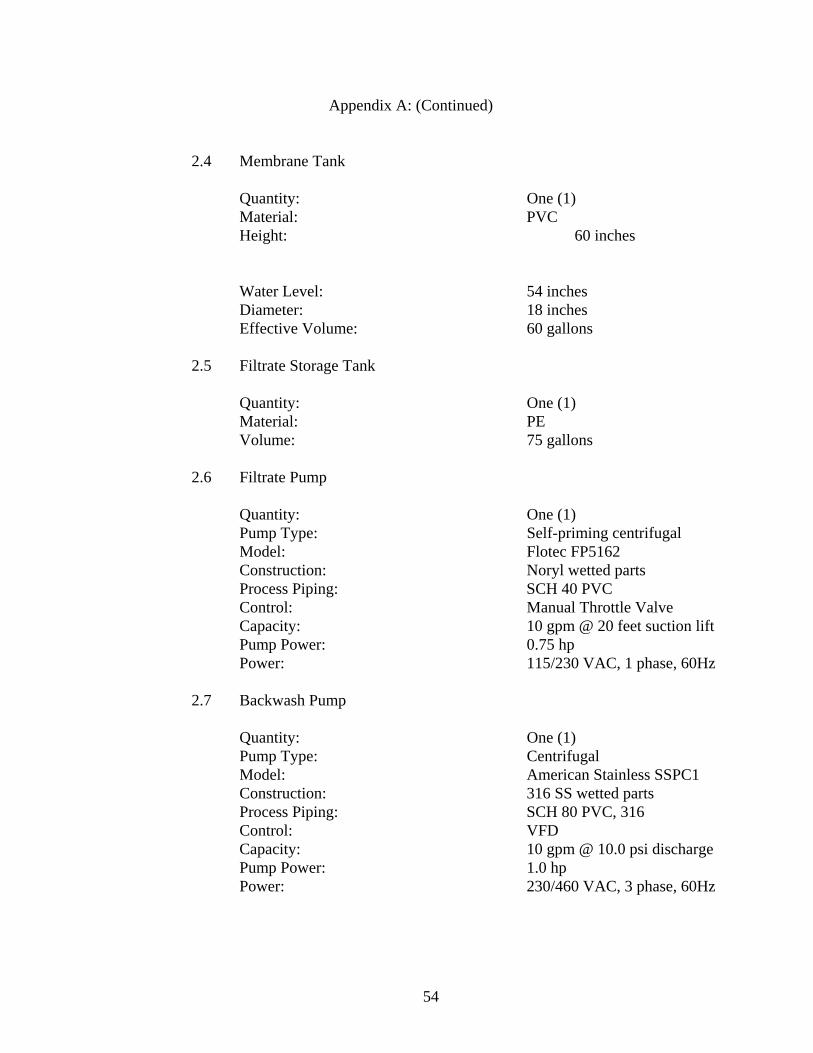
2.4 Membrane Tank
Quantity: One (1) Material: PVC
Height: 60 inches
Water Level: 54 inches Diameter: 18 inches Effective Volume: 60 gallons 2.5 Filtrate Storage Tank Quantity: One (1) Material: PE Volume: 75 gallons 2.6 Filtrate Pump Quantity: One (1) Pump Type: Self-priming centrifugal Model: Flotec FP5162
Construction: Noryl wetted parts Process Piping: SCH 40 PVC
Control: Manual Throttle Valve Capacity: 10 gpm @ 20 feet suction lift Pump Power: 0.75 hp Power: 115/230 VAC, 1 phase, 60Hz
2.7 Backwash Pump
Quantity: One (1) Pump Type: Centrifugal Model: American Stainless SSPC1 Construction: 316 SS wetted parts Process Piping: SCH 80 PVC, 316 Control: VFD Capacity: 10 gpm @ 10.0 psi discharge Pump Power: 1.0 hp
Power: 230/460 VAC, 3 phase, 60Hz

55
Appendix A: (Continued)
2.8 Blower
Quantity: One (1) Quantity per Train: One (1) Blower Type: Regenerative (oil-less)
Model: Ghast or equivalent Construction: Carbon Steel Process Piping: Galvanized Steel
Control: Manual Throttle Valve Capacity: 10 scfm @ 2.5 psi discharge
pressure Blower Power: 1.0 hp Power: 230/460 VAC, 3 phase, 60Hz 2.9 Low Capacity Chlorine Metering Pump Quantity: One (1)
Pump Type: Positive Displacement Model: LMI
Wetted Ends: Polypropylene with PVC Diaphragm: PTFE
Balls: Ceramic Capacity: 0.2 gpd Controller: Manual Power: 115/230 VAC, 1 phase, 60Hz
2.10 High Capacity Chlorine Metering Pump Quantity: One (1)
Pump Type: Positive Displacement Model: LMI
Wetted Ends: Polypropylene and PVC Diaphragm: PTFE
Balls: Ceramic Capacity: 14 gpd Controller: Manual Power: 115/230 VAC, 1 phase, 60Hz
56
Appendix A: (Continued)
2.11 Sodium Hydroxide Metering Pump
Quantity: One (1) Pump Type: Positive Displacement Model: LMI Wetted Ends: Polypropylene and PVC Diaphragm: PTFE Balls: Ceramic Capacity: 10 gpd Controller: Manual Power: 115/230 VAC, 1 phase, 60Hz
2.12 Citric Acid Metering Pump
Quantity: One (1) Pump Type: Positive Displacement Model: LMI Wetted Ends: Polypropylene and PVC Diaphragm: PTFE Balls: Ceramic Capacity: 10 gpd Controller: Manual Power: 115/230 VAC, 1 phase, 60Hz
2.13 PLC/Control Panel
Quantity: One (1) Model: Automation Direct DL 06 Power Input: 230/460 VAC, 3 phase, 60
Hz Enclosure: NEMA 12, Carbon Steel Operator Interface: LCD with push buttons
2.13 Instrumentation
Level Switches: 4, NOC Float Switches Pressure Gauges: 2, Ashcroft or equivalent Quantity Rotameters: 4, Blue-White or equivalent Air Rotameters: 1, Blue-White or equivalent Temperature Gauge: 1, Cole Palmer or equivalent

57
Appendix A: (Continued)
pH Meter : 1, SIGNET Turbidimeter 1, HACH
2.14 Piping and Automated Valves
Automated Ball Valves: Four (4) Manual Globe Valve: Four (4) Manual Ball Valves: Four (4) Piping Material: SCH 40 PVC
58
Appendix B
SpiraSep Trans-membrane Pressure (TMP) Measurements
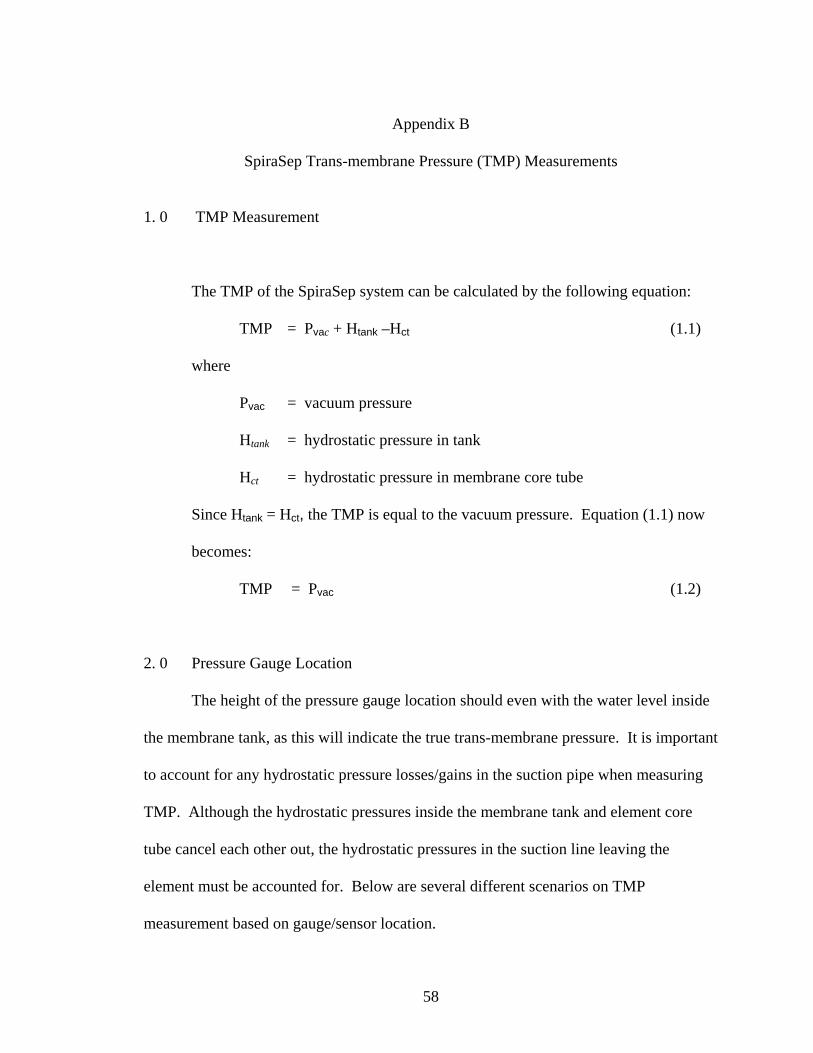
1. 0 TMP Measurement
The TMP of the SpiraSep system can be calculated by the following equation:
TMP = Pvac + Htank –Hct (1.1)
where
Pvac = vacuum pressure
Htank = hydrostatic pressure in tank
Hct = hydrostatic pressure in membrane core tube
Since Htank = Hct, the TMP is equal to the vacuum pressure. Equation (1.1) now
becomes:
TMP = Pvac (1.2)
2. 0 Pressure Gauge Location
The height of the pressure gauge location should even with the water level inside
the membrane tank, as this will indicate the true trans-membrane pressure. It is important
to account for any hydrostatic pressure losses/gains in the suction pipe when measuring
TMP. Although the hydrostatic pressures inside the membrane tank and element core
tube cancel each other out, the hydrostatic pressures in the suction line leaving the
element must be accounted for. Below are several different scenarios on TMP
measurement based on gauge/sensor location.
59
E-1E-2
P
Pressure Gauge
Permeate Pump
H
Appendix B: (Continued)
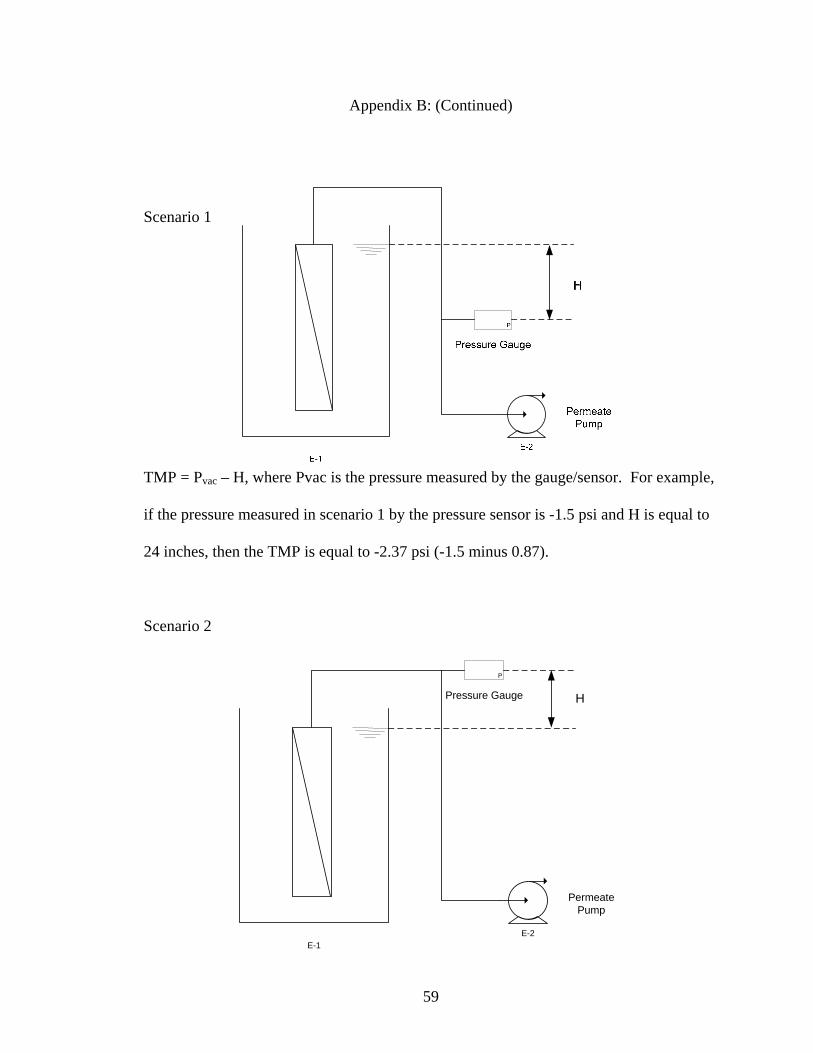
Scenario 1
TMP = Pvac – H, where Pvac is the pressure measured by the gauge/sensor. For example,
if the pressure measured in scenario 1 by the pressure sensor is -1.5 psi and H is equal to
24 inches, then the TMP is equal to -2.37 psi (-1.5 minus 0.87).
Scenario 2
60
Appendix B: (Continued)
TMP = Pvac + H, where Pvac is the pressure measured by the gauge/sensor. For example,
if the pressure measured by the pressure sensor is -2.0 psi and H is equal to 12 inches,
then the TMP is -1.57 psi (-2.0 plus .43).