preclinical assessment of the absorption and disposition...
TRANSCRIPT
DMD #46052
1
Preclinical Assessment of the Absorption and Disposition of the
PI3K/mTOR Inhibitor GDC-0980 and Prediction of Its
Pharmacokinetics and Efficacy in Human
Laurent Salphati, Jodie Pang, Emile G. Plise, Leslie B. Lee, Alan G. Olivero, Wei Wei
Prior, Deepak Sampath, Susan Wong, Xiaolin Zhang
Departments of Drug Metabolism and Pharmacokinetics (LS, JP, EGP, SW, XZ),
Chemistry (AGO) and Translational Oncology (LBL, WWP, DS) Genentech, Inc., South
San Francisco, CA 94080
DMD Fast Forward. Published on June 13, 2012 as doi:10.1124/dmd.112.046052
Copyright 2012 by the American Society for Pharmacology and Experimental Therapeutics.
This article has not been copyedited and formatted. The final version may differ from this version.DMD Fast Forward. Published on June 13, 2012 as DOI: 10.1124/dmd.112.046052
at ASPE
T Journals on M
arch 25, 2020dm
d.aspetjournals.orgD
ownloaded from
DMD #46052
2
Running Title: Preclinical Pharmacokinetics of GDC-0980 Corresponding Author:
Laurent Salphati, Pharm.D., Ph.D.
Genentech, Inc.
1 DNA Way
South San Francisco, CA 94080
Phone: 650-467-1796
Fax: 650-467-3487
Email: [email protected] Number of Pages: 52 Number of Tables: 9 Number of figures: 9 Number of References: 34 Number of Words in Abstract: 247 Number of Words in Introduction: 491 Number of Words in Discussion: 1669 Abbreviations: GDC-0980, (S)-1-{4-[2-(2-Amino-pyrimidin-5-yl)-7-methyl-4-
morpholin-4-yl-thieno[3,2-d]pyrimidin-6-ylmethyl]-piperazin-1-yl}-2-hydroxy-propan-1-
one; PI3K, Phophatidylinositol 3-kinase; mTOR, mammalian target of rapamycin; p,
phosphorylated; PK, pharmacokinetics; PD, pharmacodynamics; TV, tumor volume;
MCT, 0.5% methylcellulose/0.2% tween 80 (w/w); TGI, tumor growth inhibition; CV,
coefficient of variation
This article has not been copyedited and formatted. The final version may differ from this version.DMD Fast Forward. Published on June 13, 2012 as DOI: 10.1124/dmd.112.046052
at ASPE
T Journals on M
arch 25, 2020dm
d.aspetjournals.orgD
ownloaded from
DMD #46052
3
Abstract
GDC-0980 is a potent and selective inhibitor of PI3K and mTOR, two key components of
the PI3K pathway, which deregulation is associated with the development of many
cancers. The objectives of these studies were to characterize the absorption and
disposition of GDC-0980 and assess its efficacy in an MCF7-neo/HER2 human breast
cancer xenograft model in immunocompromised mice. Studies in parental MDCK cells
indicated that GDC-0980 had high permeability (Papp 18●10-6 cm/sec), suggesting good
absorption potential. However, it was found to be a P-glycoprotein and breast cancer
resistance protein substrate in transfected cells and in knock-out mice studies. Plasma
protein binding was low, with fraction unbound ranging from 29% to 52% across species.
GDC-0980 hepatic clearance (CL) was predicted to be low in all species tested from
hepatocytes incubations. The plasma CL of GDC-0980 was low in mouse (6.30
ml/min/kg), rat (15.4 ml/min/kg) and dog (6.37 ml/min/kg), and moderate in cynomolgus
monkey (18.9 ml/min/kg). Oral bioavailability ranged from 14.4% in monkey to 125% in
dog. Predicted human plasma CL and volume of distribution using allometry were 5.1
mL/min/kg and 1.8 L/kg, respectively. Parameters estimated from the PK-PD modeling
of the MCF7-neo/HER2 xenograft data indicated that GDC-0980 plasma concentration
required for tumor stasis was approximately 0.5 µM. These parameters, combined with
the predicted human pharmacokinetic profile, suggested that 55 mg (QD) may be a
clinically efficacious dose. GDC-0980 preclinical characterization and the predictions of
its human properties supported its clinical development; it is currently in Phase II clinical
trials.
This article has not been copyedited and formatted. The final version may differ from this version.DMD Fast Forward. Published on June 13, 2012 as DOI: 10.1124/dmd.112.046052
at ASPE
T Journals on M
arch 25, 2020dm
d.aspetjournals.orgD
ownloaded from

DMD #46052
4
Introduction
The phosphatidylinositol 3-kinase (PI3K)/Akt pathway plays a key role in cellular
growth, survival and differentiation (Engelman et al., 2006). The Class I PI3Kinases,
with catalytic subunits α, β, γ or δ, catalyze the phosphorylation of phosphatidylinositol
(4,5) bisphosphate to phosphatidylinositol (3,4,5) triphosphate. Following this initial step,
downstream kinases, among which the serine/threonine protein kinases Akt and mTOR,
are in turn activated. Aberrant regulation of this pathway has been implicated in several
types of cancer, including breast, colon and prostate (Engelman, 2009). Upregulation of
PI3K can occur through transforming mutations in the p110α subunit, loss of function of
the phosphatase PTEN, which counteracts the function of PI3K, or in response to
receptor tyrosine kinase signaling (Chalhoub and Baker, 2009; Wong et al., 2010). Thus,
this pathway has been identified as a promising target for the treatment of cancer and
numerous PI3K inhibitors have entered clinical trials (Ciraolo et al., 2011). In addition,
inhibitors of the mTOR kinase, such as the rapamycin analogues (rapalogues) everolimus
and temsirolimus, have shown activity in renal cell carcinoma and pancreatic tumors
(Sabbah et al., 2011). However, mTOR functions as two protein complexes, mTORC1
and mTORC2, and the selectivity of rapalogues for mTORC1 does not prevent the
phosphorylation and activation of Akt, possibly by mTORC2, through a feedback loop
(O'Reilly et al., 2006; Guertin and Sabatini, 2009). Hence, it is expected that inhibition of
both mTOR complexes would prevent PI3K pathway activation by this mechanism.
This article has not been copyedited and formatted. The final version may differ from this version.DMD Fast Forward. Published on June 13, 2012 as DOI: 10.1124/dmd.112.046052
at ASPE
T Journals on M
arch 25, 2020dm
d.aspetjournals.orgD
ownloaded from
DMD #46052
5
The implication of both PI3K and mTOR in cancer, and the results obtained through their
separate inhibition, has led to the development of compounds able to inhibit both kinases,
which are currently being tested (Liu et al., 2009a).
GDC-0980 (Fig. 1) is a small molecule inhibitor of class I PI3K and mTOR (mTORC1
and mTORC2) that is being developed by Genentech, Inc. for the treatment of various
malignancies. GDC-0980 was shown to be selective against a large panel of related
kinases, including DNA-PK, VPS34 and c2alpha and c2beta (Castanedo et al., 2008) and
can be considered equipotent against the four class I PI3K isoforms, with IC50 values of
0.005, 0.027, 0.007 and 0.014 µM against p110α, β, δ and γ, respectively. In addition, it
is a potent inhibitor of mTOR, with a Ki of 0.017 µM (Sutherlin et al., 2011). GDC-0980
is also able to inhibit the proliferation of MCF7-neo/HER2 breast and PC3-NCI prostate
cancer cells with IC50 values of 0.24 and 0.12 µM, respectively, and was efficacious
against these tumor cell lines grown as xenograft in immunocompromised mice
(Sutherlin et al., 2011; Wallin et al., 2011).
The purposes of the present studies were to assess the absorption and disposition
properties of GDC-0980 and to model its efficacy in the MCF7-neo/HER2 (breast, PI3K
mutant) xenograft model. The results obtained in this preclinical evaluation were used to
predict human GDC-0980 pharmacokinetic parameters and profile, as well as its potential
efficacy. When possible, these predictions were compared to the data from the Phase I
study.
This article has not been copyedited and formatted. The final version may differ from this version.DMD Fast Forward. Published on June 13, 2012 as DOI: 10.1124/dmd.112.046052
at ASPE
T Journals on M
arch 25, 2020dm
d.aspetjournals.orgD
ownloaded from

DMD #46052
6
Materials and Methods
Chemicals and Reagents
GDC-0980 was synthesized at Genentech, Inc. (South San Francisco, CA) and
[14C]GDC-0980 was synthesized at Selcia Limited (Essex, UK). All other reagents or
material used in these studies were purchased from Sigma-Aldrich (St. Louis, MO) unless
otherwise stated.
In Vitro Studies
MDCK Cell Permeability and Transport Studies
The MDCKI (Madin-Darby canine kidney) cell line, used in the permeability assay, was
acquired from American Type Culture Collection (Manassas, VA). For transport studies,
MDR1-MDCKI cells were licensed from the National Cancer Institute (Bethesda, MD),
whereas Bcrp1-MDCKII cells were obtained from the Netherlands
Cancer Institute (Amsterdam, The Netherlands). The cells were seeded at a density of 1.3
x 105 cells/mL in Costar Transwell® plates (12-well, polyester membrane, 0.4 µm pore
size, 1.0 cm2 growth area and cultured for 5 days at 37˚C with 5% CO2 and 95%
humidity. GDC-0980 was tested at 10 µM in the apical-to-basolateral (A-B) and
basolateral-to-apical (B-A) directions. In the transfected cells, the studies were conducted
in the absence and presence of GF120918 (2 µM; inhibitor of P-gp) or fumitremorgin C
(FTC) (10 µM; inhibitor of Bcrp1). The compound was dissolved in transport buffer
consisting of Hank’s balanced salt solution and 10 mM HEPES (Invitrogen Corporation,
Grand Island, NY). Transepithelial electrical resistance (TEER) and lucifer yellow (LY)
This article has not been copyedited and formatted. The final version may differ from this version.DMD Fast Forward. Published on June 13, 2012 as DOI: 10.1124/dmd.112.046052
at ASPE
T Journals on M
arch 25, 2020dm
d.aspetjournals.orgD
ownloaded from

DMD #46052
7
permeability were used to monitor monolayer integrity at the beginning and the end of
the experiments, respectively. GDC-0980 was analyzed by LC-MS/MS. The apparent
permeability (Papp), in the A-B and B-A directions, was calculated as:
Papp = (dQ/dt)•(1/AC0)
Where: dQ/dt = rate of compound appearance in the receiver compartment; A = Surface
area of the insert; C0= Initial substrate concentration at T0.
The efflux ratio (ER) was calculated as (Papp, B-A/Papp, A-B).
Metabolic Stability Study in Cryopreserved Hepatocytes
The metabolic stability of GDC-0980 was evaluated in pooled cryopreserved hepatocytes
from CD-1 mice (n=10 animals), Sprague-Dawley rats (n=3 animals), cynomolgus
monkey (n=3 animals), beagle dog (n=3 animals) (Invitrogen Corporation, Carlsbad, CA),
and humans (n=10; Celsis, Baltimore, MD). The cells were resuspended at a density of
0.5 x 10⁶ cells/mL and reactions were initiated with the addition of GDC-0980 at a final
concentration of 1 µM. Samples were incubated at 37oC in 5% carbon dioxide with
saturating humidity, and aliquots were sampled at 0, 1, 2 and 3 hours. Reactions were
quenched with acetonitrile at each time point. The samples were centrifuged at 2000 g for
10 minutes, the supernatant diluted with water (1:2 ratio), and the percentage of GDC-
0980 remaining was determined by LC-MS/MS. Using the t=0 peak area ratio values as
100% , the in vitro CLint and scaled hepatic CL were determined as described by Obach
et al. (Obach et al., 1997).
This article has not been copyedited and formatted. The final version may differ from this version.DMD Fast Forward. Published on June 13, 2012 as DOI: 10.1124/dmd.112.046052
at ASPE
T Journals on M
arch 25, 2020dm
d.aspetjournals.orgD
ownloaded from

DMD #46052
8
Blood-to-Plasma Partitioning
The blood-to-plasma partitioning of GDC-0980 was assessed in pooled whole blood with
K2EDTA anticoagulant from CD-1 mice, Sprague-Dawley rats, beagle dogs, cynomolgus
monkeys and humans (Bioreclamation, Inc., Hicksville, NY). Blood from all species was
obtained from at least 3 individual donors. GDC-0980 and [14C]GDC-0980 were added to
whole blood at total concentrations of 1, 10, and 40 μM. Blood samples were incubated
at 37˚C for 60 minutes in a shaking water bath. Following incubation, an aliquot of blood
was sampled and the remaining blood was centrifuged to obtain plasma. Radioactivity in
plasma and blood was determined using a Packard Tri-Carb 2900TR liquid scintillation
counter (PerkinElmer, Waltham, MA). The blood-to-plasma ratio was calculated by
dividing the measured radioactivity in blood by that measured in plasma. Incubations
were performed in triplicates. Parameters are presented as mean ± standard deviation
(SD)
Plasma Protein Binding
The extent of plasma protein binding of GDC-0980 was determined in vitro, in CD-1
mouse, Sprague-Dawley rat, cynomolgus monkey, beagle dog and human plasma
(Bioreclamation, Inc., Hicksville, NY) by equilibrium dialysis using a HTDialysis 96-
well block (HTDialysis® LLC; Gales Ferry, CT). GDC-0980 and [14C]GDC-0980 were
added to pooled plasma (n ≥ 3) at total concentrations of 1, 10, and 40 μM. These
concentrations were selected to cover the range of potential clinical levels and preclinical
concentrations measured. Plasma samples were equilibrated with phosphate-buffered
saline (pH 7.4) at 37°C in 95% humidity and 5% CO2 for 6 hours. Following dialysis,
This article has not been copyedited and formatted. The final version may differ from this version.DMD Fast Forward. Published on June 13, 2012 as DOI: 10.1124/dmd.112.046052
at ASPE
T Journals on M
arch 25, 2020dm
d.aspetjournals.orgD
ownloaded from
DMD #46052
9
radioactivity in plasma and buffer was measured using a Packard Tri-Carb 2900TR liquid
scintillation counter. The percent GDC-0980 unbound in plasma was determined by
dividing the radioactivity measured in the post-dialysis buffer by that measured in the
post-dialysis plasma and multiplying by 100. Incubations were performed in
quadruplicate. Parameters are presented as mean ± SD.
Brain Tissue Binding
The extent of brain tissue binding of GDC-0980 was determined in vitro, in CD-1 mouse
brain (Bioreclamation, Inc., Hicksville, NY) using the Rapid Equilibrium Dialysis (RED)
Device (Thermo Scientific, Inc.; Rockford, IL). Brain homogenate was prepared by
homogenizing 1 g of brain with 3 mL of phosphate-buffered saline (PBS, pH 7.4) using
the BeadBeater (BioSpec Products; Bartlesville, OK). GDC-0980 was added to brain
homogenate (n=3) to a final concentration of 10 µM. Brain homogenate samples were
then equilibrated with PBS at 37°C in 95% humidity and 5% CO2 for 4 hours at a shaking
speed of 150 rpm. Following incubation, a quenching mixture containing internal
standard, blank PBS or blank brain homogenate was added to the post dialysis PBS
sample and post dialysis brain sample so that the matrices of both sides were equivalent.
Samples were centrifuged and the supernatants were analyzed using LC-MS/MS for
GDC-0980 concentrations. Incubations were performed in triplicate. Calculations of free
fraction were performed as described by Kalvass et al. (Kalvass et al., 2007). Parameters
are presented as mean ± SD.
In vivo Studies
This article has not been copyedited and formatted. The final version may differ from this version.DMD Fast Forward. Published on June 13, 2012 as DOI: 10.1124/dmd.112.046052
at ASPE
T Journals on M
arch 25, 2020dm
d.aspetjournals.orgD
ownloaded from
DMD #46052
10
All studies performed were approved by the Institutional Animal Care and Use
Committee at Genentech, Inc. (South San Francisco, CA), Harlan Bioproducts for
Science (Madison, WI), Covance Laboratories Inc. (Madison, WI), Covance Research
Products, Inc. (Alice, TX), MPI Research, Inc. (Mattawan, MI) or QPS, LLC (Newark,
DE). When GDC-0980 was administered orally, animals were fasted overnight until 4
hours post-dose.
Pharmacokinetic Study in Mouse
Twenty-seven female NCr Nude mice (Taconic Farms, Germantown, NY) were given a 1
mg/kg intravenous bolus (IV) dose of GDC-0980 in 5% DMSO with 5% Cremophor®.
Three additional groups of twenty seven mice each received a 1, 5 or 10 mg/kg oral (PO)
dose of GDC-0980 as a 0.5% methylcellulose with 0.2% Tween 80 (MCT) suspension.
At the initiation of the study, the mice weighed from 16.5 to 26.9 g. One blood sample of
approximately 0.2 mL was collected from each mouse (n=3 mice per timepoint) by
terminal cardiac puncture while the animals were anesthetized with isoflurane. Blood
samples were collected in tubes containing K2EDTA as the anticoagulant, predose, and at
0.033, 0.16, 0.5, 1, 3, 6, 9, and 24 hours after the IV administration, and predose and at
0.083, 0.25, 0.5, 1, 3, 6, 9, and 24 hours after the PO dose. Samples were centrifuged
within 30 minutes of collection and plasma was collected and stored at -80ºC until
analysis. The concentration of GDC-0980 in each plasma sample was determined by LC-
MS/MS analysis.
This article has not been copyedited and formatted. The final version may differ from this version.DMD Fast Forward. Published on June 13, 2012 as DOI: 10.1124/dmd.112.046052
at ASPE
T Journals on M
arch 25, 2020dm
d.aspetjournals.orgD
ownloaded from
DMD #46052
11
Pharmacokinetic Study in Rat
Three days prior to the study, jugular and femoral vein canulae were implanted in male
Sprague-Dawley rats (Charles River Laboratories, Hollister, CA) assigned to the IV
group and only jugular vein canulae were implanted in rats assigned to the PO group. At
the initiation of the study, the rats weighed from 262 to 294 g. Three rats were given a
single IV dose of 1 mg/kg GDC-0980 in 5% DMSO with 5% Cremophor® via the
femoral vein canulae. Three additional rats were given a single PO dose of 5
mg/kg GDC-0980 in 80% (w/v) polyethylene glycol 400 in water as a solution. Blood
samples (approximately 0.2 mL per sample) were drawn from each animal via the jugular
vein cannulae predose and 0.033, 0.083, 0.25, 0.5, 1, 2, 4, 8, and 24 hours post-dose.
Plasma samples were collected and analyzed as described above.
Pharmacokinetic Study in Monkey
Three male cynomolgus monkeys (Harlan Bioporducts for Science, Madison, WI) were
given GDC-0980 in a cross-over study. The two phases were separated by a 7-day
washout period. In the first phase of the study, monkeys were given a single IV dose of 1
mg/kg of GDC-0980 in 30% hydroxypropyl-β-cyclodextrin (HP-β-CD) solution via a
saphenous vein. In the second phase, the same monkeys were each given a single PO
dose of 2 mg/kg GDC-0980 as an MCT suspension via nasogastric intubation. At the
initiation of the study, the monkeys weighed from 2.29 to 3.32 kg. Blood samples
(approximately 1 mL per sample) were collected predose and at 0.033, 0.083, 0.25, 0.5, 1,
2, 4, 8, 12, and 24 hours after the IV dose and predose and at 0.083, 0.25, 0.5, 1, 2, 4, 8,
12, and 24 hours after the PO dose. Plasma was isolated within 1 hour of blood collection
This article has not been copyedited and formatted. The final version may differ from this version.DMD Fast Forward. Published on June 13, 2012 as DOI: 10.1124/dmd.112.046052
at ASPE
T Journals on M
arch 25, 2020dm
d.aspetjournals.orgD
ownloaded from
DMD #46052
12
and stored at -80ºC until analysis. Urine was collected overnight prior to dosing and 0-24
hours post-dose from the animals receiving the IV dose. Urine volume was measured and
recorded. A 10-mL aliquote of urine for each sample (when available) was taken from the
bulk and was stored at -80ºC until analysis. The concentration of GDC-0980 in each
plasma and urine sample was determined using an LC-MS/MS assay.
Pharmacokinetic Study in Dog
Six male beagle dogs (9.1 to 13.2 kg; Harlan Bioproducts for Science; Madison, WI)
were given GDC-0980 in a parallel study. The first group of three dogs received a single
IV dose of 1 mg/kg of GDC-0980 in 30% HP-β-CD solution via a cephalic vein. The
second group of three dogs each received a 2 mg/kg PO dose of GDC-0980 as an MCT
suspension. Blood samples (approximately 3 mL per sample) were collected predose and
at 0.033, 0.083, 0.25, 0.5, 1, 2, 4, 8, 12, and 24 hours after the IV dose and predose and at
0.083, 0.25, 0.5, 1, 2, 4, 8, 12, and 24 hours after the PO dose. Blood and plasma were
processed as described above.
LC-MS/MS Analysis
GDC-0980 plasma and urine concentrations were determined by liquid chromatography-
tandem mass spectrometry (LC-MS/MS) using a non-validated method. Following
plasma protein precipitation with acetonitrile, the supernatant was injected onto the
column, a Phenomenex Gemini C18 column (30 × 2 mm, 5 μm particle size). A CTC
HTS PAL autosampler (LEAP Technologies, Chapel Hill, NC) linked to a Shimadzu
SCL-10A controller with LC-10AD pumps (Shimadzu, Columbia MD), coupled with a
This article has not been copyedited and formatted. The final version may differ from this version.DMD Fast Forward. Published on June 13, 2012 as DOI: 10.1124/dmd.112.046052
at ASPE
T Journals on M
arch 25, 2020dm
d.aspetjournals.orgD
ownloaded from

DMD #46052
13
Sciex API 4000 triple quadrupole mass spectrometer (Applied Biosystems, Foster City,
CA) were used for the LC-MS/MS assay. The aqueous mobile phase was water with
0.1% formic acid and the organic mobile phase was acetonitrile with 0.1% formic acid
(B). The gradient was as follows: 10% B for the first 0.5 minutes, increased to 90% B
from 0.5 to 2 minutes, maintained at 90% B for 1.5 minutes and decreased to 10% B
within 0.1 min. The total run time was 5 min with flow rate at 0.5 ml/min and the
ionization was conducted in the positive ion mode using the transition m/z 499.3 → 341.1
in APCI mode. GDC-0980 retention time was 1.2 min. The injection volume was 20 µL.
The lower and upper limits of quantitation of the assay were 0.005 µM and 10 µM,
respectively. The internal standard for the plasma and urine assays was the deuterated
(D8) analogue (dog and monkey studies) or a closely related analogue (mouse and rat
studies) of GDC-0980.
Pharmacokinetic Analysis
Pharmacokinetic parameters were calculated by non-compartmental methods as described
in Gibaldi and Perrier (Gibaldi and Perrier, 1982) using WinNonlin version 5.2 (Pharsight
Corporation, Mountain View, CA). Parameters are presented as mean ± SD.
Bioavailability (F) in monkeys was determined for each animal by dividing the
dose-normalized AUCinf obtained following each PO dose by the dose-normalized
AUCinf obtained following the IV dose. In dogs, rats and mice, F was determined by
dividing the dose-normalized AUCinf for each animal dosed PO by the dose-normalized
mean AUCinf determined from the animals dosed IV (a pooled profile was used in mice).
Renal clearance (CLr) was estimated in monkeys following the IV dose by dividing the
This article has not been copyedited and formatted. The final version may differ from this version.DMD Fast Forward. Published on June 13, 2012 as DOI: 10.1124/dmd.112.046052
at ASPE
T Journals on M
arch 25, 2020dm
d.aspetjournals.orgD
ownloaded from

DMD #46052
14
cumulative amount of GDC-0980 excreted over the 24-hour urine collection period by
plasma AUC0-24 obtained following the IV dose.
Mass Balance and Routes of Elimination in Rat
A single oral dose of [14C]GDC-0980 (2 mg/kg; 100 µCi/kg) was administered to bile
duct-intact and bile duct-cannulated (BDC) male and female Sprague-Dawley rats
(n=3/sex; Covance, Madison, WI). The dose was prepared in MCT. Urine and feces were
collected from the bile duct-intact rats in plastic containers surrounded by dry ice predose
(overnight for at least 12 hours) and at 0-8 and 8-24 hours postdose, and at 24-hour
intervals through 168 hours postdose. Urine and bile were collected from bile duct-
cannulated animals in plastic containers surrounded by dry ice predose (overnight for at
least 12 hours) and at 0-8 and 8-24 hours postdose, and at 24-hour intervals through 120
hours postdose. All samples were stored at approximately -70ºC before and after analysis.
Urine, bile, cage rinse, and cage wash samples were mixed by shaking and aliquots were
analyzed directly by LSC. Feces samples were mixed with a sufficient amount of solvent
(ethanol:water, 1:1, v:v) to facilitate homogenization and aliquots were combusted and
analyzed by LSC. All samples were analyzed in duplicate if sample size allowed.
All sample combustions were done in a Model 307 Sample Oxidizer (Packard Instrument
Company) and the resulting 14CO2 was trapped in a mixture of Perma Fluor and Carbo-
Sorb. Ultima Gold XR scintillation cocktail was used for samples analyzed directly. All
samples were analyzed for radioactivity in Model 2900TR liquid scintillation counters
(Packard Instrument Company) for at least 5 minutes or 100,000 counts.
This article has not been copyedited and formatted. The final version may differ from this version.DMD Fast Forward. Published on June 13, 2012 as DOI: 10.1124/dmd.112.046052
at ASPE
T Journals on M
arch 25, 2020dm
d.aspetjournals.orgD
ownloaded from
DMD #46052
15
Mass Balance and Routes of Elimination in Dog
A single dose of [14C] GDC-0980 at a target dose of 2 mg/kg (20 µCi/kg) was
administered to two male and two female bile duct-intact and two male bile duct-
cannulated (BDC) Beagle dogs (MPI Research, Inc., Mattawan, MI). The dose prepared
with both radiolabeled and non-radiolabeled GDC-0980 in MCT was administered via
oral gavage at a dose volume of 5 mL/kg. Urine and feces were collected in plastic
containers (surrounded by dry ice for urine only) predose and at 0-8 and 8-24 hours
postdose, and at 24-hour intervals through 240 hours postdose. Bile was collected from
bile duct-cannulated animals in plastic containers surrounded by dry ice predose and at 0-
8 and 8-24 hours postdose, and at 24-hour intervals through 168 hours postdose. For
urine and bile, triplicate aliquots (approximately 0.5 and 0.2 g, respectively) were
weighed into glass scintillation vials and an appropriate amount of Ultima Gold LSC
cocktail was added prior to direct analysis by LSC. For feces, the appropriate amount of
deionized water was added to the samples to create a 4:1 homogenate. Triplicate aliquots
(approximately 0.5 g) were weighed into combustion cones and oxidized by combustion.
The required amounts of Carbo-Sorb E and Permafluor E+ were added to the oxidized
aliquots prior to analysis by LSC. For cage rinses, triplicate aliquots (approximately 1 g
each) were weighed into glass scintillation vials and an appropriate amount of Ultima
Gold LSC cocktail was added prior to analysis by LSC. All radioactive samples collected
were counted by LSC for at least 5 minutes or 100,000 counts in triplicate, sample size
allowing.
Quantitative Whole Body Autoradiography (QWBA) in Rats
This article has not been copyedited and formatted. The final version may differ from this version.DMD Fast Forward. Published on June 13, 2012 as DOI: 10.1124/dmd.112.046052
at ASPE
T Journals on M
arch 25, 2020dm
d.aspetjournals.orgD
ownloaded from

DMD #46052
16
The tissue distribution of [14C]GDC-0980-related radioactivity in Sprague-Dawley rats
(Hilltop Lab Animals, Inc., Scottdale, PA) was investigated after a single oral dose of 2
mg/kg (100 µCi/kg) in MCT) using whole-body autoradiography. Animals were
euthanized at 1, 8, 24 and 120 hours post-dose. The carcasses were frozen in hexane dry-
ice, and stored at -20ºC prior to processing for QWBA. Each carcass was embedded, cut
into sagittal sections, and mounted for QWBA. Selected sections were exposed to
phosphor image screens, and tissue radioactivity concentrations were quantified from the
whole-body autoradiograms using an image analysis system (Typhoon 9410™ image
acquisition system [GE Healthcare/Molecular Dynamics, Sunnyvale, CA, USA] and
MCID™ image analysis software [v. 7.0, GE Healthcare/Imaging Research, Inc., St.
Catherines, Ontario, Canada]). Concentrations of radioactivity were expressed as μCi/g
and converted to μg equivalents of GDC-0980 per gram of matrix (μg equiv/g) using the
specific activity (47.1 μCi/mg) of the administered formulated [14C]GDC-0980.
Studies in FVNn and Mdr1a/b(-/-)/Bcrp1(-/-) Mice
Male FVBn (wild-type) and Mdr1a/b(-/-)/Bcrp1(-/-) mice were obtained from Taconic
Farms (Germantown, NY). The mice weighed between 19 and 28 g at the beginning of
the study. GDC-0980, prepared in MCT, was administered by oral gavage at a dose
volume of 10 mL/kg. The animals received 20 mg/kg of GDC-0980 PO. Blood samples
(0.2 ml) were collected 1and 6 hours post dose. Samples were taken from three mice at
each time point. Each mouse was sampled twice (retro-orbital collection and cardiac
puncture). After mixing with K2EDTA (anticoagulant), the blood samples were stored on
This article has not been copyedited and formatted. The final version may differ from this version.DMD Fast Forward. Published on June 13, 2012 as DOI: 10.1124/dmd.112.046052
at ASPE
T Journals on M
arch 25, 2020dm
d.aspetjournals.orgD
ownloaded from

DMD #46052
17
ice and, within 1 hr of collection, were centrifuged at 2000g for 5 min at 2–8°C. Plasma
was collected and stored at -80°C until analysis. Total concentrations of GDC-0980 were
determined by LC-MS/MS. Brains were also collected at 1 and 6 hr postdose from three
mice at each time point. Each brain was rinsed with ice-cold saline, blotted dry, and cut
into two halves along the sagittal plane for GDC-0980 concentration measurement and
pharmacodynamic (PD) analysis. Each half of the brain was weighed then snapped frozen
in liquid nitrogen and stored at -80°C until analysis. The right halves of the brains were
homogenized in 3 volumes of water. The homogenates were extracted by protein
precipitation with acetonitrile containing the internal standard, and then analyzed by LC-
MS/MS. Brain homogenates concentrations were converted to brain concentrations for
the calculations of brain-to-plasma ratios. The internal standard for the plasma and brain
assays was the deuterated (D8) analog of GDC-0980.
For PD analysis, cell extraction buffer (Invitrogen, Carlsbad, CA) containing 10 mM Tris
(pH 7.4), 100 mM NaCl, 1 mM EDTA, 1 mM EGTA, 1 mM NaF, 20 mM Na4P2O7, 2
mM Na3VO4, 1% Triton X-100, 10% glycerol, 0.1% SDS, and 0.5% deoxycholate was
supplemented with phosphatase, protease inhibitors (Sigma-Aldrich), and 1 mM
phenylmethylsulfonyl fluoride and added to frozen brain biopsies. Brains were
homogenized with a small pestle (Konte Glass Company, Vineland, NJ), sonicated
briefly on ice, and centrifuged at 20,000g for 20 min at 4°C. Protein concentration was
determined using BCA protein assay (Pierce, Rockford, IL). Proteins were separated by
electrophoresis and transferred to NuPage nitrocellulose membranes (Invitrogen). Licor
Odyssey Infrared detection system (Licor, Lincoln, NE) was used to assess and quantify
protein expression. PI3K and mTOR pathway markers were evaluated by
This article has not been copyedited and formatted. The final version may differ from this version.DMD Fast Forward. Published on June 13, 2012 as DOI: 10.1124/dmd.112.046052
at ASPE
T Journals on M
arch 25, 2020dm
d.aspetjournals.orgD
ownloaded from

DMD #46052
18
immunoblotting using antibodies against pAktser473, total Akt, pS6Ser235/236, and total S6
(Cell Signaling, Danvers, MA). Inhibition (%) of pAkt and pS6 in wild type and triple
knockout mice treated with GDC-0980 was calculated by comparing pAkt and pS6 signal
with that measured in untreated mice.
MCF7-neo/HER2 Breast Cancer Xenograft Studies
The MCF7-neo/HER2 cell line was developed at Genentech, Inc. by expressing human
HER2 in the MCF7 human breast cancer cell line (American Type Tissue Collection,
Manassas, VA).
As the tumorigenicity of the MCF7-neo/HER2 cells in mice is estrogen-dependent,
estrogen pellets (17 β-estradiol, 0.36 mg/pellet, 60-day release) obtained from Innovative
Research of America (Sarasota, FL) were implanted into the dorsal shoulder blade area of
female NCr Nude mice. After 3-7 days, 20 million human breast cancer MCF7-
neo/HER2 cells, re-suspended in a 1:1 mixture of Hank’s Buffered Salt Solution and
Matrigel Basement Membrane Matrix (BD Biosciences, Santa Cruz, CA), were
subcutaneously implanted into the right flank of each mouse. After implantation, tumors
were monitored until they reached a mean tumor volume of 200-300 mm3. Tumor size
and body weight were recorded twice per week during the study. Animal body weights
were measured using an Adventurer Pro AV812 scale (Ohaus Corporation, Pine Brook,
NJ). Tumor lengths and widths were measured using Ultra Cal-IV calipers (Model 54-10-
111, Fred V, Fowler Company, Inc., Newton, MA). Mice were euthanized if body weight
loss was greater than 20% from their initial body weight or if the tumors exceeded 2000
This article has not been copyedited and formatted. The final version may differ from this version.DMD Fast Forward. Published on June 13, 2012 as DOI: 10.1124/dmd.112.046052
at ASPE
T Journals on M
arch 25, 2020dm
d.aspetjournals.orgD
ownloaded from
DMD #46052
19
mm3. The mean tumor volume (TV) across all groups was 226 mm3 at the initiation of
dosing. Ten mice were assigned to each dose group.
Tumor volume was calculated using the following equation with Excel version 11.2
(Microsoft, Redmond, WA):
TV (mm3) = length x width2 x 0.5
GDC-0980 was administered orally in MCT for 21 days. Animals in the control groups
received the vehicle, MCT (100 µL). The animals treated with GDC-0980 received the
following doses in 100 µL MCT: 0.25, 0.5, 1, 2.5, 5 and 7.5 mg/kg once daily (QD).
The tumor volumes at the end of the study for each group were compared with the tumor
volume of the vehicle group.
Pharmacokinetic-Pharmacodynamic (PK-PD) Modeling
PK and PK-PD modeling was performed using SAAMII (Saam Institute, University of
Washington, Seattle, WA).
Pharmacokinetic Analysis
A one-compartment model with first-order oral absorption was used to fit the mean
plasma concentration-time data from female NCr nude mice. The pharmacokinetics of
GDC-0980 appeared linear over the range of doses tested and the three single doses (1, 5,
and 10 mg/kg) were fitted simultaneously. The mean estimates of the absorption rate
constant (ka), the elimination rate constant (ke) and the apparent volume of distribution
This article has not been copyedited and formatted. The final version may differ from this version.DMD Fast Forward. Published on June 13, 2012 as DOI: 10.1124/dmd.112.046052
at ASPE
T Journals on M
arch 25, 2020dm
d.aspetjournals.orgD
ownloaded from
DMD #46052
20
(V/F) were utilized to simulate the GDC-0980 plasma concentrations for the modeling of
the xenograft efficacy study.
Xenograft Efficacy Study
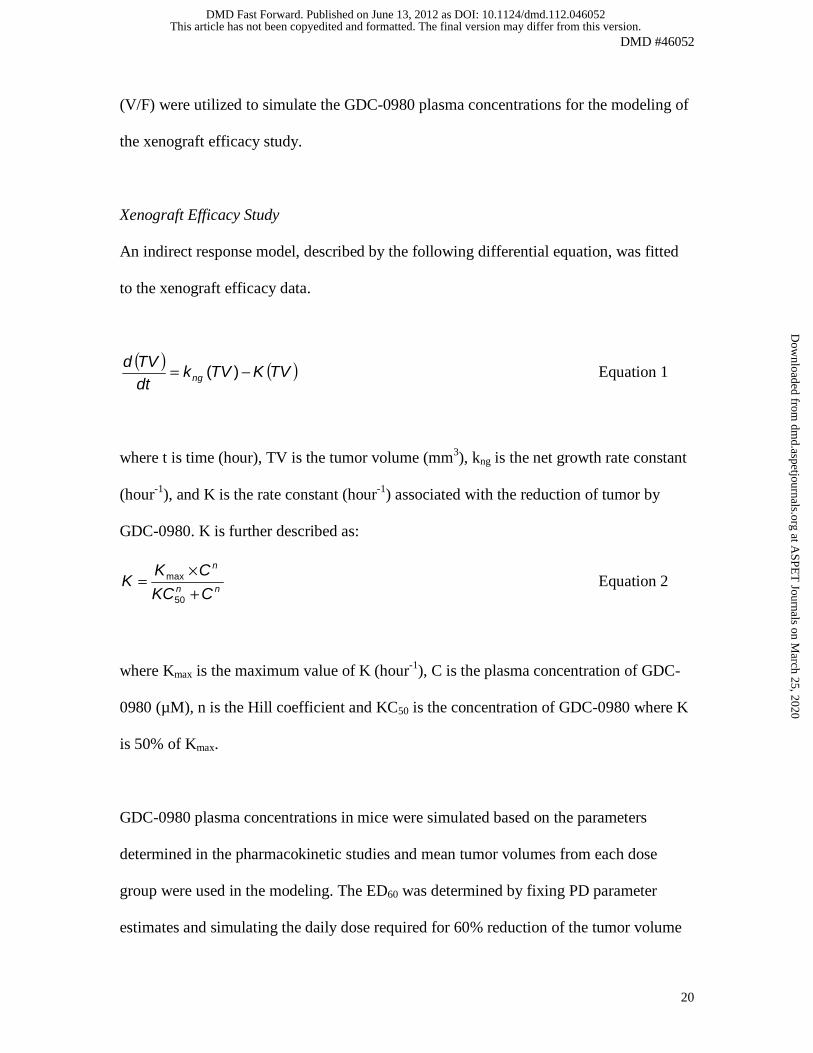
An indirect response model, described by the following differential equation, was fitted
to the xenograft efficacy data.
( ) ( )TVKTVkdtTVd
ng −= )( Equation 1
where t is time (hour), TV is the tumor volume (mm3), kng is the net growth rate constant
(hour-1), and K is the rate constant (hour-1) associated with the reduction of tumor by
GDC-0980. K is further described as:
nn
n
CKC
CKK
+×
=50
max Equation 2
where Kmax is the maximum value of K (hour-1), C is the plasma concentration of GDC-
0980 (µM), n is the Hill coefficient and KC50 is the concentration of GDC-0980 where K
is 50% of Kmax.
GDC-0980 plasma concentrations in mice were simulated based on the parameters
determined in the pharmacokinetic studies and mean tumor volumes from each dose
group were used in the modeling. The ED60 was determined by fixing PD parameter
estimates and simulating the daily dose required for 60% reduction of the tumor volume
This article has not been copyedited and formatted. The final version may differ from this version.DMD Fast Forward. Published on June 13, 2012 as DOI: 10.1124/dmd.112.046052
at ASPE
T Journals on M
arch 25, 2020dm
d.aspetjournals.orgD
ownloaded from
DMD #46052
21
relative to vehicle control group at the end of the study. The plasma concentration needed
to achieve tumor stasis was determined when K was equal to kng.
Prediction of Human PK Parameters and Efficacious Doses
Human volume of distribution and plasma clearance (CL) were predicted using simple
allometric scaling and incorporating the “rule of exponents” (Mahmood and Balian, 1996)
for the CL prediction. In vivo CL and volume of distribution at steady-state (Vss)
estimated in preclinical species were scaled as a function of body weight using the
following power function (allometric equation):
Y=aWb
where Y is clearance (CL), CL x MLP, or volume of distribution, W is the body weight
and a and b are the allometric coefficient and exponent, respectively. MLP is the
Maximum Lifespan Potential, as described by Boxenbaum (Boxenbaum, 1982). Body
weights of 0.02, 0.25, 3 and 10 kg were used for mouse, rat, monkey and dog,
respectively. Predicted human CL and Vss were extrapolated assuming a body weight of
70 kg.
Human PK profile simulations using GastroPlus
The PBPKPlus™ module of the GastroPlus™ simulation software (SimulationsPlus,
Lancaster, CA) was used to predict the PK profile of GDC-0980 in human, based on the
physico-chemical properties of the compound, its permeability (determined in MDCK
cells and converted to a human Peff of 1.34•10-4 cm/sec) and the predicted CL from
allometric scaling incorporating the MLP correction. The solubility profile (at pH ranging
This article has not been copyedited and formatted. The final version may differ from this version.DMD Fast Forward. Published on June 13, 2012 as DOI: 10.1124/dmd.112.046052
at ASPE
T Journals on M
arch 25, 2020dm
d.aspetjournals.orgD
ownloaded from

DMD #46052
22
from 2.3 to 10), LogP (2.02) and pKa (3.1 and 4.8) were determined experimentally. The
inputs for plasma protein binding (Fup 42%) and blood-plasma partitioning (1.1) were
those presented in this manuscript. For all other parameters, the default settings of
GastroPlus were used. The plasma concentration-time profile and PK parameters
simulated with a dose of 2 mg (starting dose in Phase I) were compared to those obtained
in patients (Wagner et al., 2009; Bendell et al., 2010). The simulated profile was
subsequently fitted with a one-compartment model with first-order oral absorption using
WinNonlin version 5.2 (Pharsight Corporation, Mountain View, CA).
The human dose associated with 60% tumor growth inhibition compared to vehicle
control was simulated based on the pharmacodynamic parameters estimated in the
MCF7-neo/HER2 breast tumor xenograft model and substituting the mouse PK
parameters with the human parameters derived from the simulated human profile.
Simulations were performed using SAAMII (Saam Institute, University of Washington,
Seattle, WA).
This article has not been copyedited and formatted. The final version may differ from this version.DMD Fast Forward. Published on June 13, 2012 as DOI: 10.1124/dmd.112.046052
at ASPE
T Journals on M
arch 25, 2020dm
d.aspetjournals.orgD
ownloaded from

DMD #46052
23
Results
Permeability and Transport in MDCK cells
The apparent permeability (Papp) of GDC-0980 as assessed in parental MDCKI cells was
high (Table 1) and comparable to that determined for metoprolol, the high Papp marker
used in the same experiment (data not shown). The efflux ratio (ER; Papp, B-A/ Papp, A-B)
was low (1.7), suggesting minor involvement of efflux transporter(s) in the B-A direction
in this cell line. In contrast, when the bidirectional transport was studied in MDR1-
MDCK and Bcrp1-MDCKII cells, the ER were 19 and 6.7, respectively. In the presence
of the P-gp and Bcrp1 inhibitors, GF120918 and FTC, these ER were reduced to 1.1 and
0.74, respectively, confirming that GDC-0980 was a substrate of both transporters.
Metabolic Stability Study in Cryopreserved Hepatocytes
The hepatic CL predicted from the metabolic stability following a 3-hour incubation in
cryopreserved hepatocytes is presented in Table 2. Predicted hepatic CL was low in all
species tested (< 30% of hepatic blood flow) (Davies and Morris, 1993).
In vitro Blood-to-Plasma Partitioning, Plasma Protein Binding, and Brain Tissue Binding
The mean blood-to-plasma partitioning of GDC-0980 in mouse, rat, cynomolgus
monkey, dog and human pooled whole blood ranged from 0.75 to 1.3 and appeared
concentration independent from 1 to 40 µM (Table 3).
Protein binding for GDC-0980 was low in the five species tested, with free fraction
ranging from approximately 29% in mouse plasma to 52% in dog plasma (Table 4).
This article has not been copyedited and formatted. The final version may differ from this version.DMD Fast Forward. Published on June 13, 2012 as DOI: 10.1124/dmd.112.046052
at ASPE
T Journals on M
arch 25, 2020dm
d.aspetjournals.orgD
ownloaded from

DMD #46052
24
Protein binding was independent of concentration in the concentration range of 1 to 40
µM. Binding to mouse brain tissue measured at 10 µM GDC-0980 was 92.1% (±2.4)
Pharmacokinetics of GDC-0980 in Mouse, Rat, Monkey and Dog
The semi-log plots of GDC-0980 plasma concentration versus time for mouse, rat,
monkey and dog after IV and PO administrations are presented in Fig. 2. The
pharmacokinetic parameters are presented in Table 5. GDC-0980 had low plasma CL ( <
30% of hepatic blood flow) in mice, rats and dogs (6.30, 15.4, and 6.38 mL/min/kg,
respectively), and a moderate plasma CL (approximately 43% of hepatic blood flow) of
18.9 mL/min/kg in monkeys. Terminal half-life values ranged from 0.558 hour in the
monkey to 6.41 hours in the dog. The volume of distribution at steady-state (Vss) was
moderate to high in all species, corresponding to approximately 1.1 to 5.6-fold total body
water. Bioavailability following PO administration ranged from 22.9% in monkey to
125% in dog. The renal CL of GDC-0980 was assessed in monkey and was negligible,
representing less than 3% of the plasma CL.
Mass Balance and Routes of Elimination in Rat
The excretion of radioactivity was determined after administration of a single oral dose of
[14C]GDC-0980 (2 mg/kg) to bile duct-intact and bile duct-cannulated (BDC) male and
female Sprague-Dawley rats. [14C]GDC-0980-derived radioactivity was rapidly excreted
after oral administration to bile duct-intact male and female rats, primarily within the first
48 hours after dosing (87.1% to 88.9% of the administered dose in males and females,
respectively; not shown). Routes and rates of excretion were similar in both males and
This article has not been copyedited and formatted. The final version may differ from this version.DMD Fast Forward. Published on June 13, 2012 as DOI: 10.1124/dmd.112.046052
at ASPE
T Journals on M
arch 25, 2020dm
d.aspetjournals.orgD
ownloaded from
DMD #46052
25
females. A high percentage of radioactivity was recovered in feces (87.5% in males and
89.1% in females; Fig. 3A). Approximately 42.6 to 41.1% of the administered
radioactivity was recovered in the bile of male and female BDC rats through 120 hours
postdose (Fig. 3B). The combined recovery in urine and bile indicated that a minimum of
57% and 50% of the oral dose was absorbed, in males and females, respectively.
Mass Balance and Routes of Elimination in Dog
[14C]GDC-0980-derived radioactivity recovered in feces accounted for 68.6% and 58.7%
of the administered dose in males and females bile duct-intact dogs, respectively. 12.2%
and 14.1% of the dose were recovered in urine from the bile duct-intact male and female
dogs, respectively (Fig. 4). Following oral administration of [14C]GDC-0980 to male bile
duct-cannulated dogs, the mean fecal, urinary, and biliary recoveries were 17.8%, 21.6%
and 41.7%, respectively, of the administered dose. The combined biliary and urinary
radioactivity recoveries suggested that a minimum of approximately 63% of the oral dose
was absorbed.
Quantitative Whole Body Autoradiography in Rats
The tissue distribution of 14[C]GDC-0980 was determined in male Sprague-Dawley rats
using whole-body autoradiography at 1, 8, 24 and 120 h following oral administration.
Compound-derived radioactivity was rapidly absorbed, with concentrations detected in
all tissues at 1 h (Fig. 5; Table 6). Radioactivity levels were below the limit of
quantitation at 24 h post-dose for all tissues except the gastrointestinal tract and excretory
tissues. Tissues with the highest radioactivity included the liver, kidney, and intestine.
This article has not been copyedited and formatted. The final version may differ from this version.DMD Fast Forward. Published on June 13, 2012 as DOI: 10.1124/dmd.112.046052
at ASPE
T Journals on M
arch 25, 2020dm
d.aspetjournals.orgD
ownloaded from
DMD #46052
26
High levels of radioactivity measured in the bile suggested that this was a major route of
elimination. The lowest levels of radioactivity were measured in the brain and spinal cord
(Table 6).
Studies in Mdr1a/b(-/-)/Bcrp1(-/-) and FVBn mice
GDC-0980 was administered PO (20 mg/kg) to FVBn and Mdr1a/b(-/-)/Bcrp1(-/-) mice.
Concentrations measured in plasma and brains were comparable between 1 and 6 hrs
post-dose in each strain of mice. Plasma concentrations were also similar between FVBn
and Mdr1a/b(-/-)/Bcrp1(-/-) mice at the two time points (Table 7). In contrast, brain
concentrations were 12 to 20-fold higher in Mdr1a/b(-/-)/Bcrp1(-/-) than in FVBn mice.
Similarly, brain-to-plasma ratios were 0.08 in FVBn mice and close to 1 in Mdr1a/b(-/-
)/Bcrp1(-/-) animals (Table 7). However, the ratio of free brain-to-free plasma
concentration was approximately 0.3 (using binding data presented here).
A marked inhibition (~80%) of the PI3K pathway markers pAkt and pS6 was observed in
the brain of triple knockout mice (Fig. 6). Suppression of pS6 was similar at 1 and 6
hours while pAkt levels started to recover by 6 hours post-dose. Inhibition (20-70%) of
the pathway was also observed in the brain of wild type mice, with suppression of pS6
lasting up to 6 hrs (Fig. 6).
PK-PD modeling
Pharmacokinetic Studies
The parameters (%CV) ka, ke and V/F were estimated for GDC-0980 following single PO
administrations to mice of 1, 5 and 10 mg/kg (Fig. 7A) GDC-0980 in MCT, and were
This article has not been copyedited and formatted. The final version may differ from this version.DMD Fast Forward. Published on June 13, 2012 as DOI: 10.1124/dmd.112.046052
at ASPE
T Journals on M
arch 25, 2020dm
d.aspetjournals.orgD
ownloaded from
DMD #46052
27
0.55 (42) hr-1, 0.44 (23) hr-1 and 1.18 (32) L/kg, respectively. These estimated parameters
were used to simulate plasma concentration-time profiles when modeling the xenograft
efficacy data, since serial blood samples adequate for modeling were not collected from
tumor-bearing mice during the study. The comparison between the observed plasma
concentrations and model predictions is presented in Fig. 7B, and indicates that the PK
model used described these data appropriately.
Xenograft Efficacy Studies
GDC-0980 was administered PO, daily, to MCF7-neo/HER2 tumor-bearing mice at doses
ranging from 0.25 to 7.5 mg/kg. Tumor growth inhibition results are presented in Fig. 7C.
The inhibition of the MCF7-neo/HER2 tumor growth appeared to be dose-dependent.
An indirect response model was fitted to the tumor data from all doses (eq. 1) and
appeared to describe them adequately. The comparison between the observed tumor
volumes and model predictions is presented in Fig. 7D. The estimates of the
pharmacodynamic parameters describing MCF7-neo/HER2 tumor growth and reduction
effect by GDC-0980 are presented in Table 8.
Prediction of Human PK Parameters and Efficacious Doses
Human CLp and volume of distribution of GDC-0980 were predicted by allometric
scaling (Fig. 8) using the estimates of CLp and volume of distribution from mouse, rat,
monkey and dog. For CLp, the MLP correction was applied as proposed by Mahmood
and Balian (Mahmood and Balian, 1996), based on the value of the allometric exponent
This article has not been copyedited and formatted. The final version may differ from this version.DMD Fast Forward. Published on June 13, 2012 as DOI: 10.1124/dmd.112.046052
at ASPE
T Journals on M
arch 25, 2020dm
d.aspetjournals.orgD
ownloaded from

DMD #46052
28
in the simple allometry plot (1; not shown). The predicted CLp and volume of distribution
were 5.1 mL/min/kg and 1.8 L/kg, respectively.
The plasma concentration-time profile following oral administration of the starting dose
(2 mg) was simulated using GastroPlus™. Parameters used as input are presented in this
manuscript or corresponded to the default values in the software. Plasma CL predicted by
allometry was assumed to be equivalent to hepatic CL; thus hepatic CL was set to 5.1
ml/min/kg in GastroPlus™ (21.4 L/h for 70 kg human). The simulated and the average
concentrations from patients (Wagner et al., 2009; Bendell et al., 2010) are presented in
Fig. 9. The AUC0-24, Cmax and T1/2 estimated from the GastroPlus™ simulation (0.13
µM•hr, 0.017 µM and 4.4 hr, respectively) are presented in Table 9, along with the actual
values obtained in patients in Phase I (Wagner et al., 2009). The fraction absorbed (Fa)
and the bioavailability (F) predicted by GastroPlus™ were 99% and 74%, respectively.
The simulated profile was fitted using a one-compartment model with first-order
absorption. The estimated parameters from that fit were substituted for the mouse
parameters in the PK-PD model described here and used to simulate human doses
expected to achieve efficacy. The human daily dose and AUC0-24 associated with 60%
tumor growth inhibition compared to vehicle on day 21 were 55 mg and 3.8 µM●hr,
respectively. This dose was determined by iteration, through successive simulations of
different doses; the target of 60% tumor growth inhibition was reached at 55 mg.
This article has not been copyedited and formatted. The final version may differ from this version.DMD Fast Forward. Published on June 13, 2012 as DOI: 10.1124/dmd.112.046052
at ASPE
T Journals on M
arch 25, 2020dm
d.aspetjournals.orgD
ownloaded from
DMD #46052
29
Discussion
The PI3K pathway, which is commonly altered in numerous cancers (Liu et al., 2009a),
has been identified as a promising target for the treatment of malignancies. Components
of this signaling pathway, such as PI3K or mTOR, can be targeted by small molecules
and several inhibitors specific for one of these two kinases are being evaluated in patients
(Engelman, 2009). Inhibitors of mTOR (mTORC1), referred to as rapalogues, have been
approved for the treatment of cancers and numerous dual PI3K/mTOR inhibitors are
currently in clinical trials (Benjamin et al., 2011).
Preclinical pharmacokinetic studies provide key parameters during the discovery and the
early stages of development of a compound. These parameters help assess whether
sufficient exposure can be achieved in further animal studies (efficacy, toxicology) and
are also used to predict pharmacokinetic properties in humans. In addition, when
integrated with efficacy data in PK-PD models, they can be utilized to estimate
efficacious and target doses in humans (Gibbs, 2010). GDC-0980, a PI3K/mTOR
inhibitor being developed as an anticancer agent, had low plasma CL (and blood CL
based on blood-to-plasma ratio) in the mouse, rat and dog, and moderate CL in monkey,
when compared to hepatic blood flow (Davies and Morris, 1993). Renal CL was a minor
route of elimination in monkeys (Table 4), dogs and rats (Figs. 3 and 4). In contrast, the
[14C]GDC-0980-associated radioactivity measured in the bile of bile duct-cannulated rats
represented approximately 42% of the dose administered (Fig. 3B), while almost all of
the dose administered to intact rats was recovered in the feces (Fig. 3A). The combined
recovery in urine and bile indicated that 50 to 57% of the oral dose was absorbed. The
This article has not been copyedited and formatted. The final version may differ from this version.DMD Fast Forward. Published on June 13, 2012 as DOI: 10.1124/dmd.112.046052
at ASPE
T Journals on M
arch 25, 2020dm
d.aspetjournals.orgD
ownloaded from

DMD #46052
30
large contribution of the biliary route in the elimination of GDC-0980 was supported by
results from the rat QWBA study, where high levels of radioactivity were measured in
the bile. Similarly, in the dog, biliary elimination was prominent with more than 40% of
the radioactivity recovered (Fig. 4). Combined with the recovery in urine (21.5%), these
results indicated that approximately 63% of the oral dose was absorbed. In both species,
the calculated bioavailability (F) was approximately 100% while the fraction absorbed
did not appear to exceed 63% based on the recovery of radioactivity in bile and urine.
Biliary secretion is a major route of elimination for GDC-0980 and it is possible that it
undergoes entero-hepatic cycling (EHC), either following elimination as parent
compound, or as a conjugate cleaved in the intestine, allowing GDC-0980 to be recycled.
The reabsorption of the parent compound could contribute to increased AUC and thus F.
Indeed, a secondary “hump” can be observed following PO administration in rats and
dogs (Figs. 2A and 2D), which may be indicative of EHC.
The QWBA study in rats also indicated that GDC-0980 distributed rapidly and
extensively into tissues, which was consistent with the moderate volume of distribution
measured in the rat PK study. However, among all tissues, the levels of radioactivity in
the central nervous system (CNS) were the lowest. This can be attributed to the effect of
efflux transporters limiting access of GDC-0980 to the brain. Indeed, despite its high
permeability in parental MDCK cells, studies in transfected cells indicated that GDC-
0980 was a substrate for P-gp and bcrp1 (Table 1). These results were also consistent
with the poor brain penetration observed in wild type mice, and the marked increase (~
20-fold) in brain concentration achieved in the P-gp and bcrp1-deficient mice (Table 7).
While the high levels of GDC-0980 in the brain of the knockout mice led to a pronounced
This article has not been copyedited and formatted. The final version may differ from this version.DMD Fast Forward. Published on June 13, 2012 as DOI: 10.1124/dmd.112.046052
at ASPE
T Journals on M
arch 25, 2020dm
d.aspetjournals.orgD
ownloaded from
DMD #46052
31
PI3K pathway suppression, for up to 6 hours, inhibition of the pathway was also detected
in the brain of wild type animals (Fig. 6) despite much lower concentrations. The effects
observed were consistent with the free brain concentrations determined in both strains (~
0.8 µM in the knockout and ~0.06 µM in the wild type mice), which were greater than
the IC50 (or Ki) for each of the PI3K isoforms and mTOR (0.005-0.027 µM; (Sutherlin et
al., 2011)). Similar findings with pAkt were reported with another PI3K inhibitor, GDC-
0941 (Salphati et al., 2010a). However, in addition to this marker, potent inhibition of
mTOR by GDC-0980 (Wallin et al., 2011) led to the prolonged suppression of pS6, a
downstream effector of the mTOR kinase (Fig. 6). Inhibition of PI3K in the brain,
through administration of inhibitors of this pathway in combinations with P-gp/BCRP
inhibitors, or design of compounds circumventing these transporters, could have
implications for the treatment of CNS tumors relying on the activation of this pathway,
such as glioblastoma (Holand et al., 2011). The fairly constant brain-to-plasma ratio
observed between 1 and 6 hours suggested that by 1 hour, a steady-state condition had
been reached between brain and plasma. In addition, the similar plasma concentrations
measured in the wild type and triple knockout mice implied that the two transporters had
minimal impact on the systemic exposure to GDC-0980, as has been reported for other
substrates of both P-gp and bcrp1 (Polli et al., 2009; Salphati et al., 2010a). It is worth
noting that while GDC-0980 brain penetration was markedly improved in the Mdr1a/b(-/-
)/Bcrp1(-/-) mice, the ratio of free brain-to-free plasma concentrations was approximately
0.3, and not approaching 1 as would be expected if free drug was in equilibrium between
brain and plasma. Efflux at the blood brain barrier by transporters other than P-gp and
Bcrp1 may explain this result; experimental variability in the estimation of the free
This article has not been copyedited and formatted. The final version may differ from this version.DMD Fast Forward. Published on June 13, 2012 as DOI: 10.1124/dmd.112.046052
at ASPE
T Journals on M
arch 25, 2020dm
d.aspetjournals.orgD
ownloaded from

DMD #46052
32
fraction in brain or plasma could also contribute to the calculation of this lower than
expected free brain-to-plasma ratio. The in vitro determination of binding to brain
homogenate has nevertheless been proposed as a reliable method to estimate free brain
concentration (Liu et al., 2009b).
Plasma protein binding was low, not exceeding 71% in all species over the range of
concentrations tested (Table 4), which appeared consistent with the moderate volume of
distribution across species ( ~1- to 5.6-fold total body water (Davies and Morris, 1993)).
The predicted human CL of GDC-0980 was 5.1 ml/min/kg using MLP as a correction
factor. This predicted human plasma CL was comparable to the hepatic CL of 3.3
ml/min/kg projected from hepatocyte stability data (Table 2). Plasma CL measured in
preclinical species was overall consistent with in vitro projections (Tables 2 and 5) and
the narrow range of predictions obtained based on in vitro results and allometry provided
some confidence that the human plasma CL would be low. Prediction of human CL
remains challenging however, and among the numerous methods recently evaluated
(Ring et al., 2011), it did not appear that one was notably more accurate. The use of
PBPK models for the prediction of plasma concentration-time PO profiles resulted also in
a fairly poor performance (Poulin et al., 2011). In general, a thorough characterization
and understanding of the preclinical PK, as well as strong in vitro- in vivo correlations in
preclinical species, and convergent predictions with different methods provide more
confidence. GDC-0980 was generated from the same chemical series as GDC-0941
(Folkes et al., 2008), a compound that had previously entered clinical trials. The
evaluation of the different human prediction methods used with that compound (Salphati
et al., 2010b) was informative and helped build confidence in the approach selected with
This article has not been copyedited and formatted. The final version may differ from this version.DMD Fast Forward. Published on June 13, 2012 as DOI: 10.1124/dmd.112.046052
at ASPE
T Journals on M
arch 25, 2020dm
d.aspetjournals.orgD
ownloaded from
DMD #46052
33
GDC-0980. While the allometry predicted plasma CL and the extrapolation of in vitro
hepatocytes stability data predicted hepatic blood CL, these could be directly compared
as the blood-to-plasma ratio was 1.1.
The plasma concentration-time profile of GDC-0980 for the starting dose in human (2 mg)
was predicted using GastroPlus™ and the PBPKPlus™ module. In this simulation,
human CL predicted by interspecies scaling (5.1 mL/min/kg) was conservatively chosen
as input for hepatic CL (21.4 L/hr; 70 kg human). The PK parameters (AUC, Cmax and
T1/2) derived from the simulation were similar to the values obtained in patients in Phase I
(Table 9) (Wagner et al., 2009) and the simulated profile (Fig. 9) described the actual
plasma concentrations very closely (Wagner et al., 2009; Bendell et al., 2010). The Vss
estimated by PBPKPlus™ based on the GDC-0980 physico-chemical properties and
input from in vitro studies was also comparable to that extrapolated from preclinical data
by allometry (1.9 vs. 1.8 L/kg). To estimate efficacious doses and exposures in human,
the parameters obtained from the fit (1-compartment model, first order absorption) of this
simulated profile were substituted for the mouse parameters in the PK-PD model
described here. This approach assumes a similar relationship between PD marker
response and efficacy in human and mouse xenograft models as well as a comparable
drug distribution in xenograft and human tumor. Despite these caveats, the prediction of
efficacy from PK-PD models of xenograft data can be useful in the design of clinical
trials and can help establish PK and PD target. This method has been successfully applied
in predicting targets for human efficacy (Simeoni et al., 2004; Tanaka et al., 2008). The
GDC-0980 human daily dose and exposure predicted to be associated with 60% TGI
were 55 mg and 3.8 µM•hr, respectively, based on the MCF7-neo/HER2 xenograft model
This article has not been copyedited and formatted. The final version may differ from this version.DMD Fast Forward. Published on June 13, 2012 as DOI: 10.1124/dmd.112.046052
at ASPE
T Journals on M
arch 25, 2020dm
d.aspetjournals.orgD
ownloaded from

DMD #46052
34
(PI3K mutant). This target TGI was selected, as proposed by Wong et al. (Wong et al.,
2011), as the minimum likely to correspond to clinical response. The predicted
efficacious dose appeared consistent with results reported by Bendell et al. (Bendell et al.,
2010) showing some clinical response with 50 mg (AUC~ 5 µM•hr) GDC-0980 dosed
daily for 21 days in a 28-day cycle of treatment. Although such consistency is promising,
the validity of the preclinical efficacy models depends also on their relevance the work
and predictions presented here were based on the MCF7-neo/HER2 xenograft model
(PI3K mutant). Efficacy studies and predictions utilizing models with different
mutational status (e.g., PI3K wild type, PTEN null) may also help define a range of
potential efficacious doses.
In summary, the preclinical ADME properties of GDC-0980 provided the basis for
further clinical evaluation and the use of PK and PK-PD simulations in early
development helped assess its potential for clinical efficacy. GDC-0980 is currently in
Phase II clinical trial.
This article has not been copyedited and formatted. The final version may differ from this version.DMD Fast Forward. Published on June 13, 2012 as DOI: 10.1124/dmd.112.046052
at ASPE
T Journals on M
arch 25, 2020dm
d.aspetjournals.orgD
ownloaded from

DMD #46052
35
Acknowledgements
The authors thank the DMPK, Chemistry and Small Molecule Pharmaceutical Sciences
Departments and the In Vivo Studies Group at Genentech for their contributions to the
results presented.
This article has not been copyedited and formatted. The final version may differ from this version.DMD Fast Forward. Published on June 13, 2012 as DOI: 10.1124/dmd.112.046052
at ASPE
T Journals on M
arch 25, 2020dm
d.aspetjournals.orgD
ownloaded from
DMD #46052
36
Authorship Contribution
Participated in research design: Salphati, Pang, Plise. Lee, Olivero, Prior, Sampath, Wong
Conducted Experiment: Plise, Lee, Prior, Wong
Contributed new reagents and analytic tools: Zhang
Performed Data Analysis: Salphati, Pang, Plise, Lee, Wong
Wrote or contributed to the writing of the manuscript: Salphati, Pang
This article has not been copyedited and formatted. The final version may differ from this version.DMD Fast Forward. Published on June 13, 2012 as DOI: 10.1124/dmd.112.046052
at ASPE
T Journals on M
arch 25, 2020dm
d.aspetjournals.orgD
ownloaded from
DMD #46052
37
References
Bendell JC, Wagner AJ, Dolly S, Morgan JA, Papadatos-Pastos D, Ware JA, Mazina KE,
Lauchle J, Burris H, and De Bono J (2010) A first-in-human phase I study to
evaluate the dual PI3K/mTOR inhibitor GDC-0980 administered QD in patients
with advanced solid tumors or non-Hodgkin’s lymphoma (NHL). European
Society for Medical Oncology (ESMO) Meeting:Abstract 4960.
Benjamin D, Colombi M, Moroni C, and Hall MN (2011) Rapamycin passes the torch: a
new generation of mTOR inhibitors. Nature reviews Drug discovery 10:868-880.
Boxenbaum H (1982) Interspecies scaling, allometry, physiological time, and the ground
plan of pharmacokinetics. J Pharmacokinet Biopharm 10:201-227.
Castanedo G, Dotson J, Goldsmith R, Gunzner J, Heffron T, Mathieu S, Olivero A,
Staben S, Sutherlin DP, Tsui V, WANG S, Zhu B-Y, Bayliss T, Chuckowree I,
Folkes A, and Wan NC (2008) Inventor Phosphoinositide 3-kinase inhibitor
compounds and methods of use. WO/2008/073785.
Chalhoub N and Baker SJ (2009) PTEN and the PI3-kinase pathway in cancer. Annu Rev
Pathol 4:127-150.
Ciraolo E, Morello F, and Hirsch E (2011) Present and future of PI3K pathway inhibition
in cancer: perspectives and limitations. Current medicinal chemistry 18:2674-
2685.
Davies B and Morris T (1993) Physiological parameters in laboratory animals and
humans. Pharm Res 10:1093-1095.
Engelman JA (2009) Targeting PI3K signalling in cancer: opportunities, challenges and
limitations. Nat Rev Cancer 9:550-562.
Engelman JA, Luo J, and Cantley LC (2006) The evolution of phosphatidylinositol 3-
kinases as regulators of growth and metabolism. Nat Rev Genet 7:606-619.
This article has not been copyedited and formatted. The final version may differ from this version.DMD Fast Forward. Published on June 13, 2012 as DOI: 10.1124/dmd.112.046052
at ASPE
T Journals on M
arch 25, 2020dm
d.aspetjournals.orgD
ownloaded from

DMD #46052
38
Folkes AJ, Ahmadi K, Alderton WK, Alix S, Baker SJ, Box G, Chuckowree IS, Clarke
PA, Depledge P, Eccles SA, Friedman LS, Hayes A, Hancox TC, Kugendradas A,
Lensun L, Moore P, Olivero AG, Pang J, Patel S, Pergl-Wilson GH, Raynaud FI,
Robson A, Saghir N, Salphati L, Sohal S, Ultsch MH, Valenti M, Wallweber HJ,
Wan NC, Wiesmann C, Workman P, Zhyvoloup A, Zvelebil MJ, and
Shuttleworth SJ (2008) The identification of 2-(1H-indazol-4-yl)-6-(4-
methanesulfonyl-piperazin-1-ylmethyl)-4-morpholin-4-yl-t hieno[3,2-
d]pyrimidine (GDC-0941) as a potent, selective, orally bioavailable inhibitor of
class I PI3 kinase for the treatment of cancer. Journal of medicinal chemistry
51:5522-5532.
Gibaldi M and Perrier D (1982) Pharmacokinetics. Marcel Dekker, New York.
Gibbs JP (2010) Prediction of exposure-response relationships to support first-in-human
study design. AAPS J 12:750-758.
Guertin DA and Sabatini DM (2009) The pharmacology of mTOR inhibition. Science
signaling 2:pe24.
Holand K, Salm F, and Arcaro A (2011) The phosphoinositide 3-kinase signaling
pathway as a therapeutic target in grade IV brain tumors. Current cancer drug
targets 11:894-918.
Kalvass JC, Maurer TS, and Pollack GM (2007) Use of plasma and brain unbound
fractions to assess the extent of brain distribution of 34 drugs: comparison of
unbound concentration ratios to in vivo p-glycoprotein efflux ratios. Drug
metabolism and disposition: the biological fate of chemicals 35:660-666.
Liu P, Cheng H, Roberts TM, and Zhao JJ (2009a) Targeting the phosphoinositide 3-
kinase pathway in cancer. Nature reviews Drug discovery 8:627-644.
Liu X, Van Natta K, Yeo H, Vilenski O, Weller PE, Worboys PD, and Monshouwer M
(2009b) Unbound drug concentration in brain homogenate and cerebral spinal
fluid at steady state as a surrogate for unbound concentration in brain interstitial
This article has not been copyedited and formatted. The final version may differ from this version.DMD Fast Forward. Published on June 13, 2012 as DOI: 10.1124/dmd.112.046052
at ASPE
T Journals on M
arch 25, 2020dm
d.aspetjournals.orgD
ownloaded from

DMD #46052
39
fluid. Drug metabolism and disposition: the biological fate of chemicals 37:787-
793.
Mahmood I and Balian JD (1996) Interspecies scaling: predicting clearance of drugs in
humans. Three different approaches. Xenobiotica; the fate of foreign compounds
in biological systems 26:887-895.
O'Reilly KE, Rojo F, She QB, Solit D, Mills GB, Smith D, Lane H, Hofmann F, Hicklin
DJ, Ludwig DL, Baselga J, and Rosen N (2006) mTOR inhibition induces
upstream receptor tyrosine kinase signaling and activates Akt. Cancer research
66:1500-1508.
Obach RS, Baxter JG, Liston TE, Silber BM, Jones BC, MacIntyre F, Rance DJ, and
Wastall P (1997) The prediction of human pharmacokinetic parameters from
preclinical and in vitro metabolism data. J Pharmacol Exp Ther 283:46-58.
Polli JW, Olson KL, Chism JP, John-Williams LS, Yeager RL, Woodard SM, Otto V,
Castellino S, and Demby VE (2009) An unexpected synergist role of P-
glycoprotein and breast cancer resistance protein on the central nervous system
penetration of the tyrosine kinase inhibitor lapatinib (N-{3-chloro-4-[(3-
fluorobenzyl)oxy]phenyl}-6-[5-({[2-(methylsulfonyl)ethyl]amino }methyl)-2-
furyl]-4-quinazolinamine; GW572016). Drug metabolism and disposition: the
biological fate of chemicals 37:439-442.
Poulin P, Jones RD, Jones HM, Gibson CR, Rowland M, Chien JY, Ring BJ, Adkison
KK, Ku MS, He H, Vuppugalla R, Marathe P, Fischer V, Dutta S, Sinha VK,
Bjornsson T, Lave T, and Yates JW (2011) PHRMA CPCDC initiative on
predictive models of human pharmacokinetics, part 5: Prediction of plasma
concentration-time profiles in human by using the physiologically-based
pharmacokinetic modeling approach. Journal of pharmaceutical sciences.
Ring BJ, Chien JY, Adkison KK, Jones HM, Rowland M, Jones RD, Yates JW, Ku MS,
Gibson CR, He H, Vuppugalla R, Marathe P, Fischer V, Dutta S, Sinha VK,
This article has not been copyedited and formatted. The final version may differ from this version.DMD Fast Forward. Published on June 13, 2012 as DOI: 10.1124/dmd.112.046052
at ASPE
T Journals on M
arch 25, 2020dm
d.aspetjournals.orgD
ownloaded from
DMD #46052
40
Bjornsson T, Lave T, and Poulin P (2011) PhRMA CPCDC initiative on
predictive models of human pharmacokinetics, part 3: Comparative assessement
of prediction methods of human clearance. Journal of pharmaceutical sciences.
Sabbah DA, Brattain MG, and Zhong H (2011) Dual inhibitors of PI3K/mTOR or
mTOR-selective inhibitors: which way shall we go? Current medicinal chemistry
18:5528-5544.
Salphati L, Lee LB, Pang J, Plise EG, and Zhang X (2010a) Role of P-glycoprotein and
breast cancer resistance protein-1 in the brain penetration and brain
pharmacodynamic activity of the novel phosphatidylinositol 3-kinase inhibitor
GDC-0941. Drug metabolism and disposition: the biological fate of chemicals
38:1422-1426.
Salphati L, Wong H, Belvin M, Bradford D, Edgar KA, Prior WW, Sampath D, and
Wallin JJ (2010b) Pharmacokinetic-pharmacodynamic modeling of tumor growth
inhibition and biomarker modulation by the novel phosphatidylinositol 3-kinase
inhibitor GDC-0941. Drug metabolism and disposition: the biological fate of
chemicals 38:1436-1442.
Simeoni M, Magni P, Cammia C, De Nicolao G, Croci V, Pesenti E, Germani M, Poggesi
I, and Rocchetti M (2004) Predictive pharmacokinetic-pharmacodynamic
modeling of tumor growth kinetics in xenograft models after administration of
anticancer agents. Cancer research 64:1094-1101.
Sutherlin DP, Bao L, Berry M, Castanedo G, Chuckowree I, Dotson J, Folks A, Friedman
L, Goldsmith R, Gunzner J, Heffron T, Lesnick J, Lewis C, Mathieu S, Murray J,
Nonomiya J, Pang J, Pegg N, Prior WW, Rouge L, Salphati L, Sampath D, Tian
Q, Tsui V, Wan NC, Wang S, Wei B, Wiesmann C, Wu P, Zhu BY, and Olivero
A (2011) Discovery of a potent, selective, and orally available class I
phosphatidylinositol 3-kinase (PI3K)/mammalian target of rapamycin (mTOR)
This article has not been copyedited and formatted. The final version may differ from this version.DMD Fast Forward. Published on June 13, 2012 as DOI: 10.1124/dmd.112.046052
at ASPE
T Journals on M
arch 25, 2020dm
d.aspetjournals.orgD
ownloaded from

DMD #46052
41
kinase inhibitor (GDC-0980) for the treatment of cancer. Journal of medicinal
chemistry 54:7579-7587.
Tanaka C, O'Reilly T, Kovarik JM, Shand N, Hazell K, Judson I, Raymond E, Zumstein-
Mecker S, Stephan C, Boulay A, Hattenberger M, Thomas G, and Lane HA
(2008) Identifying optimal biologic doses of everolimus (RAD001) in patients
with cancer based on the modeling of preclinical and clinical pharmacokinetic and
pharmacodynamic data. Journal of clinical oncology : official journal of the
American Society of Clinical Oncology 26:1596-1602.
Wagner AJ, Burris HA, De Bono JS, Jayson GC, Bendell JC, Gomez-Roca C, Dolly S,
Zee Y-K, Ware JA, Yan Y, Mazina KE, Derynck MK, Holden SN, and Soria J-C
(2009) Pharmacokinetics and pharmacodynamic biomarkers for the dual
PI3K/mTOR inhibitor GDC-0980: Initial phase I evaluation. Molecular cancer
therapeutics 8:Supplement 1.
Wallin JJ, Edgar KA, Guan J, Berry M, Prior WW, Lee L, Lesnick JD, Lewis C,
Nonomiya J, Pang J, Salphati L, Olivero AG, Sutherlin DP, O'Brien C, Spoerke
JM, Patel S, Lensun L, Kassees R, Ross L, Lackner MR, Sampath D, Belvin M,
and Friedman LS (2011) GDC-0980 is a novel class I PI3K/mTOR kinase
inhibitor with robust activity in cancer models driven by the PI3K pathway.
Molecular cancer therapeutics 10:2426-2436.
Wong H, Choo EF, Alicke B, Ding X, La H, McNamara E, Theil F-P, Tibbitts J,
Friedman LS, Hop CECA, and Gould SE (2011) Antitumor activity of targeted
and cytotoxic agents in xenograft models correlates with clinical response: A
pharmacokinetic-pharmacodynamic analysis, in: Molecular cancer therapeutics,
pp Supplement 1.
Wong KK, Engelman JA, and Cantley LC (2010) Targeting the PI3K signaling pathway
in cancer. Curr Opin Genet Dev 20:87-90.
This article has not been copyedited and formatted. The final version may differ from this version.DMD Fast Forward. Published on June 13, 2012 as DOI: 10.1124/dmd.112.046052
at ASPE
T Journals on M
arch 25, 2020dm
d.aspetjournals.orgD
ownloaded from

DMD #46052
42
Footnotes
Address correspondence to: Laurent Salphati, Pharm.D., Ph.D. Department of Drug Metabolism and Pharmacokinetics, MS 412A, Genentech, Inc., 1 DNA Way, South San Francisco, CA. 94080. Email: [email protected]
Declaration of Interest: The authors are employees of Genentech, Inc.
This article has not been copyedited and formatted. The final version may differ from this version.DMD Fast Forward. Published on June 13, 2012 as DOI: 10.1124/dmd.112.046052
at ASPE
T Journals on M
arch 25, 2020dm
d.aspetjournals.orgD
ownloaded from

DMD #46052
43
Legends to Figures
Figure 1. Chemical structure of GDC-0980
Figure 2. Mean plasma concentration-time profiles following intravenous (1 mg/kg) and
oral (5 mg/kg in rodents; 2 mg/kg in monkey and dog) administrations of GDC-
0980. A: Mouse; B: Rat; C: Cynomolgus monkey; D: Dog
Figure 3. Recovery of [14C]GDC-0980-related radioactivity following oral administration
of 2 mg/kg (100 µCi/kg) of GDC-0980 to male and female bile duct-intact (A)
and bile duct-cannulated (B) Sprague-Dawley rats. Results presented as mean ±
SD (n=3 rat/sex).
Figure 4. Recovery of [14C]GDC-0980-related radioactivity following oral administration
of 5 mg/kg (20 µCi/kg) of GDC-0980 to male and female bile duct-intact and bile
duct-cannulated Beagle dogs. Results presented as mean of two animals.
Figure 5. Whole-body autoradiogram of the radioactivity distribution in a male Sprague-
Dawley rat at 1 h following a single PO administration of [14C]-GDC-0980 at a
target dose of 2 mg/kg (200 µCi/rat).
Figure 6. Modulation of pAkt and pS6 in the brain of wild type and Mdr1a/b(-/-)/Bcrp1(-
/-) mice following PO administration of GDC-0980 at 20 mg/kg. A. Western blot
of mouse brains probed with antibodies against pAkt, total Akt, pS6, total S6 and
actin. B. Quantitation of mean pAkt and pS6 inhibition at 1 and 6 hrs post-dose in
wild type and Mdr1a/b(-/-)/Bcrp1(-/-) triple knockout mice. Results are presented
as the mean of 3 animals ± SD.
Figure 7. Plasma concentration time profiles in nude mice and xenograft studies in
MCF7-neo/HER2 tumor-bearing mice. Concentration-time profiles after oral
This article has not been copyedited and formatted. The final version may differ from this version.DMD Fast Forward. Published on June 13, 2012 as DOI: 10.1124/dmd.112.046052
at ASPE
T Journals on M
arch 25, 2020dm
d.aspetjournals.orgD
ownloaded from
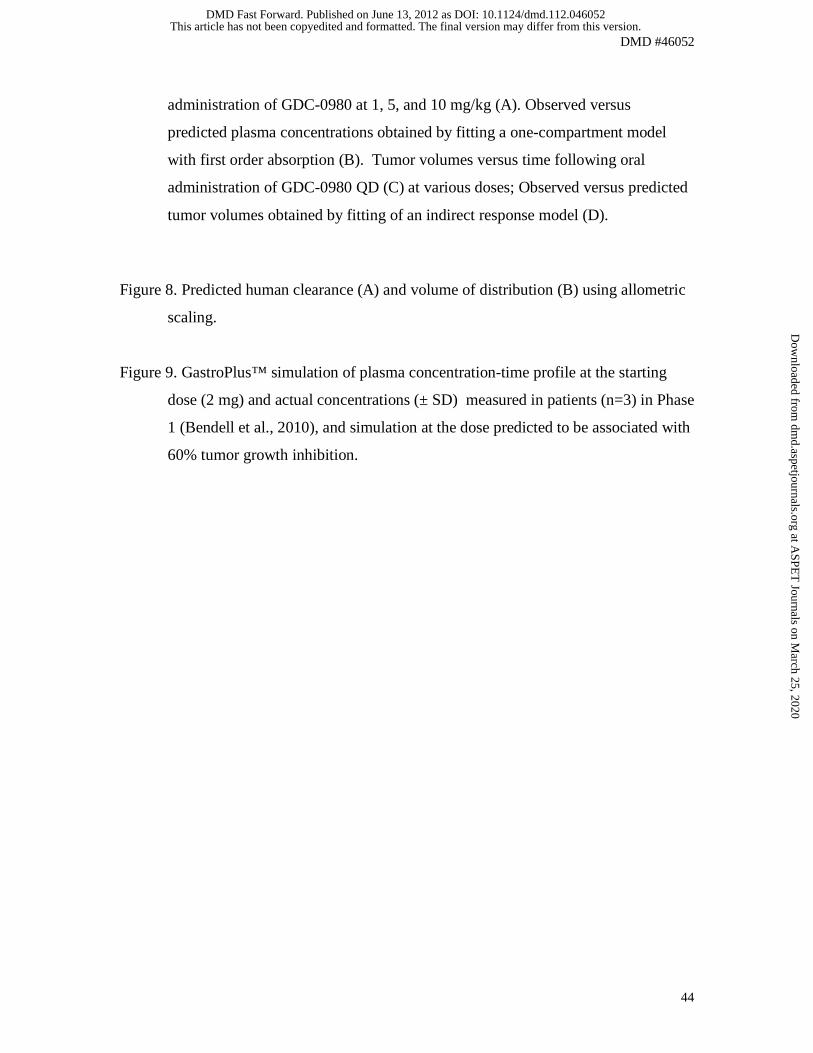
DMD #46052
44
administration of GDC-0980 at 1, 5, and 10 mg/kg (A). Observed versus
predicted plasma concentrations obtained by fitting a one-compartment model
with first order absorption (B). Tumor volumes versus time following oral
administration of GDC-0980 QD (C) at various doses; Observed versus predicted
tumor volumes obtained by fitting of an indirect response model (D).
Figure 8. Predicted human clearance (A) and volume of distribution (B) using allometric
scaling.
Figure 9. GastroPlus™ simulation of plasma concentration-time profile at the starting
dose (2 mg) and actual concentrations (± SD) measured in patients (n=3) in Phase
1 (Bendell et al., 2010), and simulation at the dose predicted to be associated with
60% tumor growth inhibition.
This article has not been copyedited and formatted. The final version may differ from this version.DMD Fast Forward. Published on June 13, 2012 as DOI: 10.1124/dmd.112.046052
at ASPE
T Journals on M
arch 25, 2020dm
d.aspetjournals.orgD
ownloaded from

DMD #46052
45
Table 1. Apparent Permeability (Papp) of GDC-0980 in MDCK, MDR1-MDCK and
Bcrp1-MDCK Cells
Cell Line Papp (10-6 cm/s) Papp Ratio
A to B B to A B-A/A-B
MDCKI 18 30 1.7
MDR1-MDCKI 1.0 19 19
MDR1-MDCKI + GF120918 17 19 1.1
Bcrp1-MDCKII 0.93 6.2 6.7
Bcrp1-MDCKII + FTC 8.1 6.0 0.74 Results reported as mean of duplicate.
This article has not been copyedited and formatted. The final version may differ from this version.DMD Fast Forward. Published on June 13, 2012 as DOI: 10.1124/dmd.112.046052
at ASPE
T Journals on M
arch 25, 2020dm
d.aspetjournals.orgD
ownloaded from

DMD #46052
46
Table 2. Hepatic Clearance of GDC-0980 in Multiple Species Predicted from Liver
Hepatocyte Incubations
Species Predicted Hepatic CL (ml/min/kg)
Mouse 5.1
Rat 3.3
Monkey 9.7
Dog 3.8
Human 3.3
Results reported as mean of duplicate.
This article has not been copyedited and formatted. The final version may differ from this version.DMD Fast Forward. Published on June 13, 2012 as DOI: 10.1124/dmd.112.046052
at ASPE
T Journals on M
arch 25, 2020dm
d.aspetjournals.orgD
ownloaded from

DMD #46052
47
Table 3. Blood-to-Plasma Ratio of [14C]GDC-0980 in Mouse, Rat, Dog, Monkey, and
Human Whole Blood
Species Total GDC-0980 Concentration a
(μM)
Blood-Plasma Ratio of
[14C]GDC-0980 Mouse
1 0.75 ± 0.016
10 0.78 ± 0.049
40 0.85 ± 0.041
Rat
1 0.97 ± 0.017
10 0.92 ± 0.045
40 0.90 ± 0.027
Cynomolgus Monkey
1 1.1 ± 0.0043
10 1.1 ± 0.035
40 1.0 ± 0.0087
Dog
1 0.94 � 0.039
10 0.85 ± 0.013
40 0.83 ± 0.0042
Human
1 1.3 ± 0.015
10 1.1 ± 0.081
40 1.1 ± 0.055 aUnlabeled and [14C]-labeled GDC-0980. Results reported as mean ± SD (n=3)
This article has not been copyedited and formatted. The final version may differ from this version.DMD Fast Forward. Published on June 13, 2012 as DOI: 10.1124/dmd.112.046052
at ASPE
T Journals on M
arch 25, 2020dm
d.aspetjournals.orgD
ownloaded from

DMD #46052
48
Table 4. Percentage of [14C]GDC-0980 Free in Mouse, Rat, Dog, Monkey, and Human
Plasma
Species Total GDC-0980
Conc. (μM) a % Free
[14C]GDC-0980
Mouse 1 29 ± 3.1
10 29 ± 2.6
40 32 ± 1.2
Rat 1 42 ± 3.5
10 41 ± 2.9
40 42 ± 0.94
Dog 1 49 ± 1.8
10 52 ± 2.4
40 52 ± 1.1
Cynomolgus Monkey
1 46 ± 3.8
10 48 ± 1.5
40 51 ± 1.9
Human 1 39 ± 2.8
10 41 ± 0.29
40 45 ± 2.6 a Unlabeled and [14C]-labeled GDC-0980. Results reported as mean ± SD (n=4)
This article has not been copyedited and formatted. The final version may differ from this version.DMD Fast Forward. Published on June 13, 2012 as DOI: 10.1124/dmd.112.046052
at ASPE
T Journals on M
arch 25, 2020dm
d.aspetjournals.orgD
ownloaded from

DMD #46052
49
Table 5. Pharmacokinetic Parameters (mean ± SD) of GDC-0980 in Mouse, Rat, Dog and
Monkey Following IV and PO Administrations.
Parameters NCr Nude Mice
Sprague-Dawley Rats
Beagle Dogs
Cynomolgus Monkeys
No of animals 27 a (3/timepoint)
3 a 3 b 3 b
Sex Female Male Male Male
Dose (mg/kg) 1 1 1 1
CL (mL/min/kg) 6.30 15.4 ± 2.85 6.38 ± 0.657 19.0 ± 1.31
t1/2 (hr) 2.05 3.52 ± 2.39 6.41 ± 0.885 0.558 ± 0.101
MRT (hr) 3.84 4.38 ± 2.50 7.57 ± 0.780 0.654 ± 0.106
Vss (L/kg) 1.45 3.78 ± 1.43 2.90 ± 0.397 0.739 ± 0.0678
Renal clearance (mL/min/kg)
ND ND ND 0.405 ±0.268
Oral administration
No of animals 27 d
(3/timepoint) 3 c 3d 3d
Sex Female Male Male Male
Dose (mg/kg) 5 5 2 2
AUCinf (µM•hr) 26.9 11.8 ± 3.31 13.2 ± 0.545 0.813 ± 0.302
Cmax (µM) 4.65 1.31 ± 0.533 2.71 ± 0.524 0.438 ± 0.184
tmax (hr) 0.25 1.17 ± 0.764 0.333 ± 0.144 1.67 ± 0.577
F (%) 101 106 ± 29.7 125 ± 5.16 22.9 ± 8.56
Notes: CL = plasma clearance; MRT = mean residence time; ND = not determined; t1/2 = half-life; Vss = volume of distribution at steady state; AUCinf = area under the plasma concentration−time curve extrapolated to infinity; Cmax = highest observed plasma concentration; F = bioavailability; tmax = time at which Cmax occurred. a Doses prepared in 5% dimethylsulfoxide, 5% cremophor in water.
b Doses prepared in 30% hydroxypropyl-β-cyclodextrin.
c Doses prepared in 80% polyethylene glycol 400 in water. d Doses prepared in 0.5% methylcellulose with 0.2% Tween 80.
This article has not been copyedited and formatted. The final version may differ from this version.DMD Fast Forward. Published on June 13, 2012 as DOI: 10.1124/dmd.112.046052
at ASPE
T Journals on M
arch 25, 2020dm
d.aspetjournals.orgD
ownloaded from
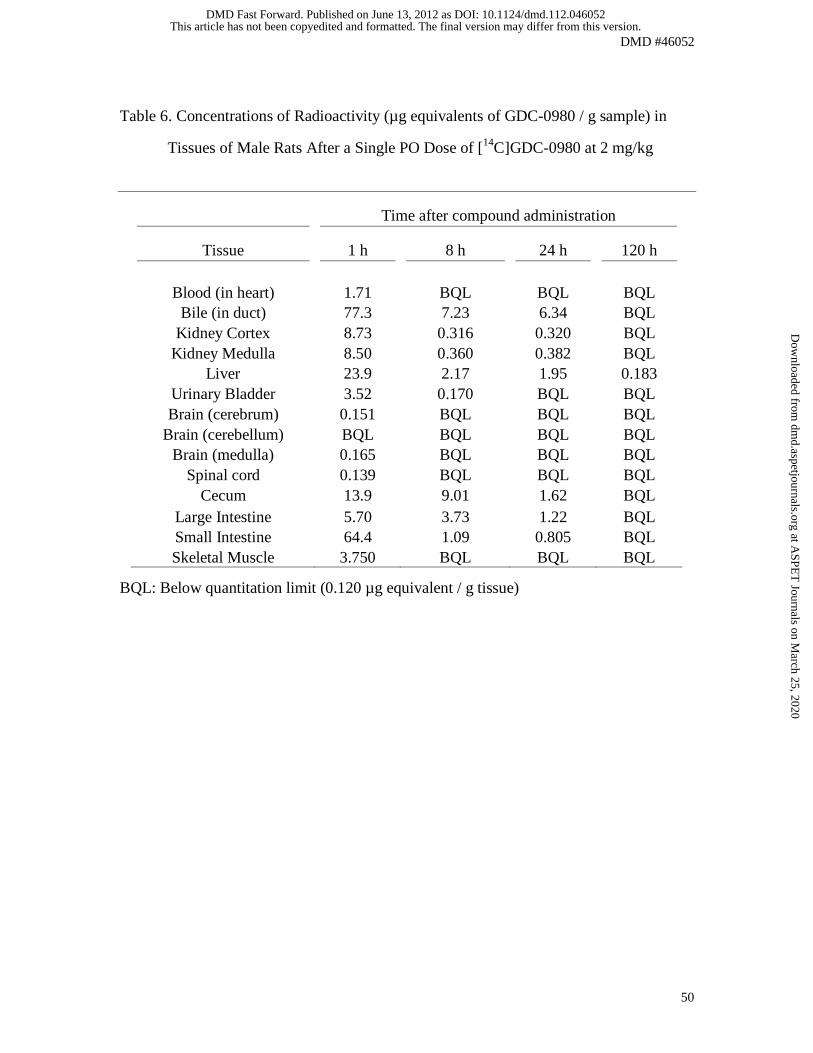
DMD #46052
50
Table 6. Concentrations of Radioactivity (µg equivalents of GDC-0980 / g sample) in
Tissues of Male Rats After a Single PO Dose of [14C]GDC-0980 at 2 mg/kg
Time after compound administration
Tissue 1 h 8 h 24 h 120 h
Blood (in heart) 1.71 BQL BQL BQL Bile (in duct) 77.3 7.23 6.34 BQL
Kidney Cortex 8.73 0.316 0.320 BQL Kidney Medulla 8.50 0.360 0.382 BQL
Liver 23.9 2.17 1.95 0.183 Urinary Bladder 3.52 0.170 BQL BQL Brain (cerebrum) 0.151 BQL BQL BQL
Brain (cerebellum) BQL BQL BQL BQL Brain (medulla) 0.165 BQL BQL BQL
Spinal cord 0.139 BQL BQL BQL Cecum 13.9 9.01 1.62 BQL
Large Intestine 5.70 3.73 1.22 BQL Small Intestine 64.4 1.09 0.805 BQL Skeletal Muscle 3.750 BQL BQL BQL
BQL: Below quantitation limit (0.120 µg equivalent / g tissue)
This article has not been copyedited and formatted. The final version may differ from this version.DMD Fast Forward. Published on June 13, 2012 as DOI: 10.1124/dmd.112.046052
at ASPE
T Journals on M
arch 25, 2020dm
d.aspetjournals.orgD
ownloaded from
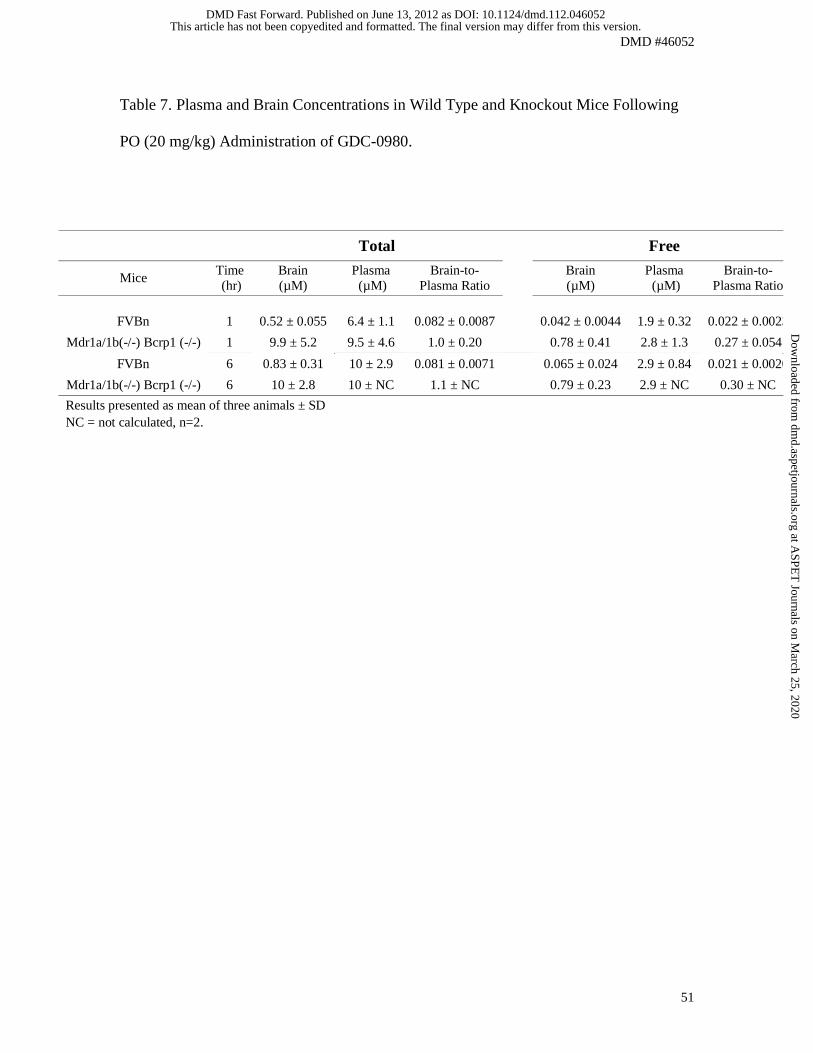
DMD #46052
51
Table 7. Plasma and Brain Concentrations in Wild Type and Knockout Mice Following
PO (20 mg/kg) Administration of GDC-0980.
Total Free
Mice Time (hr)
Brain (µM)
Plasma (µM)
Brain-to-Plasma Ratio
Brain (µM)
Plasma (µM)
Brain-to-Plasma Ratio
FVBn 1 0.52 ± 0.055 6.4 ± 1.1 0.082 ± 0.0087 0.042 ± 0.0044 1.9 ± 0.32 0.022 ± 0.0023
Mdr1a/1b(-/-) Bcrp1 (-/-) 1 9.9 ± 5.2 9.5 ± 4.6 1.0 ± 0.20 0.78 ± 0.41 2.8 ± 1.3 0.27 ± 0.054
FVBn 6 0.83 ± 0.31 10 ± 2.9 0.081 ± 0.0071 0.065 ± 0.024 2.9 ± 0.84 0.021 ± 0.0020
Mdr1a/1b(-/-) Bcrp1 (-/-) 6 10 ± 2.8 10 ± NC 1.1 ± NC 0.79 ± 0.23 2.9 ± NC 0.30 ± NC
Results presented as mean of three animals ± SD NC = not calculated, n=2.
This article has not been copyedited and formatted. The final version may differ from this version.DMD Fast Forward. Published on June 13, 2012 as DOI: 10.1124/dmd.112.046052
at ASPE
T Journals on M
arch 25, 2020dm
d.aspetjournals.orgD
ownloaded from

DMD #46052
52
Table 8. Pharmacodynamic Parameters Estimated from MCF7-neo/HER2 Tumor
Xenograft Studies.
Parameter Estimate CV (%)
kng (hr-1) 0.0042 2.7
Kmax (hr-1) 0.020 11
KC50 (µM) 2.0 25
n 1 (fixed) -
ED60 (mg/kg) 1.1 -
Cstasis (µM) 0.52 -
This article has not been copyedited and formatted. The final version may differ from this version.DMD Fast Forward. Published on June 13, 2012 as DOI: 10.1124/dmd.112.046052
at ASPE
T Journals on M
arch 25, 2020dm
d.aspetjournals.orgD
ownloaded from
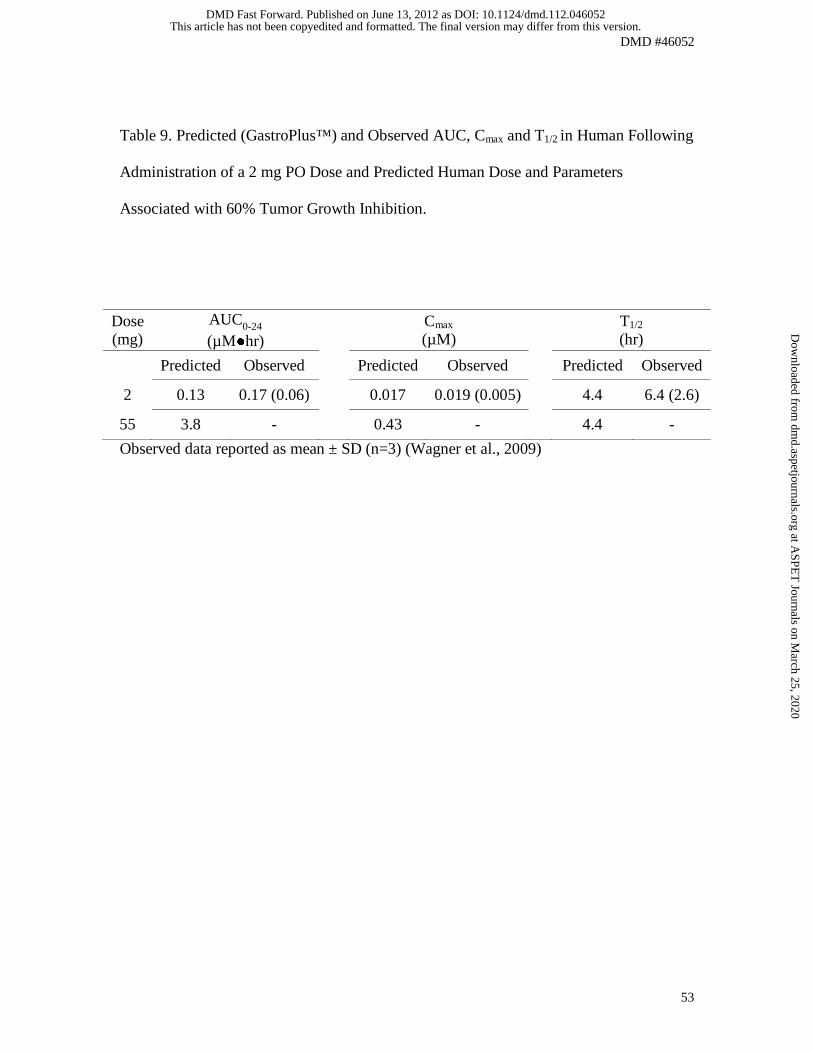
DMD #46052
53
Table 9. Predicted (GastroPlus™) and Observed AUC, Cmax and T1/2 in Human Following
Administration of a 2 mg PO Dose and Predicted Human Dose and Parameters
Associated with 60% Tumor Growth Inhibition.
Dose (mg)
AUC0-24 (µM●hr)
Cmax (µM)
T1/2
(hr)
Predicted Observed Predicted Observed Predicted Observed
2 0.13 0.17 (0.06) 0.017 0.019 (0.005) 4.4 6.4 (2.6)
55 3.8 - 0.43 - 4.4 -
Observed data reported as mean ± SD (n=3) (Wagner et al., 2009)
This article has not been copyedited and formatted. The final version may differ from this version.DMD Fast Forward. Published on June 13, 2012 as DOI: 10.1124/dmd.112.046052
at ASPE
T Journals on M
arch 25, 2020dm
d.aspetjournals.orgD
ownloaded from

Figure 1
This article has not been copyedited and form
atted. The final version m
ay differ from this version.
DM
D Fast Forw
ard. Published on June 13, 2012 as DO
I: 10.1124/dmd.112.046052
at ASPET Journals on March 25, 2020 dmd.aspetjournals.org Downloaded from
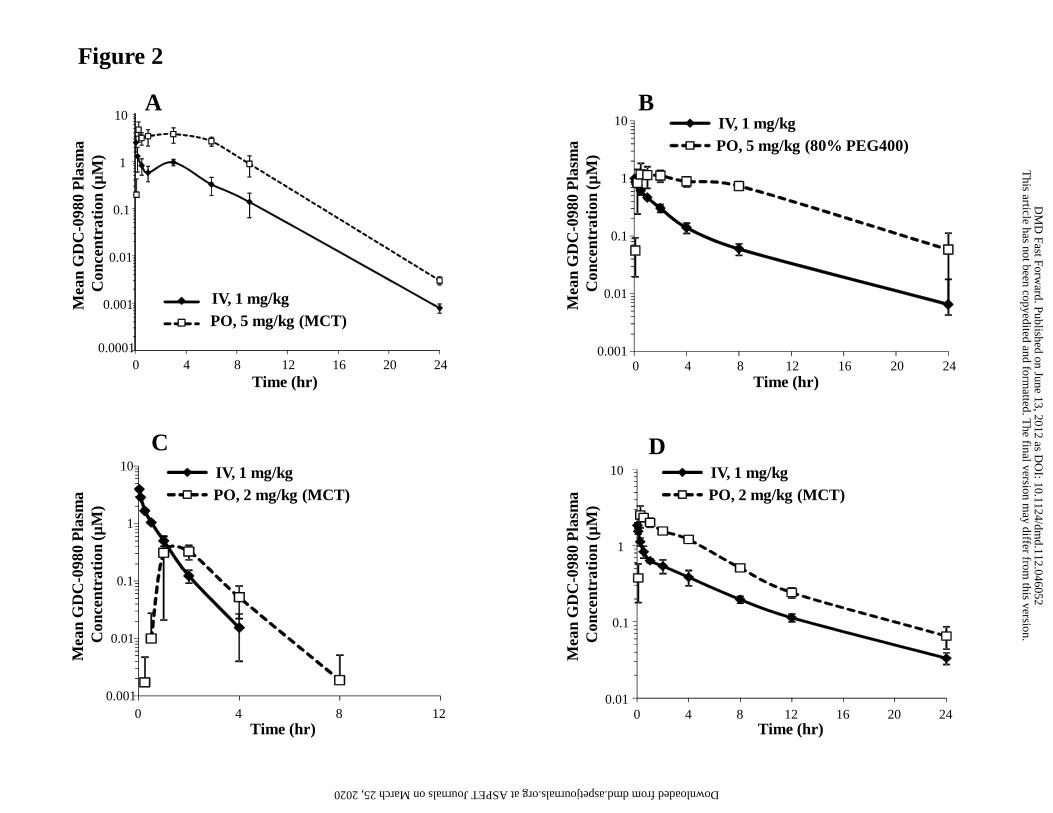
Figure 2
Time (hr)
B
0.001
0.01
0.1
1
10
0 4 8 12 16 20 24
IV, 1 mg/kgPO, 5 mg/kg (80% PEG400)
Mea
n G
DC
-098
0 P
lasm
a C
once
ntra
tion
(µM
)
Time (hr)
C
0.001
0.01
0.1
1
10
0 4 8 12
Mea
n G
DC
-098
0 P
lasm
a C
once
ntra
tion
(µM
)
IV, 1 mg/kgPO, 2 mg/kg (MCT)
Time (hr)
D
0.01
0.1
1
10
0 4 8 12 16 20 24
IV, 1 mg/kgPO, 2 mg/kg (MCT)
Mea
n G
DC
-098
0 P
lasm
a C
once
ntra
tion
(µM
)
Time (hr)
Mea
n G
DC
-098
0 P
lasm
a C
once
ntra
tion
(µM
)A
0.0001
0.001
0.01
0.1
1
10
0 4 8 12 16 20 24
IV, 1 mg/kgPO, 5 mg/kg (MCT)
This article has not been copyedited and form
atted. The final version m
ay differ from this version.
DM
D Fast Forw
ard. Published on June 13, 2012 as DO
I: 10.1124/dmd.112.046052
at ASPET Journals on March 25, 2020 dmd.aspetjournals.org Downloaded from
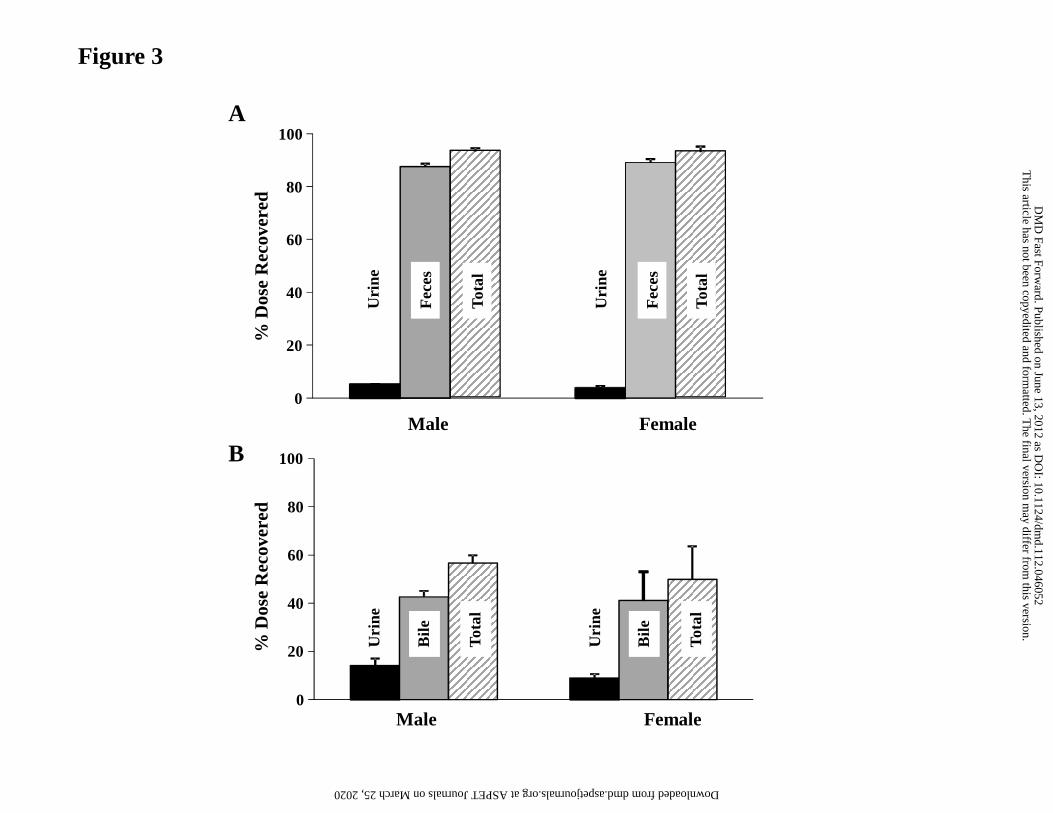
% D
ose
Rec
over
ed%
Dos
e R
ecov
ered
A
B
Figure 3
0
20
40
60
80
100
Fec
es
Tot
al
Uri
ne
Fec
es
Tot
al
Uri
ne
Male Female
0
20
40
60
80
100
Uri
ne
Bile
Tot
al
Uri
ne
Bile
Tot
al
Male Female
This article has not been copyedited and form
atted. The final version m
ay differ from this version.
DM
D Fast Forw
ard. Published on June 13, 2012 as DO
I: 10.1124/dmd.112.046052
at ASPET Journals on March 25, 2020 dmd.aspetjournals.org Downloaded from
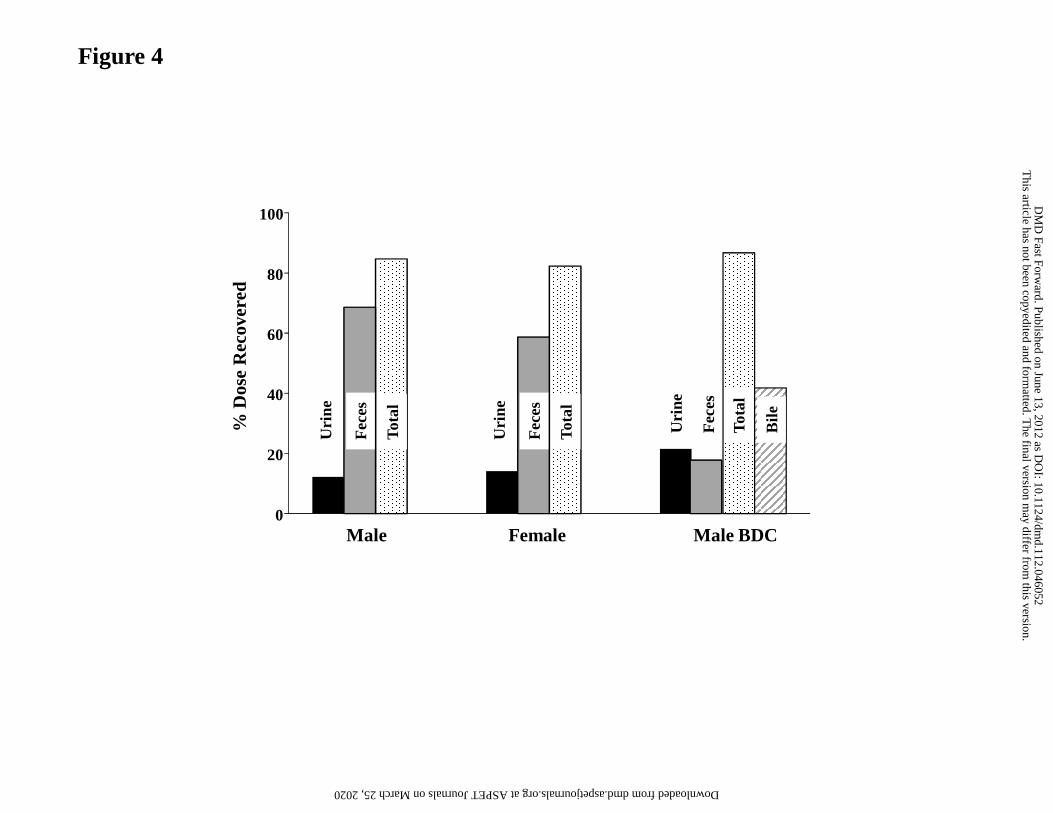
Figure 4
% D
ose
Rec
over
ed
0
20
40
60
80
100
Male Female Male BDC
Fec
es
Tot
al
Uri
ne
Fec
es
Tot
al
Uri
ne
Fec
es
Tot
al
Uri
ne
Bile
This article has not been copyedited and form
atted. The final version m
ay differ from this version.
DM
D Fast Forw
ard. Published on June 13, 2012 as DO
I: 10.1124/dmd.112.046052
at ASPET Journals on March 25, 2020 dmd.aspetjournals.org Downloaded from
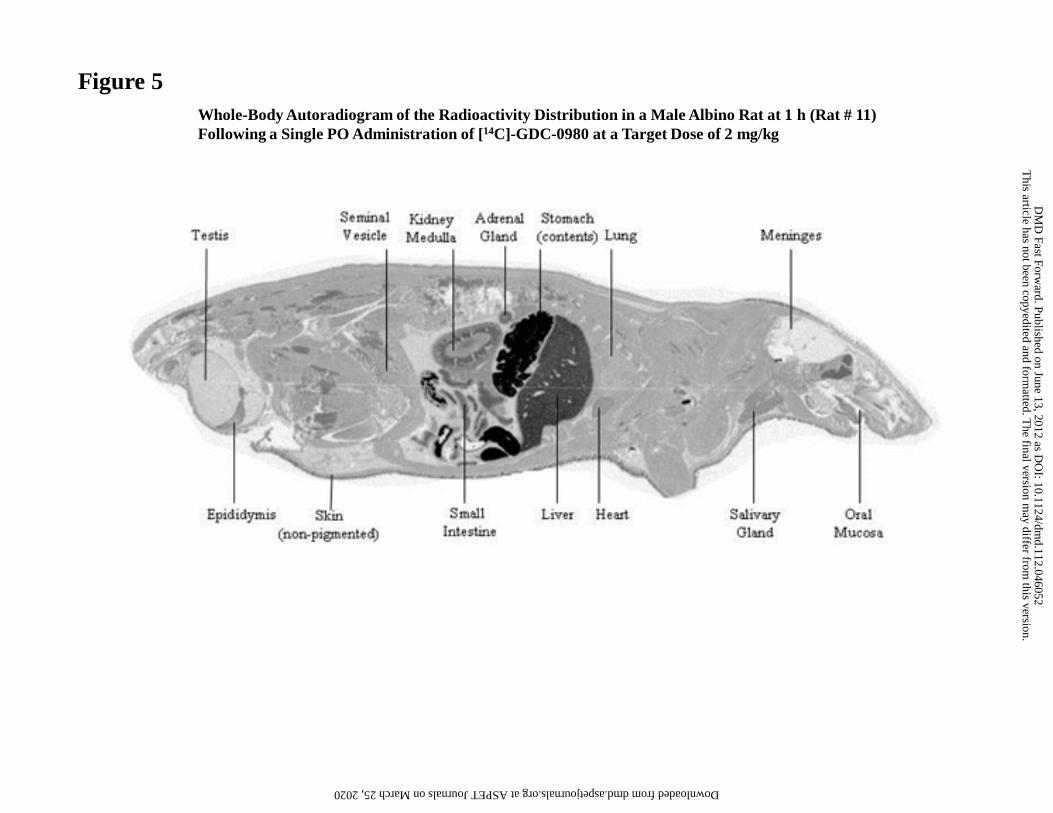
Figure 5Whole-Body Autoradiogram of the Radioactivity Distribution in a Male Albino Rat at 1 h (Rat # 11) Following a Single PO Administration of [14C]-GDC-0980 at a Target Dose of 2 mg/kg
This article has not been copyedited and form
atted. The final version m
ay differ from this version.
DM
D Fast Forw
ard. Published on June 13, 2012 as DO
I: 10.1124/dmd.112.046052
at ASPET Journals on March 25, 2020 dmd.aspetjournals.org Downloaded from
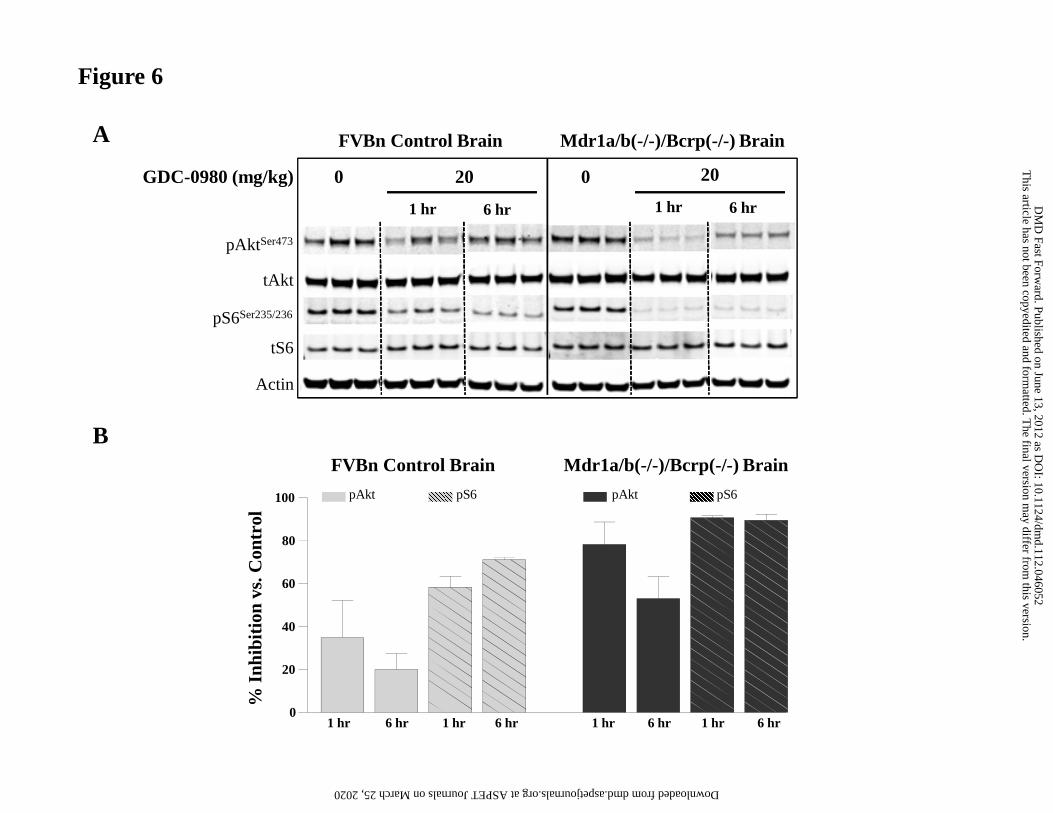
pS6Ser235/236
Actin
tS6
pAktSer473
tAkt
GDC-0980 (mg/kg) 0 20 0
Mdr1a/b(-/-)/Bcrp(-/-) BrainFVBn Control Brain
1 hr 6 hr
20
1 hr 6 hr
A
B
Figure 6
1 hr 6 hr0
20
40
60
80
100
% I
nhib
itio
n vs
. Con
trol
Mdr1a/b(-/-)/Bcrp(-/-) BrainFVBn Control Brain
pAkt pS6pAktpS6
1 hr 6 hr 1 hr 6 hr 1 hr 6 hr
This article has not been copyedited and form
atted. The final version m
ay differ from this version.
DM
D Fast Forw
ard. Published on June 13, 2012 as DO
I: 10.1124/dmd.112.046052
at ASPET Journals on March 25, 2020 dmd.aspetjournals.org Downloaded from
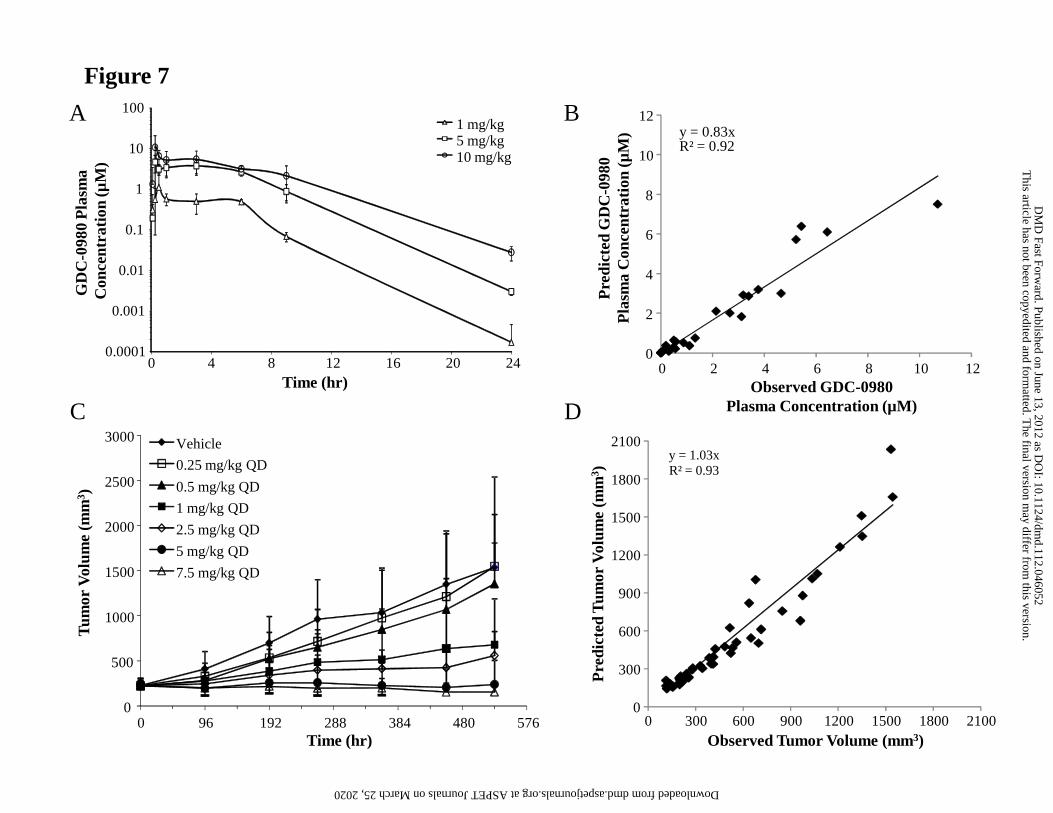
y = 1.03xR² = 0.93
Observed Tumor Volume (mm3)
Pre
dict
ed T
umor
Vol
ume
(mm
3 )
0
300
600
900
1200
1500
1800
2100
0 300 600 900 1200 1500 1800 2100
A B
Figure 7
0
500
1000
1500
2000
2500
3000
0 96 192 288 384 480 576Time (hr)
Vehicle
0.25 mg/kg QD
0.5 mg/kg QD
1 mg/kg QD
2.5 mg/kg QD
5 mg/kg QD
7.5 mg/kg QD
Tum
or V
olum
e (m
m3 )
y = 0.83xR² = 0.92
0
2
4
6
8
10
12
0 2 4 6 8 10 12Observed GDC-0980
Plasma Concentration (µM)
Pre
dict
ed G
DC
-098
0P
lasm
a C
once
ntra
tion
(µM
)
0.0001
0.001
0.01
0.1
1
10
100
0 4 8 12 16 20 24
1 mg/kg5 mg/kg10 mg/kg
Time (hr)
GD
C-0
980
Pla
sma
Con
cent
rati
on (µ
M)
C D
This article has not been copyedited and form
atted. The final version m
ay differ from this version.
DM
D Fast Forw
ard. Published on June 13, 2012 as DO
I: 10.1124/dmd.112.046052
at ASPET Journals on March 25, 2020 dmd.aspetjournals.org Downloaded from
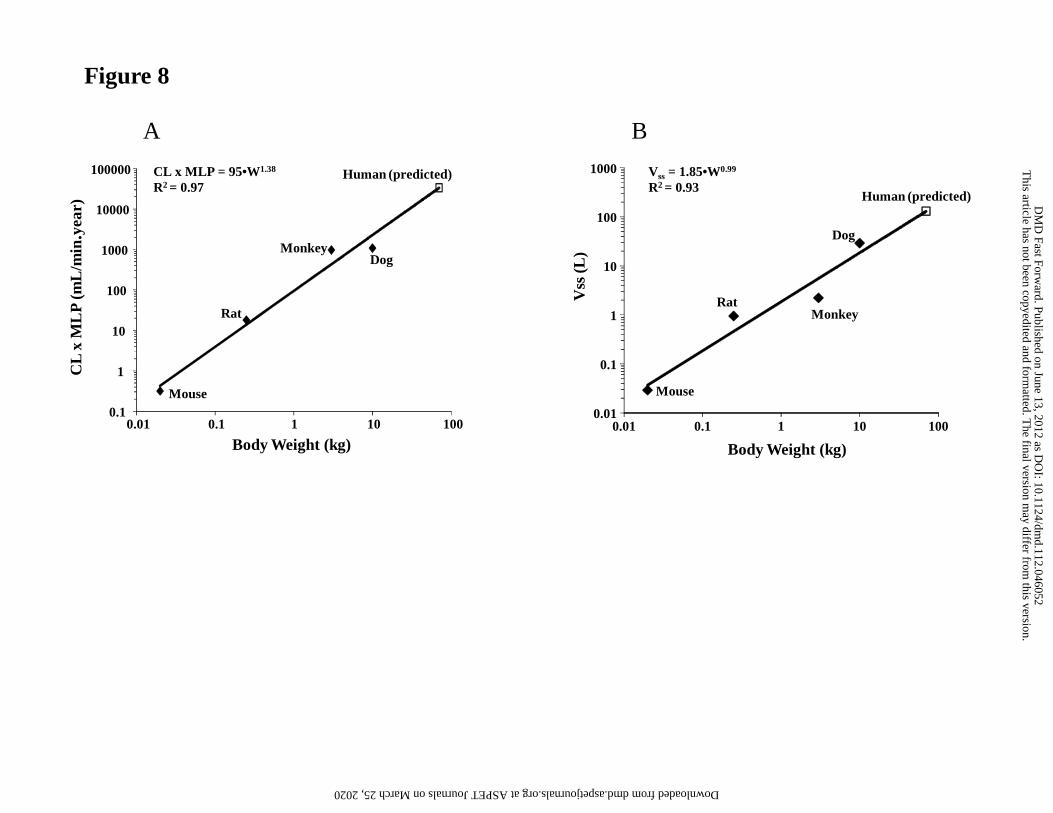
Figure 8
A B
Body Weight (kg)
Vss
(L)
Vss = 1.85•W0.99
R2 = 0.93
CL
x M
LP
(mL
/min
.yea
r)
Body Weight (kg)
CL x MLP = 95•W1.38
R2 = 0.97
0.1
1
10
100
1000
10000
100000
0.01 0.1 1 10 100
DogMonkey
Rat
Mouse
Human (predicted)
0.01
0.1
1
10
100
1000
0.01 0.1 1 10 100
Human (predicted)
Dog
MonkeyRat
Mouse
This article has not been copyedited and form
atted. The final version m
ay differ from this version.
DM
D Fast Forw
ard. Published on June 13, 2012 as DO
I: 10.1124/dmd.112.046052
at ASPET Journals on March 25, 2020 dmd.aspetjournals.org Downloaded from

Figure 9
Time (hr)
GD
C-0
980
Pla
sma
Con
cent
rati
on (µ
M)
0.0001
0.001
0.01
0.1
1
10
0 4 8 12 16 20 24
Mean concentration (n=3 patients; 2 mg)
GastroPlus Simulation (2 mg)
GastroPlus Simulation (55 mg)
This article has not been copyedited and form
atted. The final version m
ay differ from this version.
DM
D Fast Forw
ard. Published on June 13, 2012 as DO
I: 10.1124/dmd.112.046052
at ASPET Journals on March 25, 2020 dmd.aspetjournals.org Downloaded from