preconditioning seismic data with 5d interpolation for ... · pdf filepreconditioning seismic...
TRANSCRIPT
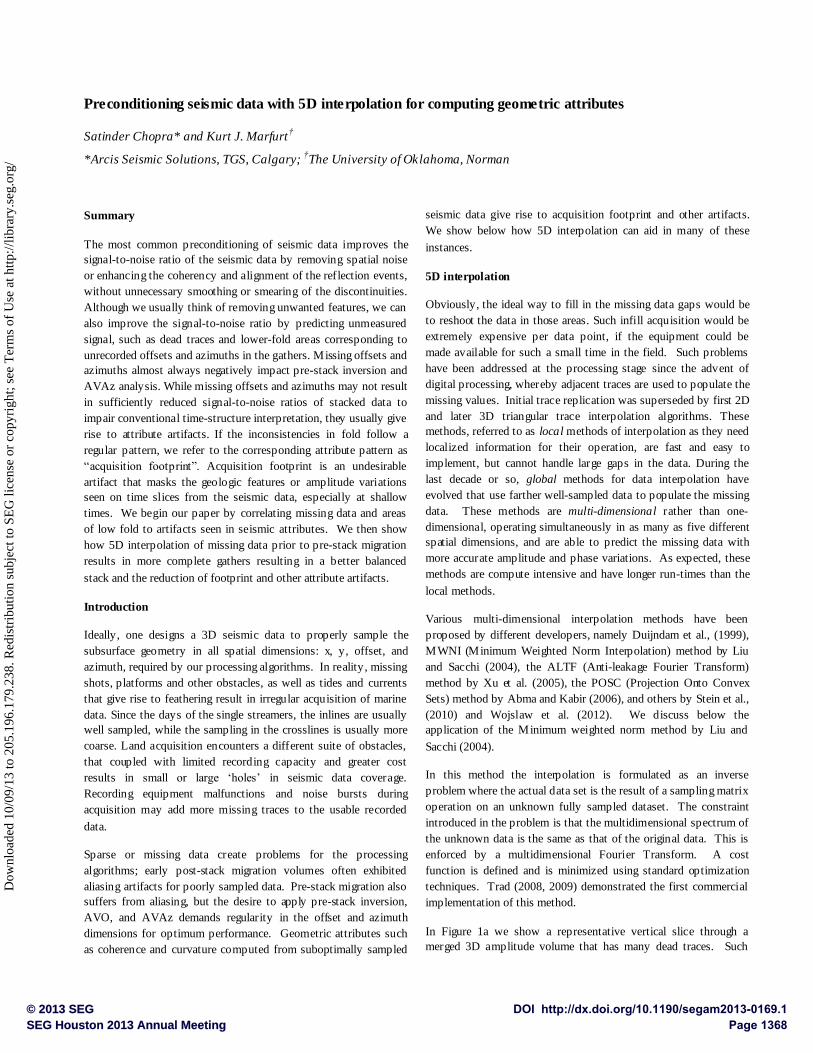
Preconditioning seismic data with 5D interpolation for computing geometric attributes
Satinder Chopra* and Kurt J. Marfurt†
*Arcis Seismic Solutions, TGS, Calgary; †The University of Oklahoma, Norman
Summary
The most common preconditioning of seismic data improves the
signal-to-noise ratio of the seismic data by removing spatial noise
or enhancing the coherency and alignment of the reflection events,
without unnecessary smoothing or smearing of the discontinuities.
Although we usually think of removing unwanted features, we can
also improve the signal-to-noise ratio by predicting unmeasured
signal, such as dead traces and lower-fold areas corresponding to
unrecorded offsets and azimuths in the gathers. Missing offsets and
azimuths almost always negatively impact pre-stack inversion and
AVAz analysis. While missing offsets and azimuths may not result
in sufficiently reduced signal-to-noise ratios of stacked data to
impair conventional time-structure interpretation, they usually give
rise to attribute artifacts. If the inconsistencies in fold follow a
regular pattern, we refer to the corresponding attribute pattern as
“acquisition footprint”. Acquisition footprint is an undesirable
artifact that masks the geologic features or amplitude variations
seen on time slices from the seismic data, especially at shallow
times. We begin our paper by correlating missing data and areas
of low fold to artifacts seen in seismic attributes. We then show
how 5D interpolation of missing data prior to pre-stack migration
results in more complete gathers resulting in a better balanced
stack and the reduction of footprint and other attribute artifacts.
Introduction
Ideally, one designs a 3D seismic data to properly sample the
subsurface geometry in all spatial dimensions: x, y, offset, and
azimuth, required by our processing algorithms. In reality, missing
shots, platforms and other obstacles, as well as tides and currents
that give rise to feathering result in irregular acquisition of marine
data. Since the days of the single streamers, the inlines are usually
well sampled, while the sampling in the crosslines is usually more
coarse. Land acquisition encounters a different suite of obstacles,
that coupled with limited recording capacity and greater cost
results in small or large ‘holes’ in seismic data coverage.
Recording equipment malfunctions and noise bursts during
acquisition may add more missing traces to the usable recorded
data.
Sparse or missing data create problems for the processing
algorithms; early post-stack migration volumes often exhibited
aliasing artifacts for poorly sampled data. Pre-stack migration also
suffers from aliasing, but the desire to apply pre-stack inversion,
AVO, and AVAz demands regularity in the offset and azimuth
dimensions for optimum performance. Geometric attributes such
as coherence and curvature computed from suboptimally sampled
seismic data give rise to acquisition footprint and other artifacts.
We show below how 5D interpolation can aid in many of these
instances.
5D interpolation
Obviously, the ideal way to fill in the missing data gaps would be
to reshoot the data in those areas. Such infill acquisition would be
extremely expensive per data point, if the equipment could be
made available for such a small time in the field. Such problems
have been addressed at the processing stage since the advent of
digital processing, whereby adjacent traces are used to populate the
missing values. Initial trace replication was superseded by first 2D
and later 3D triangular trace interpolation algorithms. These
methods, referred to as local methods of interpolation as they need
localized information for their operation, are fast and easy to
implement, but cannot handle large gaps in the data. During the
last decade or so, global methods for data interpolation have
evolved that use farther well-sampled data to populate the missing
data. These methods are multi-dimensional rather than one-
dimensional, operating simultaneously in as many as five different
spatial dimensions, and are able to predict the missing data with
more accurate amplitude and phase variations. As expected, these
methods are compute intensive and have longer run-times than the
local methods.
Various multi-dimensional interpolation methods have been
proposed by different developers, namely Duijndam et al., (1999),
MWNI (Minimum Weighted Norm Interpolation) method by Liu
and Sacchi (2004), the ALTF (Anti-leakage Fourier Transform)
method by Xu et al. (2005), the POSC (Projection Onto Convex
Sets) method by Abma and Kabir (2006), and others by Stein et al.,
(2010) and Wojslaw et al. (2012). We discuss below the
application of the Minimum weighted norm method by Liu and
Sacchi (2004).
In this method the interpolation is formulated as an inverse
problem where the actual data set is the result of a sampling matrix
operation on an unknown fully sampled dataset. The constraint
introduced in the problem is that the multidimensional spectrum of
the unknown data is the same as that of the original data. This is
enforced by a multidimensional Fourier Transform. A cost
function is defined and is minimized using standard optimization
techniques. Trad (2008, 2009) demonstrated the first commercial
implementation of this method.
In Figure 1a we show a representative vertical slice through a
merged 3D amplitude volume that has many dead traces. Such
DOI http://dx.doi.org/10.1190/segam2013-0169.1© 2013 SEGSEG Houston 2013 Annual Meeting Page 1368
Dow
nloa
ded
10/0
9/13
to 2
05.1
96.1
79.2
38. R
edis
trib
utio
n su
bjec
t to
SEG
lice
nse
or c
opyr
ight
; see
Ter
ms
of U
se a
t http
://lib
rary
.seg
.org
/
Preconditioning seismic data with 5D interpolation for computing geometric attributes
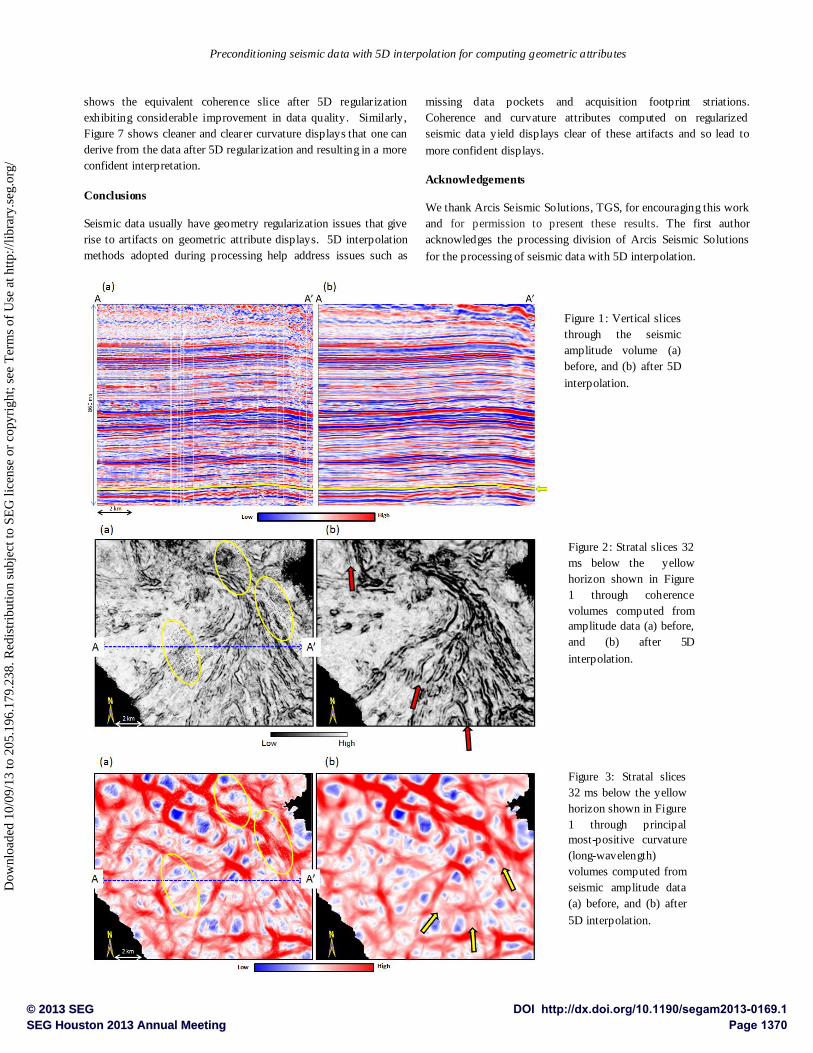
dead traces are seen on other inlines as well. The location of this
inline is shown in Figure 2a, where we show a strat -slice through
the corresponding coherence volume. The dead traces result in the
speckled pattern indicated with yellow ellipses. To regularize the
data, 5D interpolation was run on the seismic data prior to
migration with the equivalent displays shown in Figures 1b and 2b
respectively. Notice in Figure 1b, that not only are the missing
traces interpolated, but the overall signal-to-noise ratio and
reflector continuity is improved. Similarly, note the absence of the
speckles associated with the missing traces and the greater
continuity of the distributary system as indicated by the red arrows,
although in Figure 2b it appears to be slightly wider than those in
Figure 1b indicating slightly less lateral resolution, consistent with
an interpolation method.
Whereas coherence attributes measure waveform discontinuities
associated with fault offset and channel edges, curvature measures
folds, flexures, and differential compaction. In Figure 3 we show a
comparison of the principal most-positive curvature (long-
wavelength) on the input data and then the same data with 5D
interpolation. Missing traces give rise to inaccurate estimates of
structural dip which is input to volumetric curvature computations.
Ellipses indicate the effect of dead traces on volumetric curvature
in Figure 3a. Note the more continuous, better focused lineaments
seen on curvature computed from the 5D-interpolated volume in
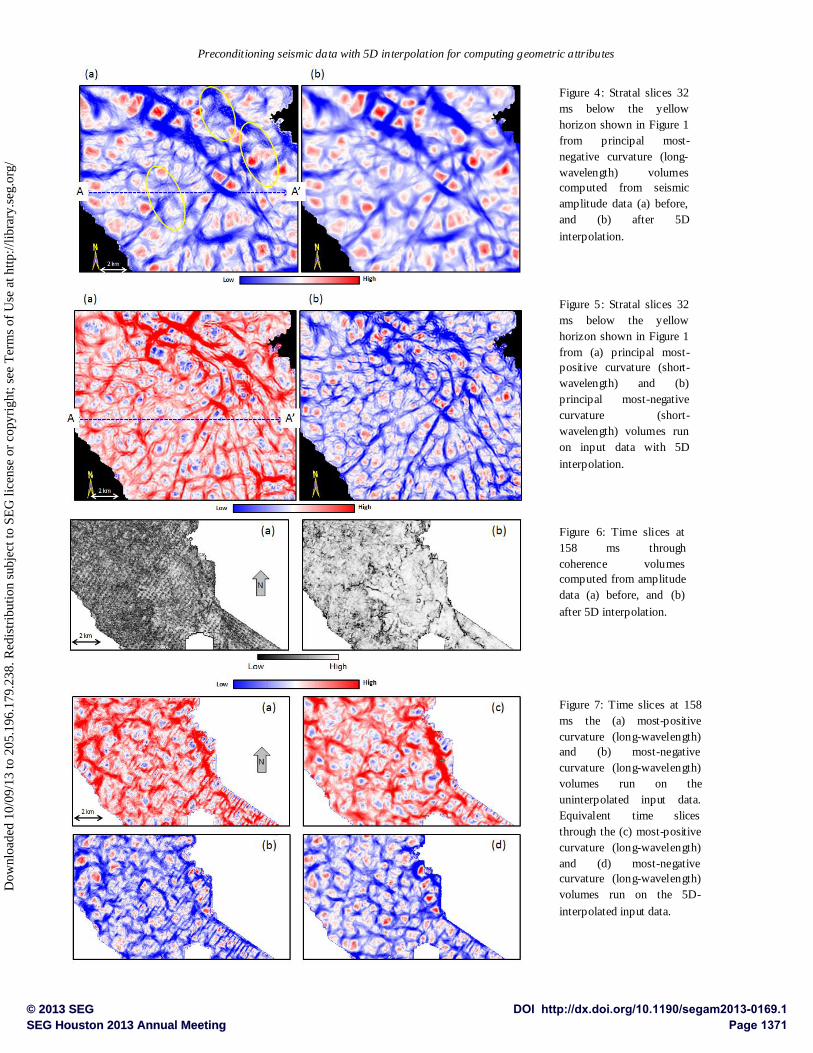
Figure 3b. Figure 4 shows a similar comparison is shown for the
principal most-negative curvature (long-wavelength). As with
Figure 2, we do however notice slightly less lateral resolution of
the attributes computed from the 5D-interpolated data, indicated by
yellow arrows in Figure 3b.
The inference we draw from this exercise is that regularization by
5D interpretation yields better focused but less well-defined
images. To improve the lateral resolution, we suggest the use of
short wavelength version of the principal curvature as shown in
Figure 5. Interpretation carried out on such attributes will
definitely be more accurate than the one carried out on data
without regularization.
Acquisition footprint is also seen suppressed on attributes run on
regularized data. In Figure 6b, notice the footprint pattern is
suppressed significantly yielding cleaner displays.
Acquisition footprint suppression
Acquisition footprint is a term we use to define linear spatial grid
patterns seen on 3D seismic time slices. These patterns are
commonly seen on shallow time slices or horizon amplitude maps
as striations masking the actual amplitude anomalies under
consideration for stratigraphic interpretation, AVO analysis, and
reservoir attribute studies (Marfurt et al., 1998). An acquisition
footprint may be present due to various reasons, but two general
types of footprint can be distinguished: those depending on the
details of the acquisition geometry, and those arising from signal
processing problems (Drummond et al., 2000). The choice of any
acquisition design is characterized by a particular distribution of
fold, offset, and azimuth. Apart from some variation in the taper
zone, the fold for most common geometries should be uniform for
all seismic bins. However, the offset and azimuth distribution can
vary from bin to bin, or can be uniform in the inline direction and
irregular in the cross-line direction. Such variations can lead to
undesirable effects on the reflected signal. Deviations from a
regular geometry pattern, such as inaccessible patches within a 3D
survey area that are under human habitation or the location of a
power station, can be responsible for such variation.
Very often economic considerations compel coarse sampling in 3D
data acquisition, which can cause artifacts during processing.
Coarse spatial sampling leads to aliasing, and aliased steeply
dipping noise resulting from ground roll or multiples, for example,
creates artifacts. Aliased noise can be accentuated during
processing and leak into the stack volumes as spatially periodic
events, forming an acquisition footprint. Other processes that tend
to accentuate footprints are residual NMO caused by incorrect
velocities, systematic errors in computed offsets, or amplitude
variations caused by inadequate 3D DMO formulation (Walker et
al., 1995; Budd et al., 1995), 3D pre-stack migration, signal
enhancements based on f-x-y random noise attenuation, and
coherency filtering (Moldoveanu et al., 1999).
An acquisition footprint, whether resulting from acquisition design
or accentuation during processing, is a nuisance for the interpreter.
Efforts are sometimes made to prevent accentuation of the
footprint during processing, usually by adopting interpolation or
extrapolation to remedy the ‘sparseness’ of the input data volumes
before applying multi-channel processes. If interpolation is
computationally prohibitive, we can resort to trace mixing, which
tends to minimize the footprint effect at the risk of reducing lateral
resolution. Gulunay (1999) found that wavenumber domain
filtering based on the acquisition design often works. A similar
filtering method for non-orthogonal geometries has been suggested
by Soubras (2001).
Chopra and Larsen (2000) suggested a similar way of dealing with
the acquisition footprint, which is to analyze the footprint -
contaminated post-stack migrated data, time slice by time slice, in
the kx-ky wavenumber domain. Apart from kx-ky filtering, spatially
adaptive methods using wavelet transforms have been suggested
for highly irregular footprint (Jervis, 2006; Cvetkovic et al., 2007).
Al-Bannagi et al. (2005) proposed a method using principal
component analysis. By animating through the seismic as well as
the corresponding coherence slices, the interpreter can define the
change in footprint with depth.
As 5D interpolation discussed above regularizes the geometry of
the seismic data, it addresses the root cause of the footprint arising
due to the acquisition irregularities. In Figure 6 we show time
slices at 158 ms where the acquisition footprint appears
prominently on the coherence attribute as striations in the NE-SW
direction masking the reflection detail behind them. Figure 6b
DOI http://dx.doi.org/10.1190/segam2013-0169.1© 2013 SEGSEG Houston 2013 Annual Meeting Page 1369
Dow
nloa
ded
10/0
9/13
to 2
05.1
96.1
79.2
38. R
edis
trib
utio
n su
bjec
t to
SEG
lice
nse
or c
opyr
ight
; see
Ter
ms
of U
se a
t http
://lib
rary
.seg
.org
/
Preconditioning seismic data with 5D interpolation for computing geometric attributes
shows the equivalent coherence slice after 5D regularization
exhibiting considerable improvement in data quality. Similarly,
Figure 7 shows cleaner and clearer curvature displays that one can
derive from the data after 5D regularization and resulting in a more
confident interpretation.
Conclusions
Seismic data usually have geometry regularization issues that give
rise to artifacts on geometric attribute displays. 5D interpolation
methods adopted during processing help address issues such as
missing data pockets and acquisition footprint striations.
Coherence and curvature attributes computed on regularized
seismic data yield displays clear of these artifacts and so lead to
more confident displays.
Acknowledgements
We thank Arcis Seismic Solutions, TGS, for encouraging this work
and for permission to present these results. The first author
acknowledges the processing division of Arcis Seismic Solutions
for the processing of seismic data with 5D interpolation.
Figure 1: Vertical slices
through the seismic
amplitude volume (a)
before, and (b) after 5D
interpolation.
Figure 3: Stratal slices
32 ms below the yellow
horizon shown in Figure
1 through principal
most-positive curvature
(long-wavelength)
volumes computed from
seismic amplitude data
(a) before, and (b) after
5D interpolation.
Figure 2: Stratal slices 32
ms below the yellow
horizon shown in Figure
1 through coherence
volumes computed from
amplitude data (a) before,
and (b) after 5D
interpolation.
DOI http://dx.doi.org/10.1190/segam2013-0169.1© 2013 SEGSEG Houston 2013 Annual Meeting Page 1370
Dow
nloa
ded
10/0
9/13
to 2
05.1
96.1
79.2
38. R
edis
trib
utio
n su
bjec
t to
SEG
lice
nse
or c
opyr
ight
; see
Ter
ms
of U
se a
t http
://lib
rary
.seg
.org
/
Preconditioning seismic data with 5D interpolation for computing geometric attributes
Figure 4: Stratal slices 32
ms below the yellow
horizon shown in Figure 1
from principal most-
negative curvature (long-
wavelength) volumes
computed from seismic
amplitude data (a) before,
and (b) after 5D
interpolation.
Figure 5: Stratal slices 32
ms below the yellow
horizon shown in Figure 1
from (a) principal most-
positive curvature (short-
wavelength) and (b)
principal most-negative
curvature (short-
wavelength) volumes run
on input data with 5D
interpolation.
Figure 6: Time slices at
158 ms through
coherence volumes
computed from amplitude
data (a) before, and (b)
after 5D interpolation.
Figure 7: Time slices at 158
ms the (a) most-positive
curvature (long-wavelength)
and (b) most-negative
curvature (long-wavelength)
volumes run on the
uninterpolated input data.
Equivalent time slices
through the (c) most-positive
curvature (long-wavelength)
and (d) most-negative
curvature (long-wavelength)
volumes run on the 5D-
interpolated input data.
DOI http://dx.doi.org/10.1190/segam2013-0169.1© 2013 SEGSEG Houston 2013 Annual Meeting Page 1371
Dow
nloa
ded
10/0
9/13
to 2
05.1
96.1
79.2
38. R
edis
trib
utio
n su
bjec
t to
SEG
lice
nse
or c
opyr
ight
; see
Ter
ms
of U
se a
t http
://lib
rary
.seg
.org
/
http://dx.doi.org/10.1190/segam2013-0169.1 EDITED REFERENCES Note: This reference list is a copy-edited version of the reference list submitted by the author. Reference lists for the 2013 SEG Technical Program Expanded Abstracts have been copy edited so that references provided with the online metadata for each paper will achieve a high degree of linking to cited sources that appear on the Web. REFERENCES
Abma, R., and N. Kabir, 2006, 3D interpolation of irregular data with a POCS algorithm: Geophysics, 71, no. 6, E91–E97, http://dx.doi.org/10.1190/1.2356088.
Al-Bannagi, M., K. Fang, P. G. Kelamis, and G. S. Douglass, 2005, Acquisition footprint suppression via the truncated SVD technique: case studies from Saudi Arabia : The Leading Edge, 24, 832–834, http://dx.doi.org/10.1190/1.2032259.
Budd, A. J. L., K. Hawkins, A. R. Mackewn, and J. W. Ryan, 1995, Marine geometry for optimum 3D seismic imaging: 57th EAGE Conference and Exhibition, Extended Abstracts, B030.
Chopra, S., and G. Larsen, 2000, Acquisition footprint — its detection and removal: CSEG Recorder, 25, no. 8, 16–20.
Cvetkovic , M., S. Falconer, K. J. Marfurt, and S. C. Perez, 2007, 2D stationary wavelet-based acquisition footprint suppression: 77th Annual International Meeting, SEG, Expanded Abstracts, 2590–2593.
Drummond, J. M., A. J. L. Budd, and J. W. Ryan, 2000, Adapting to noisy 3D data – attenuating the acquisition footprint: 70th Annual International Meeting, SEG, Expanded Abstracts, 9–12.
Duijndam, A. J. W., M. A. Schonewille , and C. O. H. Hindriks, 1999, Reconstruction of band-limited signals, irregularly sampled along one spatial direction: Geophysics, 64, 524–538, http://dx.doi.org/10.1190/1.1444559.
Gulunay, N., 1999, Acquisition geometry footprints removal: 69th Annual International Meeting, SEG, Expanded Abstracts, 637–640.
Jervis, M., 2006, Edge preserving filtering on 3D seismic data using complex wavelet transforms: 76th Annual International Meeting, SEG, Expanded Abstracts, 2872–2876.
Liu, B., and M. Sacchi, 2004, Minimum weighted norm interpolation of seismic records: Geophysics, 69, 1560–1568, http://dx.doi.org/10.1190/1.1836829.
Moldoveanu, N., S. Ronen, and S. Mitchell, 1999, Footprint analysis of land and TZ acquisition geometries using synthetic data: 69th Annual International Meeting, SEG, Expanded Abstracts, 641–644.
Soubaras, R., 2002, Attenuation of acquisition footprint for nonorthogonal 3D geometries: 72nd Annual International Meeting, SEG, Expanded Abstracts, 2142–2145.
Stein, J. S., S. Boyer, K. Hellman, and J. Weigant, 2010, Application of POCS interpolation to exploration: 80th Annual International Meeting, SEG, Expanded Abstracts, 2013–2016.
Trad, D., 2008, Five-dimensional seismic data interpolation: 78th Annual International Meeting, SEG, Expanded Abstracts, 978–982.
Trad, D., 2009, Five-dimensional seismic data interpolation: CSEG/CSPG/CWLS Convention, Expanded Abstracts, 689–692.
DOI http://dx.doi.org/10.1190/segam2013-0169.1© 2013 SEGSEG Houston 2013 Annual Meeting Page 1372
Dow
nloa
ded
10/0
9/13
to 2
05.1
96.1
79.2
38. R
edis
trib
utio
n su
bjec
t to
SEG
lice
nse
or c
opyr
ight
; see
Ter
ms
of U
se a
t http
://lib
rary
.seg
.org
/

Walker, C. D. T., A. R. Mackewn, A. J. L. Budd, and J. W. Ryan, 1995, Marine 3D geometry design for optimum acquis ition system response: 57th EAGE Conference and Exhibition, Extended Abstracts, B029.
Wojslaw, R., J. A. Stein, and T. Langston, 2012, 5D semblance-based interpolator in exploration-theory and practice: 74th EAGE Conference and Exhibition, Extended Abstracts, B024.
Xu, S., Y. Zhang, and G. Lambare, 2005, Recovering densely and regularly sampled 5D seismic data for current land acquisition: 67th EAGE Conference and Exhibition, Extended Abstracts, W024.
DOI http://dx.doi.org/10.1190/segam2013-0169.1© 2013 SEGSEG Houston 2013 Annual Meeting Page 1373
Dow
nloa
ded
10/0
9/13
to 2
05.1
96.1
79.2
38. R
edis
trib
utio
n su
bjec
t to
SEG
lice
nse
or c
opyr
ight
; see
Ter
ms
of U
se a
t http
://lib
rary
.seg
.org
/